International and NASA solar scientists find their Total Solar Irradiance reconstruction extending to 1700 can “correlate well” with Earth’s global temperature records, including a positive net TSI trend during 1986-2008. A new Grand Solar Minimum is expected to commence during the 2030s.
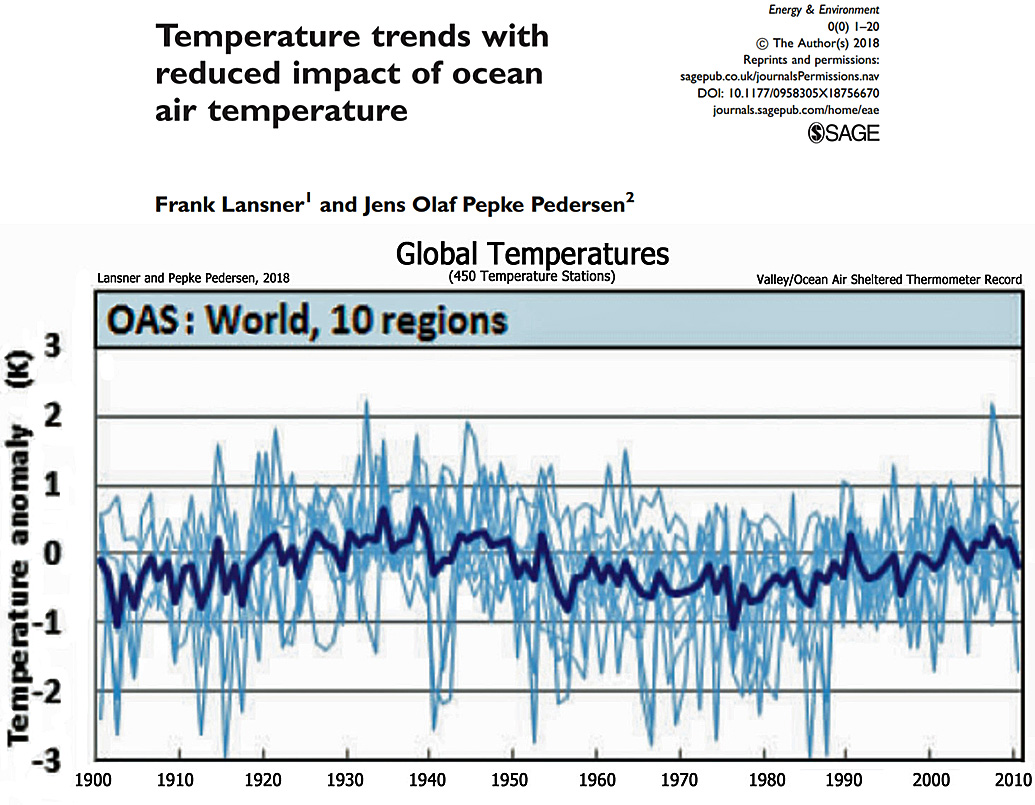
Surface climate records that have been uncorrupted by coastal (ocean-air)/urbanization biases suggest there has been a long-term oscillation in temperature since 1900, with peaks during the 1920s-1940s and again during recent decades (Lansner and Pepke Pedersen, 2018).
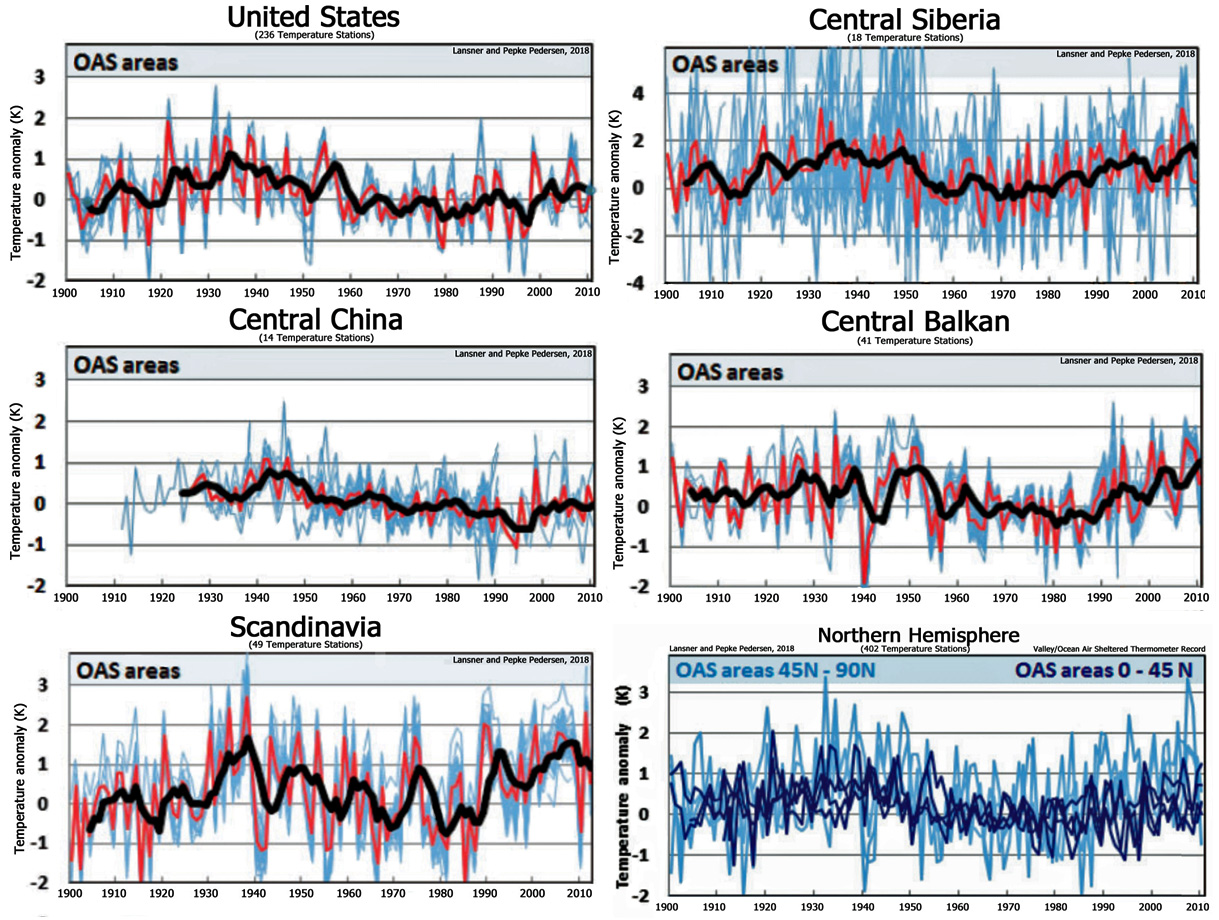
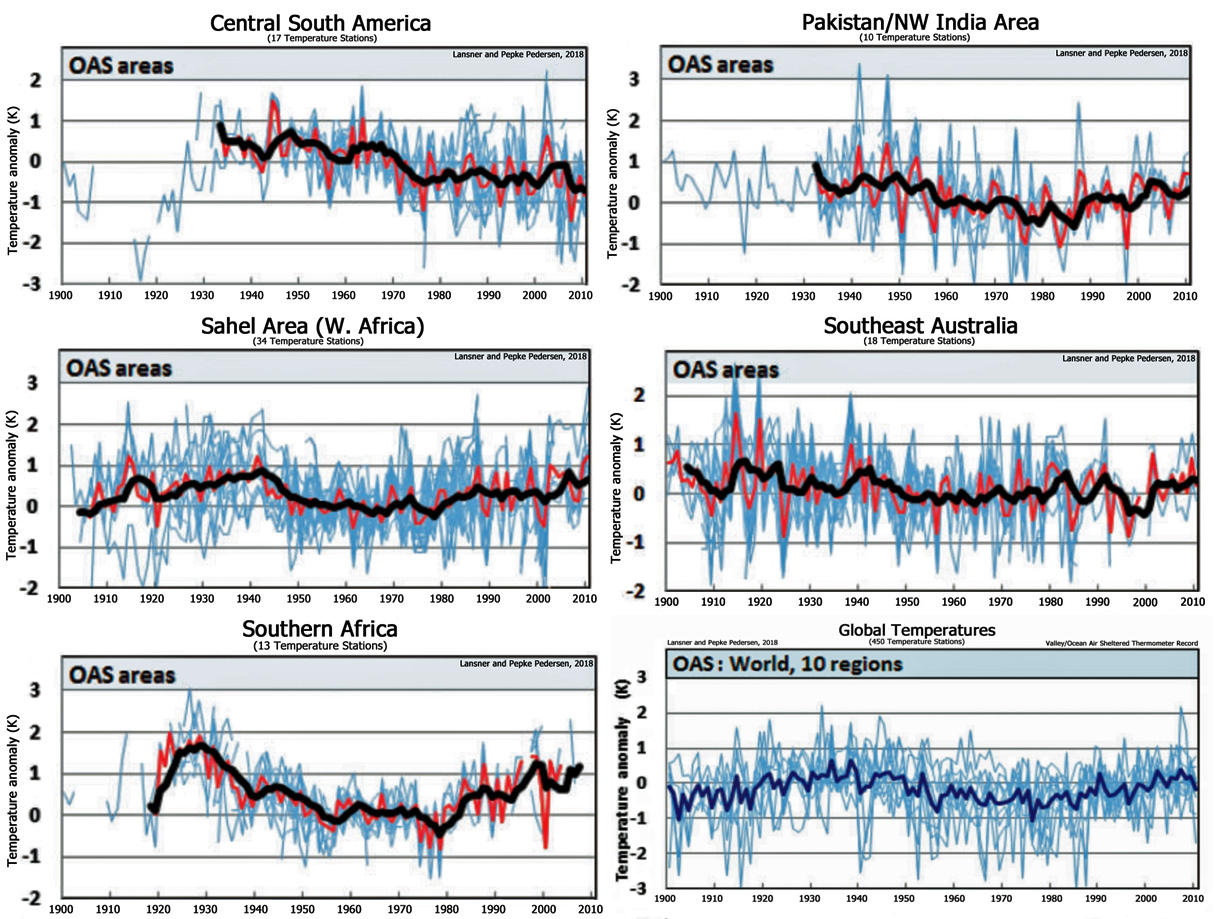
Image Source: Lansner and Pepke Pedersen, 2018
An analysis by Soon et al. (2015) (full paper) indicated Northern Hemisphere surface temperatures from rural locations (unaffected by artificial urban heat) aligned well with trends in solar activity since the 19th century. However, models of greenhouse gas forcing did not correlate well with the long-term hemispheric record.
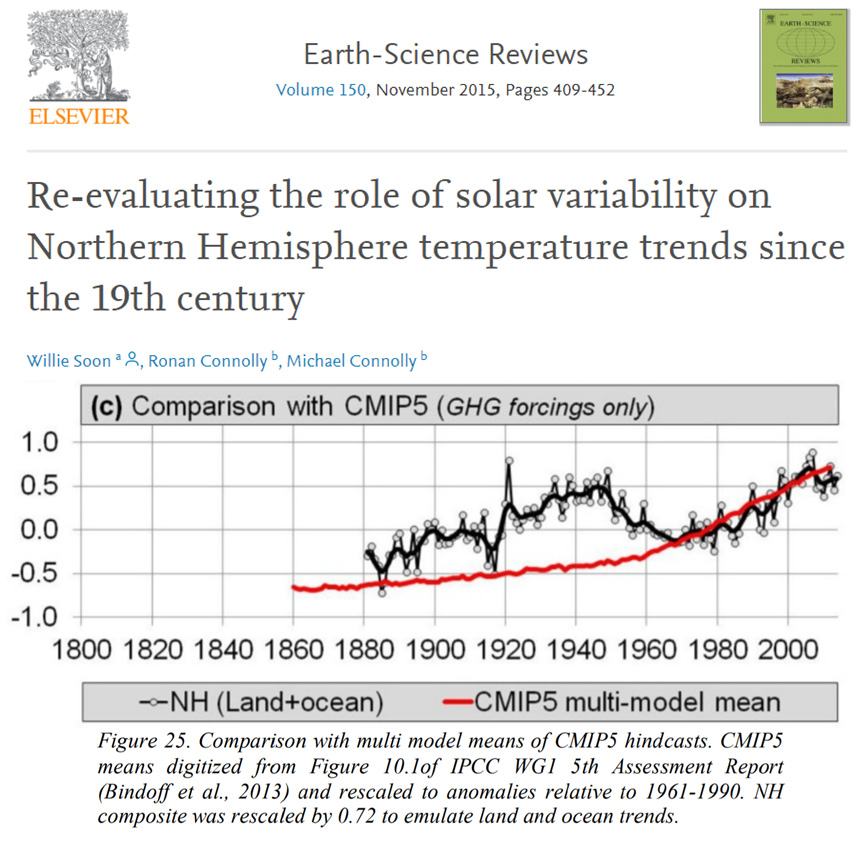
Image Source: Soon et al. (2015)
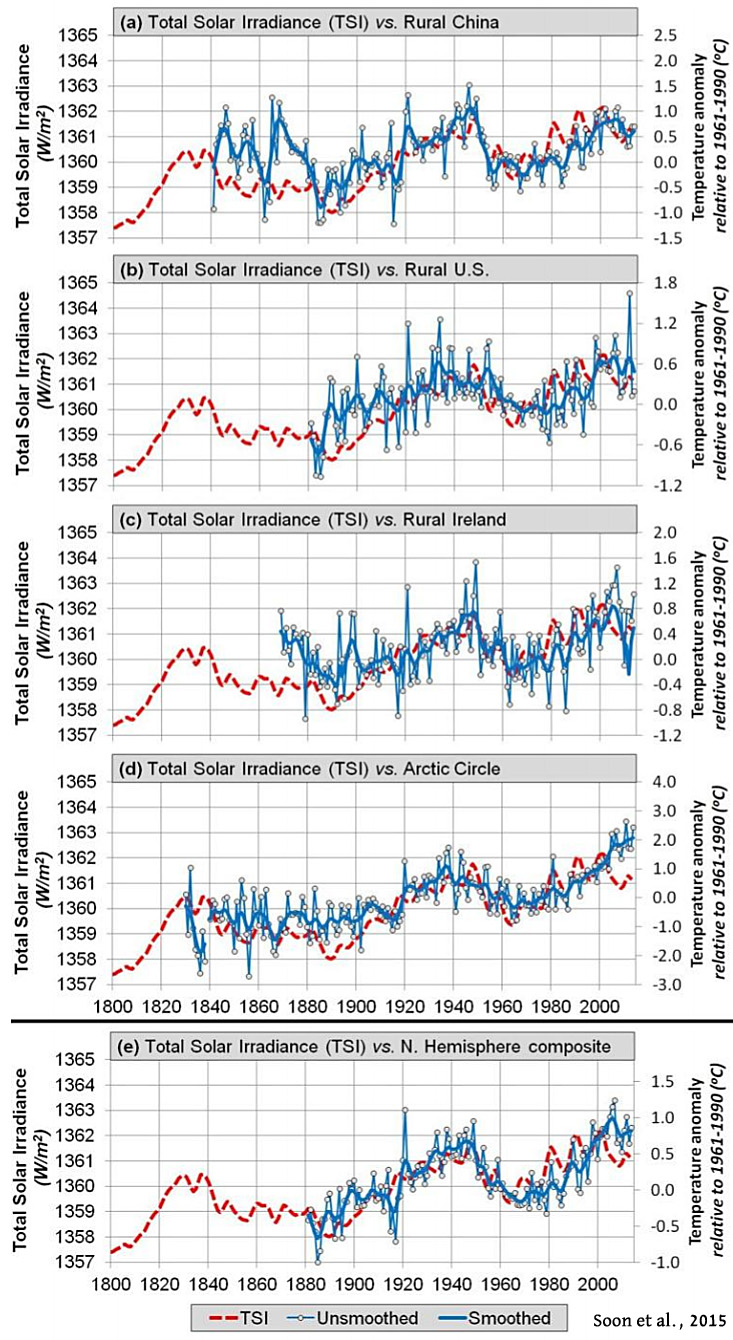
Image Source: Soon et al. (2015)
A new paper (Scafetta et al., 2019) also finds the global temperature record aligns well with trends in TSI when using the observation-based ACRIM satellite data rather than the model-based (and IPCC-preferred) PMOD data for trends in recent decades.
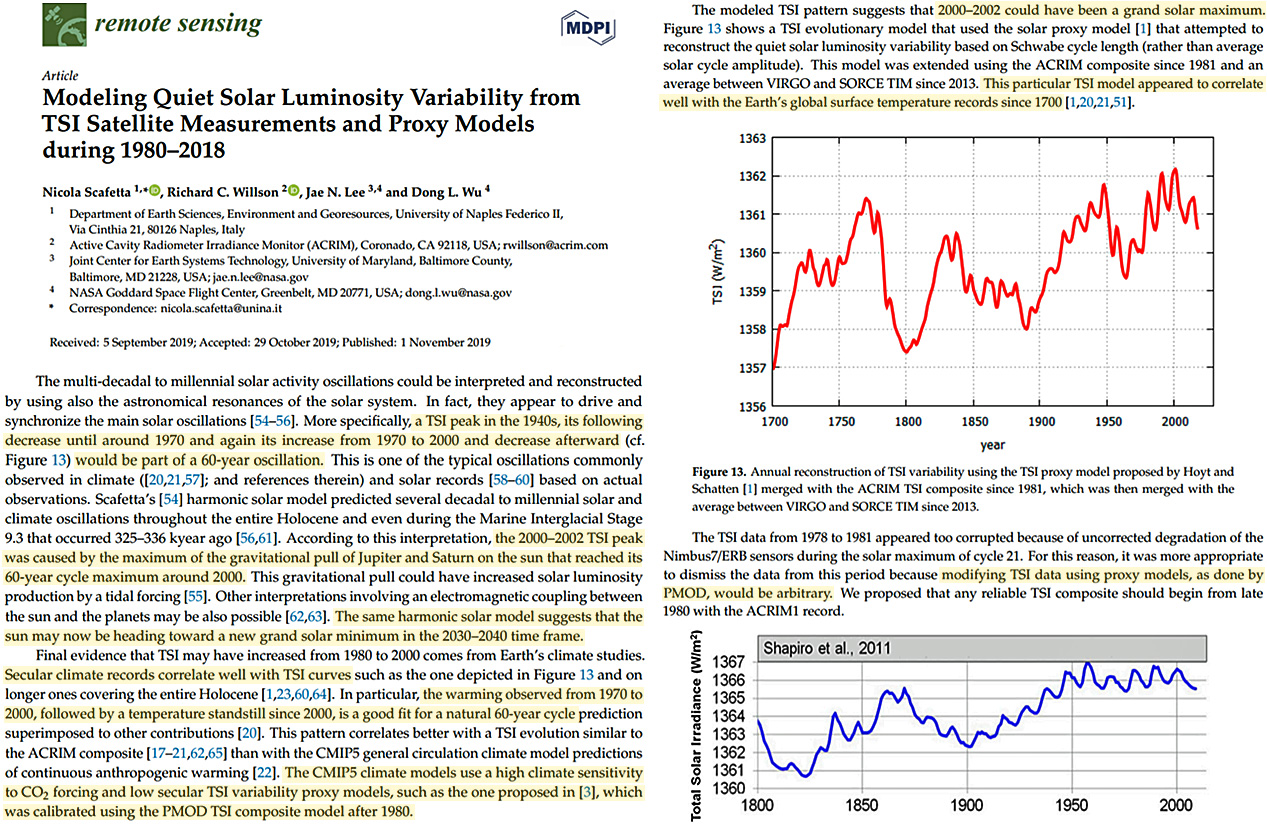
Image Source: Scafetta et al., 2019
“By adjusting the TSI proxy models to agree with the data patterns before and after the ACRIM-gap, we found that these models miss a slowly varying TSI component. The adjusted models suggest that the quiet solar luminosity increased from the 1986 to the 1996 TSI minimum by about 0.45 W/m² reaching a peak near 2000 and decreased by about 0.15 W/m² from the 1996 to the 2008 TSI cycle minimum. This pattern is found to be compatible with the ACRIM TSI composite and confirms the ACRIM TSI increasing trend from 1980 to 2000, followed by a long-term decreasing trend since.”
“This model was extended using the ACRIM composite since 1981 and an average between VIRGO and SORCE TIM since 2013. This particular TSI model appeared to correlate well with the Earth’s global surface temperature records since 1700 [Hoyt et al., 1993, . … The TSI data from 1978 to 1981 appeared too corrupted because of uncorrected degradation of theNimbus7/ERB sensors during the solar maximum of cycle 21. For this reason, it was more appropriate to dismiss the data from this period because modifying TSI data using proxy models, as done by PMOD, would be arbitrary. We proposed that any reliable TSI composite should begin from late 1980 with the ACRIM1 record.”
“The same harmonic solar model suggests that the sun may now be heading toward a new grand solar minimum in the 2030–2040 time frame. Final evidence that TSI may have increased from 1980 to 2000 comes from Earth’s climate studies. Secular climate records correlate well with TSI curves such as the one depicted in Figure 13 and on longer ones covering the entire Holocene [1,23,60,64]. In particular, the warming observed from 1970 to 2000, followed by a temperature standstill since 2000, is a good fit for a natural 60-year cycle prediction superimposed to other contributions [20]. This pattern correlates better with a TSI evolution similar to the ACRIM composite [17–21,62,65] than with the CMIP5 general circulation climate model predictions of continuous anthropogenic warming [22]. The CMIP5 climate models use a high climate sensitivity to CO2 forcing and low secular TSI variability proxy models, such as the one proposed in [3], which was calibrated using the PMOD TSI composite model after 1980.”


No surprises then, the sun drives the global temperature.
All the other terrestrial factors react to this solar input, in complex ways, to give us our climate.
CO2? A minor bit player that encourages more plant growth and not much else.
A warmer world is a biologically more productive place than a cooler world.
Looks like a done-deal…The science is settled!
“The science is settled!”
What a stupid remark.
Or do you, J Raw, believe that “All the other terrestrial factors react to this solar input, in complex ways, to give us our climate.” is all settled because I don’t. People are so lost in the utter garbage of CO2 being the control on the climate, that all the other factors are not properly scrutinized.
Here are just some of the climate factors that are not settled —
Solar and Cosmic
Variations in solar electro-magnetic energy reaching the planet.
Variations in Solar and cosmic particles radiations.
Variations in cosmic electro-magnetic energy reaching the planet.
Variations in solar magnetic and electric fields.
Planetary
Tilt of the Earth
Variation in orbit around the sun.
Seismic events.
Amount and location of ice on the planet.
Geomagnetic domains of the Earth.
Gravity variations of the earth (variations in Gravity across the Earth’s surface).
Number and size of meteors/asteroids hitting the earth
Atmosphere
Cloud variation and their links to —
Air temperature average and variations.
Chemistry variations.
Atmospheric/Humidity variations.
Variation in direction of prevailing winds.
Altitude — air movement, temperature, and chemistry vary with altitude.
Volcanic eruptions.
Extraterrestrial radiation variations (solar and cosmic)
Oceans
Oceanic Thermohaline currents and their variation.
Oceanic salinity variations.
Variations in ocean temperature stratification from surface to ocean/seabed (and El Niño/La Niña phenomenon).
Land
Type and variation of the land — lakes, swamp, desert, forested, etc.
Shape of the land (known as ‘relief’ or ‘topography’).
Altitude — air movement and temperature variation with altitude.
Distance from the equator (or a pole).
Human impact — land use, urban heat island effects, etc.
Life
In general when the planet is warmer the gross aggregated volume of life increases, conversely when the planet is cooler the amount of life is lower. This causes variations in both the carbon and water cycles, and affects water and atmospheric chemistry, thus impacts climate patterns.
So no the ‘science’ ain’t settled, it’s just lost it’s way.
When John Raw says “the science is settled!”, I detect a touch of irony.
< sarc-on >
Yes probably but I fancied a rant, and now feel so much better for it 🙂
< /sarc-off >
You are correct!
I doubt whether what will happen in 2030 can be termed a “Grand Minimum” although it may certainly seem cold to those of us who recently experienced a very nice warm spell. The Frost Fairs began in London in 1607. This coincided with a period of low solar activity called the “Maunder Minimum.” Their is a 780 year period in solar periodicity called the Jose Cycle. If the Maunder marks a minimum in the Jose cycle, the next Grand Minimum will take place in the year 2400. Until then we will have only MiniMinimums.
This is fantastic! If completely authentic and reliable then……”The science is settled!”.
The low temperature on the thermometer yesterday morning was minus two degrees Fahrenheit. The record high daytime temp for yesterday’s date was set in 1999 at 67 degrees Fahrenheit. The record low was set in 1940 at ten below zero.
For today, the record high of 72 F was set in 1999, the record low of 18 below zero was set in 1940.
It is zero degrees F at this moment.
The topsoil is frozen more than a half a foot.
Two below zero gets your attention. You wish and hope it warms up some.
A record high temp at plus 72 F to a record low temp of minus 18 F is a 90 degree temperature difference. Weather is something you can do nothing about except for to talk about it.
The sun and its fickle nature makes me complain a lot. The stupid thing is modulating far too much. lol
That is the way it is, no amount of Anthropogenic Global Warming Climate Change Emergency is going to change any of it.
[…] Pour plus d’informations, vous pouvez suivre le lien suivant : Notrickszone.com […]
[…] K. Richard, November 11, 2019 in […]
Does that mean you guys will finally admit it can’t be the Sun this time around if temperature – of course only in rural location, where the “real temperatures live” – doesn’t drop accordingly by 2030? We all know how good skeptics are at predicting the slope of temperature developments for 10 year timeframes. Looking forward to reading your explanations of why it was warmer in 2030 than in 2020. Maybe it was earthquakes or something like that 😉
What kind of data would suggest that there is a “temperature standstill” since 2000? All the hottest months/years have been fairly recent.
In the unlikely event that I’m still here in 2030 I shall look forward to reading your explanation as to why rural temperatures (yes, that is where “real” temperatures live, away from UHI) are lower than today.
Till then I shall try to enjoy the evident benefits that a minor increase in CO2 is bringing to the planet in terms of less desert and higher crop yields.
History is against you, Seb. So is science.
Climate
scientistsactivists are adjusting the past down and the present up. They tell us they have to adjust the past because no one back then knew how to measure temperatures correctly. But if they know how to measure temperatures correctly now, why do they have to adjust those? LOL – Talk about shooting themselves in the foot.The only ones shooting themselves in the foot are you guys. Repeating conspiracy nonsense is silly.
Why would history be against me? I am asking you guys if you would consider the current warming not being the Sun if it doesn’t cool in the next decade? I am fully aware that this didn’t work for the past decade, but eventually there must be a limit to the number of decades being warmer than the previous ones – even with solar output falling – where you’ll ignore this fact and still claim “it’s the sun”.
So will it be 2030? Or 2040?
Greetings to those places where the “real” temperatures live 😉
You’re right, Seb; there is a limit to the number of decades being warmer than the previous ones. Any time now would seem quite likely and CO2 has nothing to do with it.
If you would stop looking only at the last 40 years and broaden your horizons to take in the last 400 or the last 4000 — or even the last 40000 — you might be worth listening to.
Or not.
@Newminster
It’s pointless to argue with or try to teach a troll anything, but while you are correct, we don’t need to look much past the last century (at most) to know the record keepers haven’t been honest.
https://climatechangedispatch.com/whistleblower-nasa-faked-climate-data/
https://realclimatescience.com/2016/12/100-of-us-warming-is-due-to-noaa-data-tampering/
https://moneymaven.io/mishtalk/economics/global-warming-fraud-exposed-in-pictures-bA-1mNrK0kiarserpfa9iA/
https://moneymaven.io/mishtalk/economics/global-warming-fraud-exposed-in-pictures-bA-1mNrK0kiarserpfa9iA/
https://www.manhattancontrarian.com/blog?tag=Greatest+Scientific+Fraud
You may have some or all of those links, but others may not. So I post them for those who don’t. Just more proof that warmists can’t not know the truth, and yet they just keep denying it anyway.
@ Newminster
Here’s the latest on BOM adjustments in Oz.
http://joannenova.com.au/2019/11/whopper-part-ii-look-what-the-bom-did-to-the-last-three-februarys-in-australia/
Cooling the (relatively) recent past, and warming the present. Proof positive that no one knows how to read such a complicated instrument as a thermometer. But fortunately, with the aid of computer algorithms written by wise climate modelers in air conditioned offices, those incorrect measurements are transformed by magical adjustments into warming we all can believe in. //s//
Take a look at this graph from the Australian Bureau of Meteorology.
http://www.bom.gov.au/tmp/cc/tmean.aus.0112.14054.png
Their ‘homogenization’ has completely erased the 1930’s, which were a period of heat and drought, worldwide. Nobody can call this honest science.
Why are you deliberately confusing Total Solar Irradiance minimum with Sun-spot Grand Minima? Seems as though you want to encourage the debunked Space Weather theory through the back door. Stunts like this have discredited “NoTricksZone” in the past. Wise up
Not sure what you’re getting at, posa, but here’s a post of mine on the topic of TSI, with two excellent links on the topic.
https://notrickszone.com/2019/03/25/satellite-evidence-affirms-solar-activity-drove-a-significant-percentage-of-recent-warming/#comment-1299740
Note that in the second link, it is clear that it isn’t the TSI that’s driving temperature, it’s just correlated with it in a way that suggests that whatever is driving temperatures is also driving TSI. In any event, it’s the sun that’s doing it, because CO2 concentrations on earth can’t be causing solar TSI and earth temperature to rise and fall in sync. But, a driver on the sun can do that. Find out what that is, and win a prize!
Sun-spots and solar activity correlate well, and as such sun-spots could be used as a proxy for solar activity. As shown here —
http://www.climate4you.com/images/SolarIrradianceAndSunspots.gif
Which shows Solar irradiance (red) and sunspot number (blue) since January 1979 according to NOAA’s National Geophysical Data Center; NGDC. The thin lines indicate the daily irradiance (red) and sunspot number (blue), while the thick lines indicate the running annual average for these two parameters.
From http://www.climate4you.com/Sun.htm
[…] Pour plus d’informations, vous pouvez suivre le lien suivant : Notrickszone.com […]
[…] https://notrickszone.com/2019/11/11/scientists-climate-records-correlate-well-with-solar-modulation-… […]
[…] https://notrickszone.com/2019/11/11/scientists-climate-records-correlate-well-with-solar-modulation-… […]
[…] Scientists: Climate Records ‘Correlate Well’ With Solar Modulation…A Grand Solar M… […]
[…] https://notrickszone.com/2019/11/11/scientists-climate-records-correlate-well-with-solar-modulation-… […]
This is terrible “science”. You ignore airport and large city thermometers? How could you? You use raw data without using a black (warming) box adjustment that cools the past and warms the present? Ridiculous! How could you hope to get good results if you are not making the results good, which means alarming and scary?
You need to read ‘The Cause of Global Warming and Global Cooling’ http://www.MauriceCotterell.com.
You cannot understand the cause of one, without the other.