In the last 35 months, 350 peer-reviewed scientific papers have been published containing documented evidence that undermines the popularized conception of a slowly-cooling Earth followed by a dramatic hockey-stick-shaped recent uptick, or an especially unusual global-scale warming during modern times.

During 2017 and 2018, there were over 250 papers published in scientific journals documenting the lack of any unusual warming in the modern era.
253 Non-Global Warming Papers (2017 & 2018)
Though research is still ongoing, there have been 100 more papers added thus far in 2019.
100 Non-Global Warming Papers (2019)
To clarify, some regions of the Earth have been warming in recent decades or at some point in the last 150 years.
Some regions have also been cooling for decades at a time.
And many regions have shown no significant net changes or trends in either direction relative to the last few decades to hundreds to thousands of years.
Succinctly, then, scientists publishing in peer-reviewed journals have increasingly provided documentation that there is nothing historically unprecedented or remarkable about today’s climate when viewed in the context of long-term natural variability.
A tiny sample of the 2019 list is shown below.
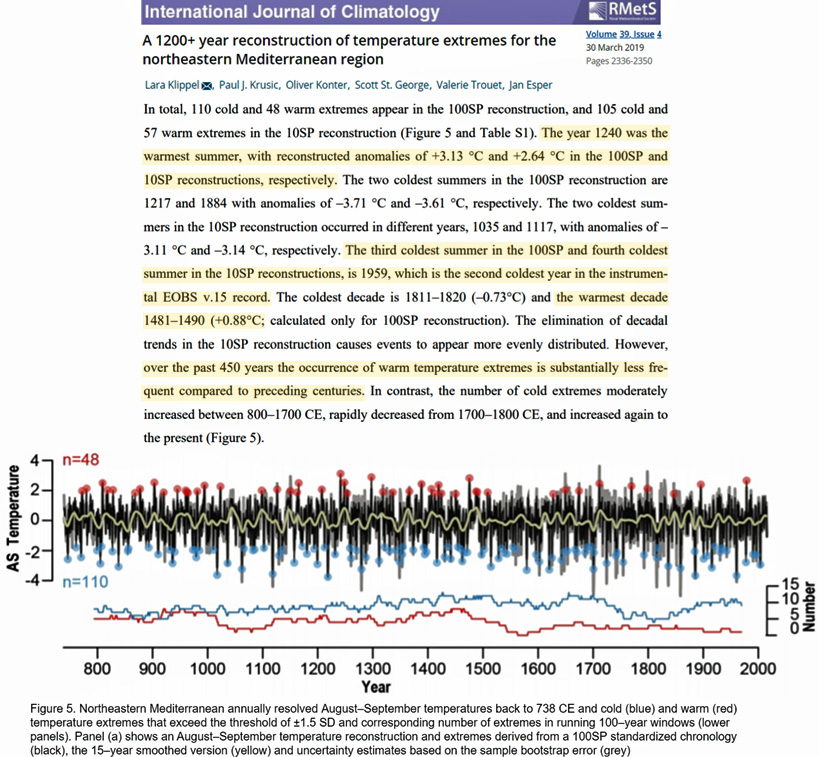
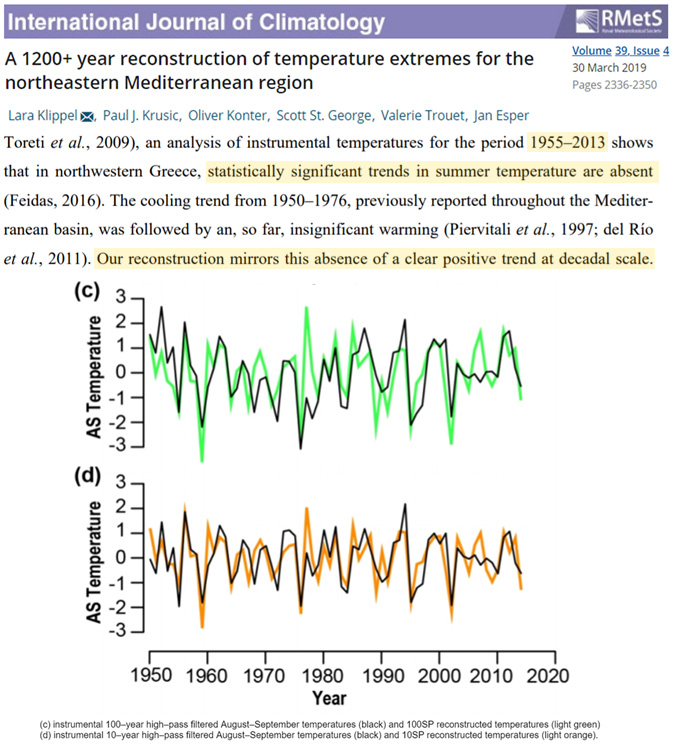
Klippel et al., 2019
“[A]n analysis of instrumental temperatures for the period 1955–2013 shows that in northwestern Greece, statistically significant trends in summer temperature are absent (Feidas, 2016). The cooling trend from 1950–1976, previously reported throughout the Mediterranean basin, was followed by an, so far, insignificant warming (Piervitali et al., 1997; del Río et al., 2011). Our reconstruction mirrors this absence of a clear positive trend at decadal scale. … In total, 110 cold and 48 warm extremes appear in the 100SP reconstruction, and 105 cold and 57 warm extremes in the 10SP reconstruction (Figure 5 and Table S1). The year 1240 was the warmest summer, with reconstructed anomalies of +3.13 °C and +2.64 °C in the 100SP and 10SP reconstructions, respectively. The two coldest summers in the 100SP reconstruction are 1217 and 1884 with anomalies of –3.71 °C and –3.61 °C, respectively. The two coldest summers in the 10SP reconstruction occurred in different years, 1035 and 1117, with anomalies of –3.11 °C and -3.14°C, respectively. The third coldest summer in the 100SP and fourth coldest summer in the 10SP reconstructions, is 1959, which is the second coldest year in the instrumental EOBS v.15 record. The coldest decade is 1811–1820 (–0.73°C) and the warmest decade 1481–1490 (+0.88°C; calculated only for 100SP reconstruction). The elimination of decadal trends in the 10SP reconstruction causes events to appear more evenly distributed. However, over the past 450 years the occurrence of warm temperature extremes is substantially less frequent compared to preceding centuries.”
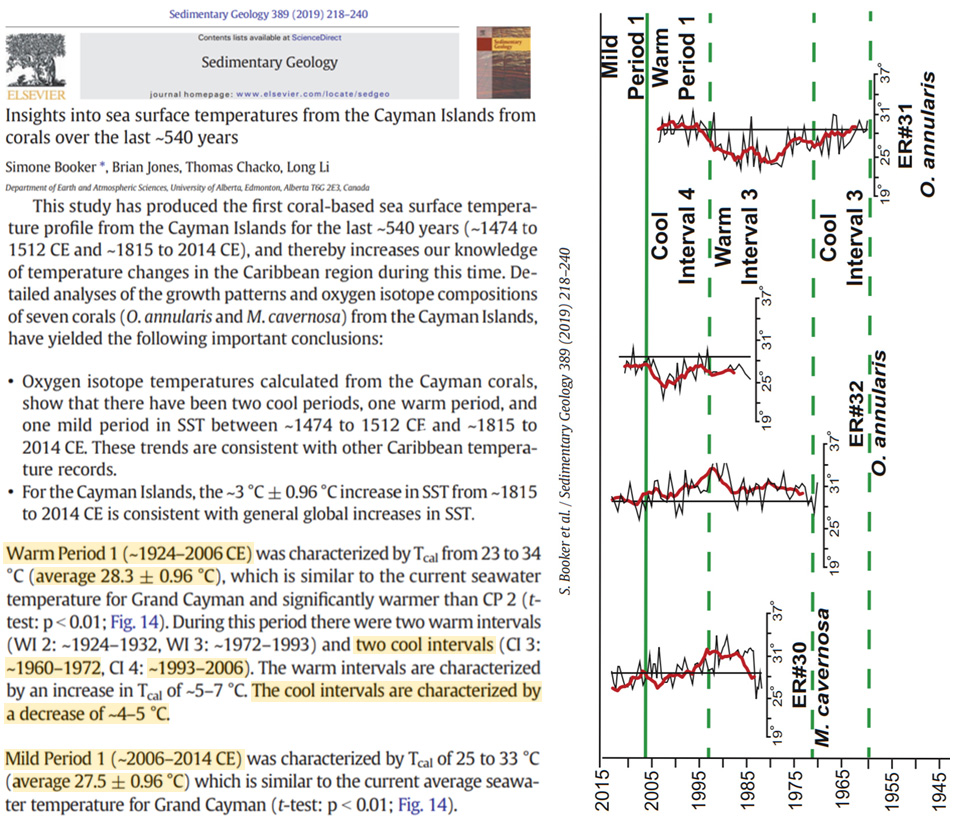
Booker et al., 2019
“Warm Period 1 (~1924–2006 CE) was characterized by Tcal from 23 to 34°C (average 28.3 ± 0.96 °C), which is similar to the current seawater temperature for Grand Cayman and significantly warmer than CP 2. During this period there were two warm intervals (WI 2: ~1924–1932, WI 3: ~1972–1993) and two cool intervals (CI 3: ~1960–1972, CI 4: ~1993–2006). The warm intervals are characterized by an increase in Tcal of ~5–7 °C. The cool intervals are characterized by a decrease of ~4–5 °C. … • Mild Period 1 (~2006–2014 CE) was characterized by Tcal of 25 to 33 °C (average 27.5 ± 0.96 °C) which is similar to the current average seawater temperature for Grand Cayman (t-test: p b 0.01; Fig. 14).”
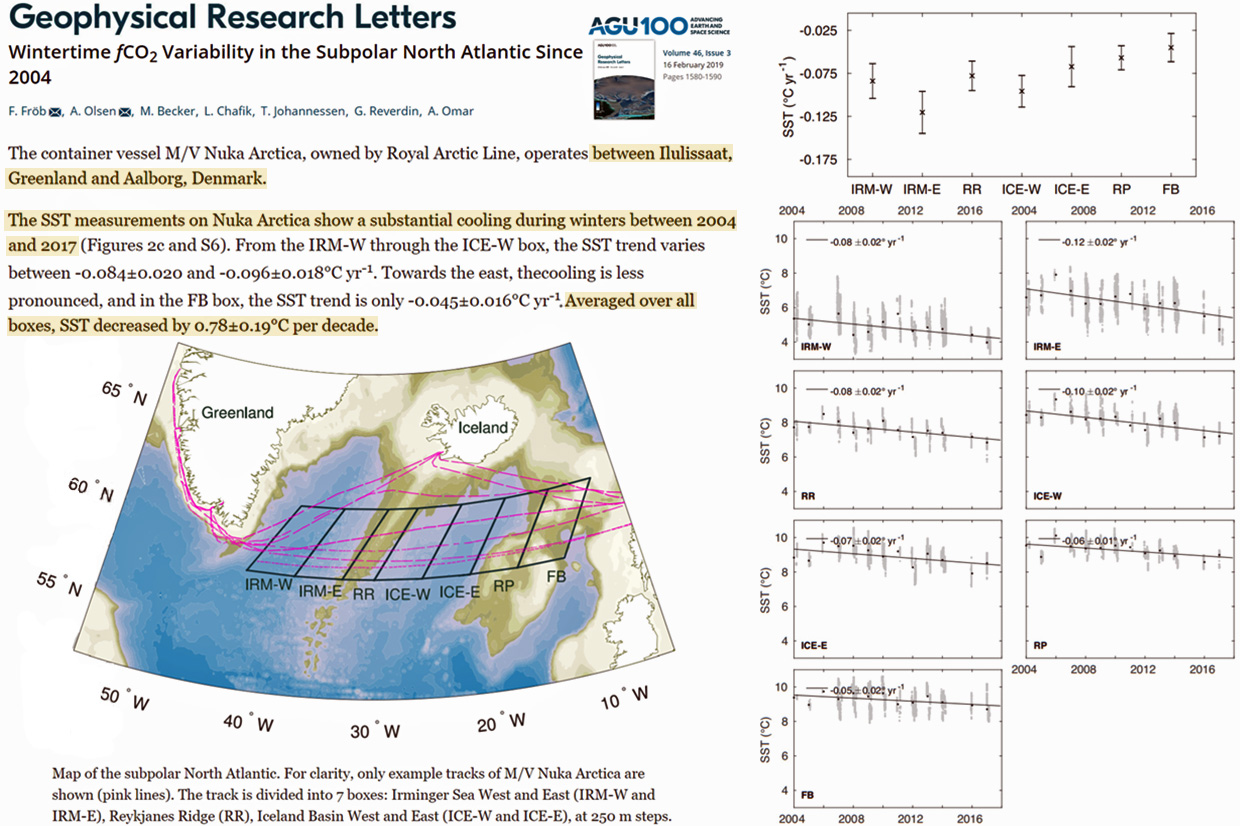
Fröb et al., 2019
“The container vessel M/V Nuka Arctica, owned by Royal Arctic Line, operates between Ilulissaat, Greenland and Aalborg, Denmark. … The SST measurements on Nuka Arctica show a substantial cooling during winters between 2004 and 2017 (Figures 2c and S6). From the IRM-W through the ICE-W box, the SST trend varies between -0.084±0.020 and -0.096±0.018 ◦C yr−1. Towards the east, thecooling is less pronounced, and in the FB box, the SST trend is only -0.045±0.016 ◦C yr−1. Averaged over all boxes, SST decreased by 0.78±0.19◦C per decade.”
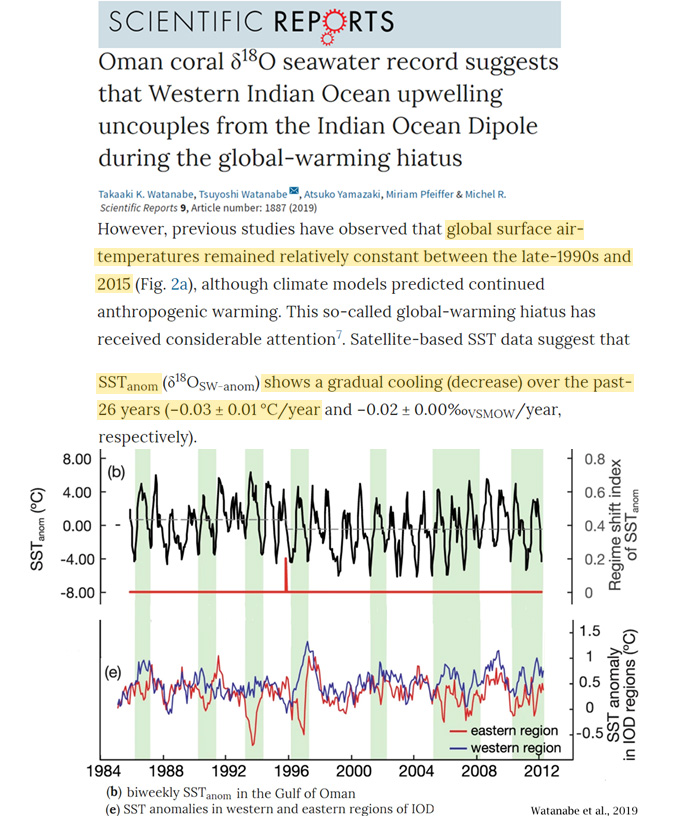
Watanabe et al., 2019
“[P]revious studies have observed that global surface air-temperatures remained relatively constant between the late-1990s and 2015, although climate models predicted continued anthropogenic warming. This so-called global-warming hiatus has received considerable attention [Kosaka et al., 2013]. Satellite-based SST data suggest that the main cause of the global-warming hiatus is the Interdecadal Pacific Oscillation (IPO), which is the dominant mode of atmosphere-ocean interactions in the subtropical Pacific. The IPO reversed from a positive to a negative phase in the late 1990s, i.e. the timing of the IPO phase change coincides with the onset of the global-warming hiatus. The negative IPO led to anomalous cooling in the eastern Pacific and this is thought to be a major cause of the global-warming hiatus. … The 26-year SSTanom record shows a significant regime shift in October 1996 (peak: 0.202; P < 0.01: Fig. 2b). The mean (range) of SSTanom is 0.73 ± 2.59 °C (10.96 °C) before 1996 and −0.46 ± 2.71 °C (11.72 °C) after 1996 (Fig. 2b). SST anom (δ18OSW-anom) shows a gradual cooling (decrease) over the past-26 years (−0.03 ± 0.01 °C/year and −0.02 ± 0.00‰VSMOW/year, respectively).”
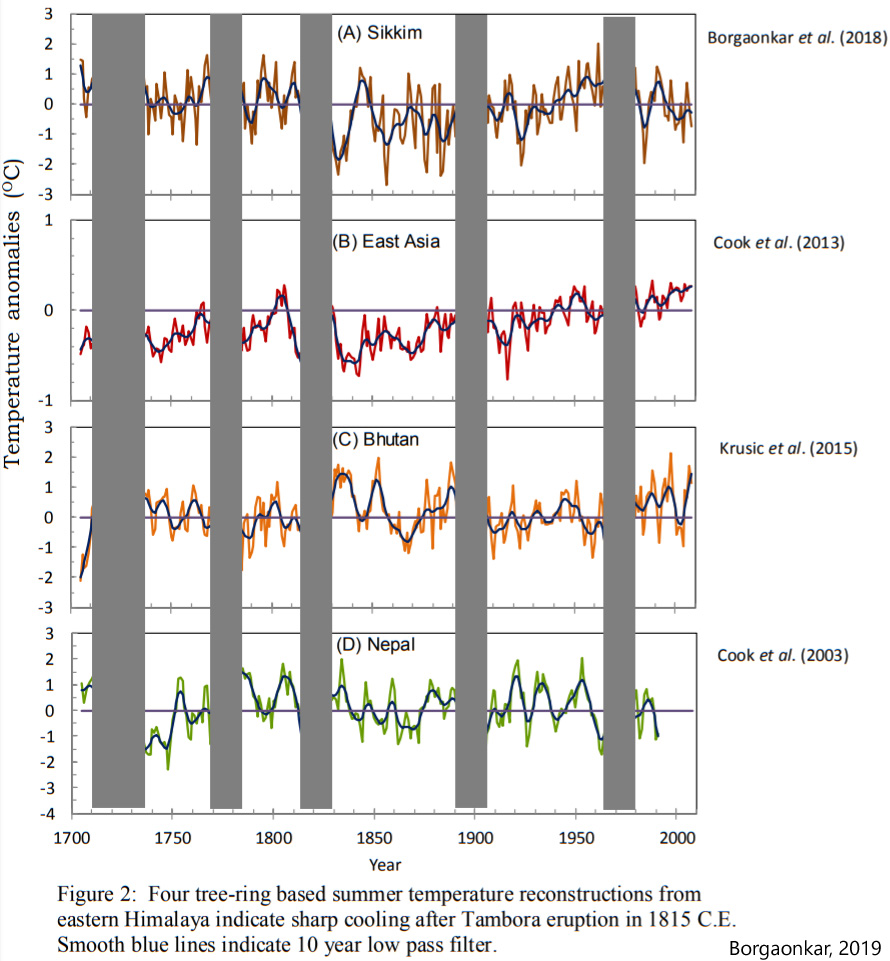
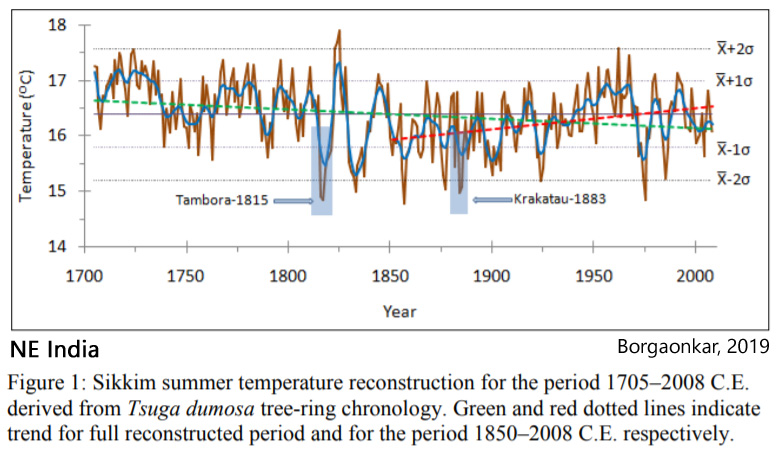
Borgaonkar, 2019
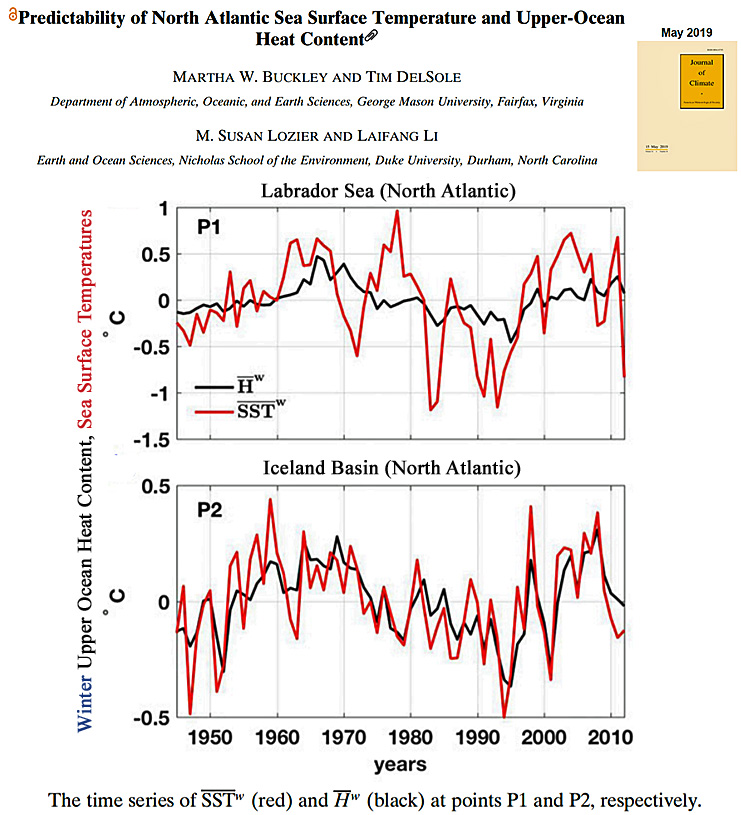
Buckley et al., 2019
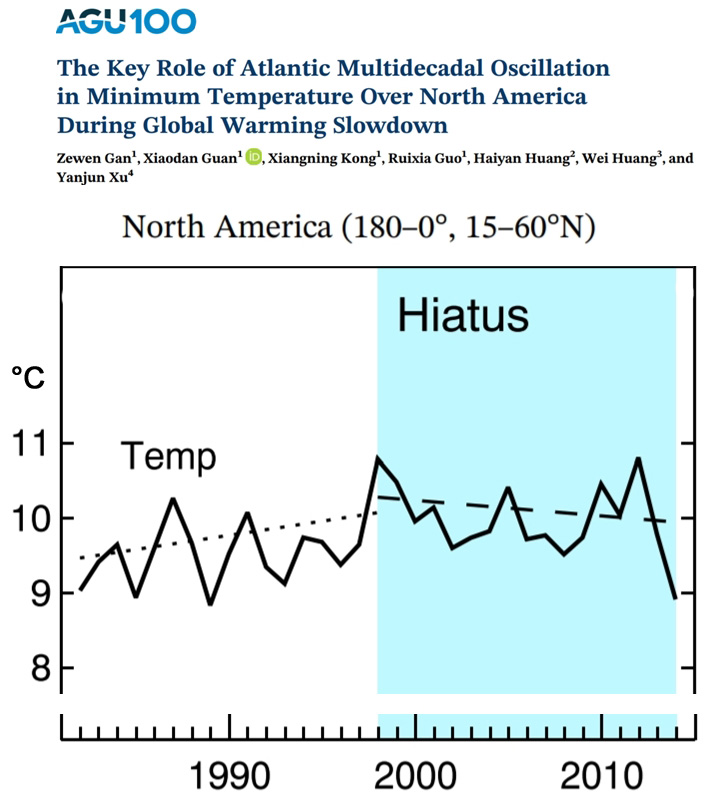
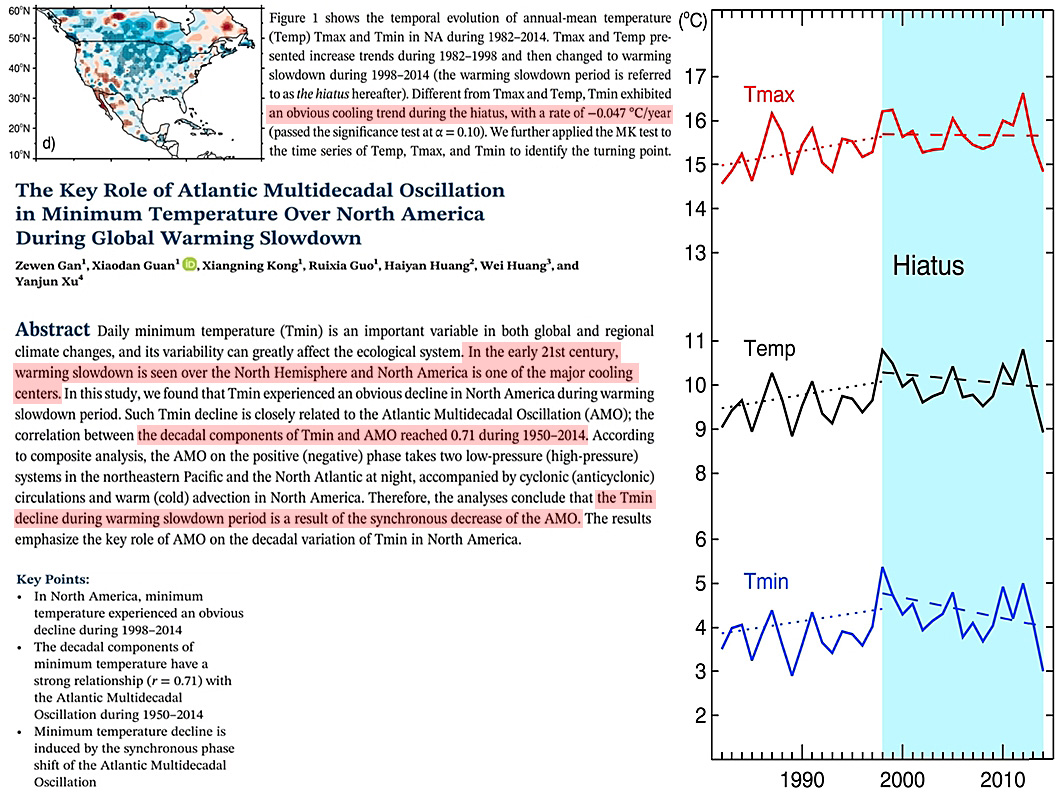
Gan et al., 2019
“Daily Minimum temperature (Tmin) is an important variable in both global and regional climate changes, and its variability can greatly affect the ecological system. In the early 21st century, warming slowdown is seen over the North Hemisphere and North America is one of the major cooling centers. … In this study, we found that Tmin experienced an obvious decline in North America during warming slowdown period. Such Tmin decline is closely related to the Atlantic Multidecadal Oscillation (AMO), the correlation between the decadal components of Tmin and AMO reached 0.71 during 1950-2014.”
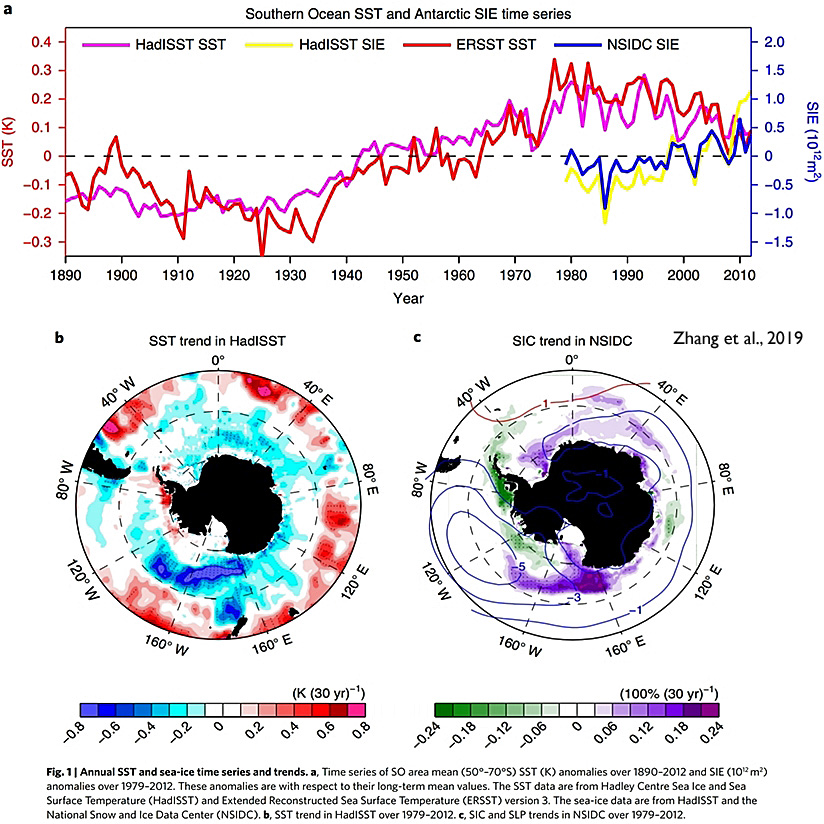
Zhang et al., 2019
“Natural variability of Southern Ocean convection as a driver of observed climate trends … Observed Southern Ocean surface cooling and sea-ice expansion over the past several decades are inconsistent with many historical simulations from climate models. Here we show that natural multidecadal variability involving Southern Ocean convection may have contributed strongly to the observed temperature and sea-ice trends.”
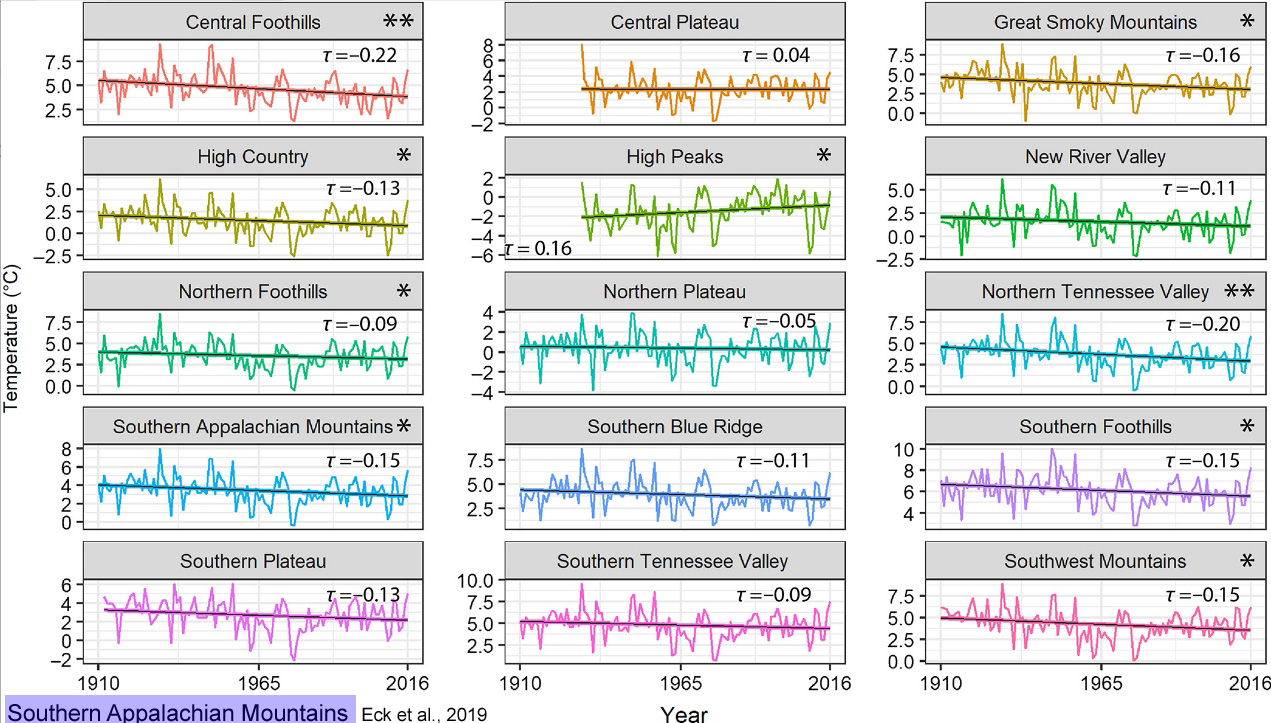
Eck et al., 2019
“A majority (12/14) of the regions within the SAM [southern Appalachian Mountains] have experienced a long‐term decline in mean winter temperatures since 1910.”
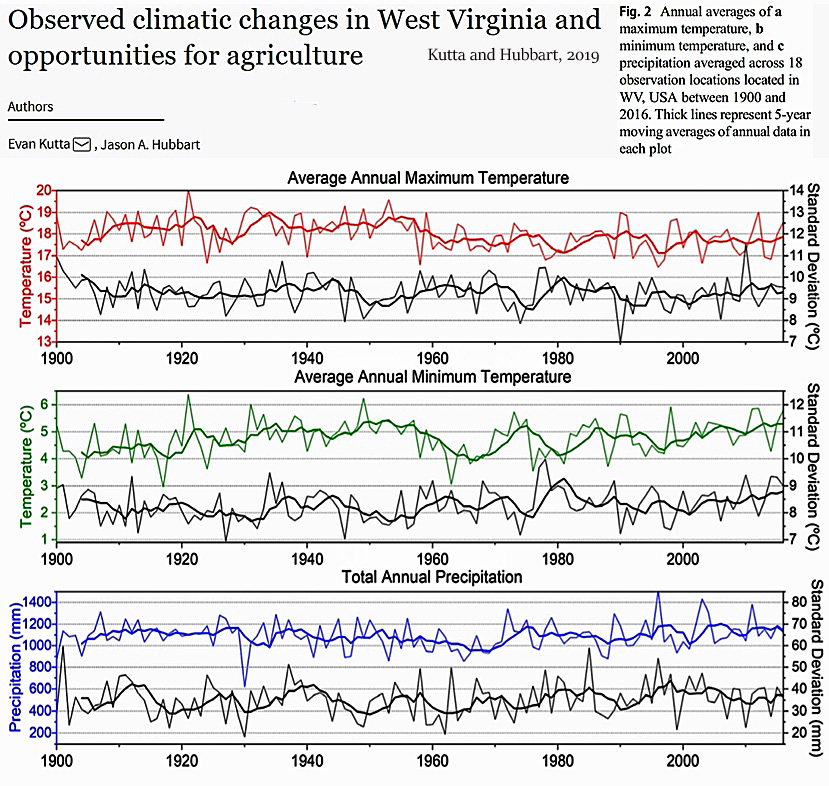
Kutta and Hubbart, 2019
“Between 1900 and 2016, climatic trends were characterized by significant reductions in the maximum temperatures (−0.78°C/century; p = 0.001), significant increases in minimum temperatures (0.44 °C/century; p = 0.017) [overall -0.34°C per century], and increased annual precipitation (25.4 mm/century) indicative of a wetter and more temperate WV climate. Despite increasing trends of growing degree days during the first (p ≤ 0.015) and second half of the period of record, the long-term trend indicated a decrease in GDD [warm growing degree days] of approximately 100 °C/days.”
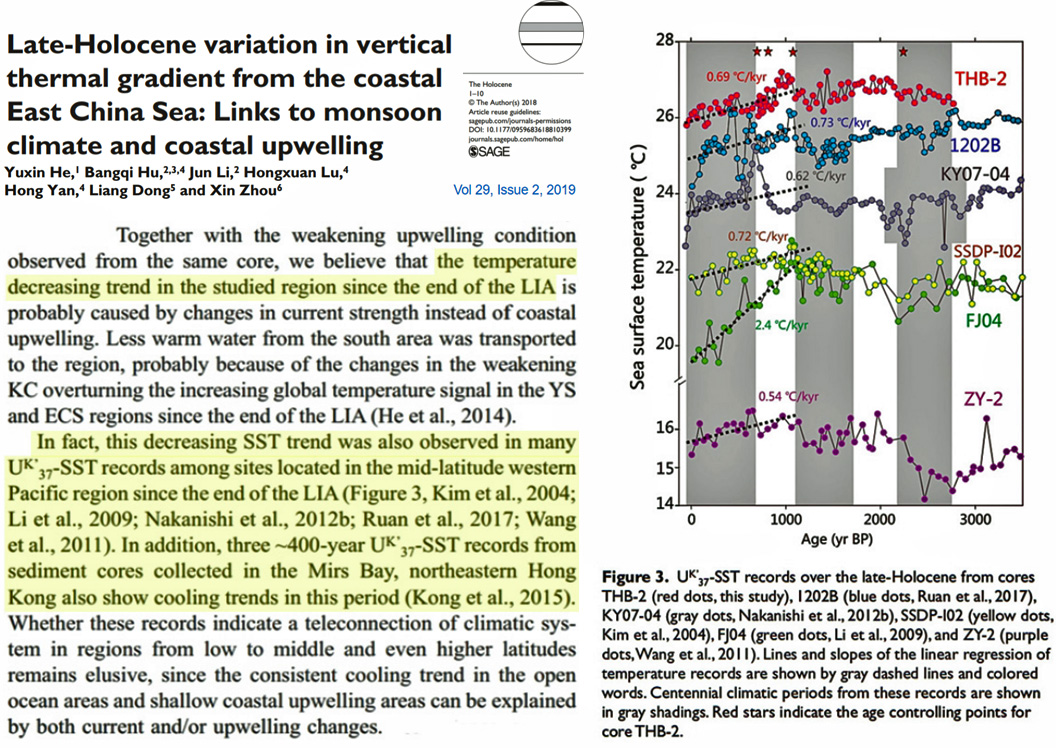
He et al., 2019
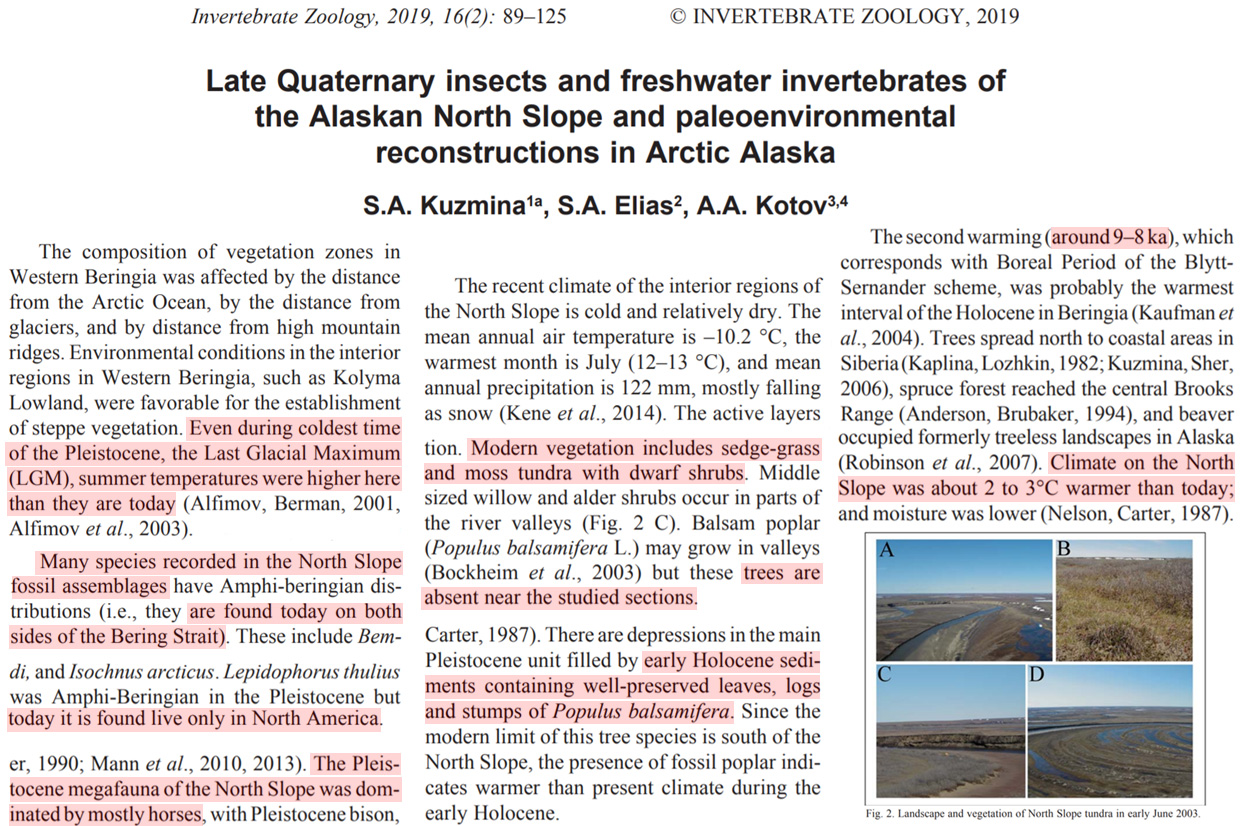
Kuzmina et al., 2019
“Even during coldest time of the Pleistocene, the Last Glacial Maximum (LGM), summer temperatures were higher here than they are today (Alfimov, Berman, 2001, Alfimov et al., 2003). … The Pleistocene megafauna of the North Slope was dominated by mostly horses … There are depressions in the main Pleistocene unit filled by early Holocene sediments containing well-preserved leaves, logs and stumps of Populus balsamifera. Since the modern limit of this tree species is south of the North Slope, the presence of fossil poplar indicates warmer than present climate during the early Holocene. … The second warming (around 9–8 ka), which corresponds with Boreal Period of the BlyttSernander scheme, was probably the warmest interval of the Holocene in Beringia (Kaufman et al., 2004). Trees spread north to coastal areas in Siberia (Kaplina, Lozhkin, 1982; Kuzmina, Sher, 2006), spruce forest reached the central Brooks Range (Anderson, Brubaker, 1994), and beaver occupied formerly treeless landscapes in Alaska (Robinson et al., 2007). Climate on the North Slope was about 2 to 3°C warmer than today; and moisture was lower (Nelson, Carter, 1987).”
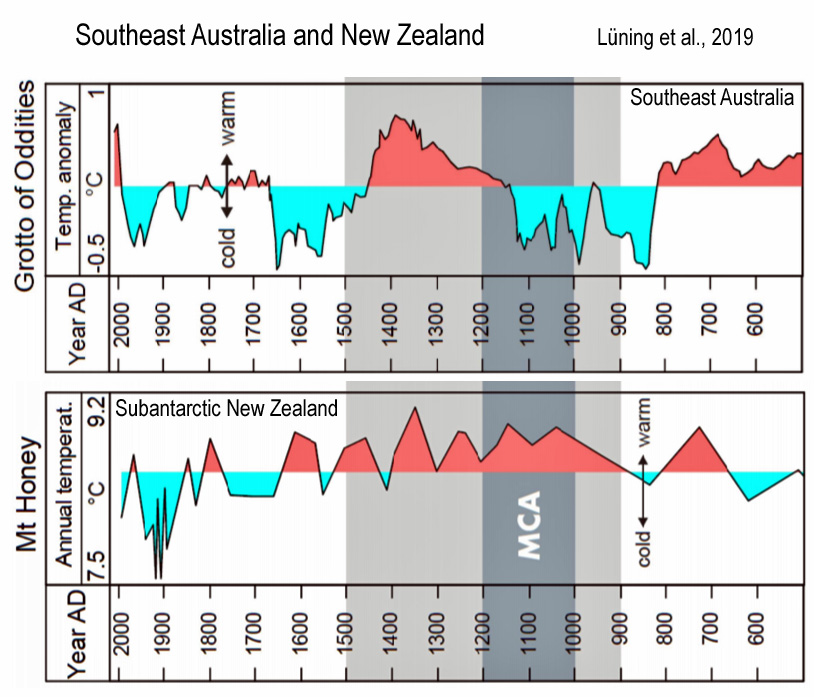
Lüning et al., 2019
“The main MCA warming phase coincides with a higher SAM, more El Niño-dominated ENSO, more positive IPO and higher solar activity (Abram et al., 2014; Conroy et al., 2008; Steinhilber et al., 2012; Vance et al., 2015) (Fig. 5). Spectral analysis of the classical Mt Read tree rings series (site 5), yields characteristic cycle periods associated with the solar Gleissberg (80 years) and Suess-de Vries (210 years) cycles (Cook et al., 1995; Cook et al., 2000). … An alternation of well-defined multicentennial warm and cold phases has been reconstructed for Grotto of Oddities in SE Australia (site 3). Temperatures oscillated with an amplitude of more than 1°C during the past 1500 years (McGowan et al., 2018).”
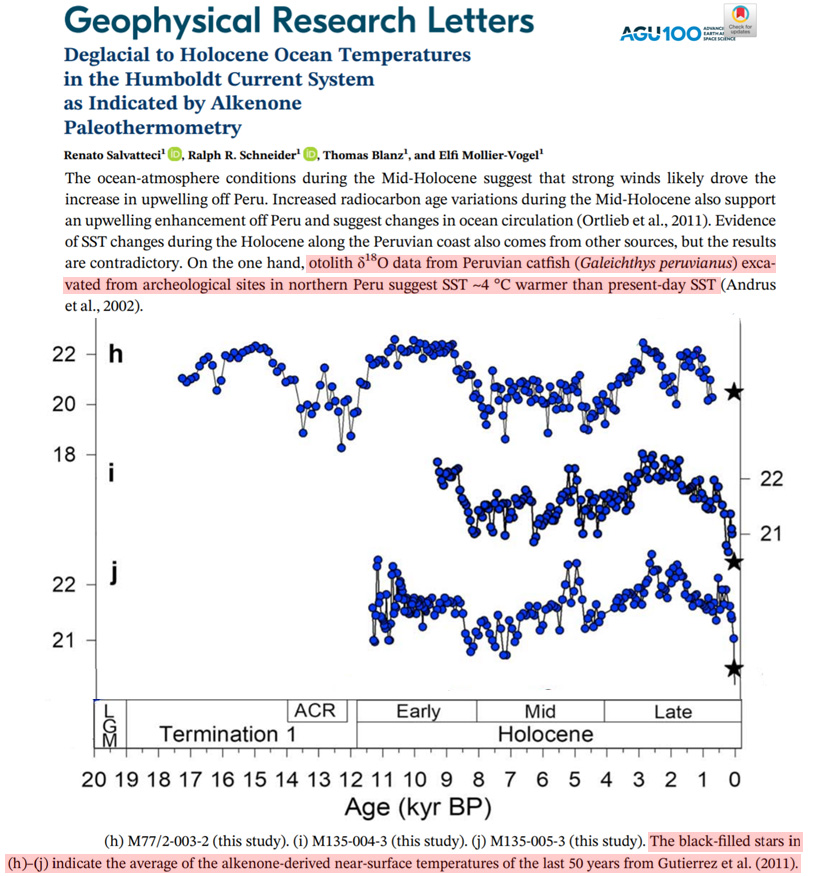
Salvatteci et al., 2019
“[O]tolith δ18O data from Peruvian catfish (Galeichthys peruvianus) excavated from archeological sites in northern Peru suggest SST ~4 °C warmer than present‐day SST (Andrus et al., 2002).”
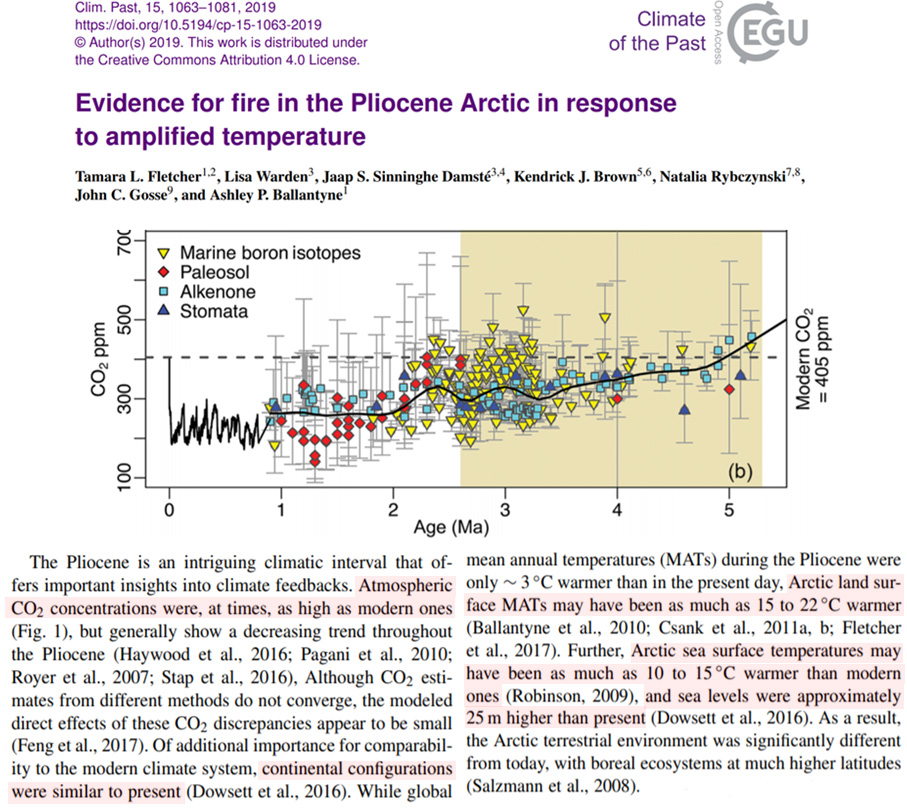
Fletcher et al., 2019
“The Pliocene is an intriguing climatic interval that offers important insights into climate feedbacks. Atmospheric CO2 concentrations were, at times, as high as modern ones (Fig. 1), but generally show a decreasing trend throughout the Pliocene (Haywood et al., 2016; Pagani et al., 2010; Royer et al., 2007; Stap et al., 2016), Although CO2 estimates from different methods do not converge, the modeled direct effects of these CO2 discrepancies appear to be small (Feng et al., 2017). Of additional importance for comparability to the modern climate system, continental configurations were similar to present (Dowsett et al., 2016). While global mean annual temperatures (MATs) during the Pliocene were only ∼ 3°C warmer than in the present day, Arctic land surface MATs may have been as much as 15 to 22°C warmer (Ballantyne et al., 2010; Csank et al., 2011a, b; Fletcher et al., 2017). Further, Arctic sea surface temperatures may have been as much as 10 to 15°C warmer than modern ones (Robinson, 2009), and sea levels were approximately 25 m higher than present (Dowsett et al., 2016). As a result, the Arctic terrestrial environment was significantly different from today, with boreal ecosystems at much higher latitudes (Salzmann et al., 2008).”


Dec 7, 2019 Mass Climate Hypnosis
If nobody owned a TV and people spent more time outside, there would be no climate hysteria.
https://youtu.be/6T-Yrrg5iJs
I wonder why most climate scientists still deny geothermal truth.
https://phzoe.wordpress.com/2019/12/25/why-is-venus-so-hot/
https://phzoe.wordpress.com/2019/12/06/measuring-geothermal-1/
Unfortunately for those for whom the science is “settled” no new information will be accepted.
Dec 27, 2019 Nearby Superflares | What Do They Mean?
https://youtu.be/LAlxsNH8QCc
[…] More … […]
[…] https://notrickszone.com/2019/12/26/350-papers-published-since-2017-subvert-the-claim-that-post-1850… […]
[…] Richard | Décembre 2019 | URL de l’article source en anglais ► https://notrickszone.com/2019/12/26/350-papers-published-since-2017-subvert-the-claim-that-post-1850… Traduit de l’anglais par […]
Hi, I don’t know if you have seen this paper, which reconstructed the temperature record in southern South America for the past 5800 years, and showed the recent warming to be unremarkable https://www.sciencedirect.com/science/article/pii/S0277379119306924
[…] 350 Papers Published Since 2017 Subvert The Claim That Post-1850s Warming Has Been Unusual, Global […]
[…] https://notrickszone.com/2019/12/26/350-papers-published-since-2017-subvert-the-claim-that-post-1850… […]
[…] Richard | Décembre 2019 | URL de l’article source en anglais ► https://notrickszone.com/2019/12/26/350-papers-published-since-2017-subvert-the-claim-that-post-1850… Traduit de l’anglais par […]
[…] https://notrickszone.com/2019/12/26/350-papers-published-since-2017-subvert-the-claim-that-post-1850… […]
[…] 65. 350 recent papers show current warming not unusual […]
[…] Climate Science Lomborg: Your electric car and vegetarian diet are pointless virtue signaling… 350 Peer-Reviewed Papers Since 2017 Subvert Climate Change Claims It will take a lot more than science to convince climate activists that they are wrong. The climate […]
[…] Climate Science Lomborg: Your electric car and vegetarian diet are pointless virtue signaling… 350 Peer-Reviewed Papers Since 2017 Subvert Climate Change Claims It will take a lot more than science to convince climate activists that they are wrong. The climate […]