Unusually harsh winter conditions have struck the northern hemisphere this October as record snow cover has been observed. More on this below.
No more October warming?
But first looking at the untampered data from the Japan Meteorological Agency (JMA) for stations with complete data going back to 1998 for Canada and 2001 for France, we see there has not been any significant warming for the month of October.
First we examine 9 stations in Canada: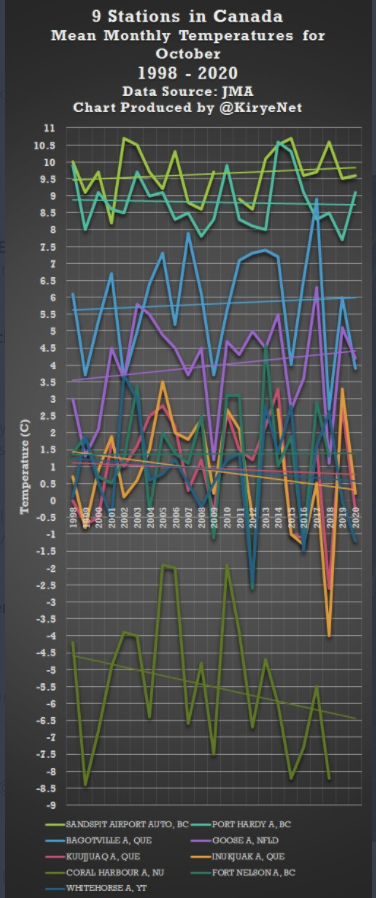
Data source: JMA.
Some stations have warmed modestly, while the others have cooled. Overall, there hasn’t been much October warming at these stations over the past two decades.
In France, whose climate is heavily impacted by the Atlantic, we plot the JMA October data since 2001 for 14 stations across the country.
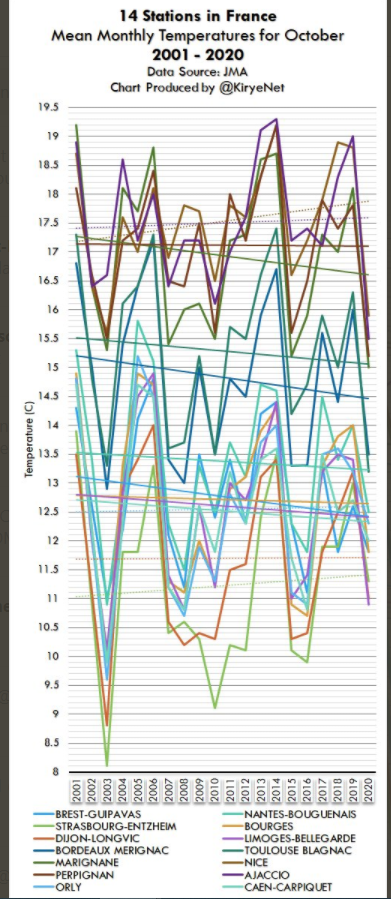
Data source: JMA.
Nine of 14 stations have seen cooling or no warming for October since 2001. So here the data show that the opposite of what was projected is really happening, and that natural factors, likely Atlantic patterns, are at play.
Dehli sees coldest October in 58 years
Meanwhile Twitter account Electroverse here reports on a variety of unusually harsh early winter events taking place. For example: “Following on from its coldest October in 58 Years, India’s capital city of Delhi has continued toppling low temperature records into November.”
Also Pakistan is getting pounded by heavy snows and the northern hemisphere currently has seen well above normal snow cover, reports Electroverse:
IN PICTURES: PAKISTAN MOUNTAINS BURIED UNDER “TONNES” OF EARLY SEASON SNOW
The Northern Hemisphere's total snow mass, aided by central Asia's record snowfall, is now sitting above the 1982-2012 average by 400 gigatons (as of Nov 21). #GSMhttps://t.co/8NQx1OvHv6
— Electroverse (@Electroversenet) November 23, 2020
Record October snow cover
In fact, German Snowfan here reports how October has set a new record for northern hemisphere snow cover since data recording this magnitude began more than 50 years ago, according to the data from the University of Rutgers:
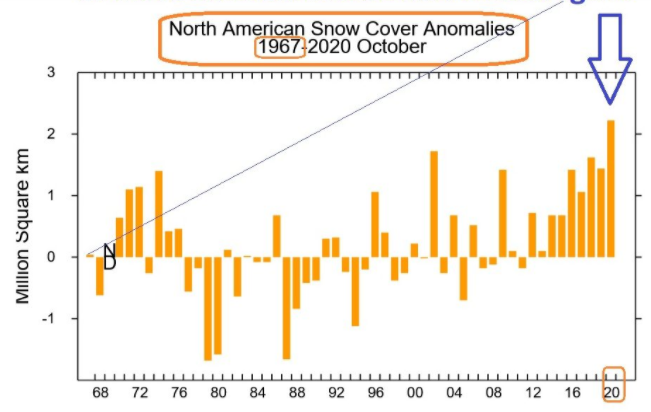
Source: University of Rutgers.
Northeast deep freeze
The Northeast US also saw record low temperatures last week, as the jet stream drove Arctic air far south.
“The mercury held as much as 16°C below the season average in some parts, particularly in New York State, Vermont, Massachusetts, and Connecticut,” reported Electroverse. “Long Island, New York wound-up setting a new record low.”
Western USA and Canada have also been hard hit by early, severe winter conditions.
“After a barrage of early-season storms, the snowpack across the Western United States is now well above average for mid-November, wrote Electroverse.
Snowfall 1500% over normal
“In parts of Oregon, totals are hitting as much as 786% of normal. The story is similar across Washington State. While in Idaho and Montana, and elsewhere, the current Snow Water Equivalent (SWE) is comfortably above the 1981-2010 median. Finally, note the 1500% in Texas (the key only goes >= 150%!).”


OT – But I have nowhere else to put it.
I see that the German thought-crime police are flexing their muscles.
https://theconservativetreehouse.com/2020/11/23/german-police-raid-covid-lockdown-critic-during-livestream-of-non-compliant-thoughts/
“ The story is similar across Washington State.”
This seems to me – in central Washington State, east of the Cascade Mountains – much ado about an early storm. The Department of Transportation did close the highway across the northern part. The avalanche chutes filled with snow and made road travel questionable. In the past, folks have gotten trapped between snow slides and have to be brought out with helicopters. These are dangerous rescues, often delayed by fog and winds. Best to be avoided.
At Snoqualmie Pass – about 60 miles east of Seattle and 70 miles west of us – all is normal with a little snow on the ground, and a little forecast through Wednesday. The 7-day forecast shows daytime highs above freezing and lows just below. Not exciting.
I will note that 20+ years ago we got 5 feet of snow here between this week and the first week in January.
Even the choice of “Mean Monthly Temperature” for a location doesn’t show the true picture. Just last week, I created a new spreadsheet from my copy of Environment Canada’s official station readings as released in 2007. I chose the three stations in Eastern Ontario with records covering the period 1938-2006,and calculated and graphed the average daily highs and lows SEPARATELY for each station, month and year. The three stations are Ottawa CDA (closest to central Ottawa), Ottawa Airport (suburban) and Morrisburg (80 km south of Ottawa).
For the month of October, and the period 1938-2007, the average daily high temperature shows a decline of a bit less than 1 degree Celsius for the two Ottawa stations, and a decline of close to 2 degrees for the more rural station in Morrisburg. The average daily lows show an increase of about 1 degree for Ottawa CDA, between 0.5 and 1 degree for Morrisburg, but a slight decrease for Ottawa Airport.
The pattern varies somewhat from month to month, especially for the average daytime highs. Some show mixed trends depending on the station, some show increases, some decreases. Most telling is that for all three stations, the average highs for the hottest months (July and August) are almost completely flat over the 60+ year period, and also fall into a narrow range. What is more noticeable is a fairly uniform increase in the average daily minima for all stations, and most months.
So, if you only cite the “Average Daily Temperature” for a month, you might well see a consistent increase, but more detailed analysis seems to indicate this is primarily due to milder overnight lows, not increased daily highs. Isn’t that more consistent with an Urban Heat Island effect than an overall warming climate?
PS. There are 7,664 stations in the official climate data set from 2007, but few of them have complete data sets from before 1940 to the present. There are six sets of daily measurements – Max and Min Temperature (C), Rainfall (mm), Snowfall (cm), Total Precipitation (mm) and Snow Pack Depth (cm), any or none of which may be available for a given station and date.
Kirye, can you help me please?
I have been copying the links to your NASA/GISS charts showing the data adjustments to use in an argument with a Warmist.
Can you tell me where to find the NASA location where you generate those charts?
I have looked alot, but cannot find it, I can find most things including the data, but I can’t post Excel worksheets in the Forum.
I can’t contact you on Twitter as I do not have an account.