Hundreds of publications show how climate in many regions around the world varies in sync with solar activity. More evidence is provided by Japanese climate scientist Kyoji Kimoto.
=======================================
Climate Change Governed By The Sun
By guest author Kyoji Kimoto, kyoji@mirane.co.jp
January 22, 2021
I’ve compiled a list of six examples how the sun impacts climate across the globe.
1. Climate periods based on a double Hale (44-45 years) cycle of solar activity.
In 1977 Australian geologist Rhodes W. Fairbridge found a 45-year periodicity of beach ridge located at the Hudson Bay. It has been formed with storms in Hudson Bay caused by a wavier jet stream.
I have found a 44-year periodicity of heavy snowfall in Japan caused by the wavier jet stream as follows. The time series coincide quite well with that of Fairbridge (1977).
1833 Tempo famine, Dalton minimum (1795-1830)
1877 Seinan war (44 years later)
1918 Rice riot, Gleissberg minimum (1898-1923) (41 years later)
1963 38 heavy snowfall (45 years later)
2006 Heisei 18 year heavy snowfall, Gleissberg or Dalton minimum (43 years)
The climate history of 20th century can be divided with the following 5 periods based on the double Hale cycle above using aa-index of geomagnetism associated with solar activity. The Pacific Climate Shift occurred at 1977 with solar activity increase & a positive PDO index.
1900-1918: Little Ice Age (LIA)
1919-1962: 1st Modern Warm Period (1st MWP)
1963-1976: Temporal Cold Period (TCP, New Ice Age Coming, see below)
1977-2005: 2nd Modern Warm Period (2nd MWP)
2006 – present: New Cold Period (NCP)
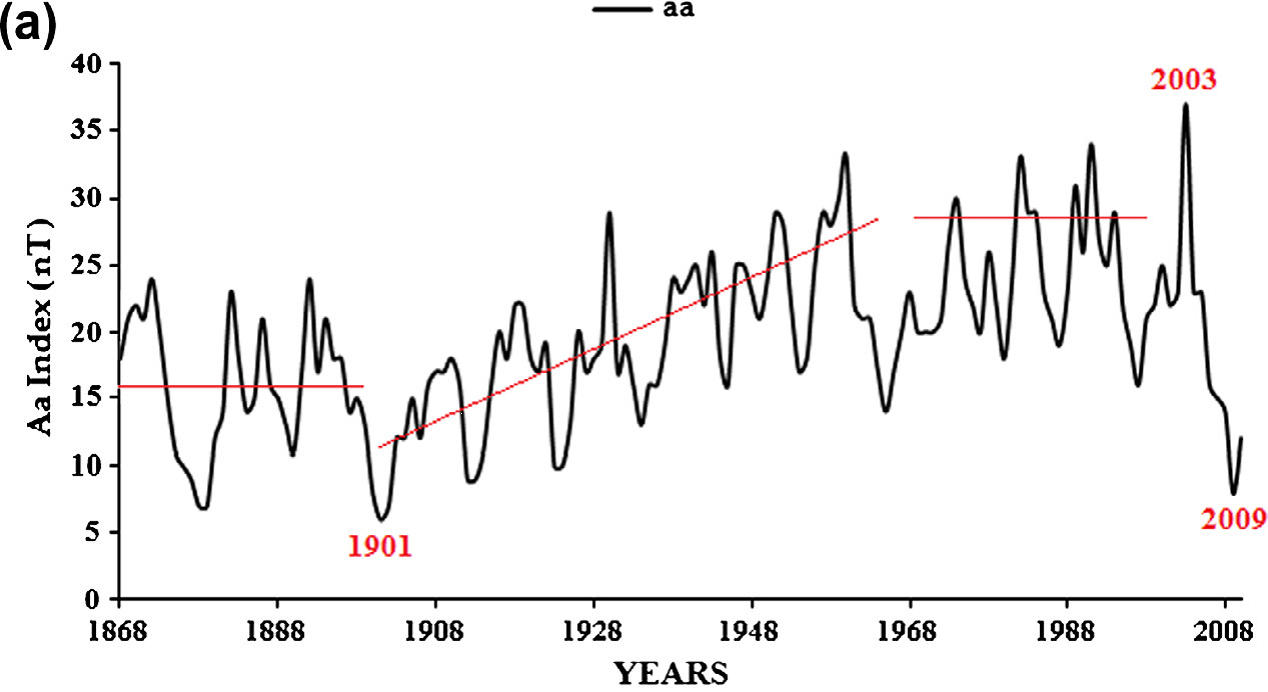
Fig. 1: aa-index graph: Zebro, J-L et al., Journal of Advanced Research (2013),4, 265-274
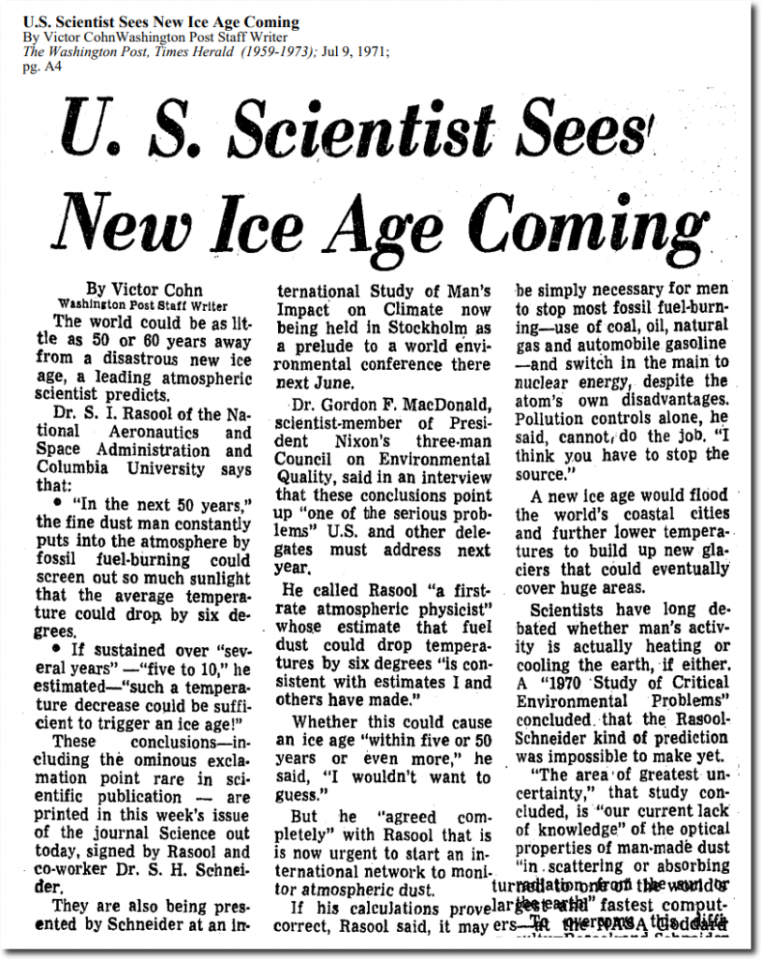
Fig. 2: Washington Post, July 9, 1971.
2. Hachijo-jima temperature time series
Hachijo-jima is a volcanic Japanese island some 287 kilometers south of Tokyo, where 7,522 people live on its 63 km2 of area.
The following time series shows how the temperature at Hachijo-jima generally has varied in line with the climate periods based on solar activity above.
Figure 3: Hachijo-jima temperature time series. Chart: Kirye, NTZ.
3. Arctic sea ice extent
Connolly et al. (2017) showed the variation of Arctic sea ice extent due to solar activity change in line with the climate periods above.

Fig. 4: Variation of Arctic sea ice extent, Connolly et al., 2017)
Fig. 5 below is a chart from the NOAA that shows Arctic sea ice loss from the maximum at 1979 above:
Fig. 5: Arctic sea ice extent since 1979. Source: NOAA
The sea ice loss rate has decreased since 2006 with the beginning of NCP above.
Warm sea water penetrated into the Arctic sea after the big El Nino at 1998, accelerating the sea ice loss. Moreover, low solar activity since 2006 has caused a wavier jet stream and frequent Arctic heat wave with abrupt sea ice loss, as discussed in Section 5.
4. Hurricane strength
In the following table, the third strongest hurricane Labor Day hit in 1935. Hurricane Katrina, Sandy, Irma and Harvey show much higher central pressure. Alarmists and media erroneously loudly claimed that they were caused by the anthropogenic global warming (AGW). Interestingly all five of the strongest hurricanes hit in 1st MWP or 2nd MWP. (WMP 1= 1919-1962; TCP = 1963-1976; MWP 2 = 1977-2005; NCP = 2006 – present)
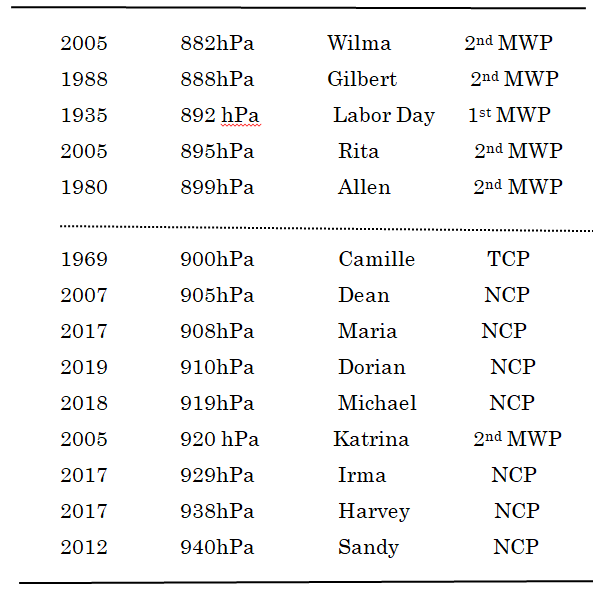
Table 1: Data source: Wikipedia
5. Wavier jet stream due to decreased solar activity
Low solar activity since 2006 has caused wavier jet stream as shown below. It causes extreme weather (ExWe) such as heat waves, flooding and heavy snowfall.
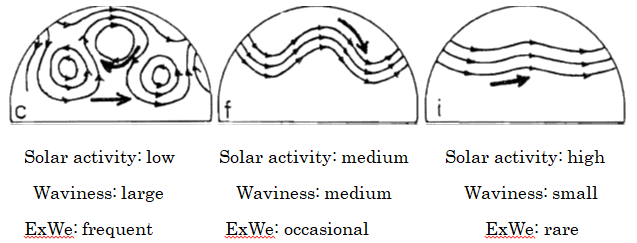
Fig. 6: Bucha: Annales Geophysicae, 1988, 6(5), 513-524.
The following table shows the extreme weather seen since 2006:
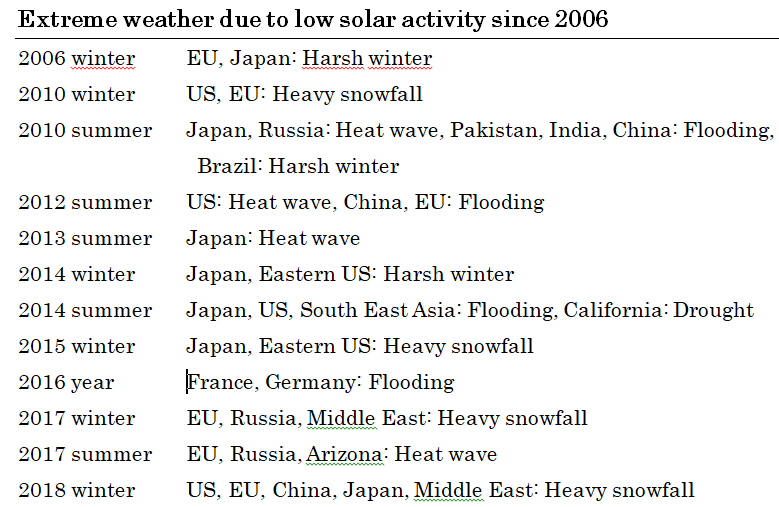
Table 2: By Kyoji Kimoto
6. Climate history of the Earth
Based on bore-hole studies of the Greenland ice sheet, Dahl-Jensen et al (1998) showed the following temperature data compared with the present time.
Medieval Warm Period: +1°K,
Little Ice Age: -1°K,
Warm period 1930s: +0.5°K
The following data will support Dahl-Jensen’s finding of a warm period in the 1930s:
Fig. 6: US annual heat wave index.
A NASA study finds that 1934 had the worst drought of the last thousand years.
Lamb’s graph (IPCC 1990) showed climate change is governed by solar activity with MWP & LIA. In contrast, Mann’s graph (IPCC 2001) erased MWP & LIA to emphasize the dubious IPCC AGW and is based on fudged model studies and mathematical errors.
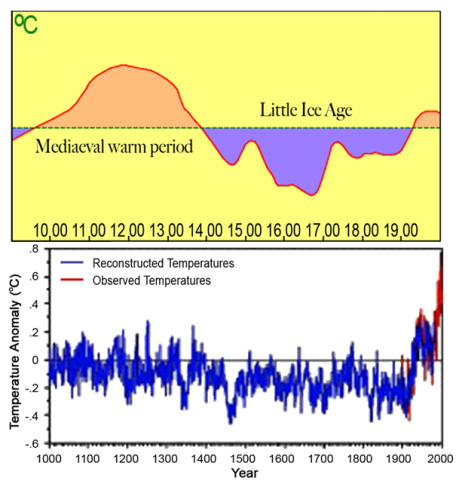
Figure 7: Lamb’s graph (IPCC 1990) versus Prof. Michael Mann’s graph (IPCC 2001).
Lamb’s graph in Fig. 7, top, is confirmed independently by the climate history of Japan and China as follows: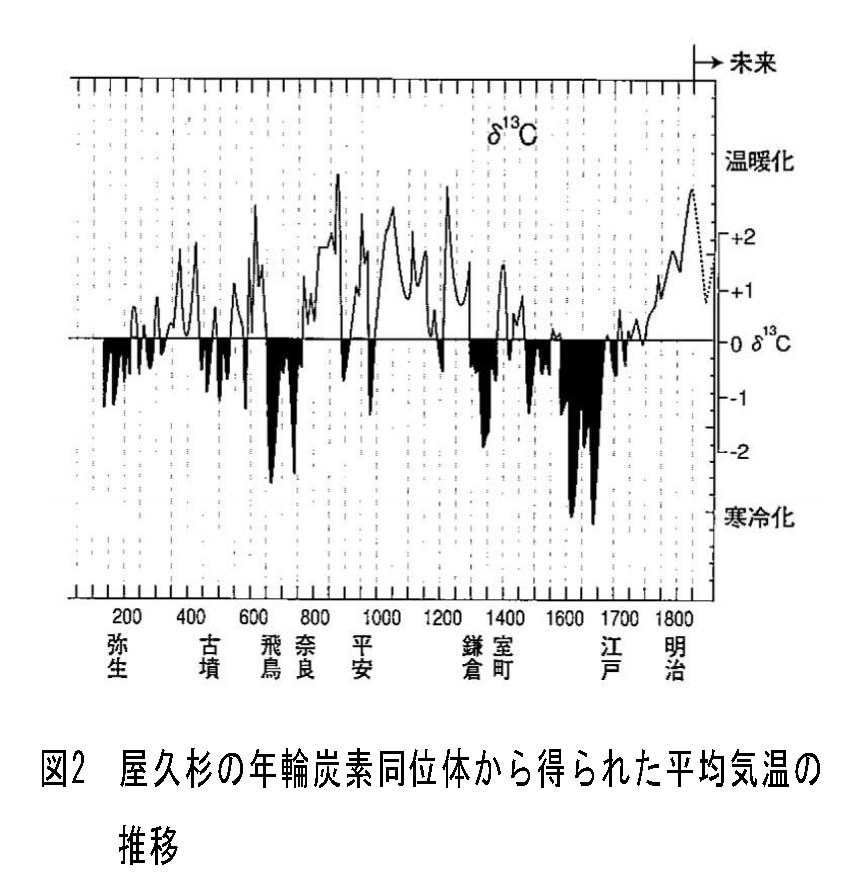
Fig. 8: Japan climate history, Kitagawa, H. and Matsumoto, E., Geophysical Research Letters, Vol. 22, 2155-2158, 1995
And the temperature history of China:
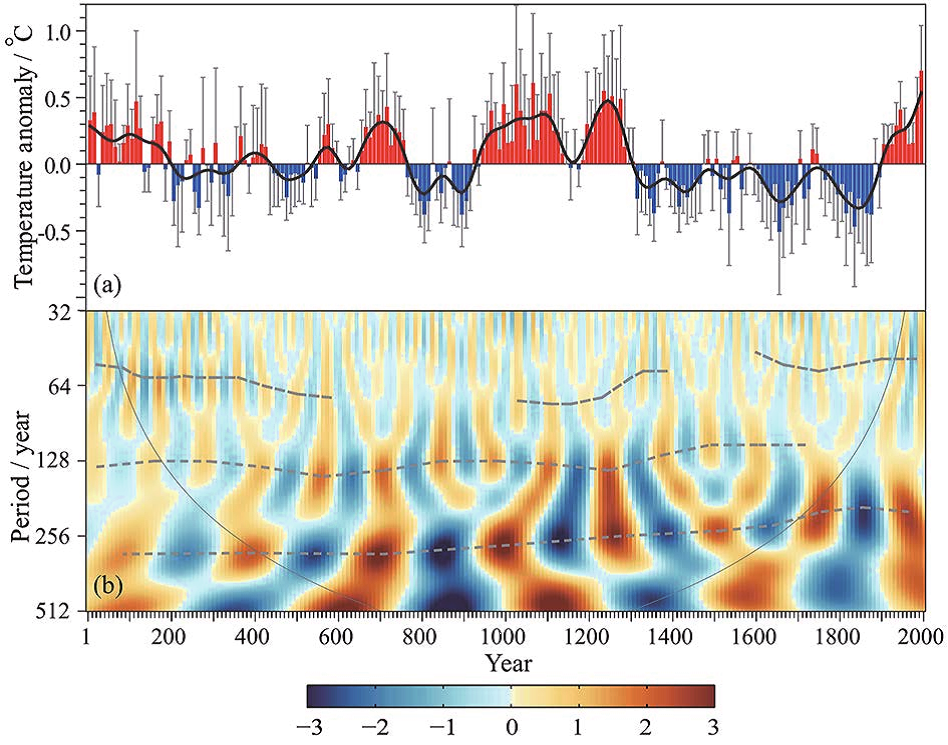
Fig. 9: Quansheng GE. et al., Advances in atmospheric sciences, Vol. 34, 941-951, 2017.
In summary, Climate variability is largely tied to solar activity, and trace gas CO2 has little to do with it.


The science community’s faith in NASA’s and NOAA’s data especially temperature data, is unwarranted.
The global temperature is not rising but temperature data is being altered.
https://realclimatescience.com/2020/10/new-video-alterations-to-the-us-temperature-record-part-one/
https://realclimatescience.com/2020/10/new-video-alterations-to-the-us-temperature-record-part-2/
https://newtube.app/user/TonyHeller/xEyXN2e (temperature alterations part 3)
https://realclimatescience.com/2020/10/new-video-how-the-us-temperature-record-is-being-altered-part-3/
This is why the IPCC has no credibility.
https://www.youtube.com/watch?v=K_8xd0LCeRQ
If the corrections fixed known problems in the instruments, that would help accuracy. But they are statistical. They make the station measurements smoother when mapped and they smooth over discontinuities. In my opinion, NOAA has overdone it. TOB, PHA, infilling and gridding are overkill. This is easily seen in Figure 7 and by comparing Figure 3 to Figure 6 or Figure 5. Does the final trend in Figure 3 more closely resemble the measurements (Figure 6) or the net corrections in Figure 5? The century slope of the data is 0.25°, the corrections add 0.35° to this and the “climatological gridding algorithm” adds 0.9°! It is worth saying again, the type of statistical operations we are discussing do nothing to improve the accuracy of the National Temperature Index, and they probably reduce it.
https://wattsupwiththat.com/2020/11/24/the-u-s-national-temperature-index-is-it-based-on-data-or-corrections/
https://principia-scientific.org/damning-ruling-posted-in-the-mann-v-ball-trial-of-the-century/
https://principia-scientific.org/breaking-michael-mann-doubles-down-over-contempt-issue/
https://principia-scientific.org/breaking-news-dr-tim-ball-defeats-michael-manns-climate-lawsuit/
https://principia-scientific.org/why-did-michael-mann-lose-his-global-warming-lawsuit/
https://principia-scientific.org/ten-years-after-climategate-time-to-prosecute-michael-mann/
https://principia-scientific.org/climategate-untangling-myth-and-reality-ten-years-later/
“The Pacific Climate Shift occurred at 1977 with solar activity increase & a positive PDO index.”
That’s backwards. Strong solar wind states in the early to mid 1970’s drove a cold AMO and multi-year La Nina. Late in 1976 the solar wind strength plummeted and switched the AMO and ENSO strongly warm. Weaker solar wind states since 1995 have driven a warm AMO phase and have increased El Nino conditions.
It is beyond ridiculous to say that anything other than the sun is THE major driver of our weather and climate.
It is the sun, and not any atmospheric CO2, that sets-up the temperature differential from equator to poles, and from sun facing side of the planet to the nighttime side. Without these temperature differentials there is no weather and no climate change. Atmospheric CO2’s effect is to feed the plants, and much later this planet greening effect will alter so aspects of the weather and influence the climate.
[…] Japanese Climate Scientist Kyoji Kimoto: “Climate Change Governed By The Sun”, CO2 Lesse… […]
Also can someone explain to me how a layer of control prevents heat escaping earth but does not also stop heat entering earth??
Would that not balance out and cause no temperature change at ground level??
Serious question from a confused observer!
[…] P. Gosselin, Jan 22, 2021 in […]