It has been assumed COVID lockdowns and their associated reductions in human CO2 emissions would be a “step in the right direction” with regard to climate change mitigation. But a new study finds the particulate (aerosol) pollution reductions from less industrial and transportation activity in Europe during the months of March to May (2020) actually led to an increase in surface radiative forcing ~65 times greater than from business-as-usual CO2 emissions.
From one year to the next, the gigatons of carbon (GtC) increase from human activity typically has averaged +0.1 to +0.2 GtC since 1900 (Koutsoyiannis and Kundzewicz, 2020). In 2020, however, CO2 emissions plummeted and the annual emissions rate fell by -0.75 GtC (see the red bar on the far right). Despite this dramatic decline, the atmospheric CO2 levels rose by a little more than 2 ppm in 2020, which is essentially the same growth total as previous years.
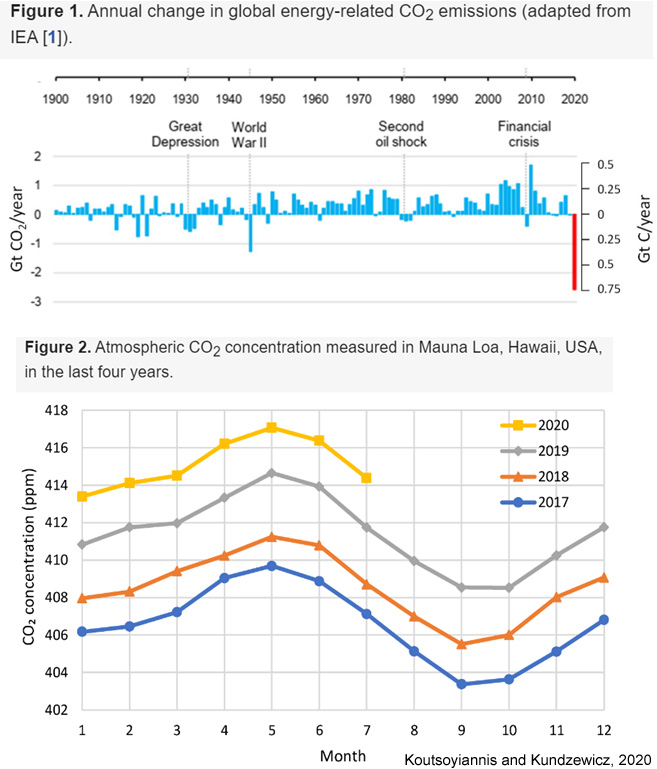
Image Source: Koutsoyiannis and Kundzewicz, 2020
1 month of atmospheric CO2 increases results in 0.0017 W/m² radiative forcing
But even if we were to assume that human CO2 emissions reductions from COVID lockdown policies actually did (do) have a quantifiable impact on the year-to-year change in atmospheric CO2 concentrations, the total net radiative impact of a ~2 ppm increase in CO2 concentrations over the course of 12 months amounts to about 0.02 W/m², which is the extrapolation from the 0.2 W/m² per decade (22 ppm) radiative forcing determined by Feldman et al. (2015). On a per-month basis, the additional forcing from atmospheric CO2 would thus be 0.0017 W/m².
Image Source: Feldman et al., 2015
2 months of traffic/industry pollution reduction results in +2.3 W/m² forcing
A new study (van Heerwaarden et al., 2021) finds the “consequent changes to the atmospheric composition and the radiation balance” of “less traffic and industrial activity” resulting from two months (late March to late May, 2020) of Europe’s COVID lockdowns led to an increase in aerosol optical depth radiative forcing (a warming influence) of +2.3 W/m². This would be the radiative equivalent of more than +1.1 W/m² per month, which is about 65 times larger than the 0.0017 W/m² monthly impact from atmospheric CO2 increases.
Succinctly put, the total net human impact on climate is realized far more profoundly by adding to or reducing our industrial/traffic particulate or pollutive output than by altering our CO2 emissions. Assuming the goal actually is to reduce the human contribution to Earth’s radiation imbalance, climate policies that solely focus on CO2 emissions mitigation are therefore rather pointless.
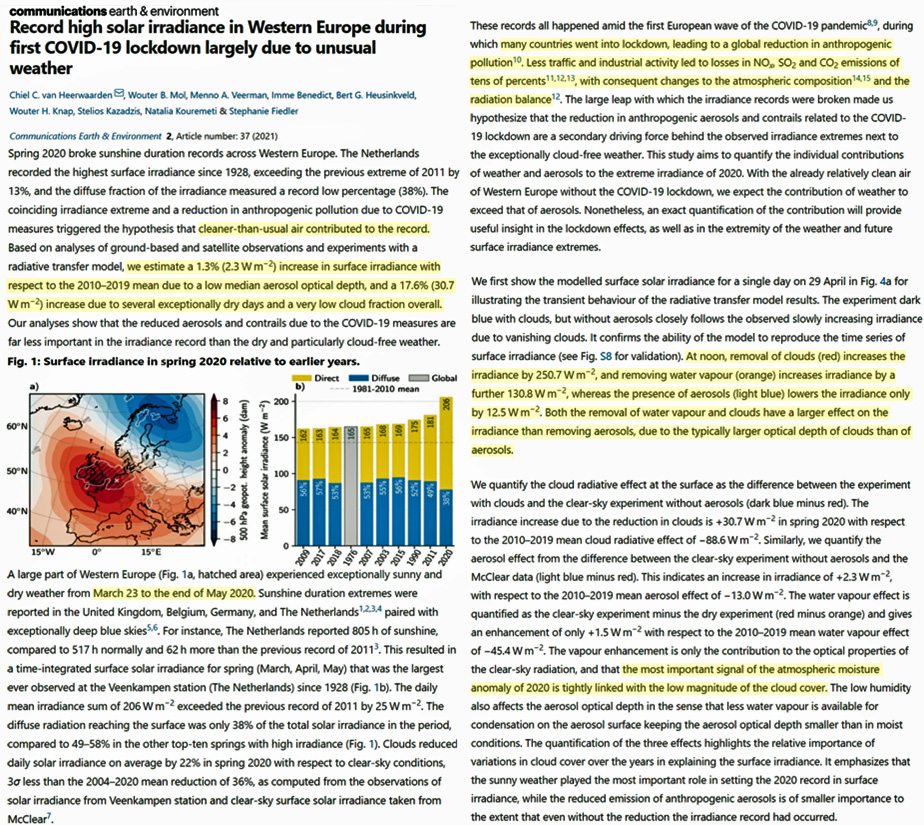
Image Source: van Heerwaarden et al., 2021
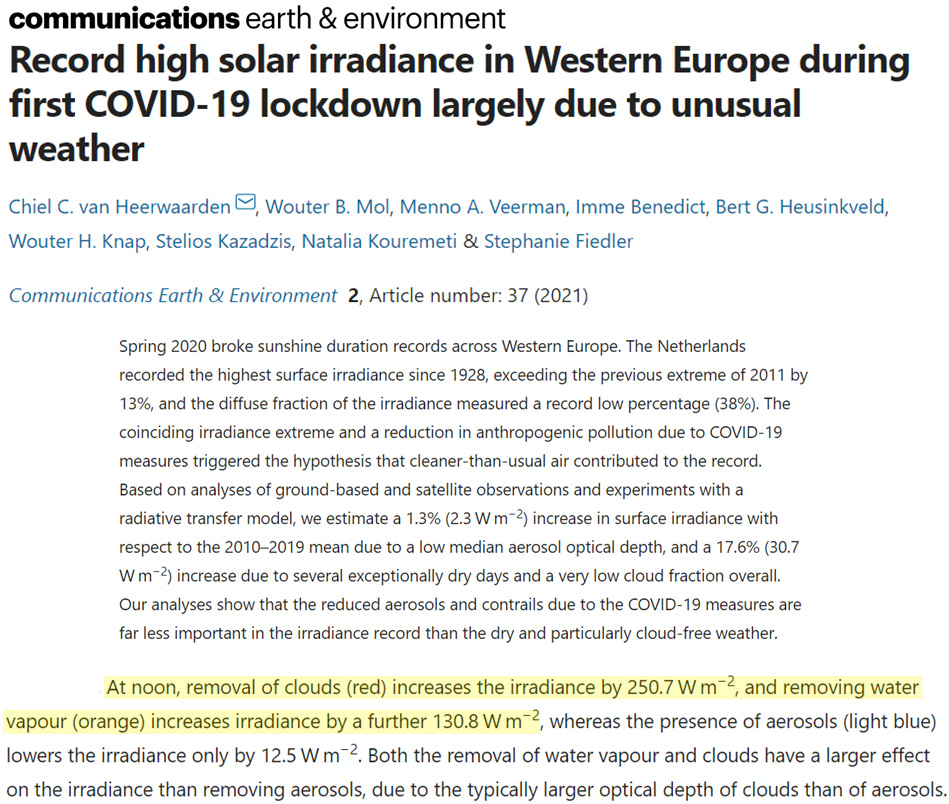
Removing a greenhouse gas, water vapor, from the atmosphere leads to +131 W/m² additional forcing
The van Heerwaarden study emphasizes the role of cloud cover in driving the dramatic increase in radiative forcing during the spring of 2020. The authors seem to make the case that clouds and water vapor are the dominant radiative forcing variables in the Earth’s greenhouse effect, but also that removing clouds and water vapor actually has a far greater radiative impact than their influence as greenhouse warming agents.
The authors note that a cloud-free day at noon results in an extra +251 W/m² of radiative forcing relative to a cloudy day at noon. Removing water vapor , a greenhouse gas, leads to a forcing increase of +131 W/m².
In contrast, it has taken 265 years of CO2 increases (1750-present) to exert a total net radiative impact of 1.82 W/m² (Feldman et al., 2015).
If removing a main greenhouse gas (water vapor) from the atmosphere actually results in a sharp increase in radiative forcing, then there would appear to be something amiss with the greenhouse effect paradigm.


I sense researchers are learning, despite themselves, that CO2 is not a significant factor in atmospheric temperature.
Thanks for finding these articles.
John
Clean air act is to blame for the warming!
SO2 emissions is down 90% since 1990.
More sun is a trend since 1980.
https://www.smhi.se/polopoly_fs/1.158487.1584112368!/image/allsack_1983-lastyear.jpg_gen/derivatives/Original_1256px/image/allsack_1983-lastyear.jpg
There are many aspects in play, but indeed it is solar insolation rather than solar irradiance that matters for terrestrial climate and weather…
… as I tried repeatedly (and apparently failed) to explain to some interloping bonehead in these pages last month…
[…] New Study Inadvertently Slays The Narrative: Emissions Reductions From Lockdowns Added WARMING! […]
Let’s not forget that the measurements made by Feldman were done using super-cooled sensors, and that the mean path length of CO2 wavelength radiation at atmospheric pressure is some 10-30m
ie they CREATED the conditions required to make a temperature gradient from warmer to colder for the CO2 net radiation to follow.
Even then it was a TINY INSIGNIFICANT amount of very low energy radiation that was observed.
A total non-event !
The study includes data over a very short period of time.
A one time short-term event that no one wants to happen again.
What purpose does it serve?
The AGW community has repeatedly shown themselves willing to jump right off the mark in definitively declaring a one-week heat wave in the middle of unseasonably cool weather to have been caused by climate change, and you’re decrying conclusions drawn from an entire year of observation?
Does anyone believe this ridiculous radiative forcing nonsense ?
Only the solar radiation can cause an increase in surface temperature.
Refer to the ludicrous construct of the “blue plate green plate” postulation using the SB blackbody law to do calculations and then do exactly the same math using Planck curves and the indisputable calculus relationship that the integral of f(t1) (the area under a Planck curve for t1) + the integral of f(t2) (the area under a Planck curve for t2) DOES NOT result in a Planck curve as their failed maths claims BUT the laws of integrals says this must because :
the integral of f(t1) + the integral of f(t2) = the integral of (f(t1) + f(t2))
Therefore P1 = sigma(t1)^4 + P2 = sigma (t2)^4 does NOT equal the calculated temperature for P1 + P2 !!
Thus all of climate science’s maths is plain wrong – or calculus is – take your pick but I’ll stick with calculus which allows engineering and putting people on the moon anyday over the quacks who make up climate “science” BS 1
This would also be compatible with Geoengineeringwatch.org Theory, that the real (unmitigated) warming is high, plantet is cooking etc., but the temperature measurments are too optimistic because of the ongoing geoengeneering effors. That is what is often portrayed as “proposals” of spraying atmosphere with particles to stop sun rays etc. is actually an ongoing operation.
This could be because when passenger planes were stopped because of the pandemic, then geoengeneers could not explain spraying high atmoshpere with particles as being just contrails, so they had to stop for a while?