Since the last day of 2001 CO2 has risen from 372 to 419 ppm. However, there have been two cooling periods of 12 years (2002-2014) and 7.5 years (2014-2021), separated by a 1.5-year El Niño-induced warming event (2015-2016). Temperature changes that proceed in step- or event-like fashion do not seem to correlate well with linearly-rising CO2 concentrations.
HadCRUT4 temperature data (made available for public use by WoodForTrees.org) now presents a slight cooling trend since the first few months of 2014.
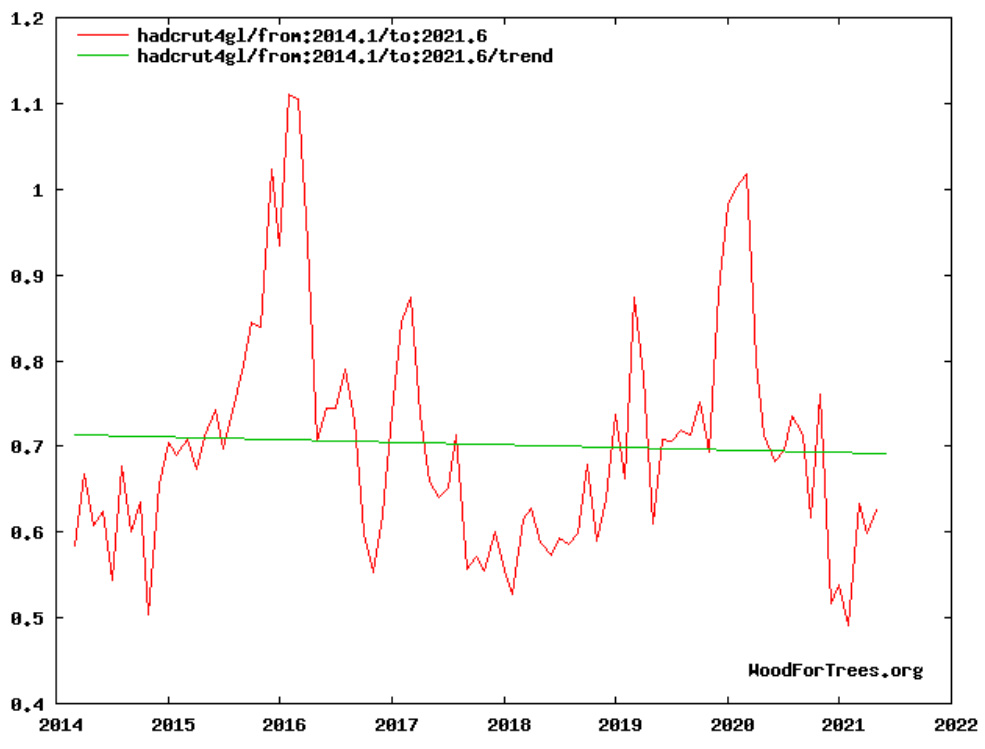
Image Source: WoodForTrees.org
This new cooling trend follows an abrupt El Niño-induced warming event and a 12-year cooling trend that lasted from the first month of 2002 until the last month of 2014.
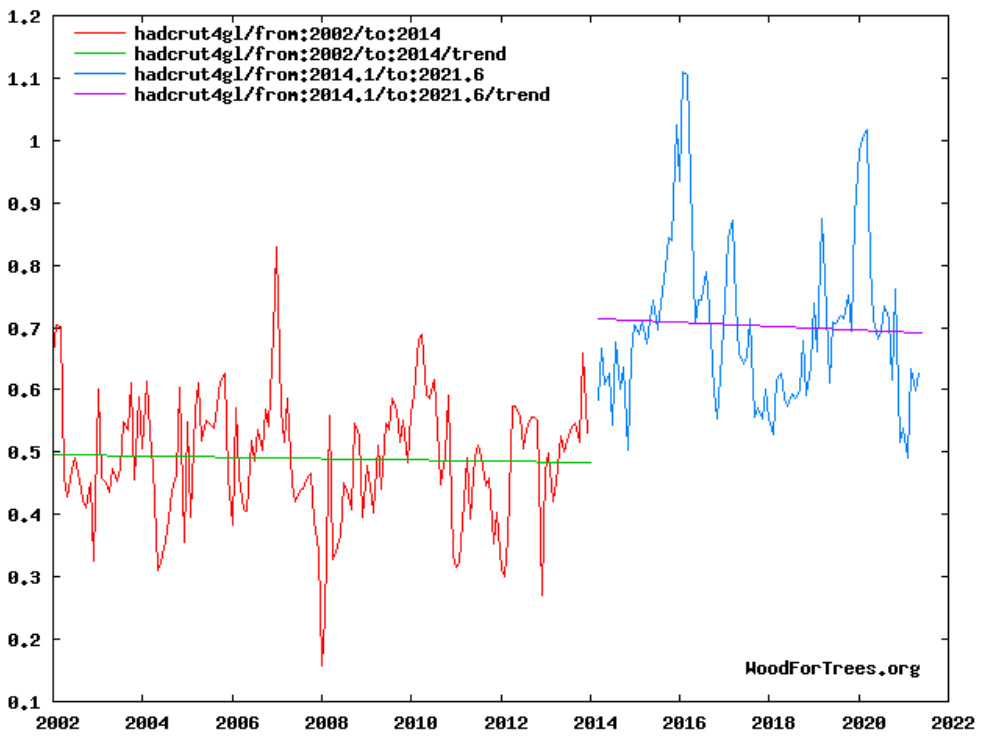
Image Source: WoodForTrees.org
As mentioned, the abrupt warming event that spanned from 2015 to mid-way through 2016 was generated by an anomalous El Niño. Fossil fuel emissions had “a fairly insignificant role, if any role at all” in this short-term warming.
If we were to compare the linearly-rising CO2 trend to the two warming pauses and naturally-occurring El Niño event, there would not appear to be an especially strong link.
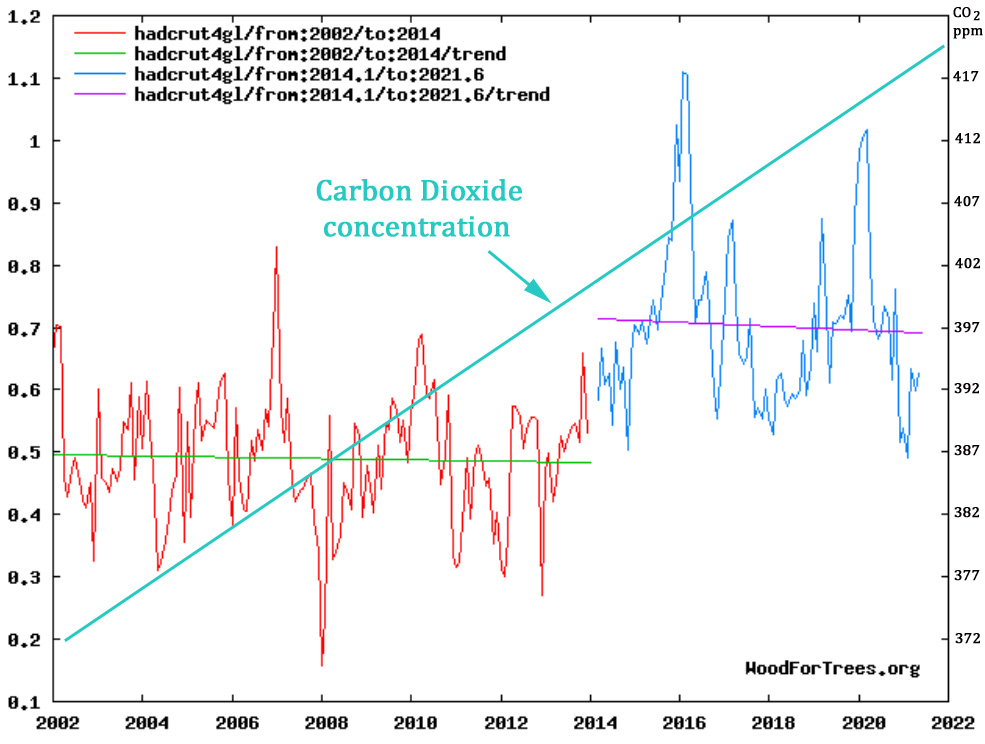
Image Source: WoodForTrees.org
Another warming pause as CO2 sharply rises will not fluently advance the cause for the next IPCC report (AR6).
Just in time, HadCRUT5 will be introduced soon as the full replacement for HadCRUT4. There will likely be significant changes to the data, including the elimination of this most recent temperature pause.
It has happened before. HadCRUT3 identified a cooling trend from 1998-2012. So the HadCRUT4 version changed the data just in time for the 5th IPCC assessment (AR5, 2013). The 1998-2001 temperatures were allowed to stay the same, but an additional 0.1 to 0.2°C was tacked on to anomalies from 2002 onwards. The effect was to transform the 1998-2012 slight cooling in HadCRUT3 into a 0.05°C warming in HadCRUT4.
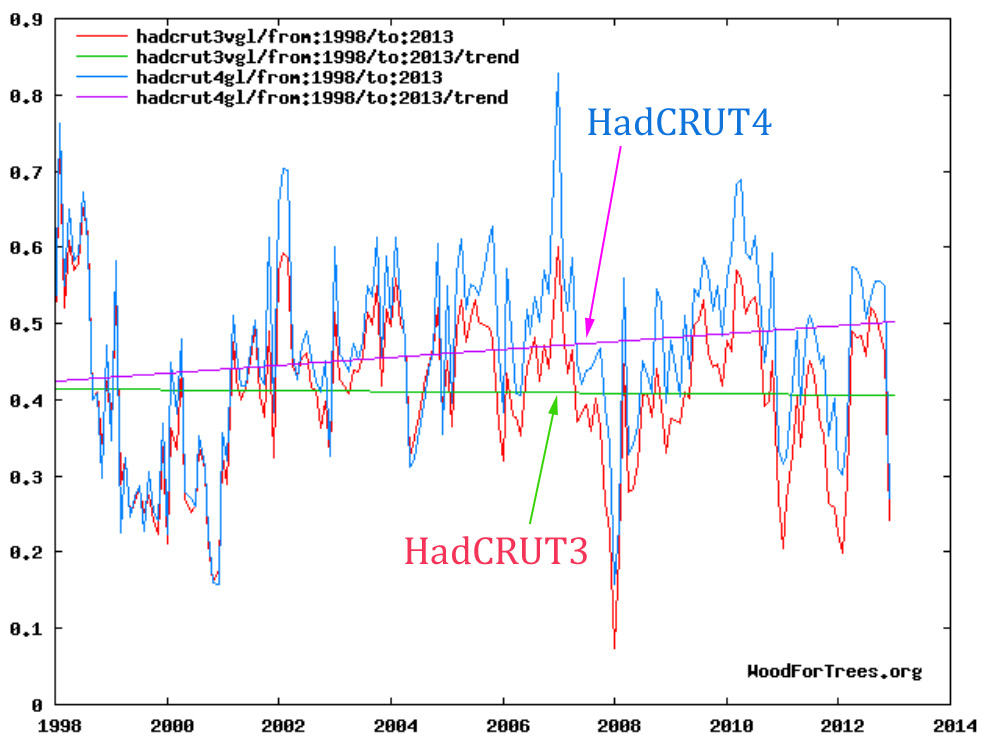
Image Source: WoodForTrees.org
Changing data to advance the anthropogenic global warming cause is no longer even surprising. It’s expected.


[…] Zdroj: https://notrickszone.com/2021/07/19/the-hadcrut4-global-temperature-dataset-now-unveils-a-cooling-tr… […]
How does CO2 cause “steps” in temperatures? Is any of that chart consistent with the quantum physics of the CO2 Molecule and the GHG Effect?
CO2 … do you know of anyone who has given Steven Koonin’s book Unsettled a good review – specifically his discussion of CO2 ?
I think it is flawed and would like to see some discussion of his “science” by folks that can better identify the problems with Steven’s work.
I am tending to agree with you.
Koonan makes statements on page 50 & 51 that can be challenged pertinent to Green House Gases intercepting or impeding.
P. 57 in the 2014 book About Face ! Why the World Needs More Carbon dioxide
by Hughes, Khandekar and Ollier They assert that all gases are heated by infrared from the warm earth not just Green House Gases. Changes in the temperature of the Atmosphere can come from radiation, conduction, and convection Alarmist Green house gas models are based on radiation alone. Convection and conduction are more important in affecting the Earth’s atmosphere.
Please stay on topic!
[…] Related: The HadCRUT4 Global Temperature Dataset Now Unveils A Cooling Trend For The Last 7.5 Years […]
[…] Don’t worry. They have a solution. […]
This is an excellent way to characterize climate change. Not a monotonic progression toward certain doom, but a repeating pattern caused by a poorly understood external reality that has been with us for millions of years.
They will control the earth’s temperature when they can control El Nino.
https://rclutz.com/2021/05/08/adios-global-warming/
The thing about such events as the 2016 El Niño level and the American western seaboard temperatures is that they are unlikely to be matched for a long time thus presenting a presentational problem to alarmists as the years roll by . Look, we’re cooling!
This article is meaningless and embarrassing data mining of short term trends, with the timing selected to imply the global warming trend since 1975 has ended.
That 45 year global warming period since 1975 included a flat temperature trend from 2002 to mid-2015, but that was temporary.
The minimum data for a climate trend is 30 years.
30 years of HadCRUT data are available, but they are ignored for this article’s focus on short-term trends.
Let the climate alarmists do the data mining.
Climate realists should know better.
Kenneth Richard should know better.
As a result of publishing this deceptive data mining article, this website is no longer the best climate realist website in 2021.
As a climate realist, with a climate science and energy blog that has had over 212,000 page views, I expect more from other climate realists.
I’d like to spend 100% of my time scolding the climate alarmists and their never ending, always wrong, wild guess predictions of a coming climate crisis, now in their sixth decade.
I trace the beginning of that prediction to oceanographer Roger Revelle in 1957.
But at least Revelle had great uncertainty, and didn’t rush to the media, hysterical and waving his arms, declaring the end of the world.
The so called government bureaucrat “scientists” today forgot what uncertainty is. But they love scary climate change fairy tales.
“The minimum data for a climate trend is 30 years.”
I don’t have 30 years. Need to know now.
ha ha
1991 to 2021 is 30 years
1981 to 2021 is 40 years
I don’t know what you need to know,
but if is the future climate, good luck.
Flip a coin.
Don’t ask a climate alarmist.
The second chart in this article,
where it is obvious 2014 to 2021
was warmer than 2002 through 2014
is a total embarrassment for this
otherwise fine website.
I treat climate realists and climate alarmists
exactly the same. Data mining of short term trends
is not good science, no matter who does it.
There are enough ridiculous
climate alarmist proclamations
to refute.
Data mining is a waste of time
and hurts climate realist credibility.
“This article is meaningless and embarrassing data mining of short term trends,…”
No. This article addresses how warmists tamper with the data in order to drive a desired narrative. Exposing their deceit is not meaningless, and the only ones who should be embarrassed are they.
Of course deceit is common among warmists.
It is a full time job to uncover.
But deceit is also the subject of this article.
We climate realists should be honest.
Look at the second chart.
It is VERY OBVIOUS that 2014 through 2021
was warmer than 2002 through 2014.
Yet the author has data mined the years and
attempted to show two short-term declining trends.
This is an obvious deception that even a
climate alarmist can spot instantly.
In the 24 years I’ve followed climate science
I’ve seen climate realists use this “trick”
quite a few times. It’s time to stop.
I’ve tried to explain this so you understand
the climate is always changing, so there cab be
short-term declines within a long term
warming trend.
Pointing out a short term decline,
created with careful selection of the
start and end points (aka “data mining”)
does not mean the long term warming trend
has ended. That long term warming end,
by the way, started in the late 1600s.
In your “24 years of following this,” Richard, what have you learned about La Niña and El Niño?
Kenneth appears to be talking about the very real correlation between La Niñas and the temperature jumps they cause, which are followed by plateaus. Those are very short term events, and can’t be dealt with otherwise.
https://wattsupwiththat.com/2019/01/20/does-the-climate-science-industry-purposely-ignore-a-simple-aspect-of-strong-el-nino-events-that-causes-long-term-global-warming/
”It was a little more than 10 years ago that I published my first blog posts on the obvious upward steps in the sea surface temperatures of a large portion of the global oceans…upward steps that are caused by El Niño events…upward steps that lead to sunlight-fueled, naturally occurring global warming.”
I don’t see any way of exposing HADCRUT short/term data tampering than to examine the periods during which it is happening. Kenneth Richard’s treatment of this is completely appropriate to the problem he’s addressing.
.
CORRECTION – El Niño’s cause spikes, not La Niñas.
I agree it could be classified as “deception” or even “deceit” (your word choices) if the article claimed or even attempted to claim there has been an overall cooling since 2002. It did not claim this. It pointed out that a short (1.5 years), ENSO-induced warming event was separated by a 12-year (used to be 15-year, extending since the last major ENSO event until data were changed) and now 7.5-year cooling trends. The point of this was not to insist the overall trend is cooling or “the warming trend is over”, but that a natural ENSO event may be considerably responsible for changing the sign of the trend in a step-like fashion. If warming is from linearly-rising CO2 as claimed by AGWists, a step-like change in 1.5 years followed or preceded by years of non-warming would not seem compatible with this contention. Since natural ENSO events that bust cooling trends are not assessed to be the cause of an overall warming trend by AGWists, this contention would appear to be incompatible with the temperature data shown.
An image illustrating step-like increases over a longer-term period can be found in Belohpetsky et al., 2017.
Pointing out incompatibilities is the intention of this article. Another intention was to point out the data manipulation conducted by the Met Office from HadCRUT3 to 4, changing cooling to warming.
I understand there is also a “manipulation” issue with cherry-picking short-term periods that show warming or cooling to amplify or undermine a favored or unfavored point of view. I took that risk (understandable criticism) in this case because I thought it was interesting that it’s not just the (perceived skeptic-favorable) UAH record that has a cooling trend since 2015, it’s HadCRUT4 that has one too…and it’s a year longer, beginning in 2014.1 using available data (WFT). It’s also interesting that, by warming up the post-2001 temps and leaving the 1998-2001 temps alone, HadCRUT4 only shortened the cooling trend by 3 years. It’s still there from 2002-onwards rather than from 1998 like it was in HadCRUT3 (before data were changed).
I do understand the criticism and the reason why you’ve leveled it and I have no problem with it. I knew there was a potential for this criticism, but took the plunge anyway because of the reasons outlined above.
Carry on.
Look at the paleo data. What does it say? This warming period lasted 30 years.
It is over because the sun has changed.
There are strange unexplained cycles of warming, in the paleo record, during which it is fact that there is unexplainable warming on the Greenland Ice sheet, including during the Glacial period.
These warming periods disprove AGW. What causes them? What is the mechanism? It cannot be CO2 based on the CO2 record? It is solar cycle changes.
During these periods, the Greenland ice sheet warms for 20 or 30 years.
These warming periods are named after the climatologists who discovered the warming on the Greenland ice sheet, Dansgaard-Oeschger.
http://www.climate4you.com/images/GISP2%20TemperatureSince10700%20BP%20with%20CO2%20from%20EPICA%20DomeC.gifd
The peculiar solar cycle 24 – where do we stand?
http://wattsupwiththat.files.wordpress.com/2012/09/davis-and-taylor-wuwt-submission.pdf
http://iopscience.iop.org/1742-6596/440/1/012001/pdf/1742-6596_440_1_012001.pdf
These warming cycles also occur in the Southern Hemisphere. And have the same periodicity as the warming cycle in the Northern Hemisphere.
Davis and Taylor: “Does the current global warming signal reflect a natural cycle”
…We found 342 natural warming events (NWEs) corresponding to this definition, distributed over the past 250,000 years …. …. The 342 NWEs contained in the Vostok ice core record are divided into low-rate warming events (LRWEs; < 0.74oC/century) and high rate warming events (HRWEs; ≥ 0.74oC /century) (Figure). … …. "Recent Antarctic Peninsula warming relative to Holocene climate and ice – shelf history" and authored by Robert Mulvaney and colleagues of the British Antarctic Survey ( Nature , 2012, doi:10.1038/nature11391),reports two recent natural warming cycles, one around 1500 AD and another around 400 AD, measured from isotope (deuterium) concentrations in ice cores bored adjacent to recent breaks in the ice shelf in northeast Antarctica. …. (William: Same periodicity of cyclic warming and cooling in the Northern hemisphere), measured from isotope (deuterium) concentrations in ice cores bored adjacent to recent breaks in the ice shelf in northeast Antarctica)
This is a link to Greenland Ice sheet data from Richard Alley’s paper.
The link in my above comment did not work.
http://www.climate4you.com/images/GISP2%20TemperatureSince10700%20BP%20with%20CO2%20from%20EPICA%20DomeC.gif
“Modern” climate science ignores 4.5 billion years of climate history.
In 1995 the IPCC declared natural causes of climate change were “noise”.
The only causes left were man made.
That’s pure junk science.
I would caution you about predicting the warming trend is over.
Predictions of the future climate have been notoriously inaccurate in the past. Remember that the coming climate change crisis is nothing more than a prediction. We need fewer climate predictions, not more !
The most significant long-term indicator is sea level rise. The graph shows stability over the past 10,000+ years. Sea level is now up about 400+ feet. About 6,000 years ago the rate of sea level rise began dropping. That has continued. However, the annual rate of sea level rise is now minuscule, 1 to 3mm per year. (1mm = 4/100 of one inch). Glacier melt rate is obviously dissipating. Since we’re already 10,000+ years into the current warm period betwixt glaciations, we’re likely nearing the next glaciation. That’s SERIOUS. Among other things, an average 90,000 year duration as opposed to our current average 10,000 years of pleasant warming.
Either way, the trend is towards cooling. That is also consistent with a 65 million year cooling trend (and likely the reason the term “ice age” has been changed to “glaciation”)
None of this should be surprising. After all, there is no evidence that CO2 has any impact on warming. Recently Oslo researchers have demonstrated, via experiment, that CO2 between .04% and 100% has no observable impact on warming. This is further exacerbated by the alarmist computer modelers ALL assuming that water vapor feedback is their real culprit, causing 2 to 3 times the temperature increase as supposedly brought on by increasing CO2. That assumption depends on the applicability of the GHG theory when dealing with the open atmosphere.
There’s another indicator, sun spot activity. Don Easterbrook points out in his study (an entire book) that, during the past 800,000 years, every warming and every cooling coincides with the level of sun spot activity. Separately Henrik Svensmark pointed out during the 90s that periods of higher sun activity generate a shield resulting in a lower level of cosmic rays entering the lower atmosphere. Cosmic rays influence the level of cloud cover (confirmed by CERN).
The paragraph:
“Either way, the trend is towards cooling. That is also consistent with a 65 million year cooling trend (and likely the reason the term “ice age” has been changed to “glaciation”)”
should have appeared after the last paragraph ending with “CERN”