The One Oscillation That Rules Them All
By David Archibald
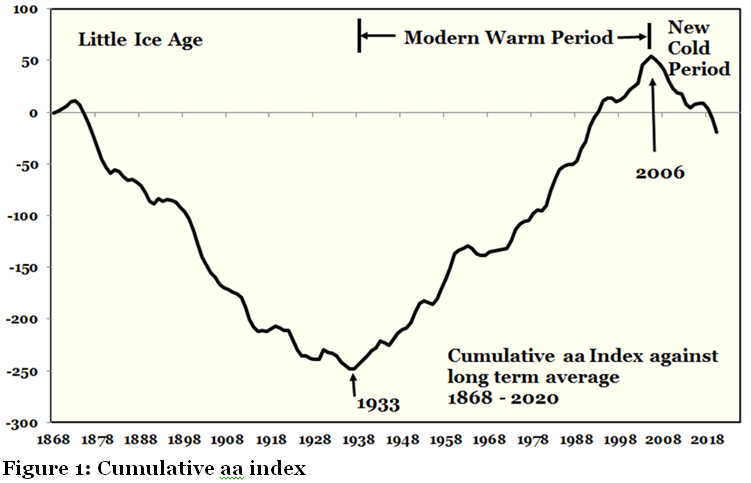
Cumulative graphs, in which changes in the individual values from time period to time period are added, are powerful for showing changes of trend in a series. Thus the cumulative graph of the annual average solar aa Index (a geomagnetic index) nails the beginning and end of the Modern Warm Period:
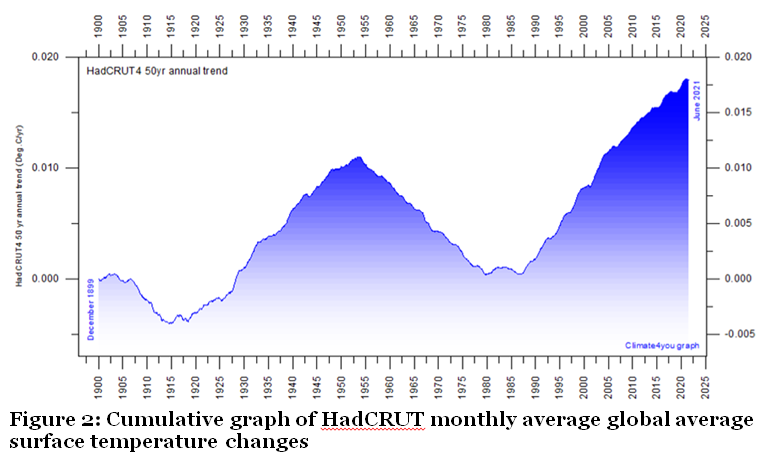
Professor Ole Humlum, based in Svalbard near the Arctic Circle, has a trove of climate data at his website Climate4you. This includes a graphic of the cumulative graphic technique applied to the HadCRUT series of monthly global average surface air temperatures. It is found half way down this page, entitled ‘Cyclic air temperature changes’.
The changes of trend evident have no apparent correlation with any solar data series including the solar cycles, both Hale and Schwabe. I was rereading a book I wrote in 2014 entitled Twilight of Abundance for a new polemic when I came across this paragraph on page 14:
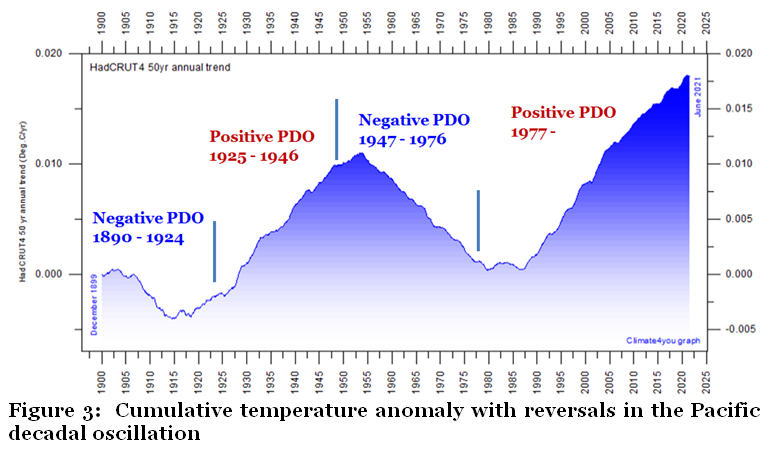
Overprinted on long term solar-driven warming is the Pacific Decadal Oscillation (PDO) which produces large swings in climate. The PDO is a long-lived El Niño-like pattern of Pacific climate variability, though PDO events last for 20-to-30 years, while typical El Nino events persisted for only 6 to 18 months. Negative PDO regimes prevailed from 1890-1924 and again from 1947-1976, while “warm” or positive PDO regimes dominated from 1925-1946 and from 1976 through to 2008. Major changes in northeast Pacific marine ecosystems have been correlated with phase changes in the PDO; warm eras have higher coastal ocean biological productivity in Alaska and inhibited productivity off the west coast of the contiguous United States, while cold PDO eras have seen the opposite north-south pattern of marine ecosystem productivity. After 30 years in a warm phase, the PDO appears to have switched to a cool phase which could also last 30 years. “
The Pacific Decadal Oscillation was named by Nathan Mantua and his co-authors of their paper: A Pacific Interdecadal Climate Oscillation with Impacts on Salmon Production, who noticed it while studying salmon production patterns.
The Pacific Decadal Oscillation is detected as warm or cool surface waters in the Pacific Ocean, north of 20°N. Reversals in the distribution of warm versus cool water correspond with dramatic shifts in salmon production regimes in the North Pacific Ocean.
When the dates of the Pacific Decadal Oscillation are plotted on the graphic from Climate4you, the correlation is strong:
Given the noise from El Nino events and solar cycles, we have found the proximate cause for the major changes of temperature trend for the planet. Given the size of the North Pacific, you would not be surprised to find that it has a response at the planetary scale.
The satellites that measure the temperature of the atmospheric column were launched soon after the last reversal in the Pacific Decadal Oscillation. The significance of Figure 3 is that the apparent global warming over the last 40 years, that has been studied in great detail, that has caused great angst, is likely to be just an artefact of the phase of the Pacific decadal oscillation. Now that is sorted, can we all go home now?
Salmon production is not the only thing controlled by the state of the Pacific decadal oscillation. The greens and ecoloons had been predicting a new ice age right up to the 1976 Pacific Climate Shift. With the change of the Pacific decadal oscillation in that year they flipped to predicting warming instead.
There is still the potential for a scary scenario out of this. At 44 years long, the current positive phase of the Pacific decadal oscillation is long in the tooth and should be reversing soon of its own accord. This will coincide with the rapid drop in solar activity underway, speeding up the cooling process. The appropriate cultural reference is from the movie Aliens: “We’re on an express elevator to hell. Going down.”
Solar Cycle 25 is shaping up as being half the amplitude of 24. This is supported by the divergence in their UV output as shown by this graph from the University of Bremen:
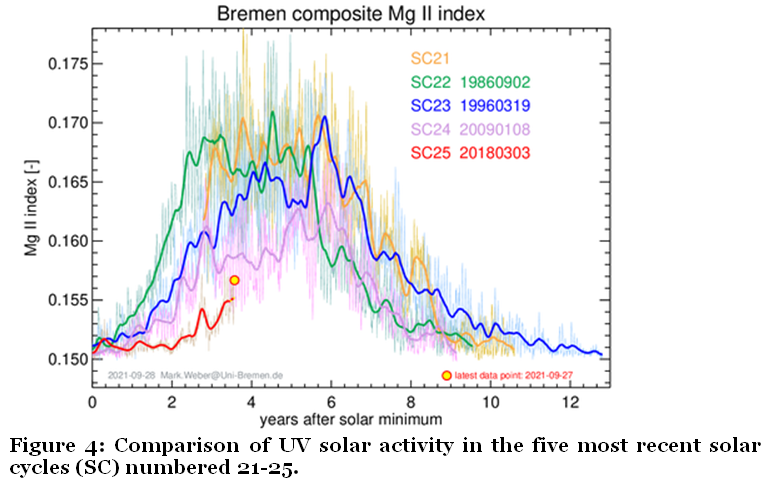
The thick curves show the Mg II index time series twice smoothed with a 55-day boxcar. Dates of minima of solar cycles were determined from the smoothed Mg II index.
On top of all that, the last volcanic eruption big enough to have an effect on the Earth’s climate was Mt Pinatubo in 1991, now 30 years ago. Volcanic eruptions of that magnitude occur at an average of 40 years apart, so we are coming due for one on average. The combination of a major volcanic eruption overprinted on a deep solar minimum is the setup like that of the ‘Year Without A Summer’ – 1816 when the Mt Tambora eruption overprinted the Dalton Minimum. In 1816 the oats price in the northeastern US went from 10 cents a bushel to 90 cents a bushel. Oats were what horses ran on and were the equivalent of today’s diesel and gasoline.
On the subject of agricultural prices, world wheat stocks have fallen dramatically this year and are equal to the lowest levels of the stocks-to-consumption ratio this century. The setup just gets better and better.
==========================================
David Archibald is an Australian scientist and petroleum geologist. Among other books, he is the author of American Gripen: The Solution to the F-35 Nightmare


Surprising how wrong is this article. Or perhaps not.
Talking about the LIA in the mid-19th century is silly. Even if we consider the Dalton period part of the LIA, and we should not, it was done by 1840.
Bremen has the wrong UV cycle. They start the new UV solar cycle about a year and a half before the solar minimum. SC25 is almost equal to SC24 in solar activity and in UV irradiation.
PDO and AMO are multidecadal oscillations in SST and SLP. They are a consequence not a cause.
David Archibald has been predicting cooling for decades. Eventually he will be right if he lives long enough. So far he has been wrong.
While you claim to have a superior understanding of the importance of these issues, you have not provided any contrary evidence to contradict the presentations by Archibald. While the LIA is proclaimed to ended in 1850, this really only marks the point in time when the earth’s temperature began to warm significantly while a colder climate persisted for a further 30 or 40 years. The thrust of the article which you seem to be unable to understand, is that the changes in the earth’s temperature follow very closely the trends of clearly identifiable physical phenomena rather than having anything to do with the simple, unstructured constant increase in atmospheric carbon dioxide.
In addition, the so-called “model of a greenhouse gas free Earth” used by the IPCC and which I believe may have been constructed and promoted by Manabe in about 1980 to try to demonstrate that carbon dioxide in the atmosphere may cause heating of the atmosphere. This attempt involved the representation by a thin, black weightless shell with none of the thermally active soils and air (nitrogen and oxygen) which cannot on its own absorb or emit the infrared radiation emitted by the soil’s surface at the temperatures achieved by that surface under the sun.
This bare, unrealistic model cannot retain heat from the sun as do both soil and air which under the sun reach temperatures as high as 360 Kelvin. The mean temperature of this thin shell is not used even though the temperature being sought is the mean temperature of the whole earth which is defined from measurements in the air – not the soil’s surface – to be 15 C (288 Kelvin). In stead a quite different artificially defined temperature which by definition is uniformly distributed over the whole earth and has no relationship to the all important energy which is directly related to actual temperature at a point and to the mean of all of those temperatures.
This artificial “Effective Emission Temperature” simply represents that temperature, if it were to be UNIFORMlY distributed over the WHOLE of the earth’s surface would instantaneously radiate the same energy as is received on one side of the earth at any instant from the sun. The value of this very unscientifically defined temperature is only -18 C (255 K). In false claims that this must represent the fundamental “average” (mean) temperature of the earth, it becomes necessary of course to add a further 33 C (33 K) which is very conveniently “found” to arise because of the presence of carbon dioxide which on its own, at 250 ppmv, causes an increase alone of about 15 C the effect of which is to increase the density of water vapour, another greenhouse gas which conveniently provides a further 18 C of warming!!!! This provides the required mean temperature of 288 K (15 C) as required.
However, it is obviously quite clear that any proper, scientifically accurate, model which represents the earth, MUST include soil and air but for this purpose, as above NO carbon dioxide and no other greenhouse gas. During the day, the contact between the lowest layer of air and the warmed surface of the soil during daylight, heats the air, simultaneous measurements of the air temperature at one metre and that of the soil’s surface show that at midday these temperatures are very similar, while at all other times of the day and night, the temperature of the air is in general significantly higher than that of the soils surface, simply because the air across the whole hemisphere retains its warmer temperature just as large bodies of air are often warmed over hot regions of the land, often deserts, move for many days as significant heatwaves over much otherwise cooler regions. cooler regions. So at night, the air warmed to a mean temperature of a little over 15 C (288 K) during daylight, retains a mean temperature of a little under 288 K!) as is easily shown theoretically. The mean of these two temperature distributions – one on the daylight side and one on the night side – is obviously very nearly equal to the 288 K which is known to be the mean of the temperature of the whole earth. This results from the use of a very accurate model of the earth which only differs from our earth through the absence of greenhouse gases.
It’s very cold still in usually hot-by-now Perth so the warming theory doesn’t seem to hold water.
With all the changes of heat input it appears that the earth does not have a problem getting rid of excess heat. There is no heat buildup. Humans add heat there is no question about that. Solar panels and wind turbines produce electricity which produces heat. Is that green heat?
David Archibald acknowledge that volcanic action has an impact on the environment but it appears that he did not include undersea volcanic activity. If it were not for undersea volcanic activity there would be no fish also humans get at least 50% of their oxygen from the oceans. That is not difficult for most people to understand, yet it appears that some scientists have engaged in a cover-up.
LOL – Yup. “Green Heat” has a special exemption from the laws of physics.
I totally agree about the lack of acknowledgement of volcanic activity in general, but the undersea component particularly. It is probably not so much a cover-up as a lack of understanding. Apparently there could be as many as 3.5 million undersea volcanoes. The work of Prof. Wyss Yim is especially interesting as he has linked ENSO events to undersea eruptions.
The net balance between ocean warming and ocean cooling cycles depends on global cloudiness because clouds reduce the proportion of solar energy able to enter the system.
Global cloudiness appears to vary with solar changes because the sun appears to alter the degree of jet stream meridionality.
More meridionality creates more clouds from longer lines of air mass mixing- not more cloud condensation nuclei so we do not the Svensmark’s hypothesis.
If the current level of meridionality continues or increases then the PDO balance between El Niño and La Niña will shift in favour of the latter for a net cooling effect.
I pointed out the dominance of ocean cycles long ago, around 2008 in an article for Climate Realists then known as Climate Sceptics.
I find all of these arguments interesting. Certainly ocean currents and Sun cycles control temperature in highly complex ways. I do not see any evidence whatsoever that carbon dioxide has anything to do with temperature other than through making plants grow. Two totally independent groups of scientists have discovered definitive proof that there is no greenhouse gas effect. Not surprisingly, the gigantic global climate fear industry has no interest in researching this information. Real scientists have intellectual curiosity and an open mind. Unfortunately, our most famous “climate scientists” care more about their careers and egos than finding authentic scientific truths. They are ignoring easily verifiable evidence that humanity is in no danger of suffering a man-made “climate crisis.” That is good news for humanity, but bad news for their careers and prestige. For details, please watch “Climate Catholicism and Greenhouse Dreams” on YouTube.
I don’t know what the future holds but a long cooling phase is what is needed to stop the current rot. When people shiver in their unheated homes, cannot afford gas or electricity and find the shops empty then they might find the politicians to overthrow the Green left and return to normal. Hopefully the so called scientists that got us to this place will be ridiculed relentlessly and without grants.
[…] än vanligt. Statistik visar att det finns ett samband mellan det och antalet vulkanutbrott. David Archibald, Australien, […]
Great conversation on under sea volcanoes. There are volcanic vents that operate continuously to produce CO2 and O2 needed by fish life. During the last glacial maximum the oceans were 400 ft lower than present. The scientists never talk about the cause but it’s obvious that a lot of heat was needed to evaporate 400 ft of ocean. Am looking for a scientists who will give an opinion on where all of the heat came from and where did it go?
[…] David Archibald beskriver hur avgörande PDO är för klimatets växlingar. Han illustrerar det med en graf av professor Ole Humlum som driver sajten Climate4you. Denne har adderat de månatliga ändringarna av den globala medeltemperaturen och ackumulerar så den trend som gäller: […]