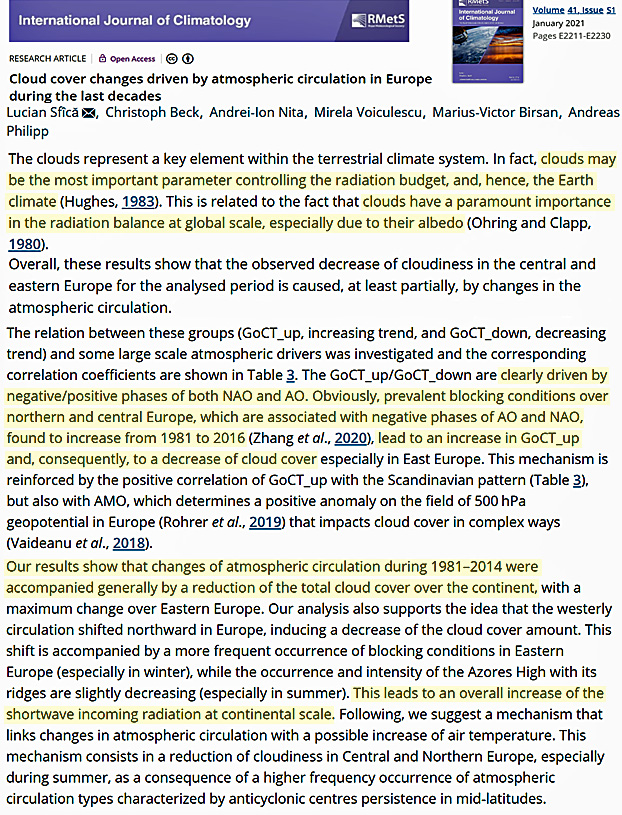
“Clouds may be the most important parameter controlling the radiation budget, and, hence the Earth climate.” – Sfîcă et al., 2021
It has become more and more common for scientists to attribute modern radiation budget (climate) changes to variations in cloud cover.
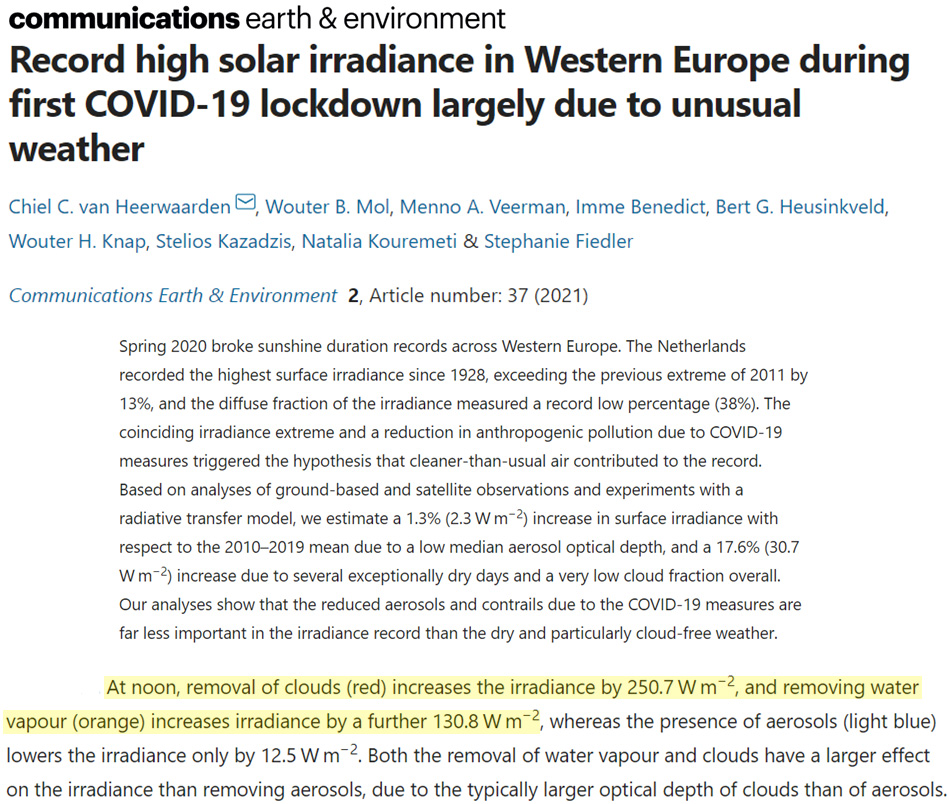
This should not be surprising. It’s been pointed out (van Heerwaarden et al., 2021) that removing clouds from atmosphere at noon leads to +251 W/m² additional radiative forcing. Compare this value to the entirety of the cumulative CO2 forcing since 1750: 1.82 W/m².
Below are more than 20 of the papers published in 2021 that substantially attribute modern climate changes to variations in clouds.
“The clouds represent a key element within the terrestrial climate system. In fact, clouds may be the most important parameter controlling the radiation budget, and, hence, the Earth climate (Hughes, 1983). This is related to the fact that clouds have a paramount importance in the radiation balance at global scale, especially due to their albedo (Ohring and Clapp, 1980). … Chiacchio and Wild (2010) have shown that more positive NAO during 1985–2000 is linked with the increase of solar radiation in Europe due to lower amounts of cloud cover which are characteristic for the southern part of the continent during positive NAO. They showed that NAO, generally anticorrelated with cloud cover at continental scale, represents one of the most important drivers of changes in solar radiation in Europe. Sfîcă et al. (2017) found that higher values of sunshine duration during winter in Romania are linked with an intense westerly circulation at continental scale. This supports the idea that there is an important link between atmospheric circulation and cloud cover. The effect on surface radiation of the decrease in cloud cover adds to the observed decrease of the optical thickness of aerosols leading to the so‐called brightening period during the last decennia (Russak, 2009; Pfeifroth et al., 2018a).”
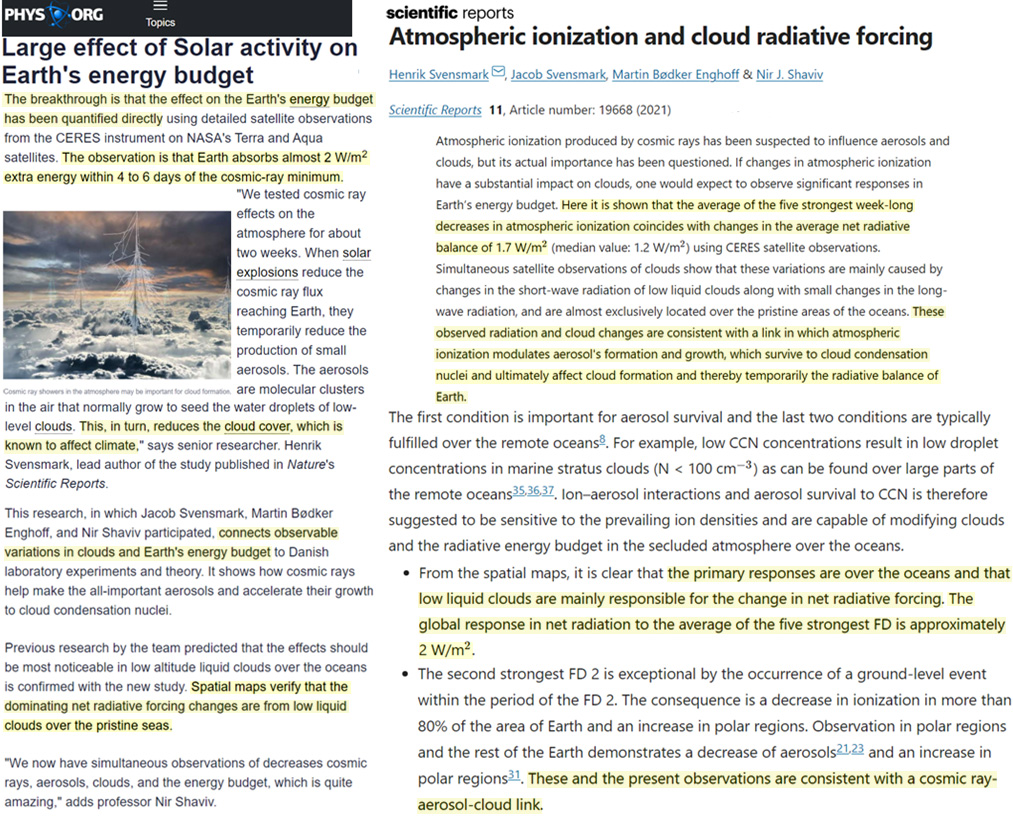
“The consequence is a decrease in ionization in more than 80% of the area of Earth and an increase in polar regions. Observation in polar regions and the rest of the Earth demonstrates a decrease of aerosols21,23 and an increase in polar regions31. These and the present observations are consistent with a cosmic ray-aerosol-cloud link. … From the spatial maps, it is clear that the primary responses are over the oceans and that low liquid clouds are mainly responsible for the change in net radiative forcing. The global response in net radiation to the average of the five strongest FD is approximately 2 W/m2. … A consistent picture is emerging, suggesting that variations in ionization are connected to aerosols and clouds, and now also the energy budget.”
“The breakthrough is that the effect on the Earth’s energy budget has been quantified directly using detailed satellite observations from the CERES instrument on NASA’s Terra and Aqua satellites. The observation is that Earth absorbs almost 2 W/m2 extra energy within 4 to 6 days of the cosmic-ray minimum.”
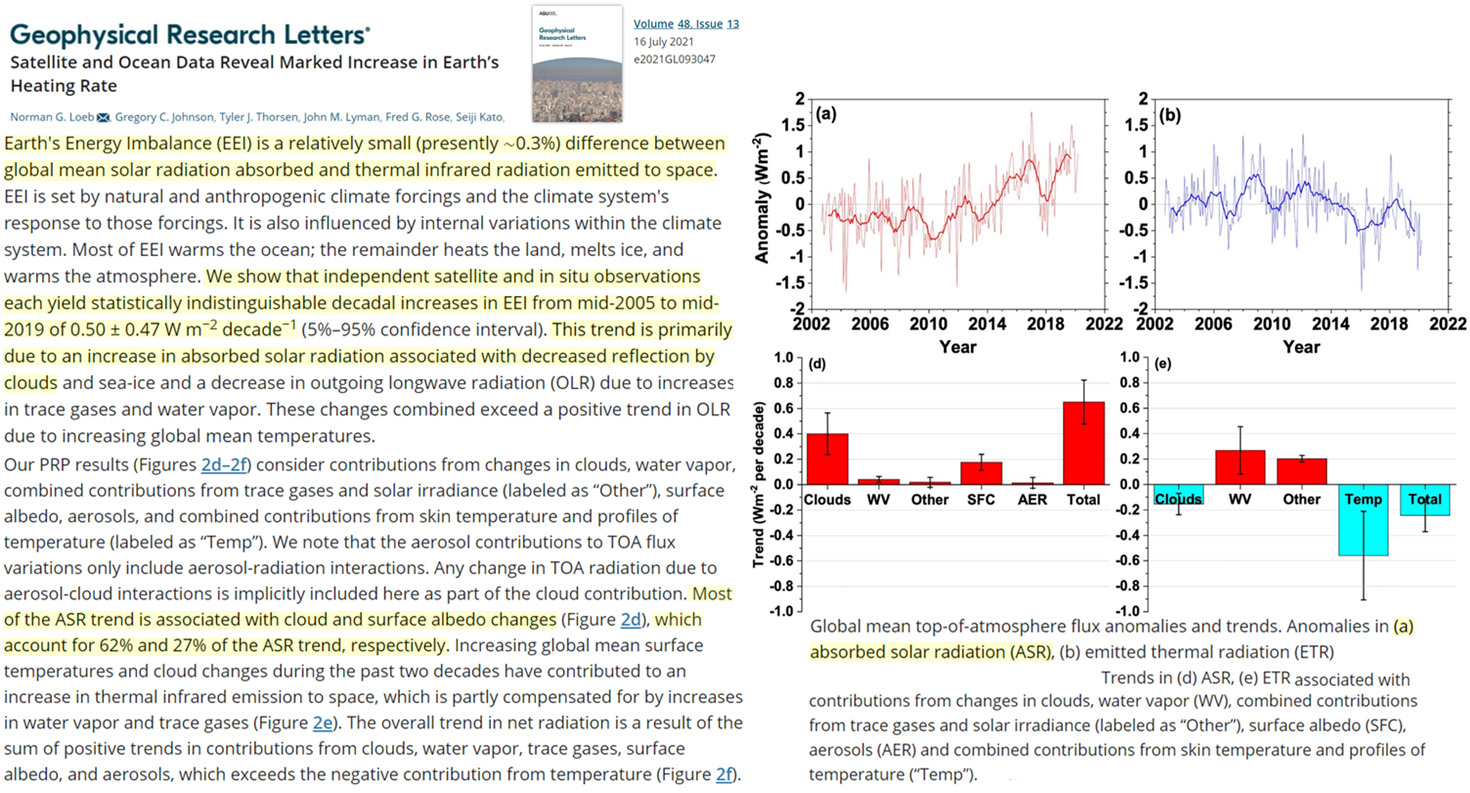
“Earth’s Energy Imbalance (EEI) is a relatively small (presently ∼0.3%) difference between global mean solar radiation absorbed and thermal infrared radiation emitted to space. EEI is set by natural and anthropogenic climate forcings and the climate system’s response to those forcings. It is also influenced by internal variations within the climate system. Most of EEI warms the ocean; the remainder heats the land, melts ice, and warms the atmosphere. We show that independent satellite and in situ observations each yield statistically indistinguishable decadal increases in EEI from mid-2005 to mid-2019 of 0.50 ± 0.47 W/m² decade¯1 (5%–95% confidence interval). This trend is primarily due to an increase in absorbed solar radiation associated with decreased reflection by clouds and sea-ice and a decrease in outgoing longwave radiation (OLR) due to increases in trace gases and water vapor. These changes combined exceed a positive trend in OLR due to increasing global mean temperatures.”
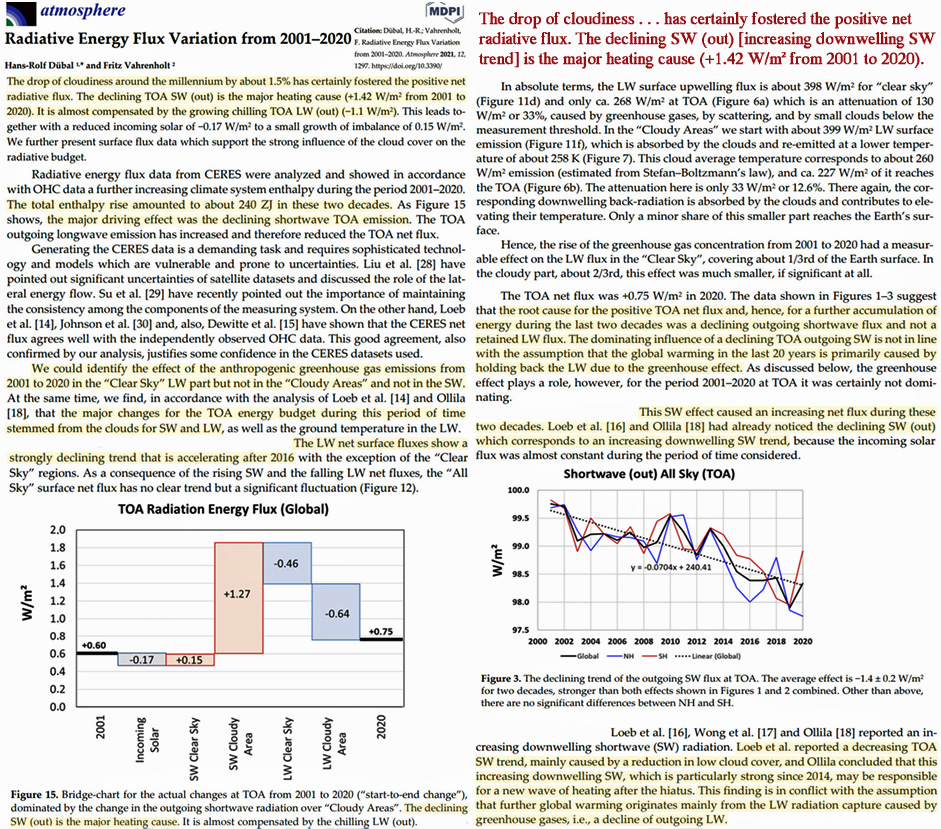
“The drop of cloudiness around the millennium by about 1.5% has certainly fostered the positive net radiative flux. The declining TOA SW (out) is the major heating cause (+1.42 W/m² from 2001 to 2020). It is almost compensated by the growing chilling TOA LW (out) (−1.1 W/m²). This leads together with a reduced incoming solar of −0.17 W/m² to a small growth of imbalance of 0.15 W/m². We further present surface flux data which support the strong influence of the cloud cover on the radiative budget.”
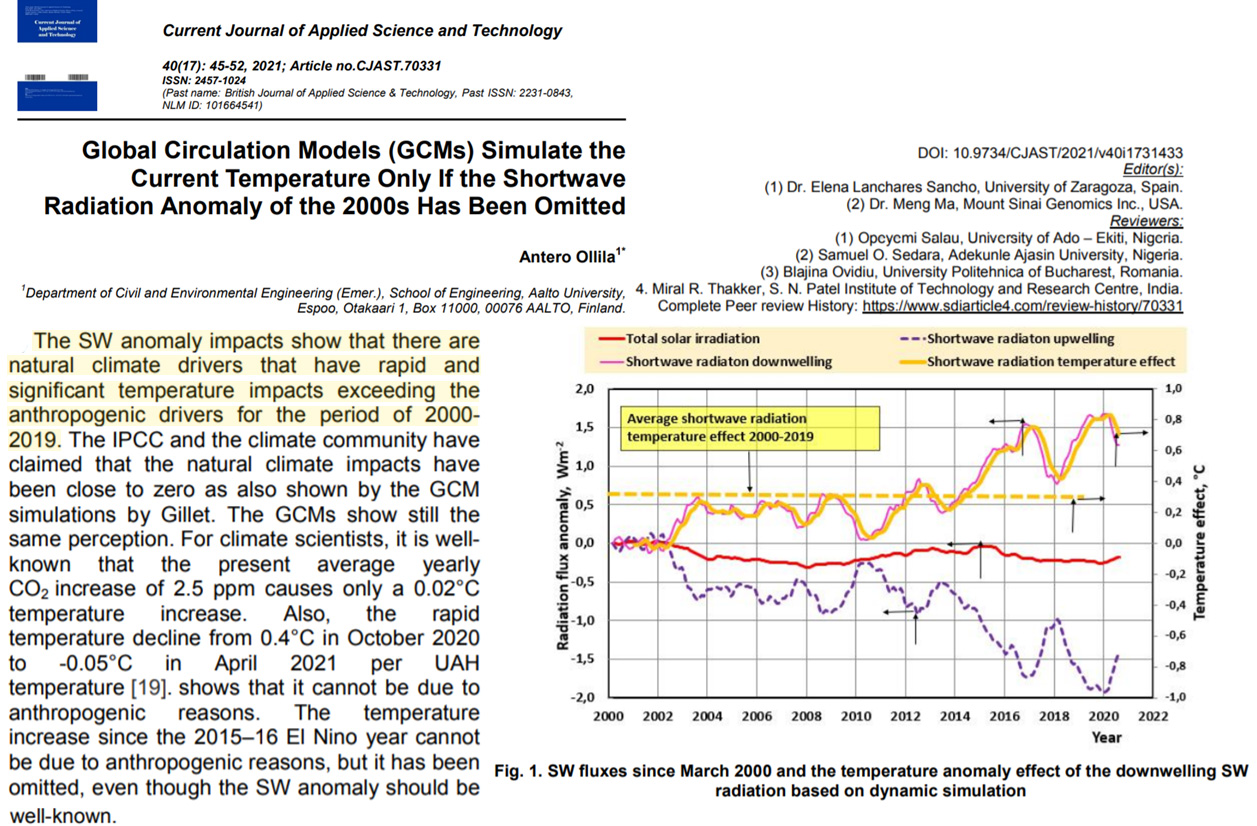
“The SW anomaly impacts show that there are natural climate drivers that have rapid and significant temperature impacts exceeding the anthropogenic drivers for the period of 2000- 2019. The IPCC and the climate community have claimed that the natural climate impacts have been close to zero as also shown by the GCM simulations by Gillet. The GCMs show still the same perception. For climate scientists, it is well-known that the present average yearly CO2 increase of 2.5 ppm causes only a 0.02°C temperature increase. Also, the rapid temperature decline from 0.4°C in October 2020 to -0.05°C in April 2021 per UAH temperature [19]. shows that it cannot be due to anthropogenic reasons. The temperature increase since the 2015–16 El Nino year cannot be due to anthropogenic reasons, but it has been omitted, even though the SW anomaly should be well-known.”
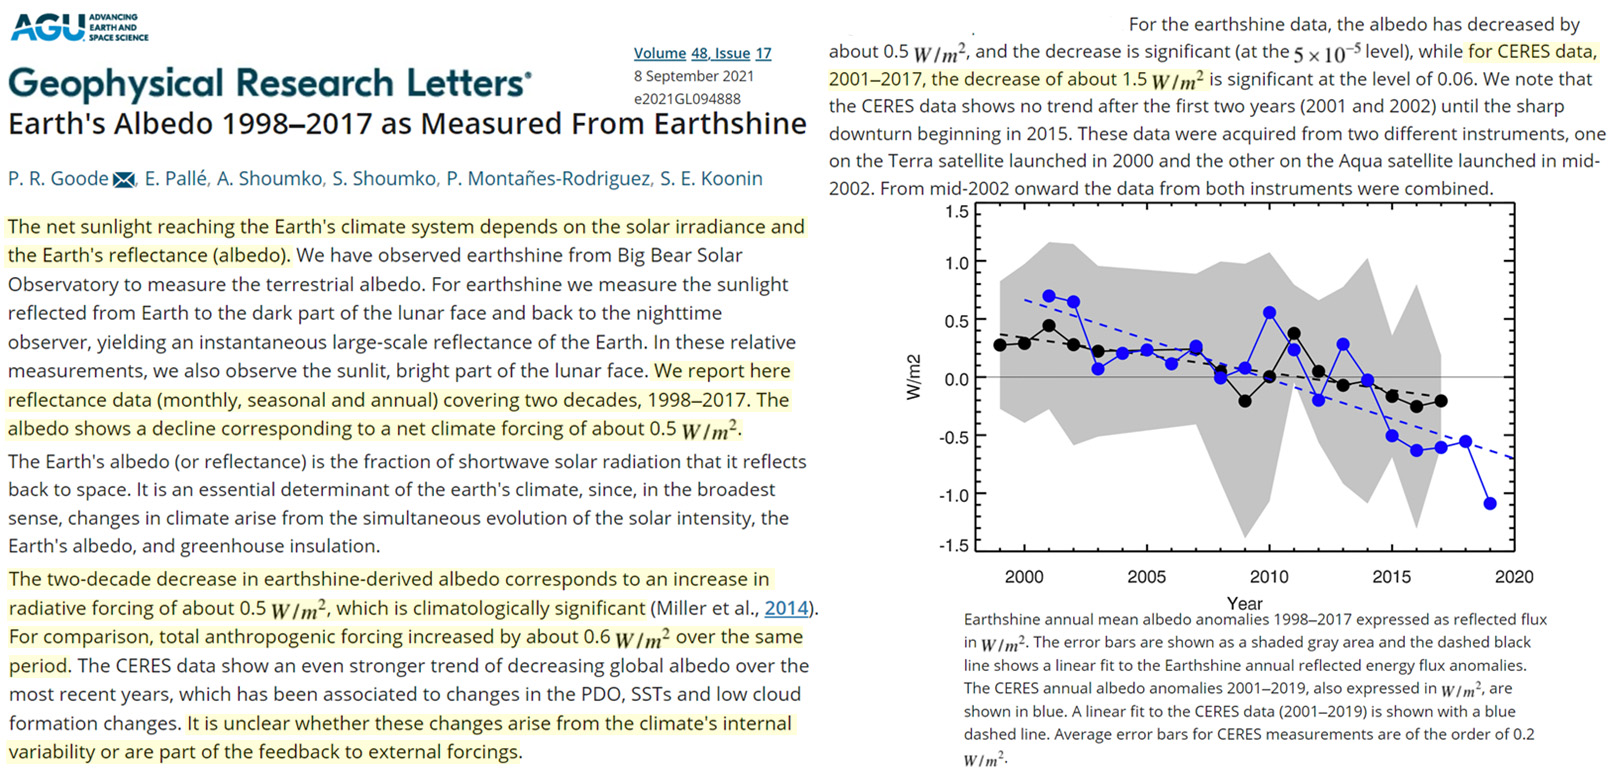
“The reflectance of the Earth is a fundamental climate parameter that we measured from Big Bear Solar Observatory between 1998 and 2017 by observing the earthshine using modern photometric techniques to precisely determine daily, monthly, seasonal, yearly and decadal changes in terrestrial albedo from earthshine. We find the inter-annual fluctuations in albedo to be global, while the large variations in albedo within individual nights and seasonal wanderings tend to average out over each year. We measure a gradual, but climatologically significant 0.5 W/m² decline in the global albedo over the two decades of data. … For comparison, total anthropogenic forcing increased by about 0.6 W/m² over the same period.”
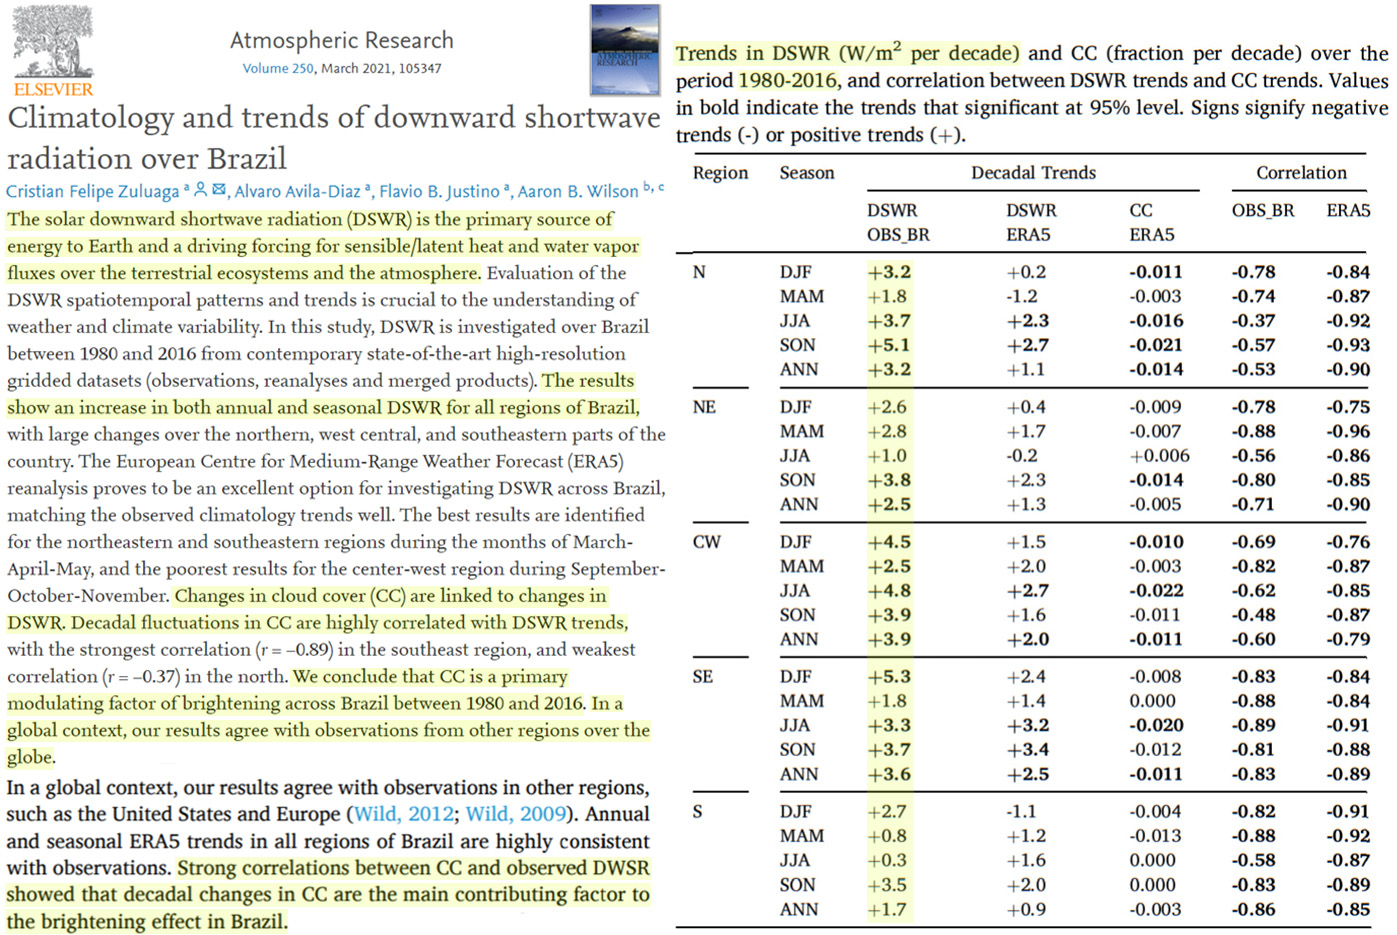
“The solar downward shortwave radiation (DSWR) is the primary source of energy to Earth and a driving forcing for sensible/latent heat and water vapor fluxes over the terrestrial ecosystems and the atmosphere. Evaluation of the DSWR spatiotemporal patterns and trends is crucial to the understanding of weather and climate variability. In this study, DSWR is investigated over Brazil between 1980 and 2016 from contemporary state-of-the-art high-resolution gridded datasets (observations, reanalyses and merged products). The results show an increase in both annual and seasonal DSWR for all regions of Brazil, with large changes over the northern, west central, and southeastern parts of the country. The European Centre for Medium-Range Weather Forecast (ERA5) reanalysis proves to be an excellent option for investigating DSWR across Brazil, matching the observed climatology trends well.”
“Changes in cloud cover (CC) are linked to changes in DSWR. Decadal fluctuations in CC are highly correlated with DSWR trends, with the strongest correlation (r = −0.89) in the southeast region, and weakest correlation (r = −0.37) in the north. We conclude that CC is a primary modulating factor of brightening across Brazil between 1980 and 2016. In a global context, our results agree with observations from other regions over the globe.”
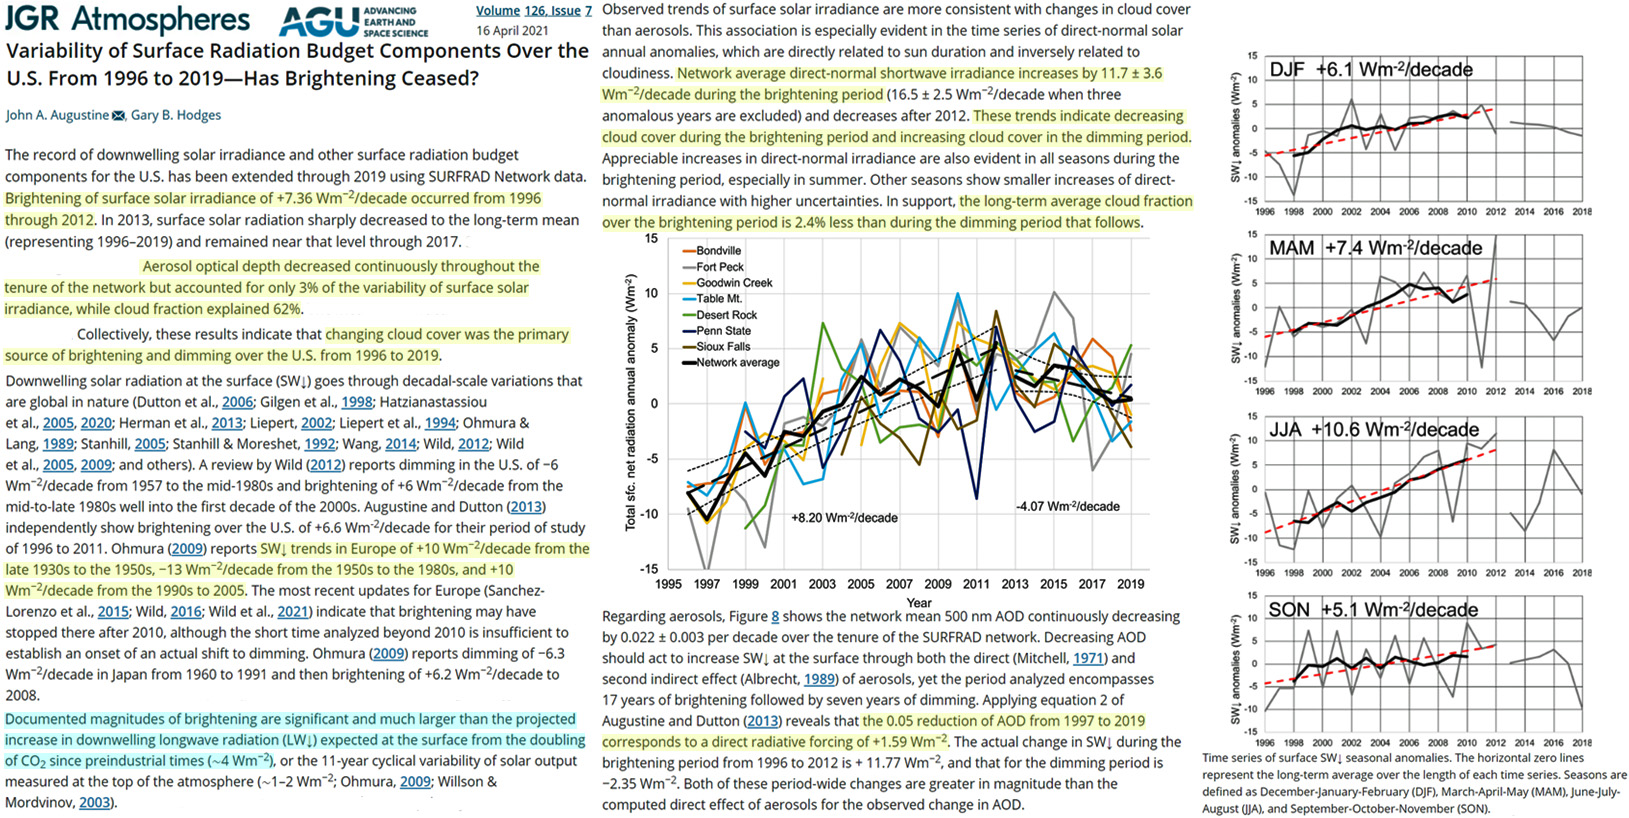
“The record of downwelling solar irradiance and other surface radiation budget components for the U.S. has been extended through 2019 using SURFRAD Network data. Brightening of surface solar irradiance of +7.36 W/m²/decade occurred from 1996 through 2012. In 2013, surface solar radiation sharply decreased to the long-term mean (representing 1996–2019) and remained near that level through 2017. … Aerosol optical depth decreased continuously throughout the tenure of the network but accounted for only 3% of the variability of surface solar irradiance, while cloud fraction explained 62%.”
“Collectively, these results indicate that changing cloud cover was the primary source of brightening and dimming over the U.S. from 1996 to 2019.”
“Downwelling solar radiation at the surface (SW↓) goes through decadal-scale variations that are global in nature (Dutton et al., 2006; Gilgen et al., 1998; Hatzianastassiou et al., 2005, 2020; Herman et al., 2013; Liepert, 2002; Liepert et al., 1994; Ohmura & Lang, 1989; Stanhill, 2005; Stanhill & Moreshet, 1992; Wang, 2014; Wild, 2012; Wild et al., 2005, 2009; and others). A review by Wild (2012) reports dimming in the U.S. of −6 W/m²/decade from 1957 to the mid-1980s and brightening of +6 W/m²/decade from the mid-to-late 1980s well into the first decade of the 2000s. Augustine and Dutton (2013) independently show brightening over the U.S. of +6.6 W/m²/decade for their period of study of 1996 to 2011. Ohmura (2009) reports SW↓ trends in Europe of +10 W/m²/decade from the late 1930s to the 1950s, −13 W/m²/decade from the 1950s to the 1980s, and +10 W/m²/decade from the 1990s to 2005. The most recent updates for Europe (Sanchez-Lorenzo et al., 2015; Wild, 2016; Wild et al., 2021) indicate that brightening may have stopped there after 2010, although the short time analyzed beyond 2010 is insufficient to establish an onset of an actual shift to dimming. Ohmura (2009) reports dimming of −6.3 W/m²/decade in Japan from 1960 to 1991 and then brightening of +6.2 W/m²/decade to 2008.”
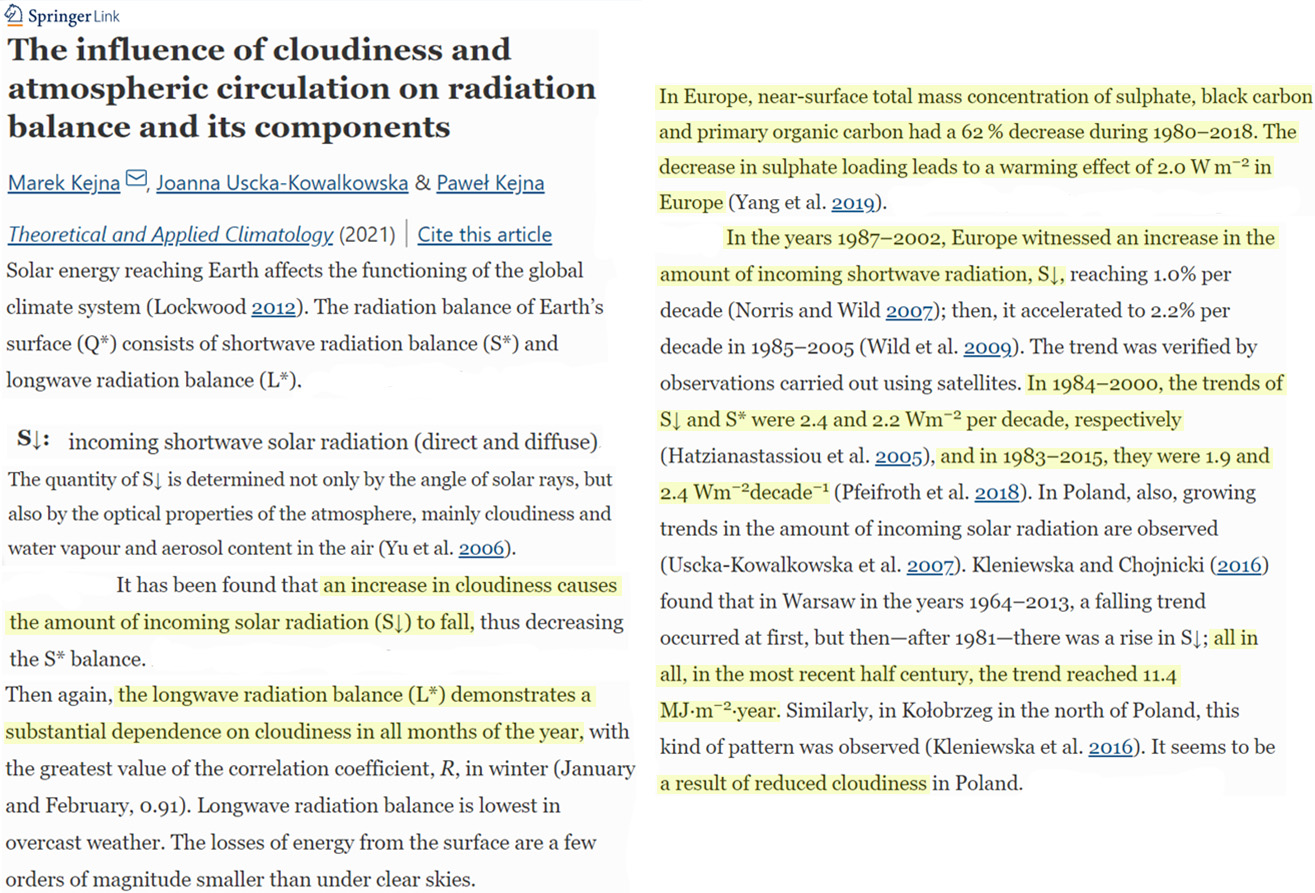
“In the 1980s, the trend reversed and “global brightening” began (Wild 2009). In the years 1987–2002, Europe witnessed an increase in the amount of incoming shortwave radiation, S↓, reaching 1.0% per decade (Norris and Wild 2007); then, it accelerated to 2.2% per decade in 1985–2005 (Wild et al. 2009). The trend was verified by observations carried out using satellites. In 1984–2000, the trends of S↓ and S* were 2.4 and 2.2 W/m² per decade, respectively (Hatzianastassiou et al. 2005), and in 1983–2015, they were 1.9 and 2.4 W/m² decade−1 (Pfeifroth et al. 2018). In Poland, also, growing trends in the amount of incoming solar radiation are observed (Uscka-Kowalkowska et al. 2007).”
“In Europe, near-surface total mass concentration of sulphate, black carbon and primary organic carbon had a 62 % decrease during 1980–2018. The decrease in sulphate loading leads to a warming effect of 2.0 W/m² in Europe (Yang et al. 2019).”
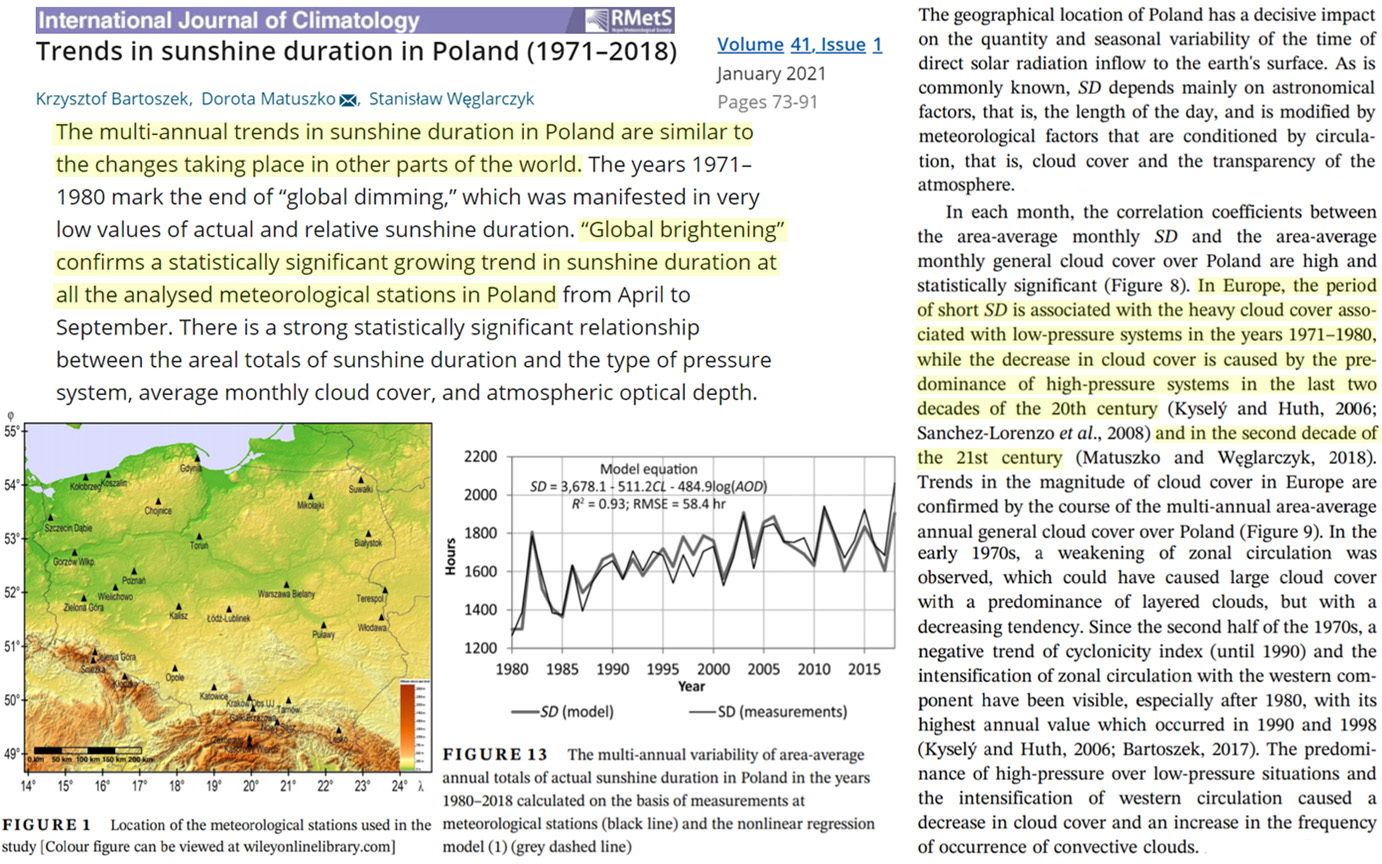
“SD [sunshine duration] is an important indicator of the amount of solar energy reaching the Earth’s surface. In the current discussion on the causes of global warming, the analysis of the spatial and temporal variability of SD over a relatively large area of Poland’s land surface (311,895 km2) is of particular importance. … The multi‐annual trends in sunshine duration in Poland are similar to the changes taking place in other parts of the world. The years 1971–1980 mark the end of “global dimming,” which was manifested in very low values of actual and relative sunshine duration. “Global brightening” confirms a statistically significant growing trend in sunshine duration at all the analysed meteorological stations in Poland from April to September. There is a strong statistically significant relationship between the areal totals of sunshine duration and the type of pressure system, average monthly cloud cover, and atmospheric optical depth.”
“In each month, the correlation coefficients between the area-average monthly SD and the area-average monthly general cloud cover over Poland are high and statistically significant (Figure 8). In Europe, the period of short SD is associated with the heavy cloud cover associated with low-pressure systems in the years 1971–1980, while the decrease in cloud cover is caused by the predominance of high-pressure systems in the last two decades of the 20th century (Kyselý and Huth, 2006; Sanchez-Lorenzo et al., 2008) and in the second decade of the 21st century (Matuszko and Węglarczyk, 2018). Trends in the magnitude of cloud cover in Europe are confirmed by the course of the multi-annual area-average annual general cloud cover over Poland (Figure 9).”
“The Arctic is rapidly changing, with increasingly dramatic sea ice loss and surface warming in recent decades. Shortwave radiation plays a key role in Arctic warming during summer months, and absorbed shortwave radiation has been increasing largely because of greater sea ice loss. Clouds can influence this ice–albedo feedback by modulating the amount of shortwave radiation incident on the Arctic Ocean. In turn, clouds impact the amount of time that must elapse before forced trends in Arctic shortwave absorption emerge from internal variability. This study determines whether the forced climate response of absorbed shortwave radiation in the Arctic has emerged in the modern satellite record and global climate models. From 18 years of satellite observations from CERES-EBAF, we find that recent declines in sea ice are large enough to produce a statistically significant trend (1.7 × 10⁶ PJ or 3.9% per decade) in observed clear-sky absorbed shortwave radiation. However, clouds preclude any forced trends in all-sky absorption from emerging within the existing satellite record.”
“Clouds play a critical role in the ice sheet surface mass balance, both by providing mass input in the form of precipitation and by modulating the net radiation at the surface, thus influencing surface melt and run-off (Bennartz et al., 2013; Van Tricht et al., 2016; Hofer et al., 2017; Miller et al., 2017).”
“Mixed-phase clouds in particular, which contribute significantly to surface warming over the GrIS (Miller et al., 2015; Van Tricht et al., 2016), are sensitive to the number concentration of cloud condensation nuclei and ice-nucleating particles (e.g. Norgren et al., 2018; Solomon et al., 2018), where cloud condensation nuclei (CCN) are a subset of aerosol particles on which liquid droplets can form, and ice-nucleating particles (INPs) are a subset of aerosols that can catalyse the formation of ice crystals.”
“Clouds are an important component in climate, because of their complex interactions with other components of the climatic system. The main one is the influence on the radiative transfer in the solar or shortwave radiation (spectral interval: 0.2 µm to 4 µm) and in the terrestrial or longwave radiation (spectral interval higher than 4 µm). Those interactions occur via the scattering and absorption in the solar spectrum and mainly by absorption and emission in the terrestrial spectrum. The main effect of clouds on the solar radiation is the large backward scattering produced by the cloud droplets and ice crystals (Liou, 1986; Stephens, 2005; Mitchell and Finnegan, 2009). Because of that, the earth–atmosphere system albedo basically depends on the clouds and their properties. At the earth’s surface the clouds effect on the solar radiation basically depends on the microphysical (i.e. particle size) and macrophysical (i.e. cloud base and cloud top) properties of clouds and the sun disk location respect with the measurement point.”
Zhao et al., 2021 (full paper)
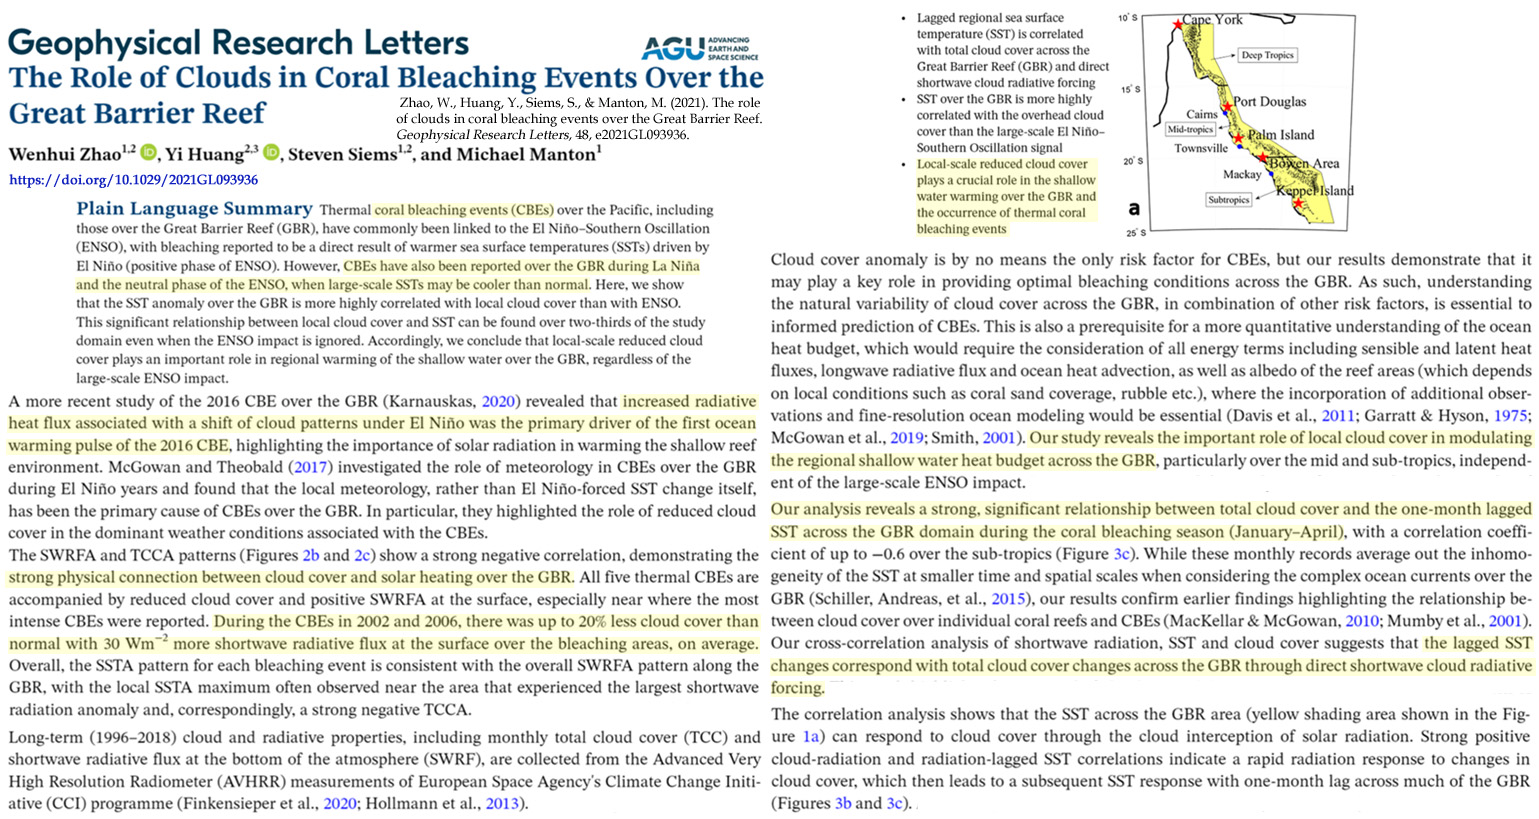
“Here, we show that the SST anomaly over the GBR is more highly correlated with local cloud cover than with ENSO. This significant relationship between local cloud cover and SST can be found over two-thirds of the study domain even when the ENSO impact is ignored. Accordingly, we conclude that local-scale reduced cloud cover plays an important role in regional warming of the shallow water over the GBR, regardless of the large-scale ENSO impact.”
“Lagged regional sea surface temperature (SST) is correlated with total cloud cover across the Great Barrier Reef (GBR) and direct shortwave cloud radiative forcing.”
“Local-scale reduced cloud cover plays a crucial role in the shallow water warming over the GBR and the occurrence of thermal coral bleaching events … Lagged regional sea surface temperature (SST) is correlated with total cloud cover across the Great Barrier Reef (GBR) and direct shortwave cloud radiative forcing.”
“Local-scale reduced cloud cover plays a crucial role in the shallow water warming over the GBR and the occurrence of thermal coral bleaching events.”
“Cosmic rays affect cloud cover variation. Clouds reflect both the incoming solar radiation flux upward and the earth’s thermal radiation back to it. Thus clouds control thermal energy input to the lower atmosphere and establishes a link between cosmic rays and the terrestrial temperature. … Clouds play an important role in modulating the heat budget of the lower atmosphere. We know that clouds acting as an opaque medium control thermal energy input to the lower atmosphere. So, one can expect a link between cosmic rays and cloud cover over the earth.”
“The observed SWin exhibited significant inter-daily variations that are associated with changes in cloud conditions. For example, on JD 176, SWin was 299.3 W/m² at JI. Two days later, SWin dropped to 142.1 W/m² before doubling its values two days later.”
“COD [cloud optical depth] variations therefore have a non-negligible impact on the surface radiative balance. For θ=60∘, for example, there is an approximately 200 W/m² difference in SWd [downwelling shortwave] between the optically thinnest and thickest clouds. This translates into a total shortwave cloud forcing that ranges between −20 and −60 W/m², assuming an albedo of 0.8 (typical of the N-ICE campaign April–June period). This range is significant when it is contrasted to the typical longwave forcing of ≈60 W/m²: even for θ=60∘, only the optically thickest clouds could contribute to cool the surface during the April–June N-ICE2015 campaign period. … The surface impact of Arctic clouds is also seasonally variable. In October and November, clouds warm the surface: 2 m temperatures associated with cloudless profiles are up to 8 K colder than those associated with profiles containing at least one low cloud.”
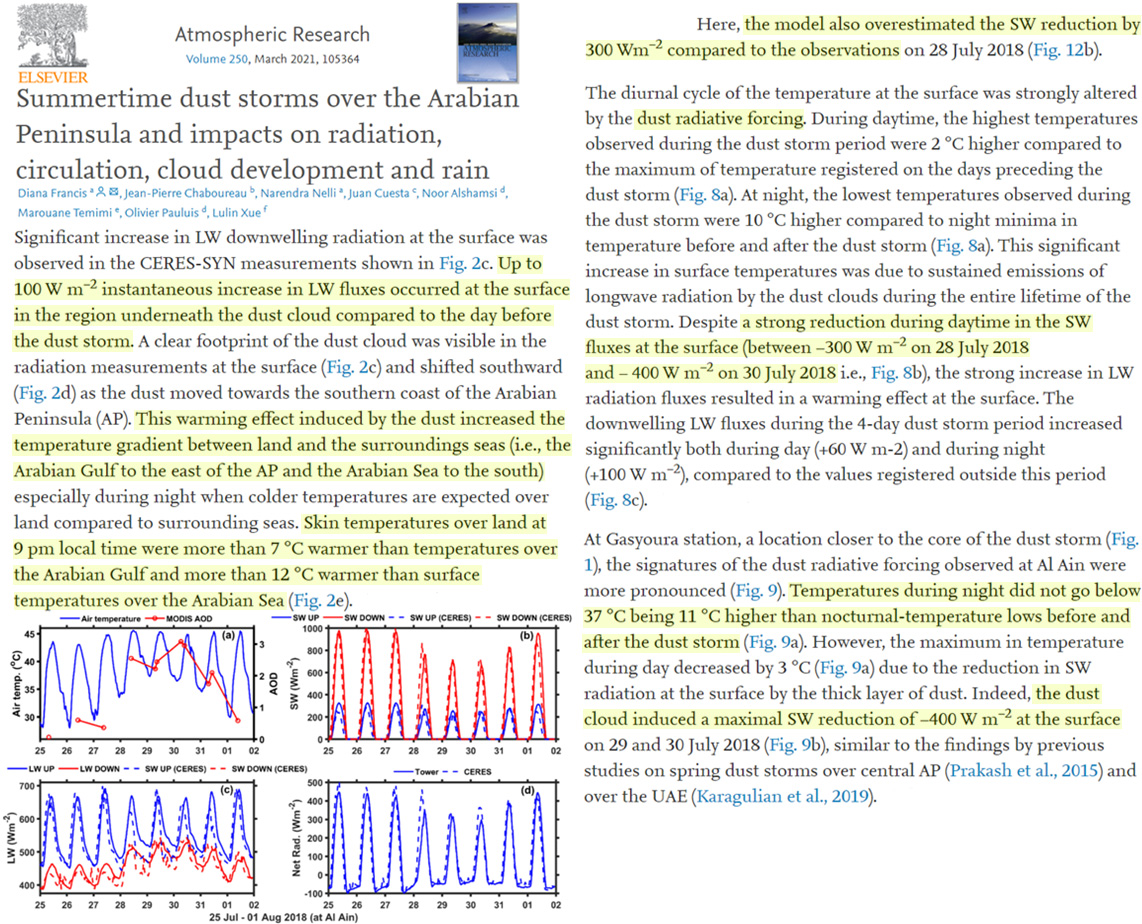
“At Gasyoura station, a location closer to the core of the dust storm (Fig. 1), the signatures of the dust radiative forcing observed at Al Ain were more pronounced (Fig. 9). Temperatures during night did not go below 37 °C being 11 °C higher than nocturnal-temperature lows before and after the dust storm (Fig. 9a). However, the maximum in temperature during day decreased by 3 °C (Fig. 9a) due to the reduction in SW radiation at the surface by the thick layer of dust. Indeed, the dust cloud induced a maximal SW reduction of ~400 W/m² at the surface on 29 and 30 July 2018 (Fig. 9b), similar to the findings by previous studies on spring dust storms over central AP (Prakash et al., 2015) and over the UAE (Karagulian et al., 2019). … Here, the model also overestimated the SW reduction by 300 W/m² compared to the observations on 28 July 2018″


But cloud variability is caused by the Omicron variant of CO2, isn’t it?
Yep. So obvious. But fear drives policies.
[…] 2021: The Year Scientists Increasingly Ascribed Shortwave-Modulating Cloud Variability As A Climate … […]
[…] 2021: The Year Scientists Increasingly Ascribed Shortwave-Modulating Cloud Variability As A Climate … […]