A new study uses existing temperature and CO2 records and albedo/natural variability attribution to suggest most of the recent warming is natural. The climate sensitivity to CO2 forcing is just over 0.2°C for a 100 ppm concentration increase.
Dr. Syun-Ichi Akasofu is an “expert in aurora physics, solar physics, geophysics, and magnetosphere” and the founder of the International Arctic Research Center at the University of Alaska, Fairbanks.
He and a co-author suggest albedo changes and multi-decadal oscillations (natural variability) explain about 0.4°C of the 0.5°C warming that occurred from 1975-2000. The rate of global warming has not risen linearly in concert with human greenhouse gas emissions, but instead it has oscillated from -0.005°C per year to about +0.018°C per year for the last 150 years. This weak to non-existent correlation between CO2 and temperature further disconfirms the assumption greenhouse gases are primarily driving global temperature trends.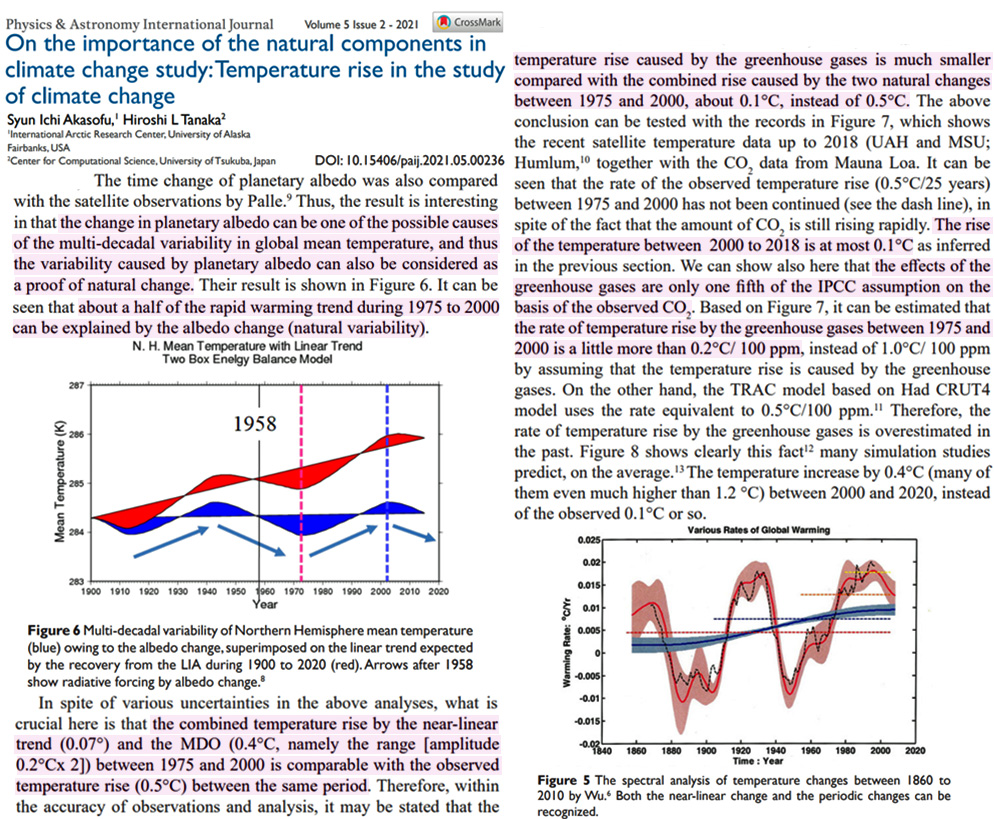
Image Source: Akasofu and Tanaka, 2021
As suggested, greenhouse gases are only responsible for “about 0.1°C, instead of 0.5°C” of the last quarter of the 20th century’s warming, as “the effects of the greenhouse gases are only one fifth of the IPCC assumption on the basis of the observed CO2“.
The temperature rise between 2000 to 2018 “is at most 0.1°C” even though CO2 rose by nearly 40 ppm during these 19 years. Climate models suggest it should have warmed 0.4°C or more from 2000 to 2018 due to the climate’s presumed strong sensitivity to greenhouse gases.
On the basis of the 0.1°C warming from CO2 from 1975 (331 ppm) to 2000 (370 ppm) and the necessarily less than 0.1°C warming from CO2 during the 2000 (370 ppm) to 2018 (408 ppm) period, Akasofu and Tanaka assert the climate’s sensitivity to CO2 rise may be “a little more than 0.2°C” per 100 ppm. This suggests doubling CO2 from pre-industrial levels (280 ppm to 560 ppm) produces just a 0.6°C increase in surface temperature.
A 0.6°C per 280 ppm CO2 climate sensitivity is hardly cause for alarm.


“This suggests doubling CO2 from pre-industrial levels (280 ppm to 560 ppm) produces just a 0.6°C increase in surface temperature.”
The atmosphere now has about 420 ppm of CO2 and the
per-year increase is about 2 ppm.
560 -420 = 140
So, if one assumes the rate of increase remains as 2, then it would take 70 years to reach 560 ( 0.6°C ).
I won’t be here to check, but I’ll guess 2092 will not record 560 ppm without a black swan event.
It’s interesting how articles that challenge the AGW premise contain data and are testable but articles that support AGW are anecdotal but must be accepted as acts of faith and piety.
I’m Canadian and I hope this post doesn’t get me jailed or my bank accounts frozen by our scientifically illiterate totalitarian Prime Minister. Wish me luck…
Alarmism can deliver a nice paycheck, but you must follow the narrative.
Be reassured : due to AGW, bank accounts can’t be frozen anymore.
/s
[…] Atmospheric Physicist: CO2 Explains 0.1°C Of 1975-2000 Warming – ‘One Fifth Of The IPCC… […]
Nonsense
No one knows the exact effect of CO2 because there
are too many variable involved with climate change
to specify exactly what any ONE of them has done.
But that 1% is the important bit. The rest is irrelevant.
Simple observation will detect any climate temperature change, warming or cooling. Weather forms the climate.
Record when plants, shrubs, trees, begin to bloom in the spring. Jot down the date, then record the next year’s date to find out when the shrub or tree blooms, each year is going to be different.
All you need is one tree to define a forest.
All you need is one plant to recognize a warming or cooling trend. It really is that easy.
In May of 1987, lilacs bloomed right about May 9th. On the 10th, lilacs were in full bloom, peak bloom. Also, asparagus is a plant that is temperature sensitive and the spears don’t become nascent shoots until the conditions are right. the feral asparagus has been harvested a little later since the year 1987.
Every year since then, the lilacs have flowered later, sometimes ten days later. Lilacs are an indicator of a warming or cooling trend, in my opinion, supported by plain old watching what happens. Just isn’t as warm during springtime since 1987. I do remember that 1988 was one hot summer.
Altogether, looks like a cooling trend in the climate, despite all of those CO₂ molecules bouncing around in all of the nitrogen and oxygen concentrated into the atmosphere by the earth’s gravity.
It was 33 below zero F this winter at times, that is a cold temperature.
You can call it warming if you want, but it doesn’t really look like it and it certainly doesn’t feel like it.
Still get to drink beer, I hope. I’ll pass on the meal worms and bugs, Klaus can eat all he wants.
How does that help with 70% of the planet = oceans?