Surface air CO2 concentrations vary by 100s to 1,000s of ppm within a span of hours to days or weeks across the natural world. The observational evidence suggests these variations are neither driving or even causing temperature changes.
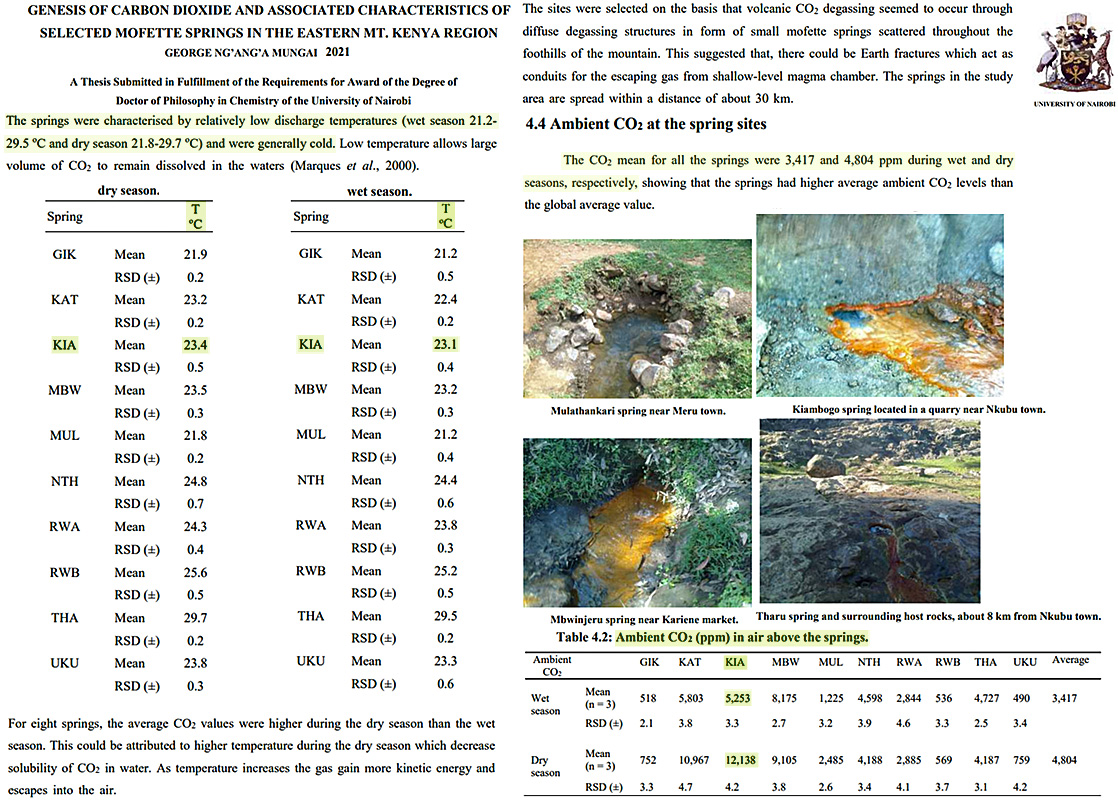
Image Source: Mungai, 2021
Similarly, CO2 concentrations in the surface air over cities typically vary by 100s of ppm within a span of hours. CO2 also fluctuates by these magnitudes from season to season.
During the warmest part of the day (mid-afternoon) or the hottest summer month, the CO2 concentrations dip to their lowest values.
For example, as the mid-afternoon (summer) CO2 concentrations in urban environments dip to 285, 359, 402, or 388 ppm, whereas just before dawn (winter), when air temperatures are coldest, CO2 climbs to 588, 788, 743, or 754 ppm (McRae and Graedel, 1979, Gorka and Lewicka-Szczebak, 2013, Kumar and Nagendra, 2015, and Gonzalez de Castillo et al., 2022, respectively.)
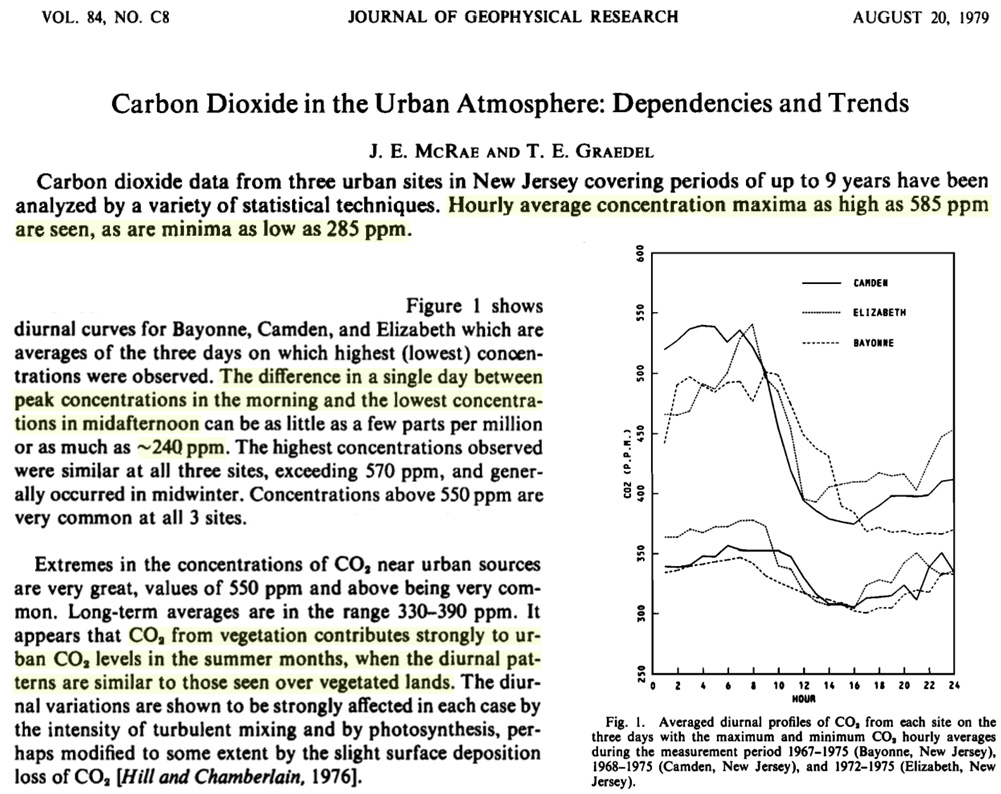
Image Source: McRae and Graedel, 1979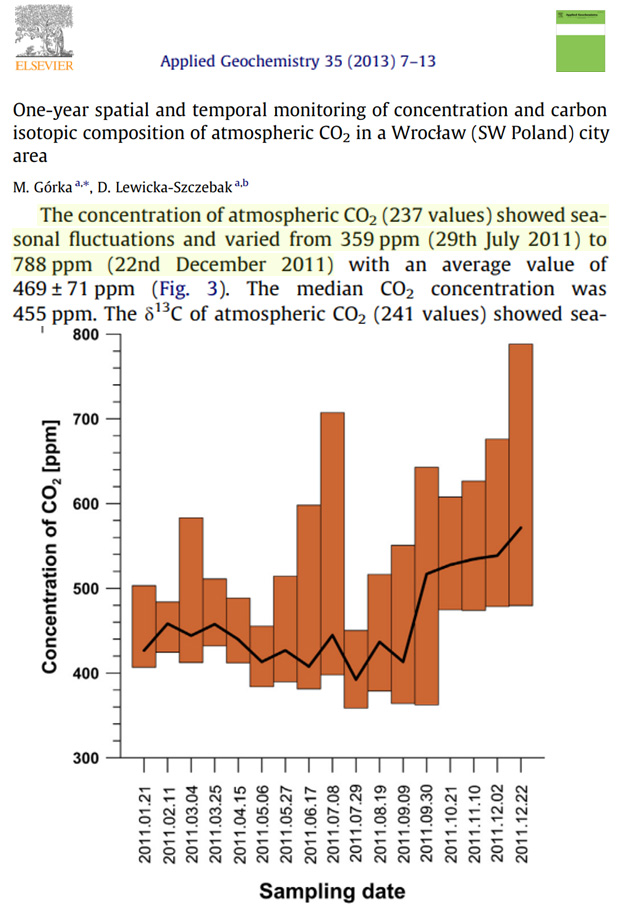
Image Source: Gorka and Lewicka-Szczebak, 2013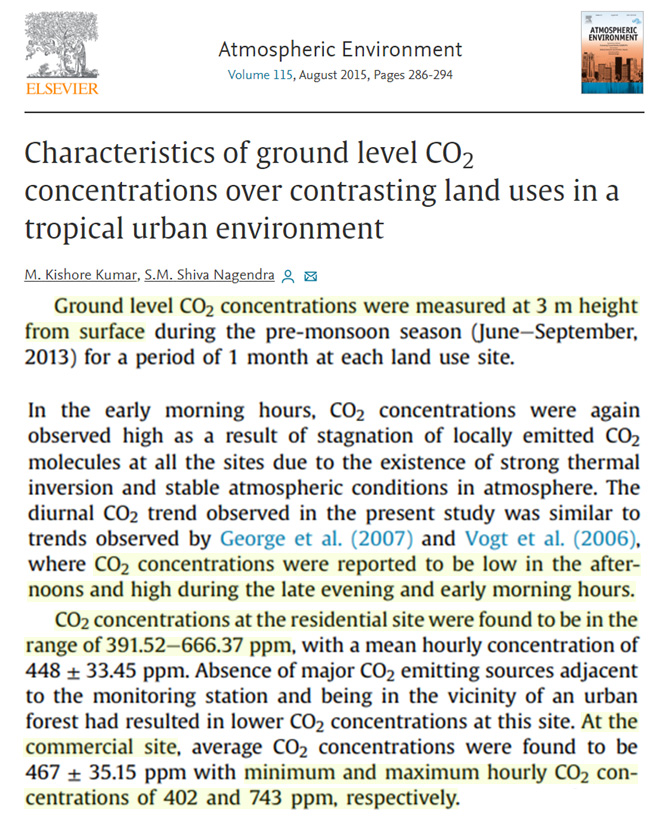
Image Source: Kumar and Nagendra, 2015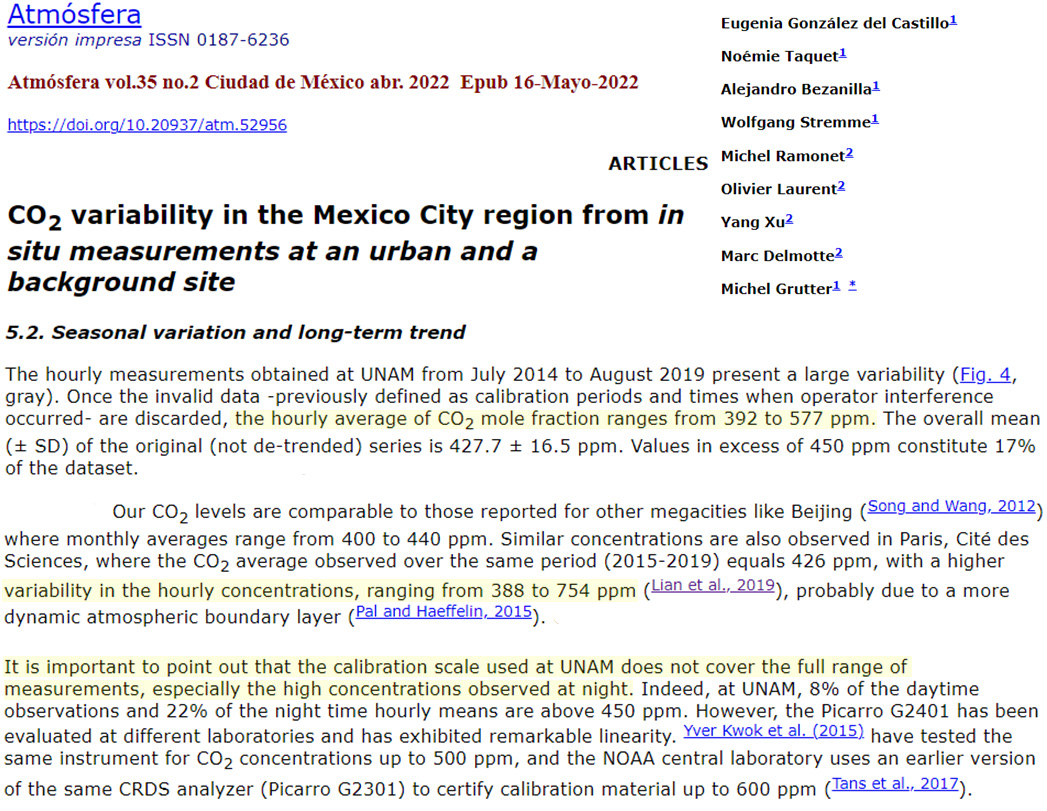
Image Source: Gonzalez de Castillo et al., 2022
A rather similar profile occurs over non-urban areas such as above tree cover or over grassy meadows.
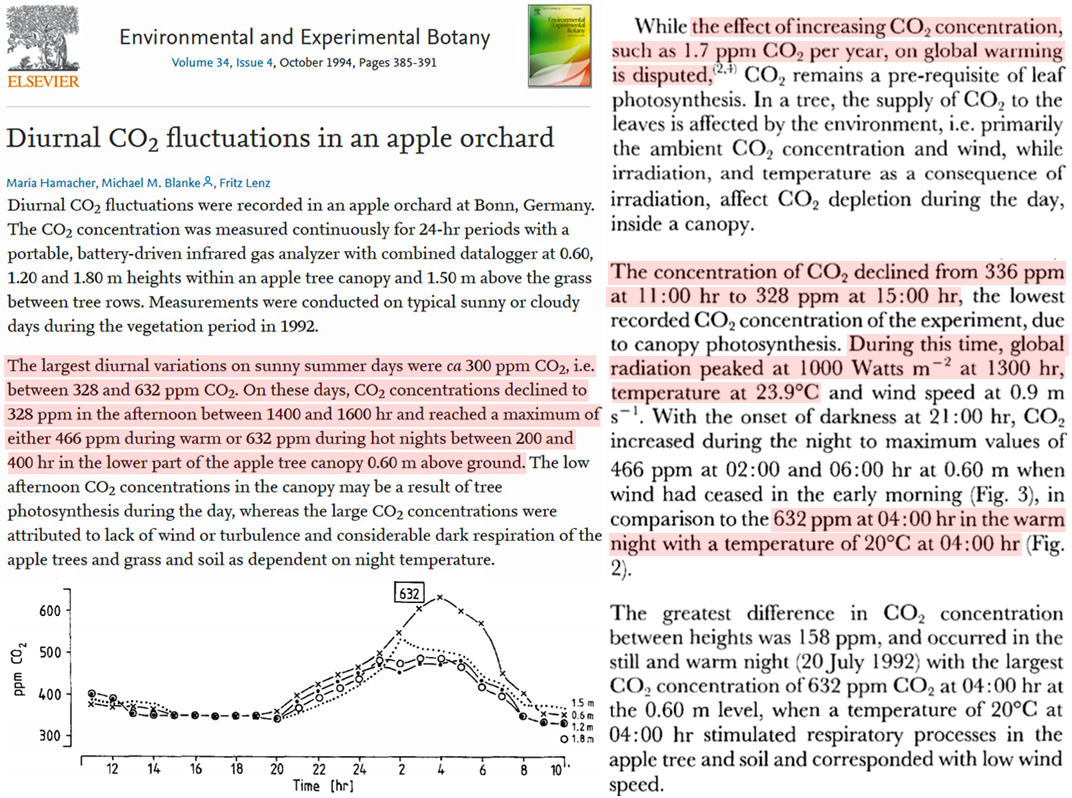
In areas where trees are prevalent, CO2 concentrations have been observed to flux from 328 ppm in the mid-afternoon to 632 ppm at 3 a.m., when it is 3-4°C colder than it was 12 hours earlier (Hamacher et al., 1994).
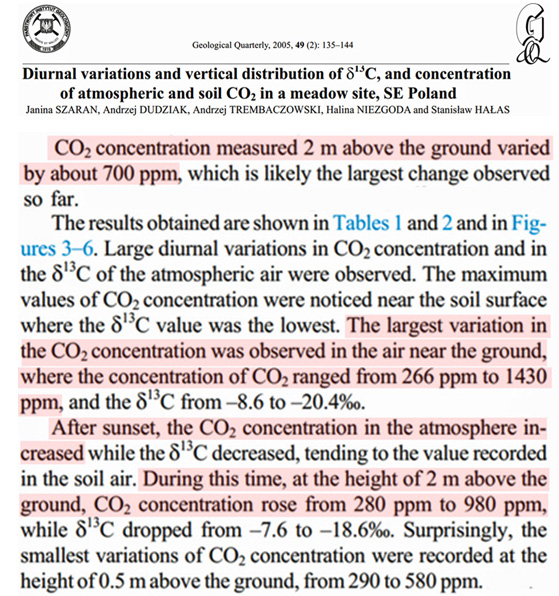
Over meadows, CO2 routinely varies from 280 ppm to 980 ppm within a span of hours (Szaran et al., 2005). Sometimes the variation differentials reach >1,000 ppm (266 to 1,430 ppm). Once again, the higher CO2 ppm values are associated with degrees colder temperatures than the lower CO2 concentrations.
None of these real-world observations of rapid and significant surface air CO2 flux support the contention that surface air CO2 concentrations are the driver or cause of surface air temperature changes.


You may look our live CO2 data measured near ground-level at meteoLCD since more than 26 years, and see the real large diurnal variations, which are heavily damped only under strong winds.
I can’t find the word “convection” mentioned anywhere.