New Paper: From 1992-2014, There Was A
Pause In CO2’s Influence On Temperature
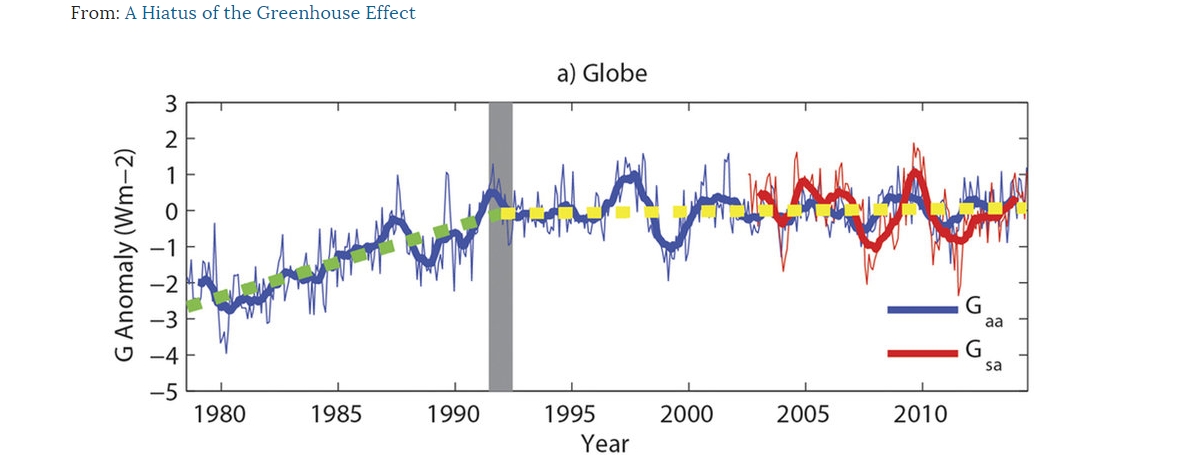
“Monthly variations of the areal averaged atmospheric and surface greenhouse effect parameter anomalies (Gaa and Gsa) from 1979 to 2014 for the (a) globe”
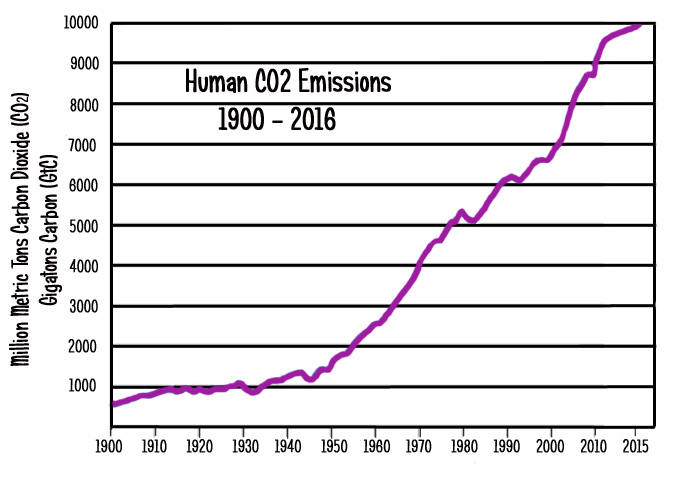
Between the years 1992 and 2014, anthropogenic CO2 emissions rates grew by 65%, or from a yearly average of 6.1 gigatons of carbon (GtC) in 1992 to a rate of 10.1 GtC by 2014 (Global Carbon Budget, 2014).
However, according to a new Nature paper entitled “A Hiatus of the Greenhouse Effect” by Song, Wang, & Tang (2016), there has been an overall hiatus to slight decline in the influence of the greenhouse warming effect on temperature beginning in 1992, which has coincided with the well-established pause in global warming since the early 2000s.
The encapsulating graph from the paper is depicted above, illustrating that the global-scale atmospheric and surface greenhouse effect (Gaa and Gsa) has remained flat or slightly declined between 1992 and 2014, during the same period time that anthropogenic CO2 emissions were rapidly rising.
This strongly suggests that anthropogenic CO2 emissions retain a very modest role in affecting variations in the overall greenhouse effect.
Song, Wang & Tang, 2016
A Hiatus of the Greenhouse Effect
[T]he primary goal of this study is to investigate the spatiotemporal evolution of the greenhouse effect to better evaluate its potential impact.
Because of the shorter period of the CERES EBAF product, the areal averaged Gsa [surface greenhouse effect] is represented only between 2003 and 2014 in Fig. 2 but shows no notable trend over the globe, sea or land. Thus, the surface greenhouse effect has not been strengthened in the last decade.
In the 1980s,a significant increasing Gaa [atmospheric greenhouse effect] tendency exists with a linear estimate of 0.19 W m−2 yr−1. However, this uprising trend pauses starting in circa 1992, when Gaa [atmospheric greenhouse effect] begins to slightly decrease at a rate of −0.01 W m−2 yr−1. This statistically non-significant trend indicates that the enhancing global atmospheric greenhouse effect is slowed down. Moreover, the atmospheric greenhouse effect hiatus can be found over both sea and land.
The oceanic Gaa [atmospheric greenhouse effect]exhibits a notable increasing trend with a rate of 0.21 W m−2 yr−1 in 1979–1991, whereas its rate of change (−0.04 W m−2 yr−1) during 1992–2014 is not statistically significant. By contrast, although a sudden change in the Gaa tendency is observed overland, the breakpoint is approximately 5 years later than that of the oceanic Gaa. The terrestrial Gaa trends are 0.12 W m−2 yr−1 and 0.05 W m−2 yr−1 before and after 1997, respectively.
In the last subperiod [2003-2014], the global averaged SULR [surface upwelling longwave radiation/greenhouse effect] anomaly remains trendless (0.02 W m−2 yr−1) because Ts [global temperatures] stop rising. Meanwhile, the long-term change of the global averaged OLR anomaly (−0.01 W m−2 yr−1) is also not statistically significant. Thus, these two phenomena result in a trendless Gaa [atmospheric greenhouse effect].
[A]remarkably decreasing Gaa trend (−0.27 W m−2 yr−1) exists over the central tropical Pacific, indicating a weakened atmospheric greenhouse effect in this area, which largely offsets the warming effect in the aforementioned surrounding regions. As a result, a trendless global averaged Gaa [atmospheric greenhouse effect] is displayed between 1991 and 2002 (Fig. 2).
Again, no significant trend of the global averaged Gaa [atmospheric greenhouse effect] is found from 2003 to 2014 (Fig. 2) because the enhanced warming effect over the western tropical Pacific is largely counteracted by the weakened warming influence on the central tropical Pacific.
Explanation: Cloud Variations, Water Vapor Dominate Greenhouse Effect, With Insignificant CO2 Influence
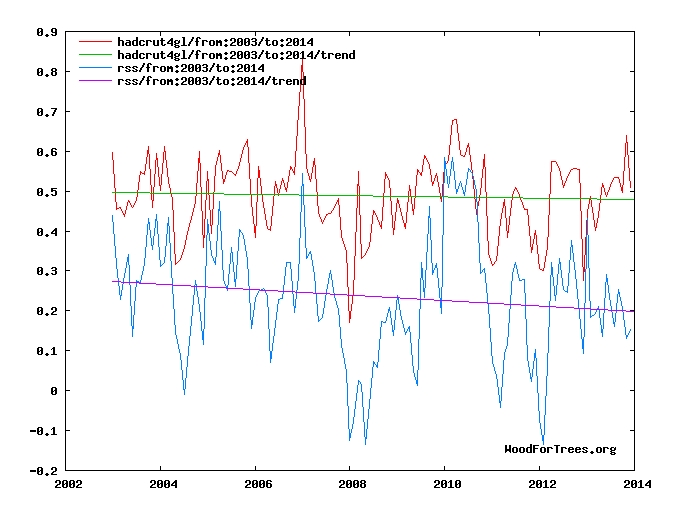
As scientists Song, Tang, & Wang (2016) point out, during the 2003 to 2014 period, global temperatures “stop rising”. In fact, temperatures declined slightly during this period according to HadCRUT and RSS.
Song, Wang, & Tang ultimately provide an explanation for the hiatus in the global-scale greenhouse effect (from the early 1990s to present) and temperature rise (from the early 2000s to present). They insinuate that water vapor and clouds are the dominant contributors to greenhouse warming, and the CO2 contribution is quite modest by comparison. Small variations in water vapor and cloud can therefore supersede large variations in CO2 in determining trends in the overall greenhouse effect. Below are the key points from the rest of the paper detailing CO2’s small contribution to the overall greenhouse effect (relative to water vapor, clouds).
Song, Wang & Tang, 2016
[T]he influences of water vapor and clouds … contribute approximately 75% of the total [greenhouse] effect.
The results above indicate that the notably downward Gaa tendency over the central tropical Pacific indeed plays an important role in inducing the greenhouse effect hiatus since the 1990s. What causes this decreasing Gaa [atmospheric greenhouse effect]? The variation of the greenhouse effect is substantially influenced by its contributors, including water vapor, clouds, and GHGs. GHG concentrations have risen steadily during recent decades. The variations of metrics related to the other two contributors are given in Fig. 4a and are based on the CERES-EBAF products between 2003 and 2014. The total column precipitable water (TCPW) anomaly significantly increases at a rate of 0.44 cm yr−1. However, the cloud area fraction (CAF) anomaly is reduced by −0.60% yr−1, which is consistent with the decreasing cloud activity described in previous publications. Therefore, although the greenhouse effect can be enhanced by increasing GHGs and water vapor in the atmosphere, it can be weakened by decreasing clouds. If these two actions offset each other, a hiatus of the global greenhouse effect will result.
[T]his pause in the greenhouse effect is mostly caused by the high number of La Niña events between 1991 and 2014. A strong La Niña indicates suppressed convection in the tropical central Pacific that reduces atmospheric water vapor content and cloud volume.
[T]he atmospheric and surface greenhouse effect parameters both become trendless when clouds are considered. … Overall, the downward tendency of clouds is the dominant contributor to the greenhouse effect hiatus.
In conclusion, the pause of the greenhouse effect since the 1990s may be one of the reasons for the global warming hiatus starting in the early 2000s.
The Scientific Literature Substantiates Insignificant CO2 Influence
The explanation that water vapor and clouds are the most dominant contributors to the overall greenhouse effect — and that the CO2 contribution is insignificant by comparison — has been well known and documented in the scientific literature for decades. For example:
Willett, 1974
“[R]ecent increases of atmospheric carbon dioxide have contributed much less than 5% of the recent changes of atmospheric temperature, and will contribute no more than that in the foreseeable future.”
Dunbar, 1976
“[T]he measured increase in carbon dioxide in the atmosphere, according to the most recent computations, would not be enough to have any measurable climatic effect. Rasool and Schneider (1971) conclude that an increase in the carbon dioxide content of eight times the present level would produce an increase in surface temperature of less than 2°C, and that if the concentration were to increase from the present level of 320 parts per million to about 400 by the year 2000, the predicted increase in surface global temperature would be about 0.1°C.”
Ramanathan et al., 1989
“Water vapour and cloud are the dominant regulators of the radiative heating of the planet. … The greenhouse effect of clouds may be larger than that resulting from a hundredfold increase in the CO2 concentration of the atmosphere. … The size of the observed net cloud forcing is about four times as large as the expected value of radiative forcing from a doubling of CO2. The shortwave and longwave components of cloud forcing are about ten times as large as those for a CO2 doubling.”
Wielicki et al., 2002
“It is widely assumed that variations in Earth’s radiative energy budget at large time and space scales are small. We present new evidence from a compilation of over two decades of accurate satellite data that the top-of-atmosphere (TOA) tropical radiative energy budget is much more dynamic and variable than previously thought. Results indicate that the radiation budget changes are caused by changes in tropical mean cloudiness. The results of several current climate model simulations fail to predict this large observed variation in tropical energy budget. The missing variability in the models highlights the critical need to improve cloud modeling in the tropics so that prediction of tropical climate on interannual and decadal time scales can be improved.”
Kauppinen et al., 2014
“We will show that changes of relative humidity or low cloud cover explain the major changes in the global mean temperature. We will present the evidence of this argument using the observed relative humidity between years 1970 and2011 and the observed low cloud cover between years 1983 and 2008. One percent increase in relative humidity or in low cloud cover decreases the temperature by 0.15 °C and 0.11 °C, respectively. In the time periods mentioned before the contribution of the CO2increase was less than 10% to the total temperature change.”
Hamdan, 2016
“The analysis showed that the main atmospheric parameters that affect the amount of global radiation received on earth’s surface are cloud cover and relative humidity. Global radiation correlates negatively with both variables. Linear models are excellent approximations for the relationship between atmospheric parameters and global radiation. A linear model with the predictors total cloud cover, relative humidity, and extraterrestrial radiation is able to explain around 98% of the variability in global radiation.”
Summarizing Question: Why is there so much preoccupation with atmospheric CO2 concentrations and reducing anthropogenic CO2 emissions when it is well documented in the peer-reviewed scientific literature that the CO2 contribution to the overall greenhouse effect is so weak that it can be easily supplanted by small changes in clouds and water vapor, or natural climate-changing constituents?


Tut!
This will never do!
Bottom line, as we already knew, the AGW emperor wannabes have no trend.
https://pbs.twimg.com/media/CXvEuNlUQAAtdMs.jpg
Serious question: Doesn’t the Maxwell Gravito Thermic effect negate the possibility of any atmospheric greenhouse effect at all?
Ah, interesting. Feynman proved it as well.
http://hockeyschtick.blogspot.de/2015/07/physicist-richard-feynman-proved.html
I guess I’m with Feynman on this one. Just to be on the safe side. If I have to pick between Jim Hansen and Richard Feynman, hey, I’ll take Feynman.
Thanks, Dirk. I am embarrassed to admit I wasn’t aware that Feynman had weighed in on that.
Get his book, QED, published in1985. Very readable.
OH, yes, that I have. Very excellent book, too. I just wasn’t aware of his contribution(s) to “greenhouse.”
Thanks! =)
PS – Have you seen his videos online? Here are the first of each of two series (the rest is then easy to find)
Auckland
https://www.youtube.com/watch?v=xdZMXWmlp9g
Cornell
https://www.youtube.com/watch?v=j3mhkYbznBk
Bonus – Why there are anti-particles (1 of 7).
https://www.youtube.com/watch?v=AFYWF7T5098
If you like Feynman, you’ll love those!
So, Anthropogenic CO2 emissions have grown “from 6.1 GtC/yr [1992] to 10.1 GtC/yr [today].” In the IPCCs AR4 report, I was directed in 2007 to a table (which I’ve lost) that documented that anthropogenic emissions constituted only 2.91% of total, the remainder all from natural sources. Since that time, I’ve seen varying figures ranging from ~3% to ~4.5% for our contribution.
Our relative contribution of CO2 is almost trivial. It would be great if this fact were pointed out by AGW supporters every time absolute figures were released.
Thanks again, Pierre.
The problem with the warmists is their obsession with just one greenhouse gas C02. They have simplified climatology to such a degree they forgot that atmosphere itself creates the greenhouse effect. Simply by increasing C02 to 400 ppb doesn’t significantly increase the overall greenhouse effect of the atmosphere or the overall density of atmosphere.
CO2, not C02!
“[T]his pause in the greenhouse effect is mostly caused by the high number of La Niña events between 1991 and 2014. A strong La Niña indicates suppressed convection in the tropical central Pacific that reduces atmospheric water vapor content and cloud volume.”
Of course, decreasing cloud means increasing SW radiation and more direct solar heating. Globally, less clouds generally mean more warming. In the tropics however, the balance between the radiative greenhouse heating effect of water vapour in clouds is quite finely balanced by incoming solar radiation. They tend to cancel one another out. In the extratropical regions, storm clouds reflect a lot more SW radiation than they contribute to the total atmospheric greenhouse effect (water vapour + other GHGs), so cooling results from increased cloudiness in mid-latitudes. But on the basis of this study, all else being equal, it would seem that decreased cloudiness (water vapour) in the tropics has been responsible for a small net decrease in the radiation budget which has given us the ‘pause’ in global warming. Whatever the case, natural ENSO variability and water vapour/cloud feedbacks are apparently far more significant than increasing atmospheric CO2.
A little game for the amateur statistician.
» How much solar IR gets through the rest of the atmosphere to the troposphere and below?
» How much of the IR is at the correct frequency to excite CO2?
» How much of this IR will hit the water molecules (at 0.1% to 4% of the atmosphere, much higher in some clouds) in the atmosphere, making it unavailable for CO2 molecules?
» How much of the IR (at the correct frequency) hits a very rare CO2 molecule in the atmosphere (at 0.04% of the atmosphere)?
» How many of those CO2 molecules just emit the IR energy without heating anything in the atmosphere? (Excitation of CO2 by IR is measured in micro-seconds before an IR photon is emitted by the excited CO2 molecule in the lab)
» How many of these rare excited CO2 molecules will actually collide with other atmospheric molecules in the atmosphere so warming it up?
» How many of those rare and excited CO2 molecules are the product of humans burning fuel?
~~~~~~~~~~~~~~~~~~~~~~~~~~~~~~~~~~~~
So you have to have infrared(IR) radiation at a particular frequency get through the atmosphere avoiding hitting any water, find some extremely rare CO2 molecules and in the microseconds the CO2 molecule are excited they have to colloid with other gas molecules (thereby losing the IR energy as KE) so warming the atmosphere, and then somehow you have to sort the natural CO2 molecules from the man-made ones.
1. CO2 molecules warming the atmosphere is a rare event.
2. CO2 molecules of man-made origin warming the atmosphere is a much, much, much rarer event!
Professor Wood was correct CO2 does not warm the greenhouse!
Robinson & Catling answered most of your questions when they created a mathematical model explaining the temperature from the surface to the top of the stratosphere for Venus, Earth, Jupiter, Saturn, Titan, Uranus and Neptune. Their only “FAIL” was Mars where the surface pressure is less than 0.1 bar:
http://faculty.washington.edu/dcatling/Robinson2014_0.1bar_Tropopause.pdf
In layman’s language they are saying that atmospheres absorb radiation in direct proportion to pressure at low pressures and in proportion to the square of the pressure at high pressures.
We call the region where the linear law applies the “Stratosphere”.
We call the region where the square law applies the “Troposphere”.
The transition between these two regions corresponds to a pressure of 0.1-0.2 bar and we call this region the “Tropopause”.
One of the questions you ask is:
“» How many of those CO2 molecules just emit the IR energy without heating anything in the atmosphere?”
If the excited CO2 molecule is in the upper stratosphere there is a probability of ~50% that an emitted photon will be radiated directly into space.
If the excited CO2 molecule is near the surface of the Earth there is an infinitesimally small probability that an emitted photon will be radiated directly into space. Collision broadening ensures that a photon emitted around 15 microns will be absorbed in the first hundred meters of the atmosphere.
Is there enough solar IR to worry about? There’s much, much more energy available in visible light and as UV in the stratosphere.
And there’s enough [rare] CO2 so that the atmosphere is essentially opaque to it at certain wavelengths. Just because it’s a trace gas doesn’t mean it has no effect. And just because it has an effect doesn’t mean the models model the right effect.
Gavin Schmidt may be feeling a little exposed right now as nobody believes his “Hottest Year Evah!” meme.
Nevertheless there is a strong correlation between [CO2] and temperature:
[CO2] = A*ln(T) where A = +4.4% [CO2]/Kelvin.
If you doubt me take a look at this:
https://diggingintheclay.wordpress.com/2013/05/04/the-dog-that-did-not-bark/
Thank-you gallopingcamel,
I have read through Robinson & Catling documents and obviously I need to re-read them again.
Your diggingintheclay reference is in nice in easier steps (and I for one need the little steps!) and says it very well.
IMO the final line says a lot —
“It also leaves the question “What caused the 0.8 K global warming since 1850”? If CO2 lived up to Arrhenius’ expectations we would be in no doubt at all.”
If we have warmed by 0.8K since 1850 then mankind and the majority of life on the planet are well able to adapt such a subtle warmth without undue panic.