A Warmer Past: Non-Hockey Stick Reconstructions
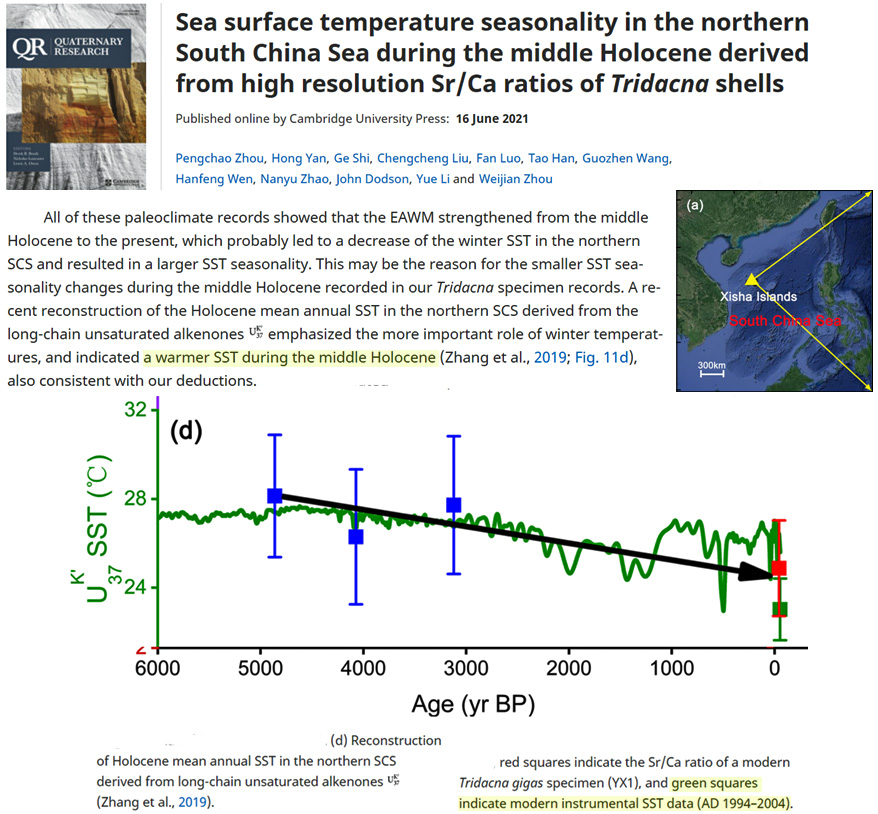
Zhou et al., 2021 South China Sea ~4°C warmer SST during the Middle Holocene…1994-2004 coldest temperatures of the last 6000 years
Tarasov et al., 2021 (full paper) Arctic Siberia was 3.5 to 5°C warmer than today during the peak of the last glacial (180 ppm CO2), providing year-round grass grazing for large herbivores
Environments during the spread of anatomically modern humans across Northern Asia 50–10 cal kyr BP …. Northern Asia (here, the Russian Federation east of the Urals) played a key role in the spread of anatomically modern humans (AMH) across the Eurasian continent during the Upper Palaeolithic (UP). … Contrary to the long-standing view of a generally colder-than-present last glacial climate, these proxy records reveal evidence that summers were warmer than today by several degrees Celsius, providing additional advantages for human activities. Another benefit for large herbivores, and thus human subsistence, were the generally low winter precipitation levels (similar to those of the modern steppe regions of Mongolia), which sustained year-round grazing grounds. These factors apparently outweighed the harsh colder-than-present winter conditions and promoted habitation of AMH in Northern Asia even during the Last Glacial Maximum (LGM) ca. 30‒18 cal kyr BP. … [R]econstructed mean July temperatures 12°C for most of the last cold stage in the study area, where modern mean July temperatures are about 7°C … [A]t least 3.5°C higher-than-present summer temperatures during the Last Glacial Maximum [CO2 180 ppm] in the southern part of eastern Siberia
Wetterich et al., 2021 Siberian Arctic had “warmer-than-today temperatures (by up to 4–4.5° C)” during the last glacial (180 ppm CO2), or between “39 and 31 cal kyr BP”
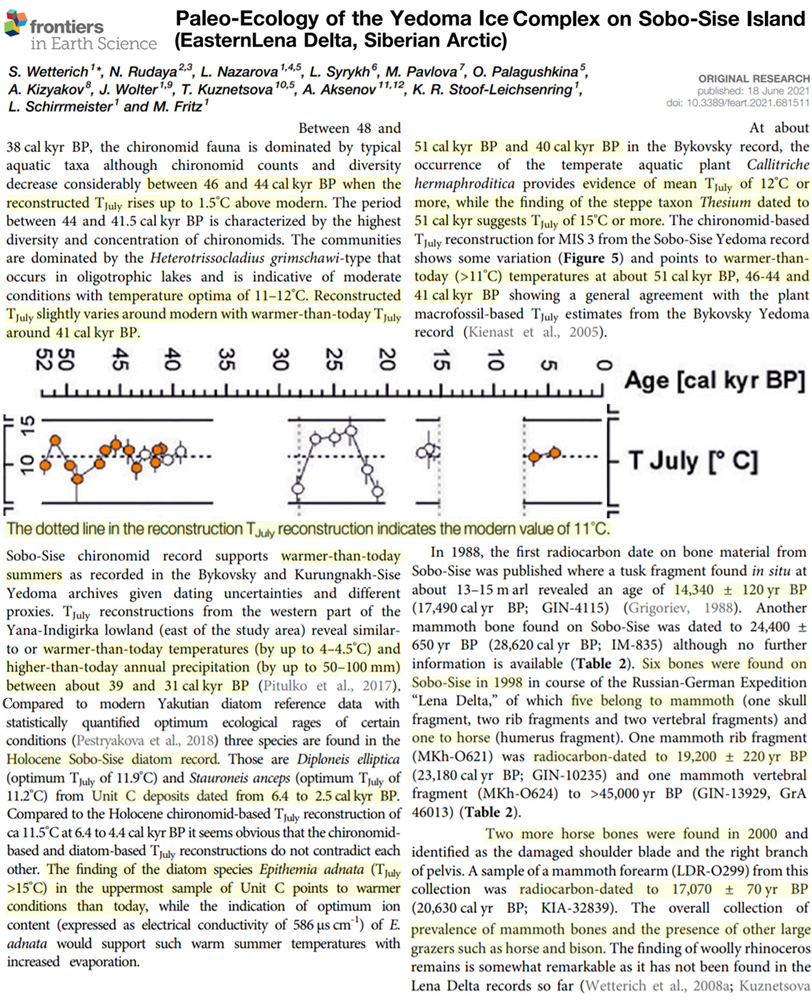
Between 48 and 38 cal kyr BP, the chironomid fauna is dominated by typical aquatic taxa although chironomid counts and diversity decrease considerably between 46 and 44 cal kyr BP when the reconstructed TJuly rises up to 1.5°C above modern. The period between 44 and 41.5 cal kyr BP is characterized by the highest diversity and concentration of chironomids. The communities are dominated by the Heterotrissocladius grimschawi-type that occurs in oligotrophic lakes and is indicative of moderate conditions with temperature optima of 11–12°C. … Reconstructed TJuly slightly varies around modern with warmer-than-today TJuly around 41 cal kyr BP. … At about 51 cal kyr BP and 40 cal kyr BP in the Bykovsky record, the occurrence of the temperate aquatic plant Callitriche hermaphroditica provides evidence of mean TJuly of 12° C or more, while the finding of the steppe taxon Thesium dated to 51 cal kyr suggests TJuly of 15°C or more. The chironomid-based TJuly reconstruction for MIS 3 from the Sobo-Sise Yedoma record shows some variation (Figure 5) and points to warmer-than today (>11° C) temperatures at about 51 cal kyr BP, 46-44 and 41 cal kyr BP showing a general agreement with the plant macrofossil-based TJuly estimates from the Bykovsky Yedoma record (Kienast et al., 2005). … TJuly reconstructions from the western part of the Yana-Indigirka lowland (east of the study area) reveal similarto or warmer-than-today temperatures (by up to 4–4.5° C) and higher-than-today annual precipitation (by up to 50–100 mm) between about 39 and 31 cal kyr BP (Pitulko et al., 2017)
Cruz et al., 2021 Argentina 1.7°C to 4.4°C warmer than today during the 1800s
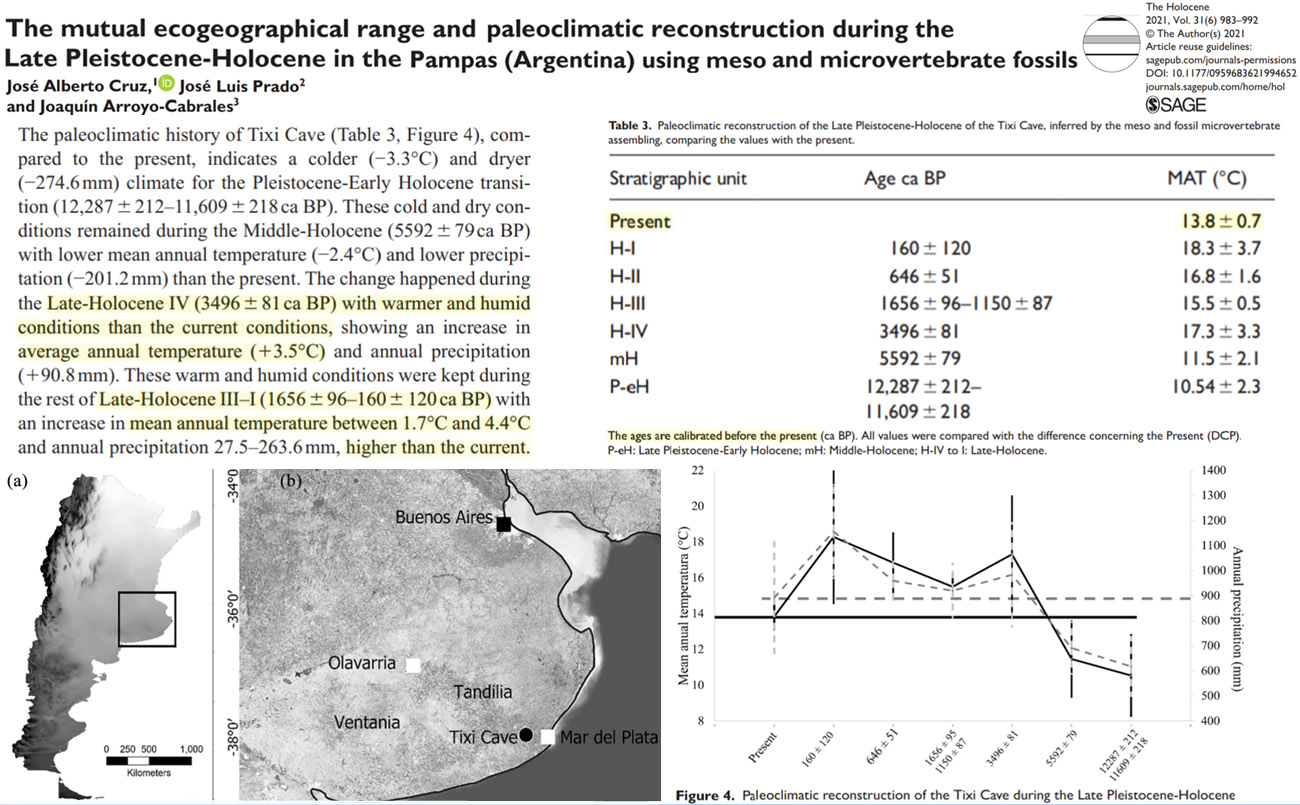
The paleoclimatic history of Tixi Cave (Table 3, Figure 4), compared to the present, indicates a colder (−3.3°C) and dryer (−274.6mm) climate for the Pleistocene-Early Holocene transition (12,287±212–11,609±218ca BP). These cold and dry conditions remained during the Middle-Holocene (5592±79ca BP) with lower mean annual temperature (−2.4°C) and lower precipitation (−201.2mm) than the present. The change happened during the Late-Holocene IV (3496±81ca BP) with warmer and humid conditions than the current conditions, showing an increase in average annual temperature (+3.5°C) and annual precipitation (+90.8mm). These warm and humid conditions were kept during the rest of Late-Holocene III–I (1656±96–160±120 ca BP) with an increase in mean annual temperature between 1.7°C and 4.4°C and annual precipitation 27.5–263.6mm, higher than the current.
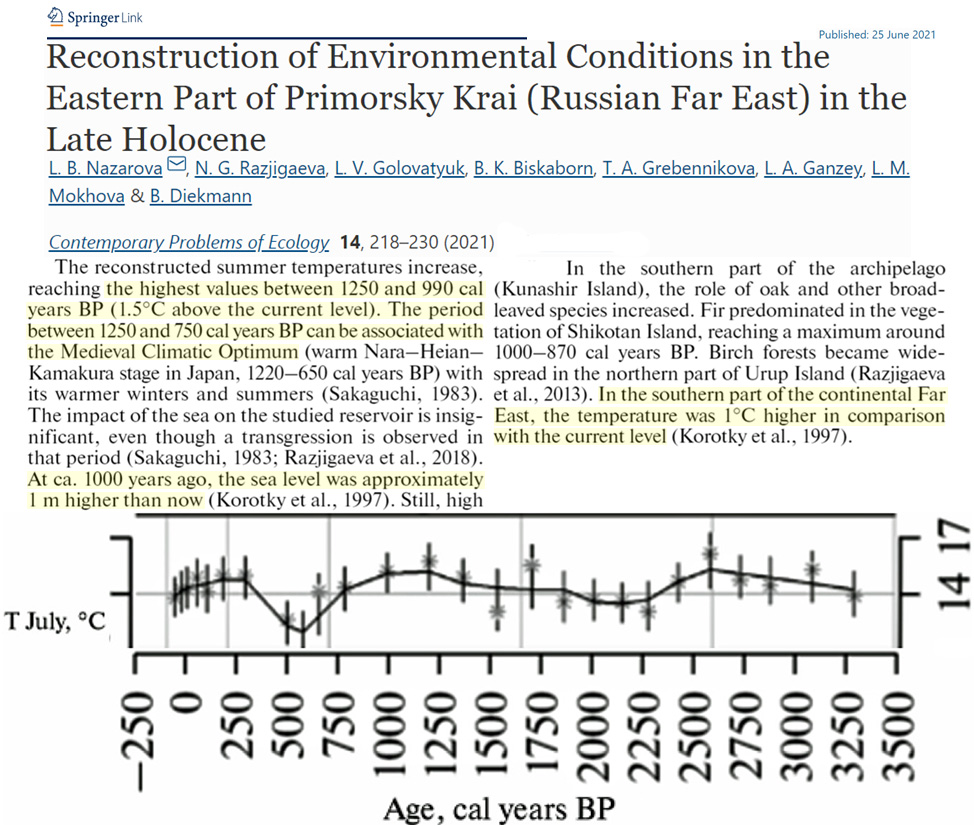
Nazarova et al., 2021 (full) East Russia 1.5°C warmer than present during Medieval Warm Period (750-1250 AD)
The Medieval Climate Optimum (Nara–Heian–Kamakura stage in Japan) reconstructed for the eastern part of Primorsky Krai in the period from 1250 to 750 cal years BP featured a humid climate with summer temperatures ca. 1.5°C higher than at present. The period between 750 and 250 cal years BP correlates with the Little Ice Age: summer temperatures had dropped to 1.5–2°C below the modern one.
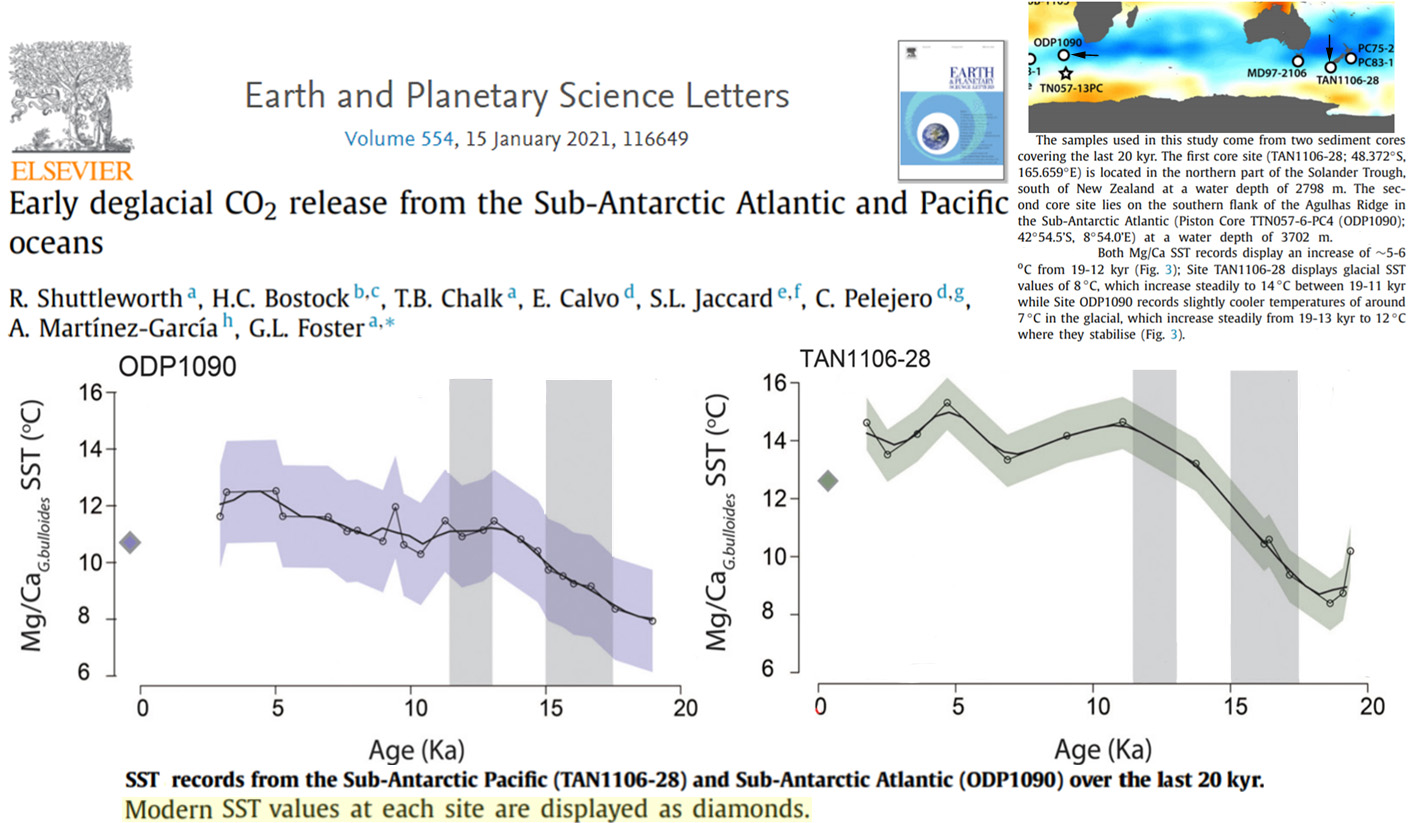
Shuttleworth et al., 2021 Sub-Antarctic Atlantic ~2°C warmer (see diamonds) ~4000 to ~5000 years ago
Allan et al., 2021 Greenland 5-7°C warmer (4-5°C vs. 10-12°C) than today from 7,500 to 5,500 years ago.
At present…summer SST ranging from 4.0-5.2 °C (Ribergaard 2014). … Subzone B2 (from ~10 to 5 ka BP) is marked by…high summer SST ranging from 6 to 12 °C with an average of ~9 °C … Subzone A3 (from ~2.7 to ~1.3 ka BP) is characterized by cold conditions with summer SST of ~5 °C … Optimal thermal conditions…the July surface air temperature (SAT) estimated from pollen grains was ~10 to ~12 °C from ~7.5 to ~5.5 ka BP (Frechette & de Vernal 2009).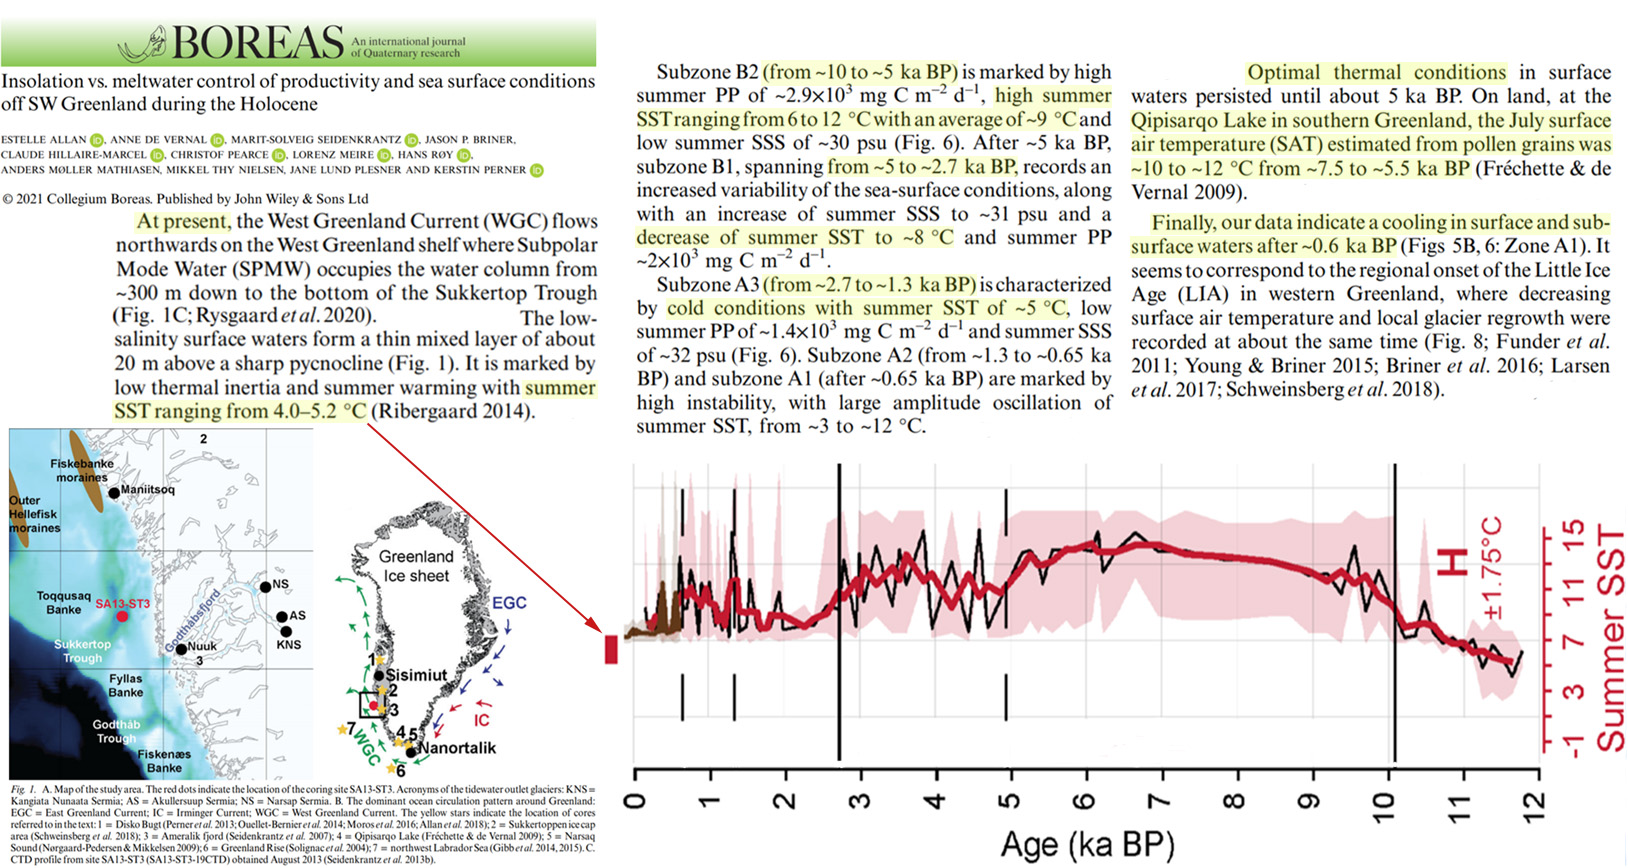
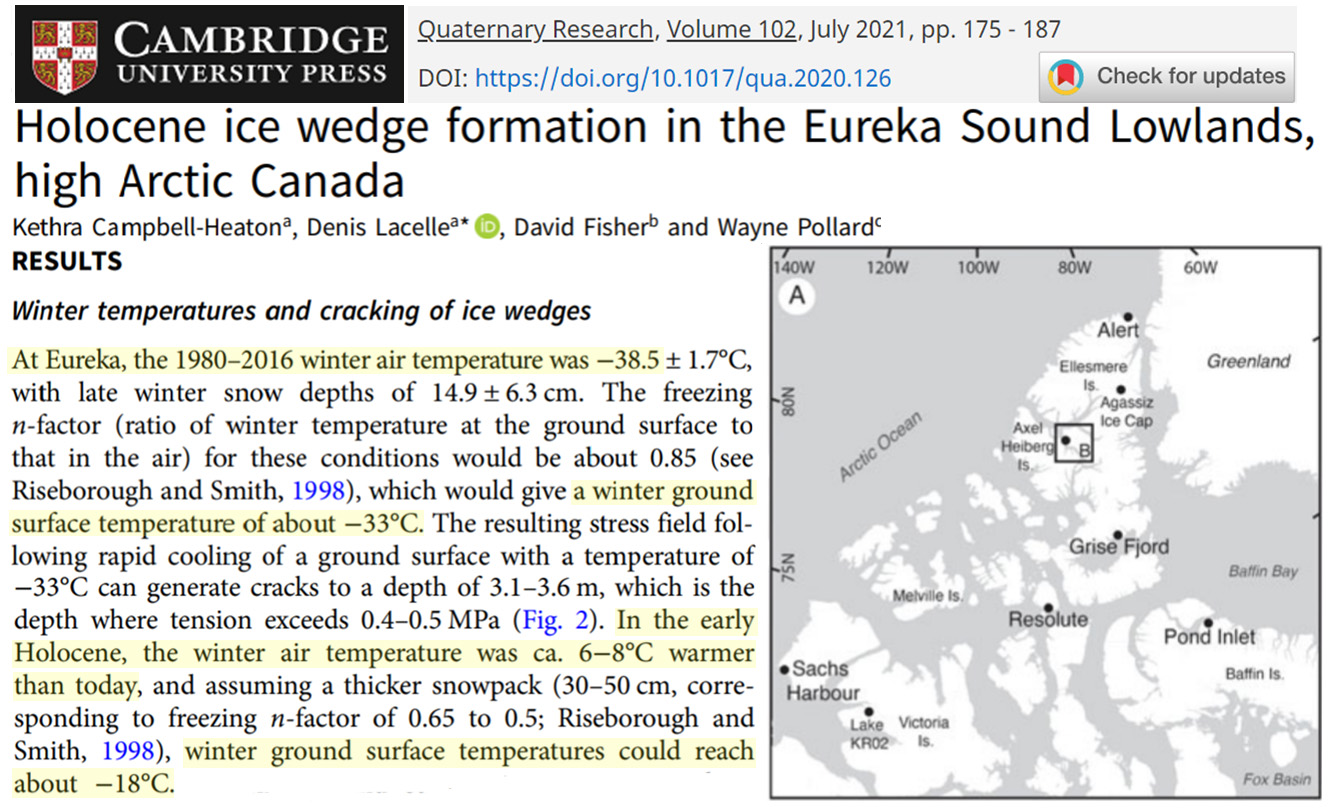
Campbell-Heaton et al., 2021 Arctic Canada 6-8°C warmer than today during Early Holocene
The 25-yr mean annual air temperature record shows a rapid early Holocene warming with temperatures being 6°C warmer than today at 10 ka followed by a gradual cooling to AD 1700 (Lecavalier et al., 2017). … In the early Holocene, the winter air temperature was ca. 6-8°C warmer than today
Myers et al., 2021 Antarctica “5 °C warmer than modern conditions” during the Early Holocene
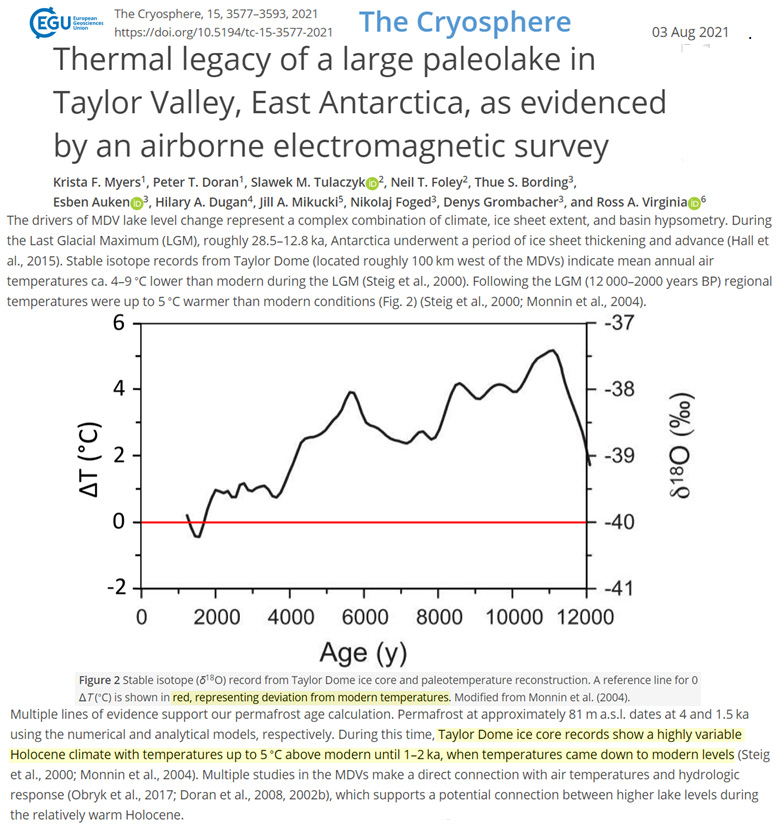
The drivers of MDV lake level change represent a complex combination of climate, ice sheet extent, and basin hypsometry. During the Last Glacial Maximum (LGM), roughly 28.5–12.8 ka, Antarctica underwent a period of ice sheet thickening and advance (Hall et al., 2015). Stable isotope records from Taylor Dome (located roughly 100 km west of the MDVs) indicate mean annual air temperatures ca. 4–9 °C lower than modern during the LGM (Steig et al., 2000). Following the LGM (12 000–2000 years BP) regional temperatures were up to 5 °C warmer than modern conditions (Fig. 2) (Steig et al., 2000; Monnin et al., 2004). … Resistivity data suggest that active permafrost formation has been ongoing since the onset of lake drainage and that as recently as 1500–4000 years BP, lake levels were over 60 m higher than present. This coincides with a warmer-than-modern paleoclimate throughout the Holocene inferred by the nearby Taylor Dome ice core record. Our results indicate Mid to Late Holocene lake level high stands, which runs counter to previous research finding a colder and drier era with little hydrologic activity throughout the last 5000 years. … Taylor Dome ice core records show a highly variable Holocene climate with temperatures up to 5 ∘C above modern until 1–2 ka, when temperatures came down to modern levels (Steig et al., 2000; Monnin et al., 2004).
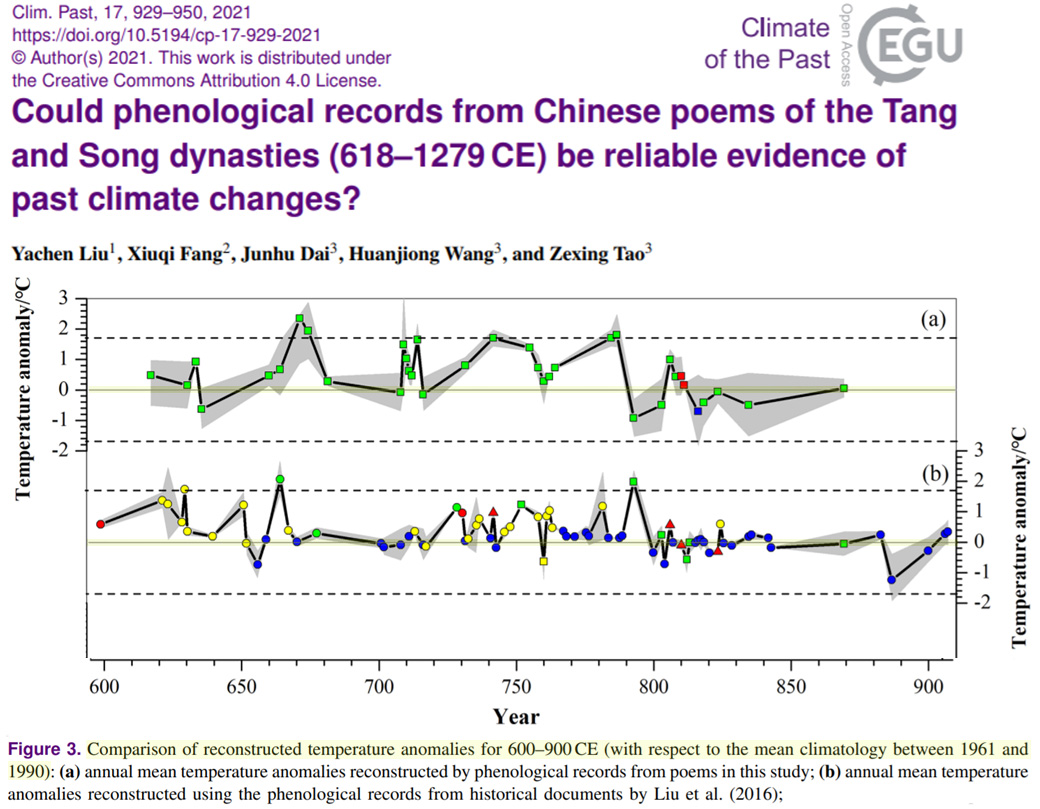
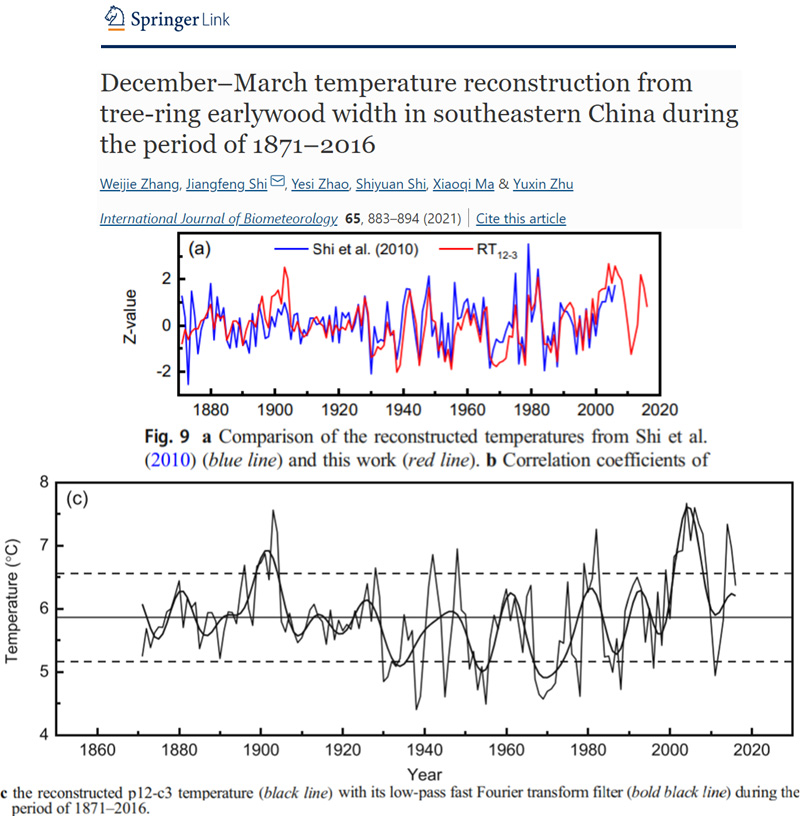
Liu et al., 2021 Central China 1-2°C warmer than 1961-1990 during 1st millennium per temperature reconstructions from poems
Lu et al., 2021 Northeast China 2°C warmer than today in the 1800s
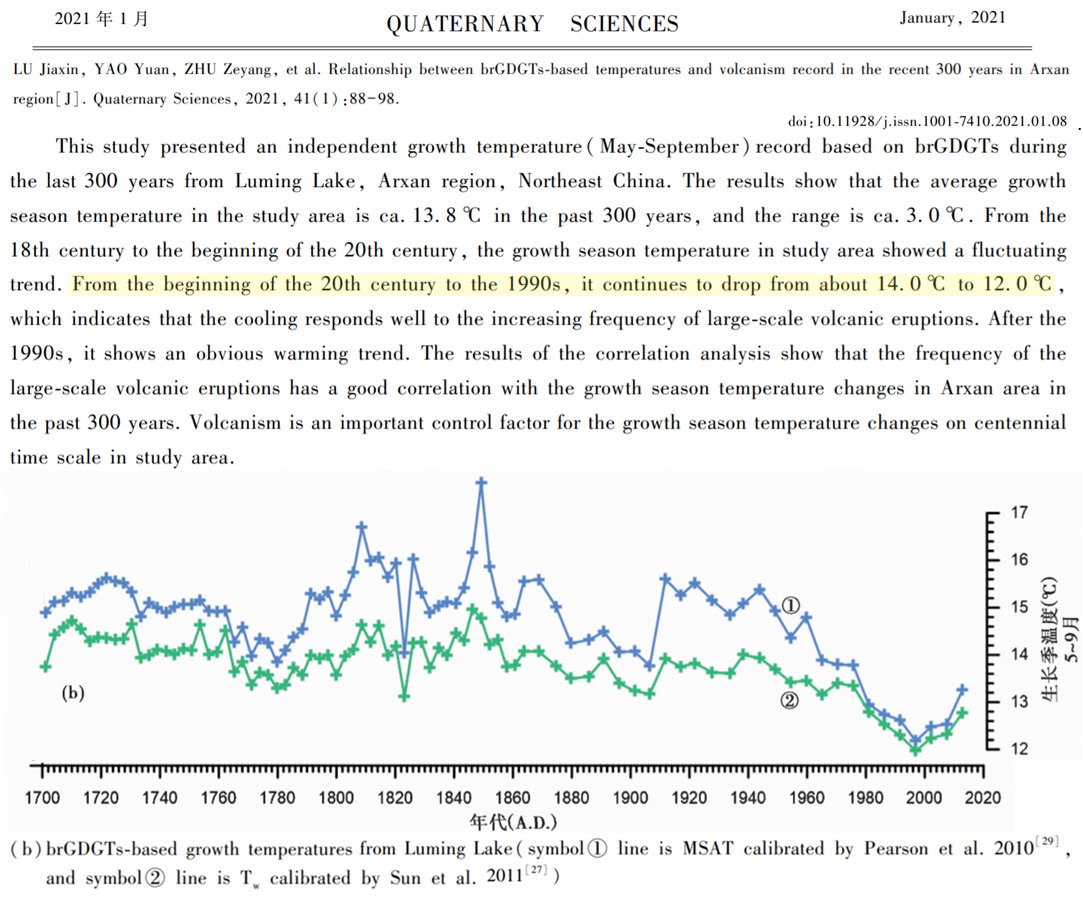
This study presented an independent growth temperature (May-September) record based on brGDGTs during the last 300 years from Luming Lake, Arxan region, Northeast China. The results show that the average growth season temperature in the study area is ca. 13.8 ℃ in the past 300 years, and the range is ca. 3.0 ℃. From the 18th century to the beginning of the 20th century, the growth season temperature in study area showed a fluctuating trend. From the beginning of the 20th century to the 1990s, it continues to drop from about 14.0 ℃ to 12.0 ℃, which indicates that the cooling responds well to the increasing frequency of large-scale volcanic eruptions. After the 1990s, it shows an obvious warming trend. The results of the correlation analysis show that the frequency of the large-scale volcanic eruptions has a good correlation with the growth season temperature changes in Arxan area in the past 300 years. Volcanism is an important control factor for the growth season temperature changes on centennial time scale in study area.
Hällberg et al., 2021 Indian Ocean “3°C warmer than today around 5 ka BP”
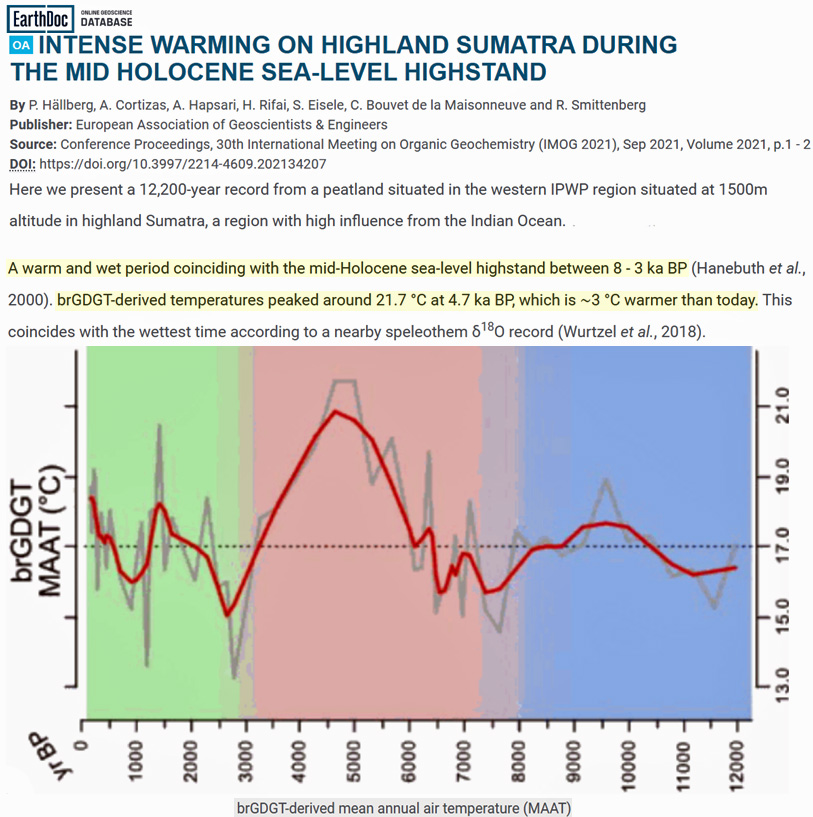
Here we present a 12,200-year record from a peatland situated in the western IPWP region situated at 1500m altitude in highland Sumatra, a region with high influence from the Indian Ocean. … Around 8 ka BP the climate started to warm considerably, ENSO was reduced and temperatures were as much as 3˚C warmer than today around 5 ka BP.
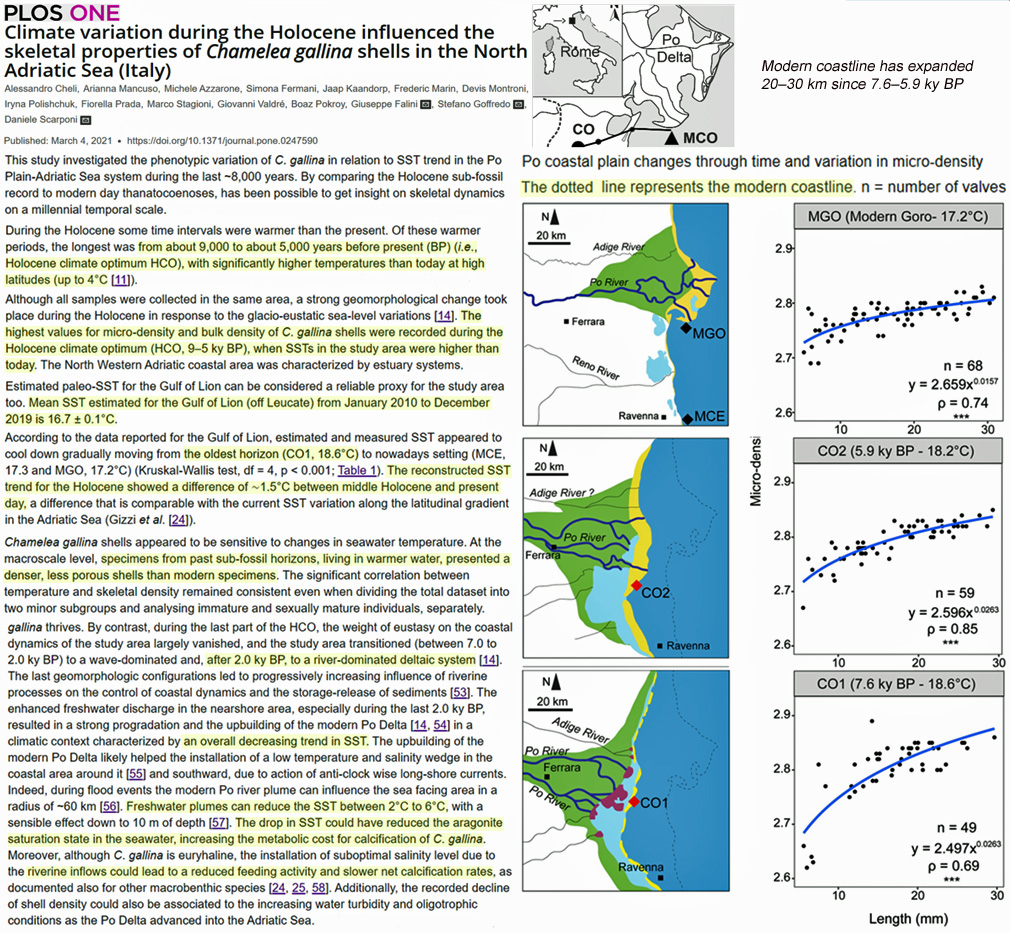
Cheli et tal., 2021 Adriatic Sea (Italy) 4°C warmer than today 9,000 to 5,000 years ago
Of these warmer periods, the longest was from about 9,000 to about 5,000 years before present (BP) (i.e., Holocene climate optimum HCO), with significantly higher temperatures than today at high latitudes (up to 4°C [11]).
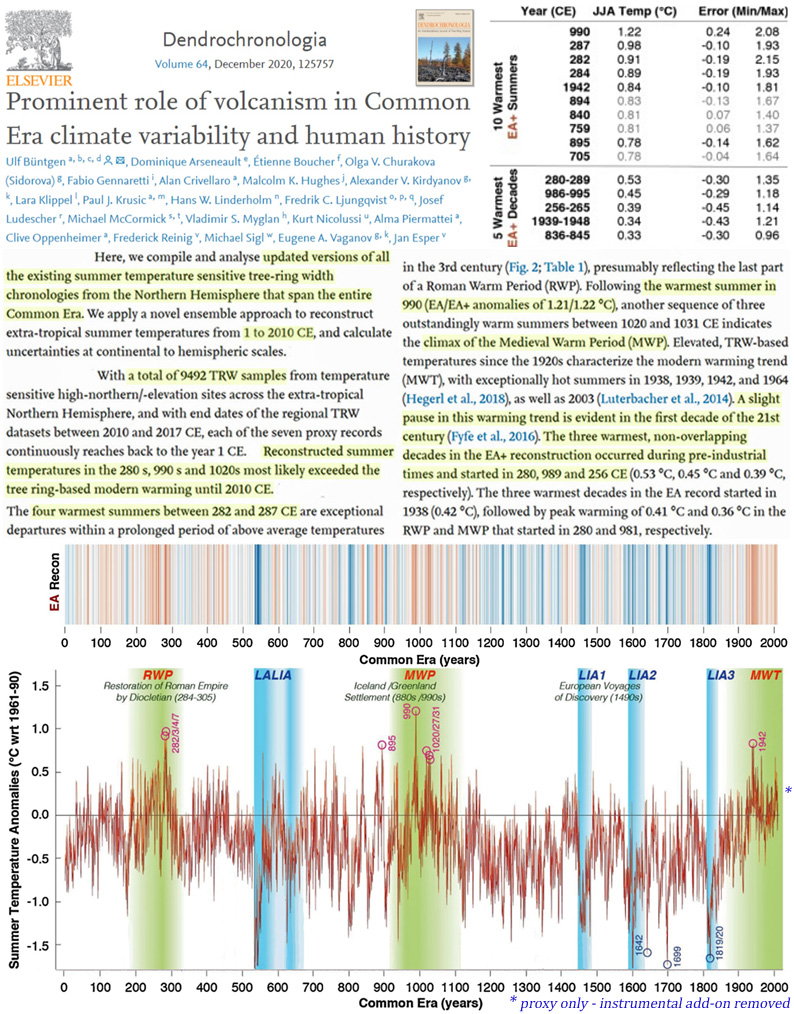
Buntgen et al., 2021 Northern Hemisphere, 1940s 4th warmest decade of 1-2010 CE
Following the warmest summer in 990 (EA/EA+ anomalies of 1.21/1.22 °C), another sequence of three outstandingly warm summers between 1020 and 1031 CE indicates the climax of the Medieval Warm Period (MWP). Elevated, TRW-based temperatures since the 1920s characterize the modern warming trend (MWT), with exceptionally hot summers in 1938, 1939, 1942, and 1964 (Hegerl et al., 2018), as well as 2003 (Luterbacher et al., 2014). A slight pause in this warming trend is evident in the first decade of the 21st century (Fyfe et al., 2016). The three warmest, non-overlapping decades in the EA+ reconstruction occurred during pre-industrial times and started in 280, 989 and 256 CE (0.53 °C, 0.45 °C and 0.39 °C, respectively).
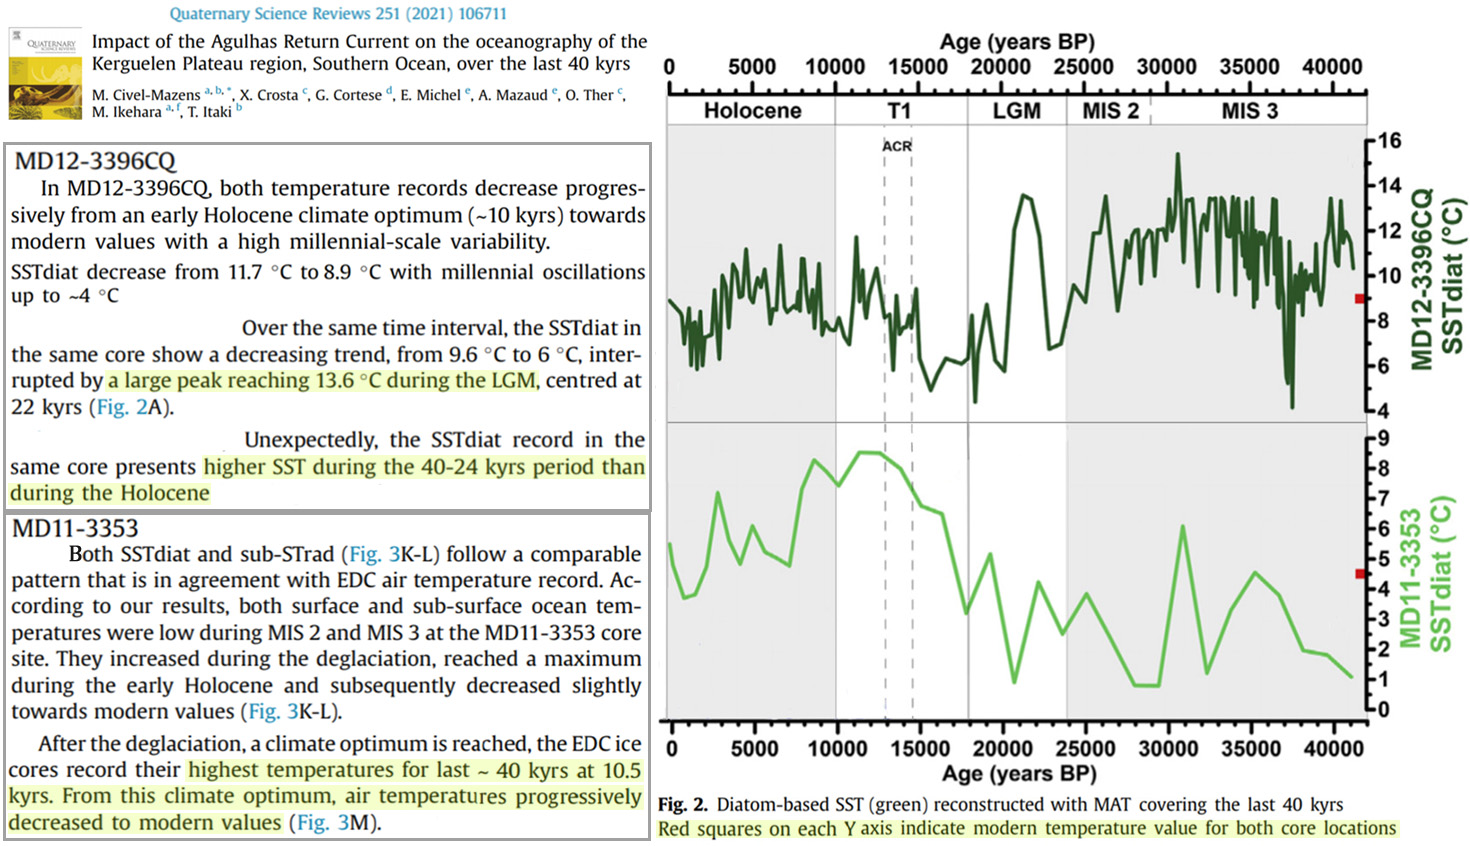
Civel-Mazens et al., 2021 22,000 years ago (180 ppm CO2) Southern Ocean surface temperatures peaked at 13.6°C, which is ~4-5°C warmer than today (~9°C)
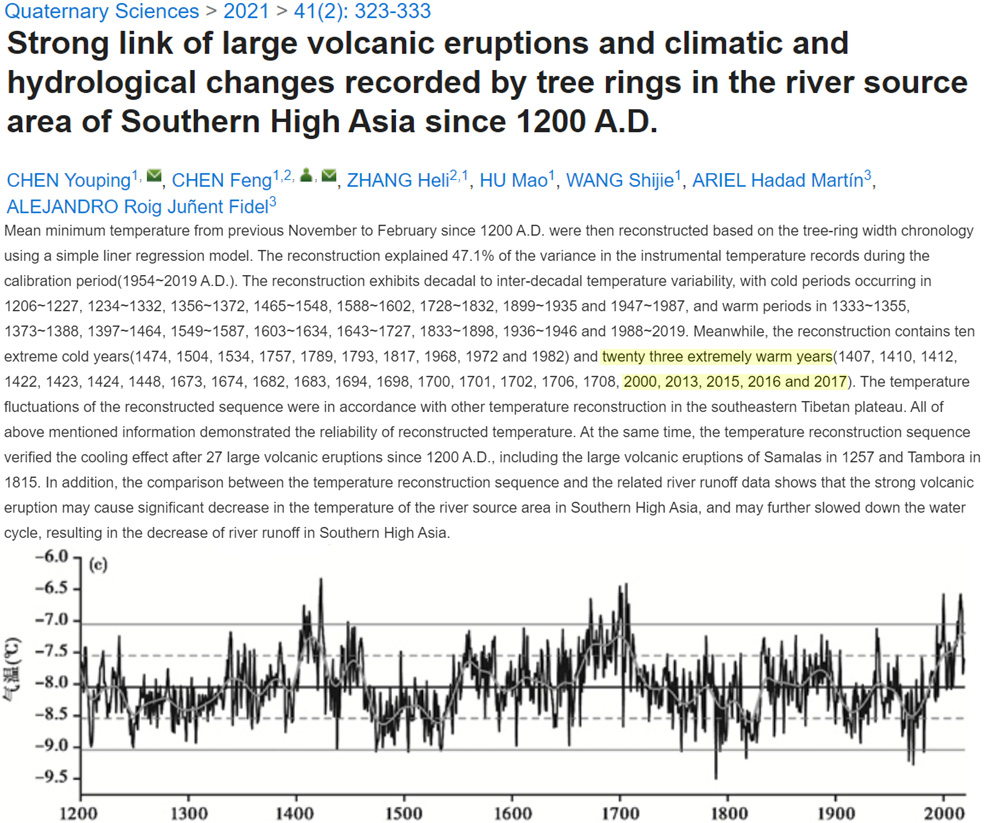
Chen et al., 2021 Southern High Asia as warm as 2000s during 1400s, 1690s AD
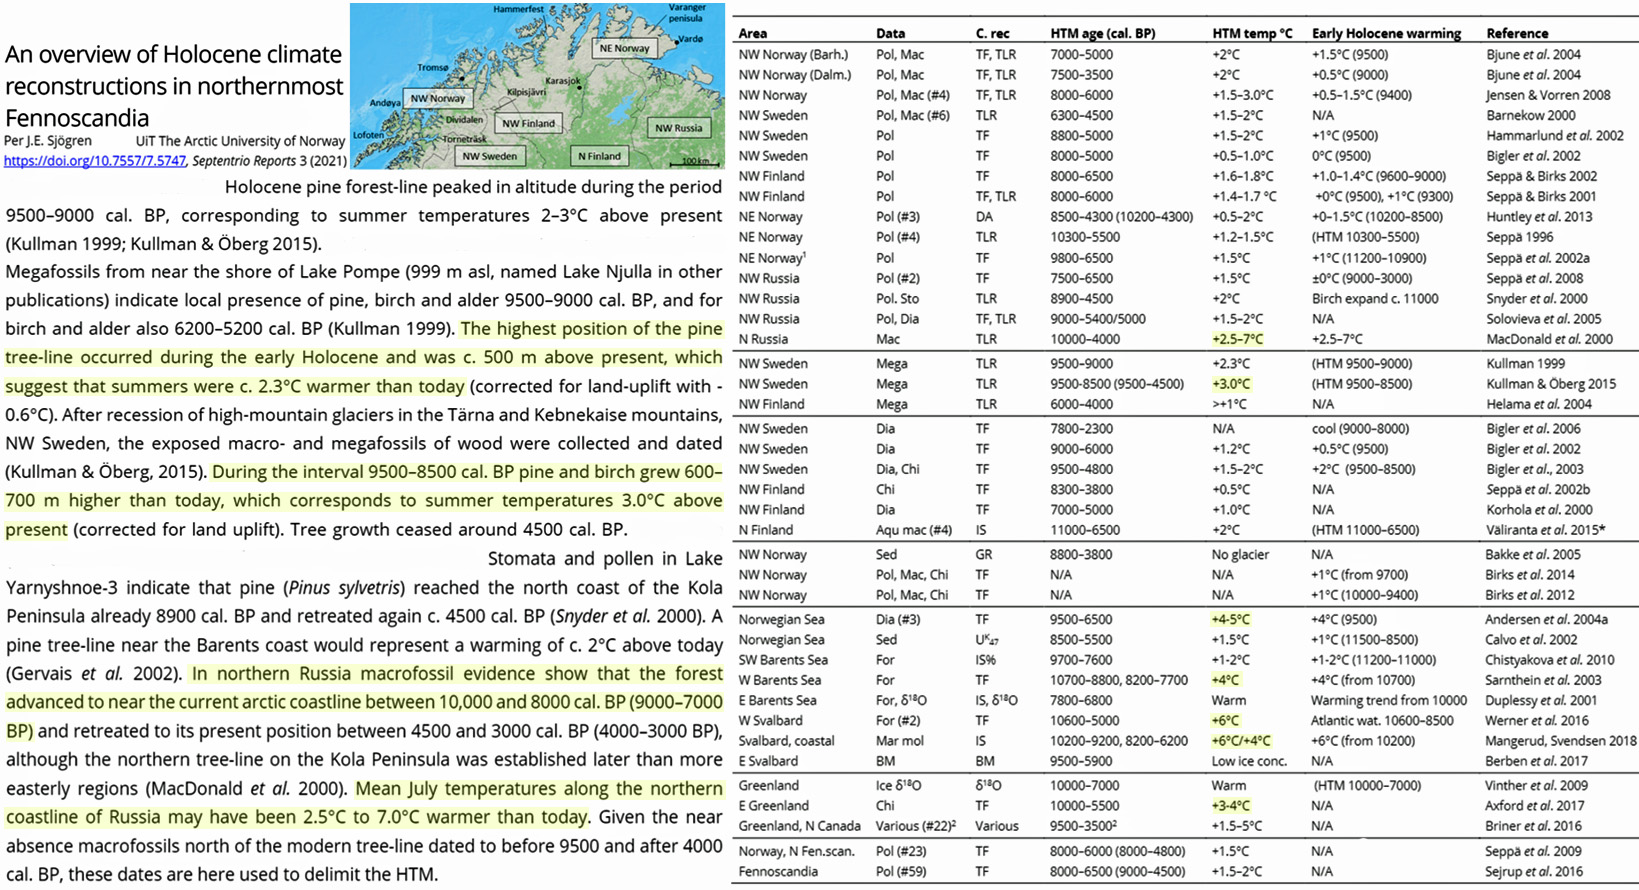
Sjögren, 2021 Sub-Arctic Norway, Sweden, Finland, Russia 2.5°C to 7.0°C warmer than today during Early Holocene
The highest position of the pine tree-line occurred during the early Holocene and was c. 500 m above present, which suggest summers were c. 2.3°C warmer than today … During the interval 9500-8500 cal. BP pine and birch grew 600-700 m higher than today, which corresponds to summer temperatures 3.0°C above present … In northern Russia macrofossil evidence show that the forest advanced to near the current arctic coastline between 10,000 and 8000 cal. BP (9000-7000 BP) … Mean July temperatures along the northern coastline of Russia may have been 2.5°C to 7.0°C warmer than today.
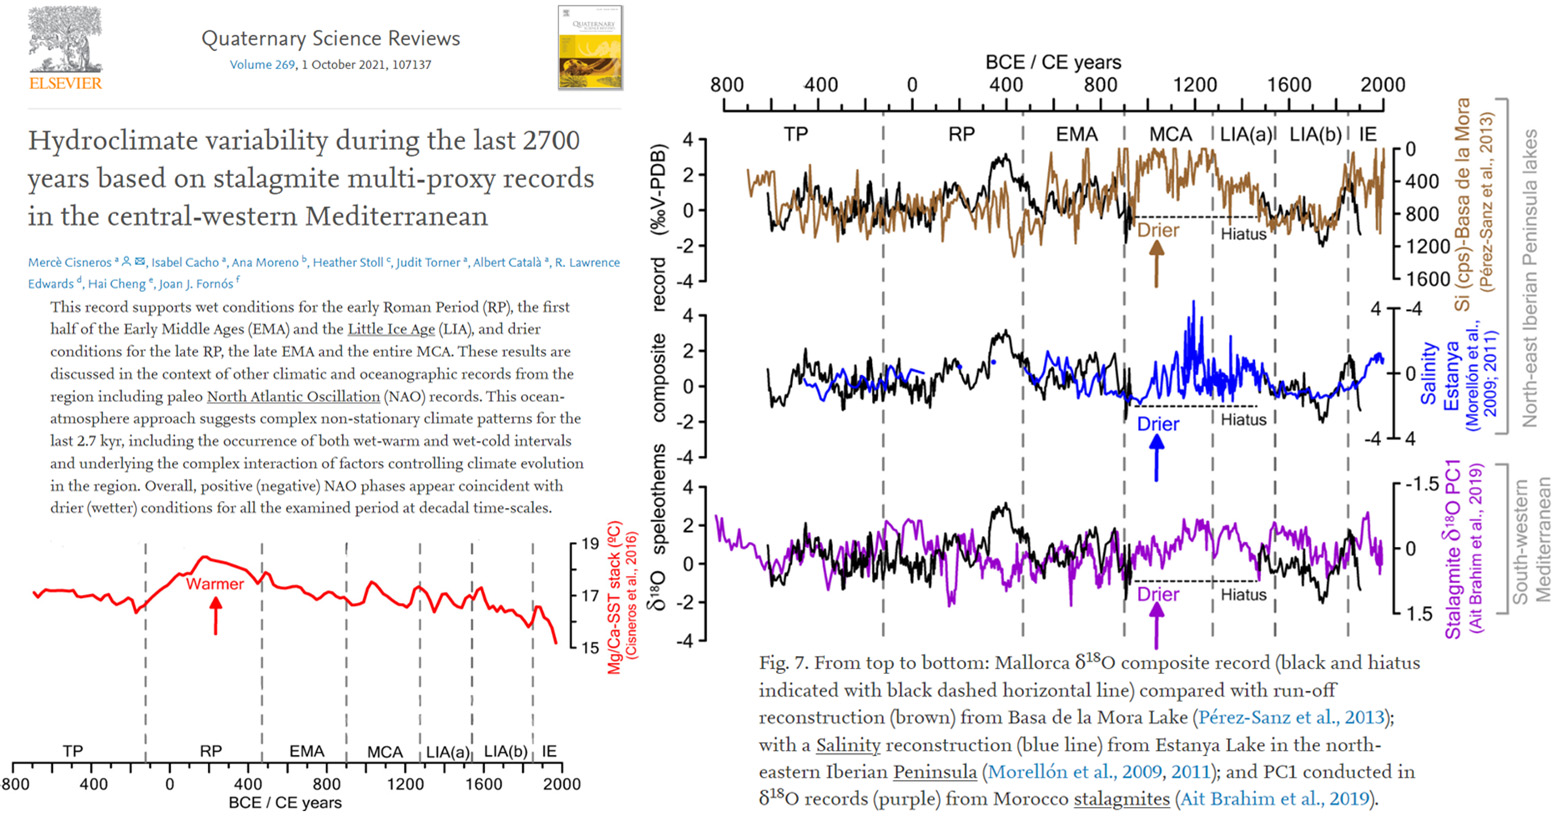
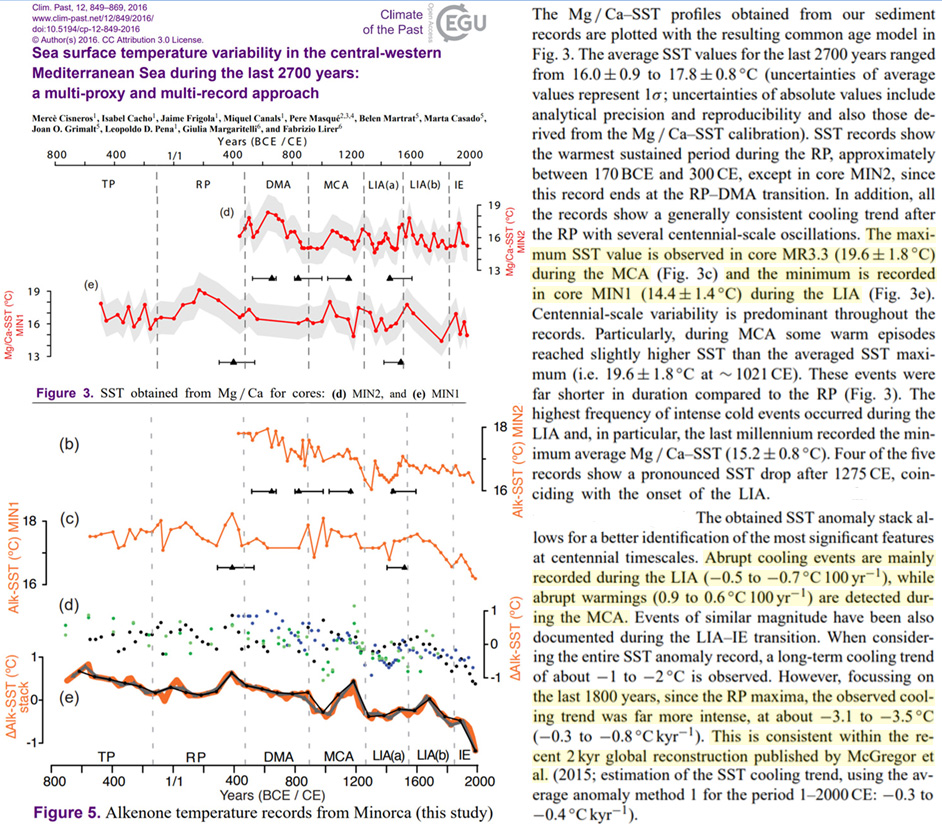
Cisneros et al., 2021 (referencing Cisneros et al., 2016) Mediterranean 2-3°C warmer ~1,500 years ago
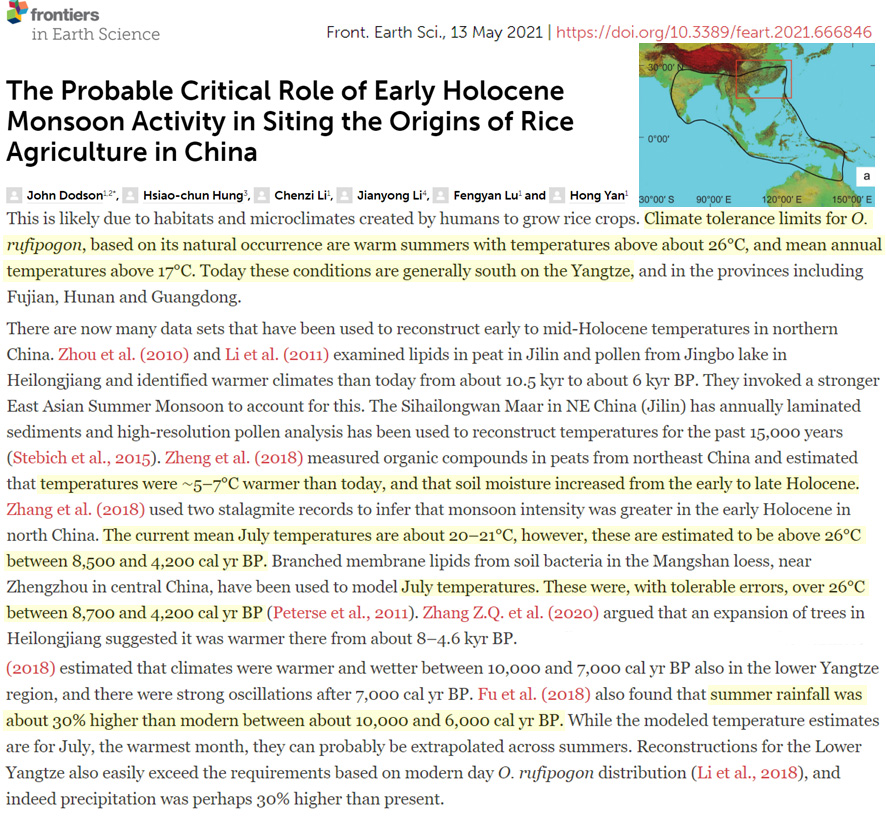
Dodson et al., 2021 Northeast China “5-7°C warmer than today” between 8,700 and 4,200 years ago
Zheng et al. (2018) measured organic compounds in peats from northeast China and estimated that temperatures were ∼5–7°C warmer than today, and that soil moisture increased from the early to late Holocene. Zhang et al. (2018) used two stalagmite records to infer that monsoon intensity was greater in the early Holocene in north China. The current mean July temperatures are about 20–21°C, however, these are estimated to be above 26°C between 8,500 and 4,200 cal yr BP. Branched membrane lipids from soil bacteria in the Mangshan loess, near Zhengzhou in central China, have been used to model July temperatures. These were, with tolerable errors, over 26°C between 8,700 and 4,200 cal yr BP (Peterse et al., 2011). Zhang Z.Q. et al. (2020) argued that an expansion of trees in Heilongjiang suggested it was warmer there from about 8–4.6 kyr BP.
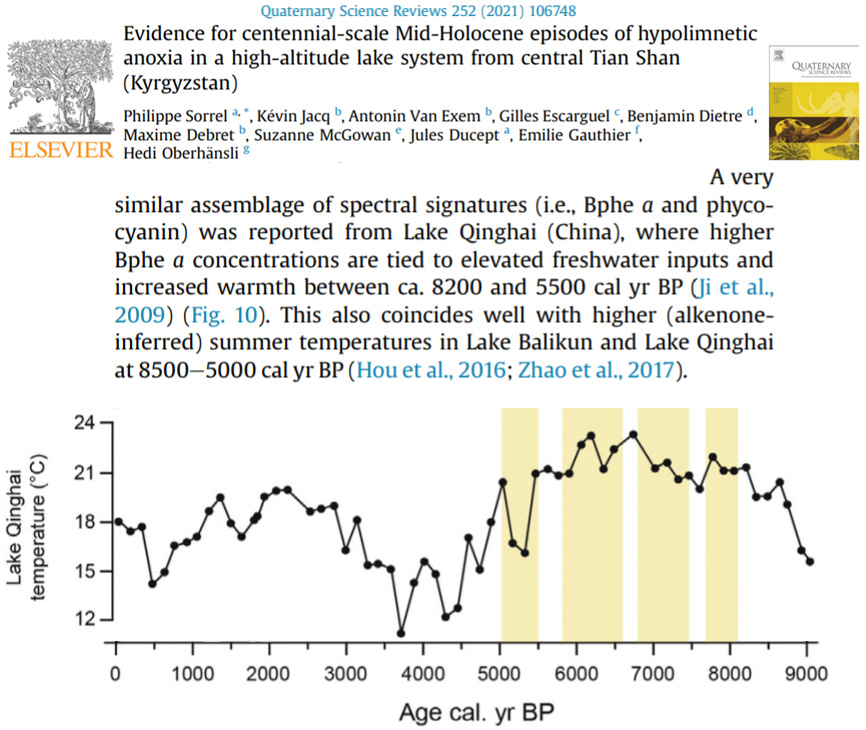
Sorrell et al., 2021 Lake Qinghai 2-4°C warmer 6000-8000 years ago
Helmans et al., 2021 Northern Europe July temps “several degrees warmer” when CO2 220-260 ppm
Few fossil-based environmental and climate records in northern Europe are dated to Marine Isotope Stage (MIS) 5a around 80 kaBP … [T]he climate optima of the predominant intermediate- to warm-water chironomid taxa suggest July temperatures exceeding present-day values by up to several degrees, in line with climate inferences from a variety of aquatic and wetland plant indicator species. … Summer temperatures exceeding present day values are inferred for the Early and Middle Holocene (Shala et al. 2017) and all three warm MIS 5 substages (Valiranta et al. 2009; Engels et al. 2010; Plikk et al. 2018; Salonen et al. 2018; this study), whereas warmer-than-today winters are additionally reconstructed for MIS 5e (Salonen et al. 2018).
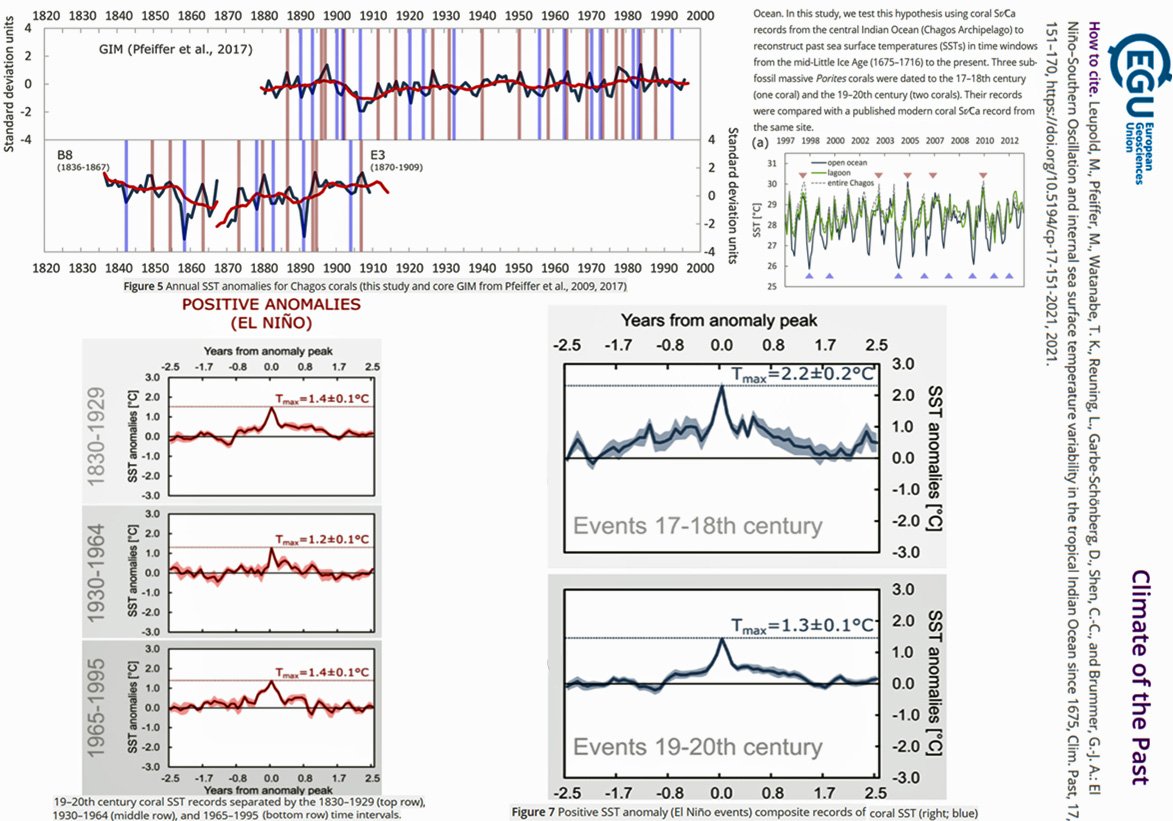
Leupold et al., 2021 Central Indian Ocean Tmax same (1.4°C) in 1830-1929 as from 1965-1995. Peak anomalies in the 1600s and 1700s ~0.9°C warmer (2.2°C) than peaks in 1800s, 1900s (1.3°C)
Sicre et al., 2021 Early Holocene N. Iceland SSTs 3°C warmer than today
Two sediment cores retrieved off North Iceland (western Nordic Seas) and on the eastern flank of Reykjanes Ridge (Iceland Basin) were analyzed to generate high-resolution alkenone-derived sea surface temperature (SST) records to investigate North Atlantic Ocean circulation changes during the Holocene. Early Holocene SSTs off North Iceland were unstable (10 ± 1 °C) and 3 °C warmer than today reflecting active northward heat transport of the Atlantic Meridional Overturning Circulation (AMOC) interrupted by intermittent Polar Waters incursions onto the North Icelandic shelf. The Holocene thermal optimum occurred synchronously east of Reykjanes Ridge, with a mean value of 11.5 °C (±0.5 °C) similar to today, consistent with a sustained influence of AMOC. Both records indicate that the circulation across the North Atlantic intensified between 8000 and 7000 yr BP.
Yudawati-Cahyarini et al., 2021 Indian Ocean “warmer than today” during Medieval Warm Period
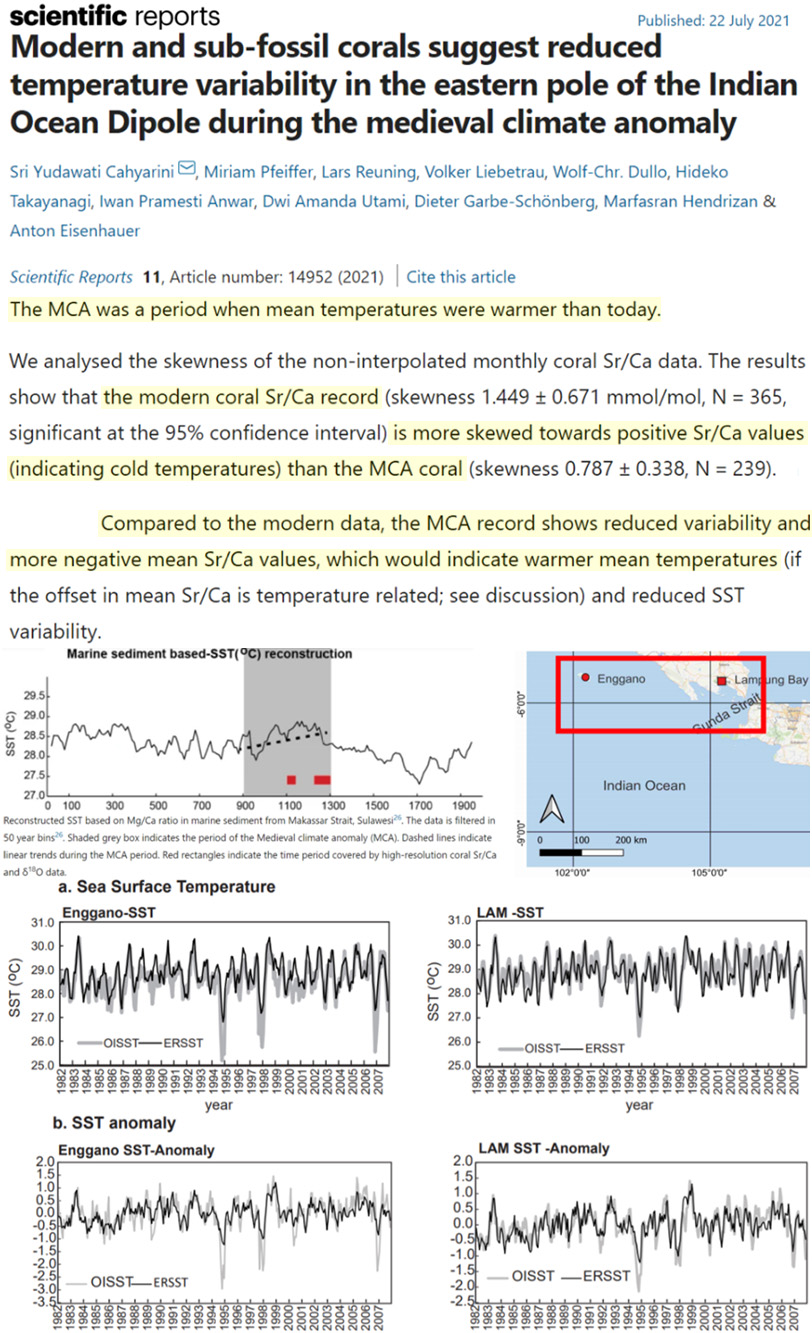
The MCA [Medieval Climate Anomaly] was a period when mean temperatures were warmer than today. … Compared to the modern data, the MCA record shows reduced variability an more negative mean Sr/Ca values, which would indicate warmer mean temperatures
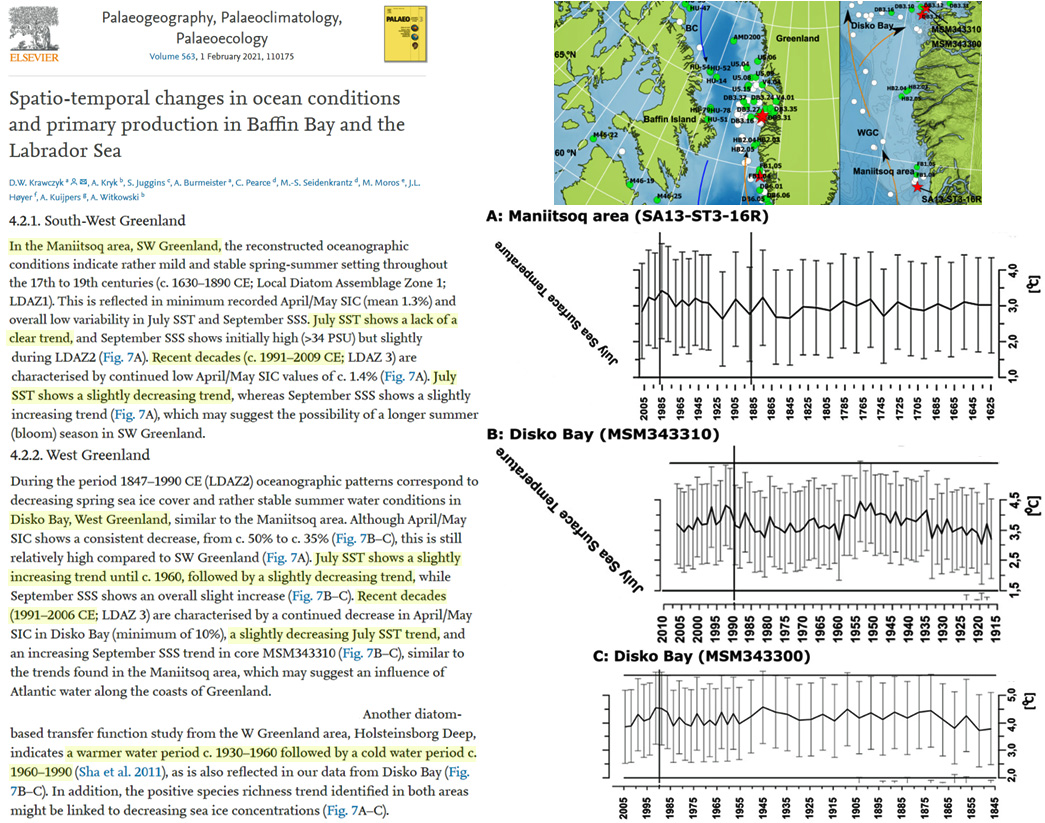
Krawczyk et al., 2021 SW Greenland “slightly decreasing temperatures 1991-2006…no net warming since 1625, 1915, 1845 (Maniitsoq, Disko Bay)
In the Maniitsoq area, SW Greenland…July SST shows lack of a clear trend … Recent decades (c. 1991–2009 CE; LDAZ 3) are characterised by continued low April/May SIC values of c. 1.4% (Fig. 7A). July SST shows a slightly decreasing trend … Disko Bay, West Greenland…Recent decades (c. 1991-2006; LDAZ 3)…a slightly decreasing July SST trend
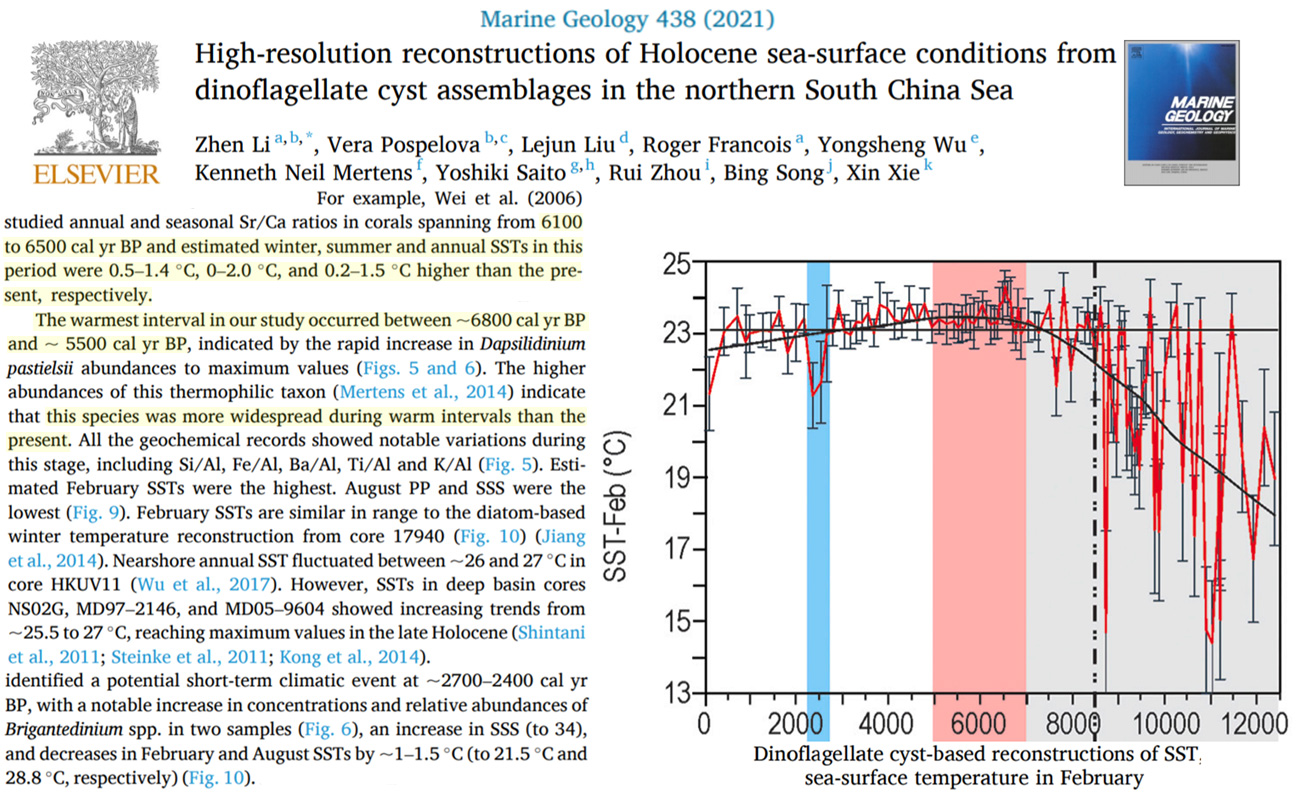
Li et al., 2021 South China Sea SSTs 0.5 to 2.0°C “higher than the present” 6100 to 6500 years ago
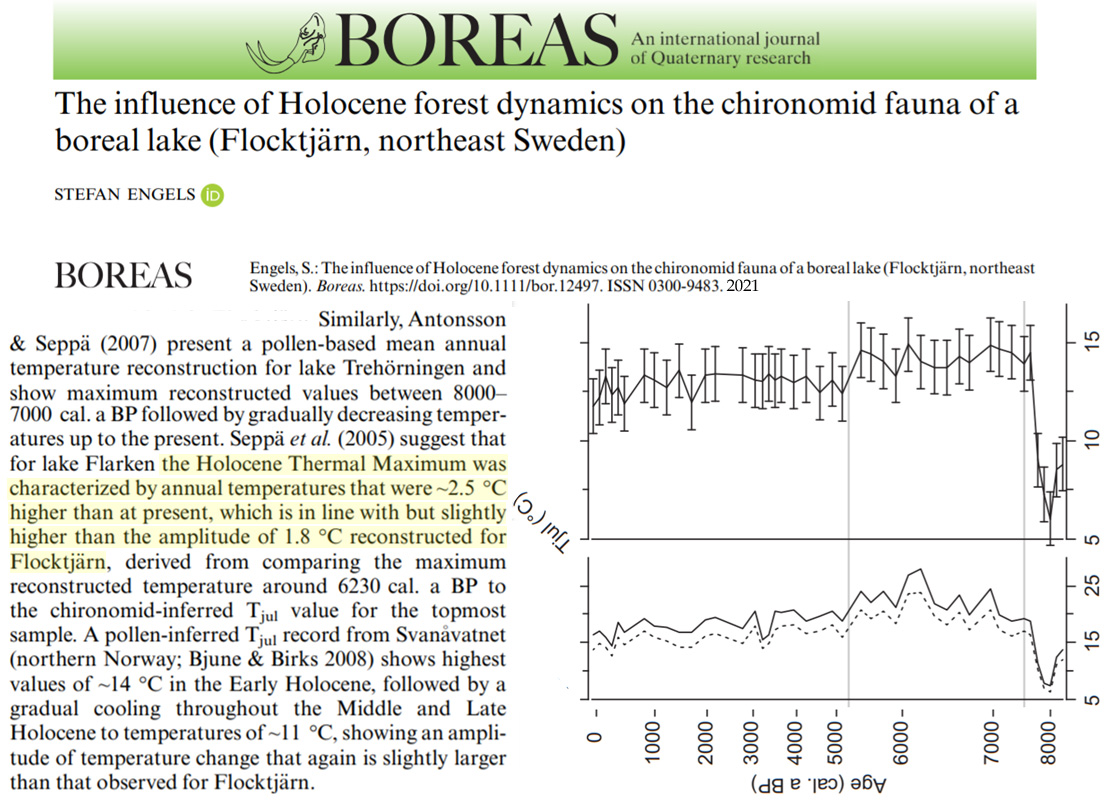
Engels, 2021 NE Sweden 2.5°C warmer than at present during Holocene Thermal Maximum
Kullman, 2021 N. Sweden early Holocene summer temperature “at least 3 °C warmer than the early 21st century”
[C]urrent sites of glaciers and ice patches, 400-700 elevational meters atop of current treelines, harboured early Holocene stands of many of today´s boreal tree- and ground-cover species prevailing in northern Scandinvia. … Altogether three megafossil tree remains (Pinus sylvestris L.) with characteristic signs of being gnawed by beaver, Castor fiber L. (general appearance and teeth furrows), have been recovered on the forefields of receding glaciers/ice patches in Swedish Lapland (Table 1, Fig. 3). They all date to the early Holocene, 9530-9190 cal yr BP, at sites 380-520 m higher than the present-day treelines of the respective species, and in near association with meltwater ponds in the lower forefields. … The concerned megafossil pine remains comply with a general view of early Holocene tree growth of different tree species at much higher elevations than today and consequently in a substantially warmer climate. … At all the investigated sites, megafossils of different tree species have been recovered at higher positions and earlier than displayed by the beaver-gnawed stems presented in this study. This implies that early Holocene summer temperature may have been at least 3 °C warmer than the early 21st century (Kullman & Öberg 2013). Megafossils of different tree species are exposed at the forefields of of receding glaciers and snow patches. • They range in age between c. 11 700 and 4000 cal, yr BP, when temperatures were as most 3 °C higher than present and treelines 500-700 m above current levels.
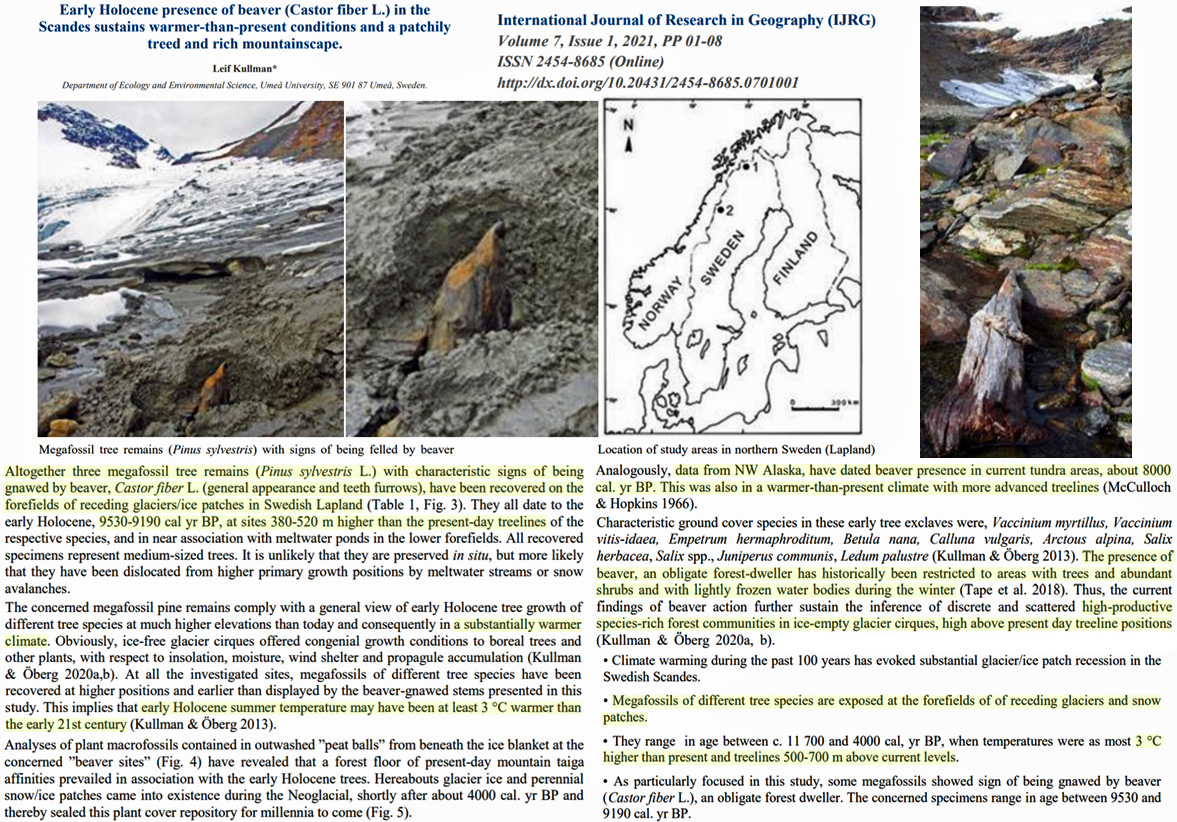
Kullman, 2021 Swedish Lapland 3.6°C warmer than present 9500-8500 years ago
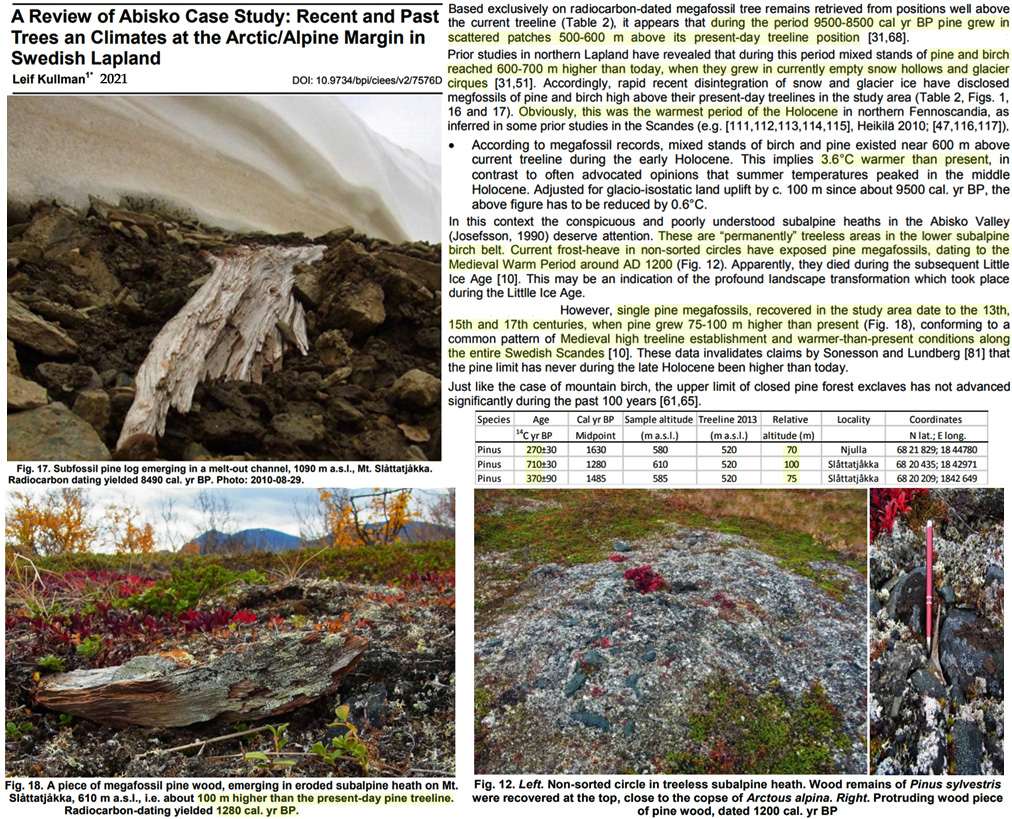
In this context the conspicuous and poorly understood subalpine heaths in the Abisko Valley (Josefsson, 1990) deserve attention. These are “permanently” treeless areas in the lower subalpine birch belt. Current frost-heave in non-sorted circles have exposed pine megafossils, dating to the Medieval Warm Period around AD 1200 (Fig. 12). Apparently, they died during the subsequent Little Ice Age [10]. This may be an indication of the profound landscape transformation which took place during the Little Ice Age. … Based exclusively on radiocarbon-dated megafossil tree remains retrieved from positions well above the current treeline (Table 2), it appears that during the period 9500-8500 cal yr BP pine grew in scattered patches 500-600 m above its present-day treeline position [31,68]. … Prior studies in northern Lapland have revealed that during this period mixed stands of pine and birch reached 600-700 m higher than today, when they grew in currently empty snow hollows and glacier cirques [31,51]. … According to megafossil records, mixed stands of birch and pine existed near 600 m above current treeline during the early Holocene. This implies 3.6°C warmer than present, in contrast to often advocated opinions that summer temperatures peaked in the middle Holocene.
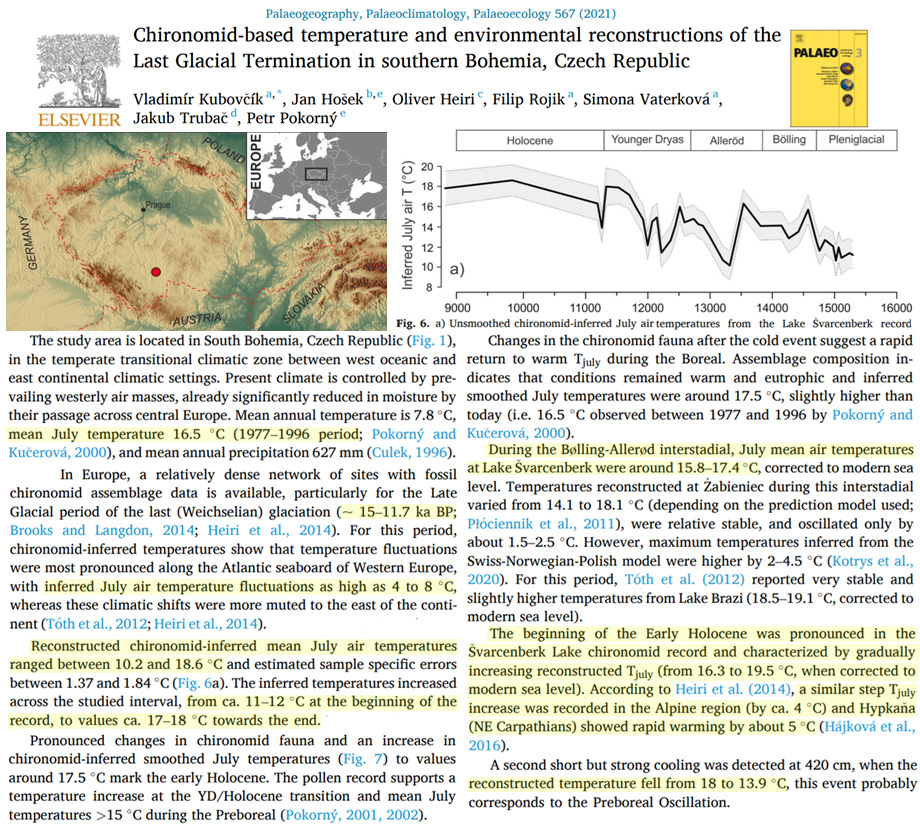
Kubovcik et al., 2021 Czech Republic July temps 16.5°C today, up to 19.5°C (3°C warmer) during Early Holocene
[Modern] mean July temperature is 16.5°C (1977-1996 period) … During the Bolling-Allerod interstadial [15.7 to 12.7 ka], July mean air temperatures at Lak Svarcenberk were around 15.8 – 17.4°C … The beginning of the Early Holocene was pronounced in the Svarcenberk Lake chironomid record and characterized by a gradually increasing reconstructed July temperature (from 16.3 to 19.5°C)
Axford et al., 2021 Greenland 3-5°C warmer than 1950 during Early Holocene
Highlighting and accounting for some key issues with proxy interpretation, we find that much of Greenland experienced summers 3 to 5°C warmer than the mid-twentieth century in the early Holocene—earlier and stronger warming than often presumed. Warmth had dramatic consequences: Many glaciers disappeared, perennial sea ice retreated, plants and animals migrated northward, the Greenland Ice Sheet shrank rapidly, and increased meltwater discharge led to strong marine water stratification and enhanced winter sea ice in some areas.
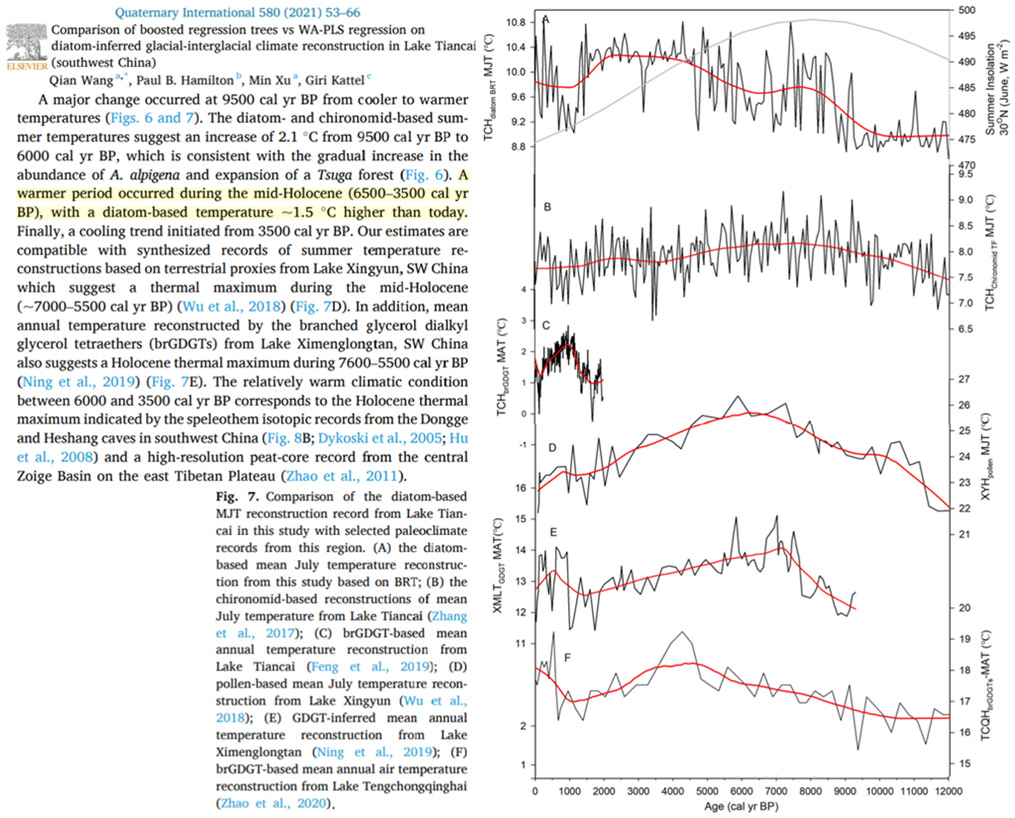
Wang et al., 2021 Southwest China temperatures warmer than today during the middle Holocene
Chen et al., 2021 Global mean temperatures “1–2 °C higher than the present” when CO2 was ~260 ppm
The global mean temperature in the Holocene climate optimum was 1–2 °C higher than the present
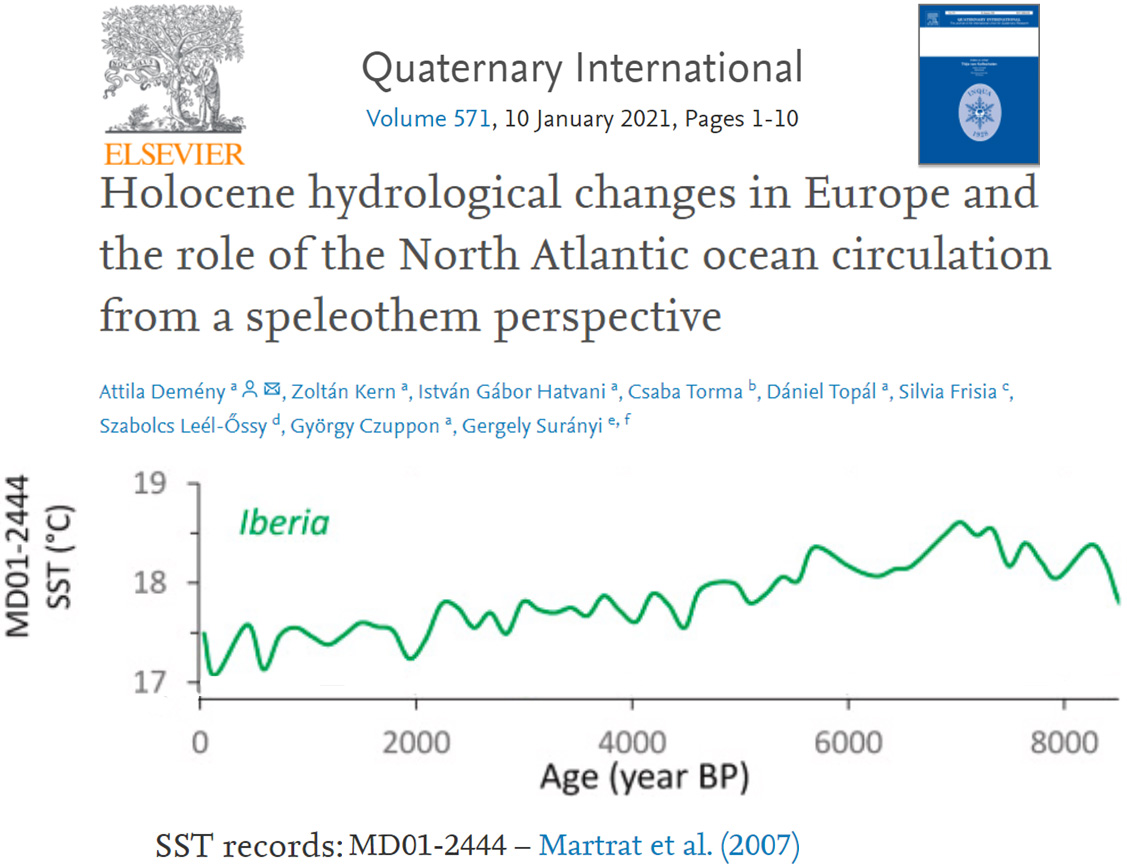
Demeny et al., 2021 Iberia ~1°C warmer than today 8,000 to 6,000 years ago
Fletcher et al., 2021 Arctic temperatures 13°C to 18°C warmer than present during the Pliocene (~350 ppm CO2)
Extreme rarity of conifer fossils or of any insects associated with forests also shows that the Fosheim Dome sites may not be as old as Remus Creek (24) and South Bay (25) or the Beaufort Formation. However, one of the mosses in the Fosheim Dome assemblage (Pleurozium schreberi (Willd. ex Brid.) Mitt.) is a Subarctic to boreal species. So, although trees were rare or did not grow near this site, they may have in more southerly locations on Ellesmere Island, indicating a climate warmer than today. The temperature estimate from mutual climate range of beetles is Tmax-mean of 10.7ºC, 8.3ºC warmer than present, and Tmin-mean -28.4ºC, 13ºC warmer than present (Elias and Matthews, 2002). Whether this was in latest Pliocene time or during an early Quaternary interglaciation is not presently known. … The remains of trees in the Arctic have also allowed for analysis of palaeoclimate using qualitative assessments based on ring widths and geochemical methods. For example, Csank et al. (2011a) conducted a detailed analysis of Larix wood from the Beaver Pond locality. They studied both ring widths and stable isotopes in the wood and conclude that during the 250-year life of one tree, the June-July growing season temperatures were 15.8±5.0°C or 11.8±5.1°C warmer than at present and mean annual temperatures (‒1.4±4.0°C) were 18.3±4.1°C warmer than present.
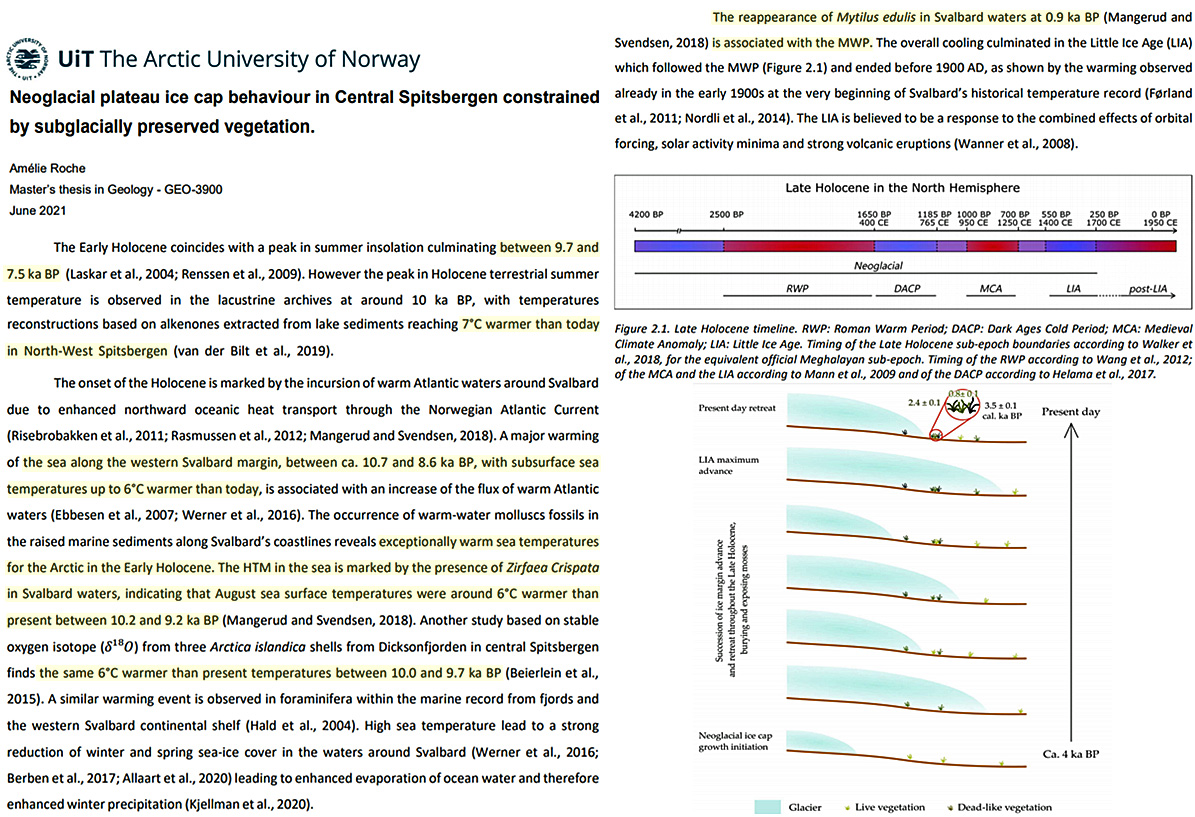
Roche, 2021 Northwest Spitsbergen “7°C warmer than today” during the Early Holocene
Jin et al., 2021 Ross Sea region warmer than today during the Medieval Warm Period
Our results indicate a relatively warm period occurred in the study area [~1400-800 yr BP], in accordance with an ‘optimum’ warming in the Ross Sea region. From a regional view, this warm period was also consolidated with climatic records from the western Ross Sea, most likely corresponding to a well-recognized climate perturbation known as the Medieval Climate Anomaly (MCA) in many parts of the world.
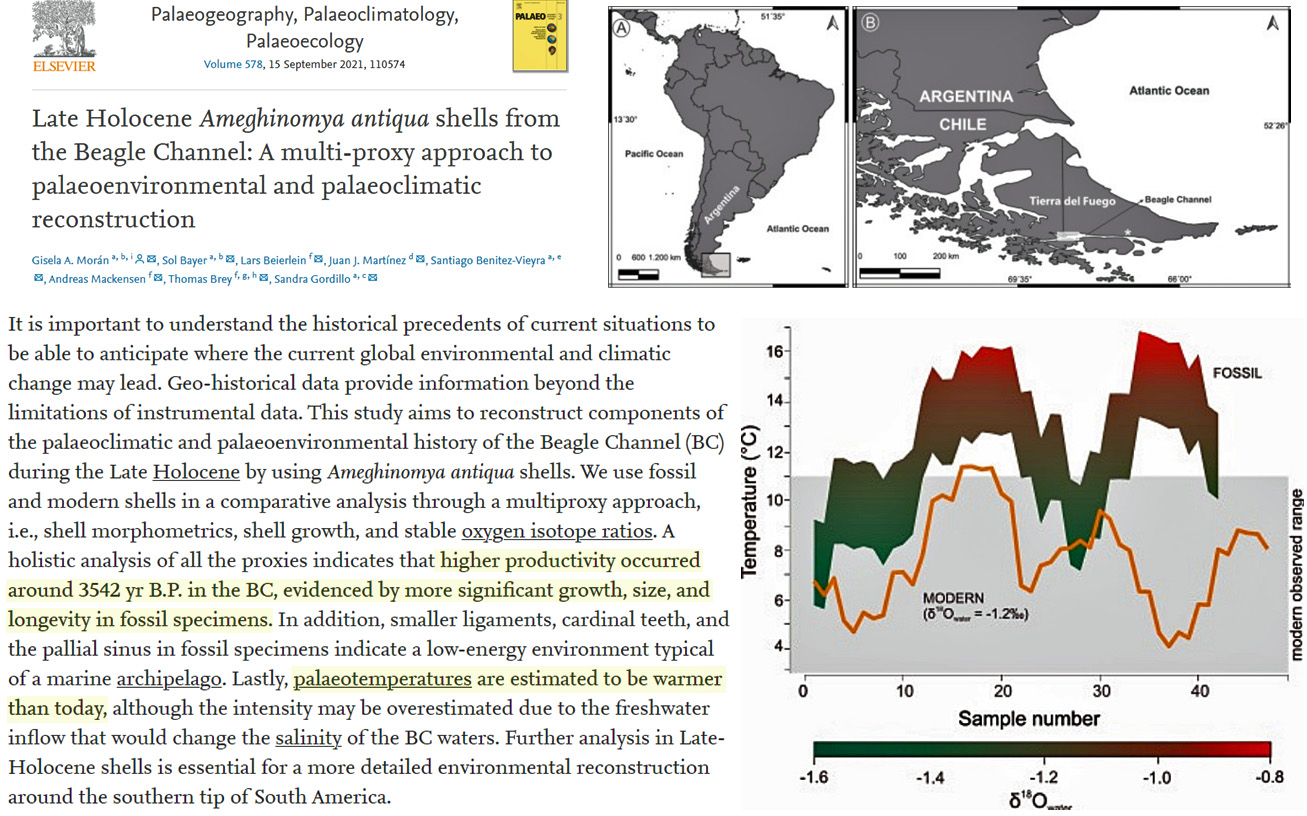
Morán et al., 2021 Southernmost South America “warmer than today” (2-3°C?) during the Late Holocene
This study aims to reconstruct components of the palaeoclimatic and palaeoenvironmental history of the Beagle Channel (BC) during the Late Holocene by using Ameghinomya antiqua shells. We use fossil and modern shells in a comparative analysis through a multiproxy approach, i.e., shell morphometrics, shell growth, and stable oxygen isotope ratios. A holistic analysis of all the proxies indicates that higher productivity occurred around 3542 yr B.P. in the BC, evidenced by more significant growth, size, and longevity in fossil specimens. In addition, smaller ligaments, cardinal teeth, and the pallial sinus in fossil specimens indicate a low-energy environment typical of a marine archipelago. Lastly, palaeotemperatures are estimated to be warmer than today, although the intensity may be overestimated due to the freshwater inflow that would change the salinity of the BC waters.
Larocca and Axford, 2021 Early Holocene Arctic-wide summer temperatures “at least ~2°C above present”
Finally, our early Holocene estimate of Arctic–wide summer warming of at least ~2°C above present is consistent with previous syntheses of paleotemperature evidence from the Arctic.
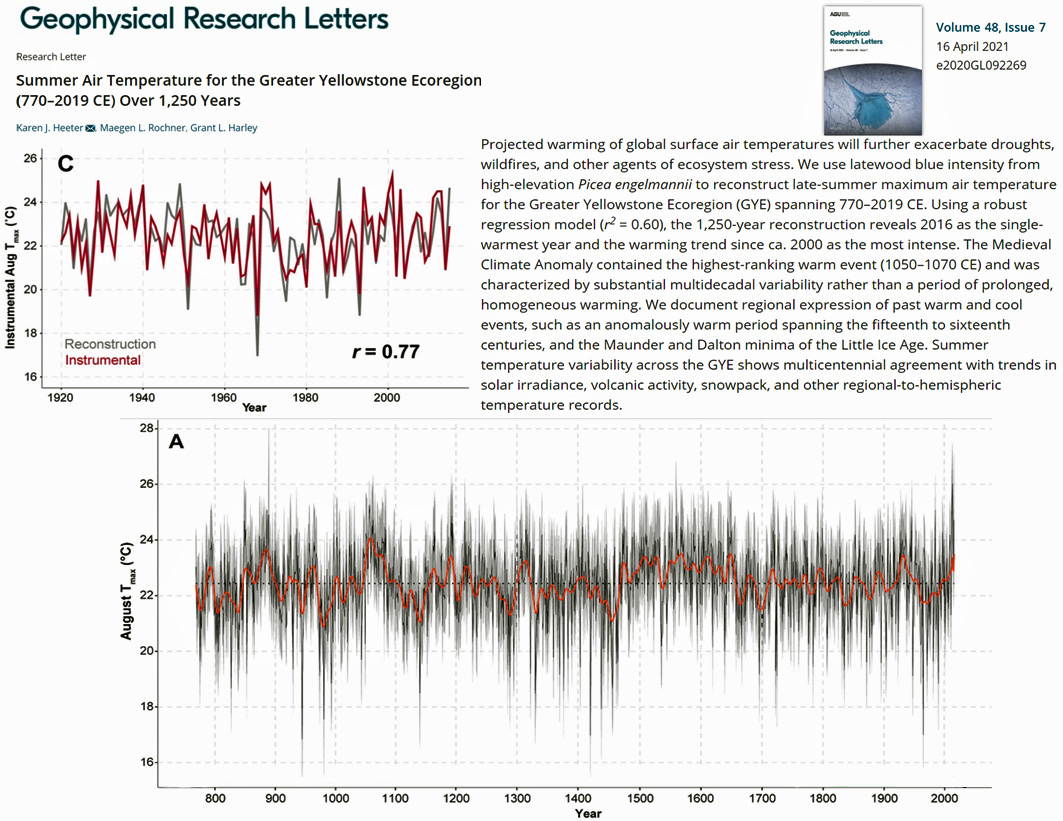
Heeter et al., 2021 Yellowstone region has no obvious net warming from 770 to 2019
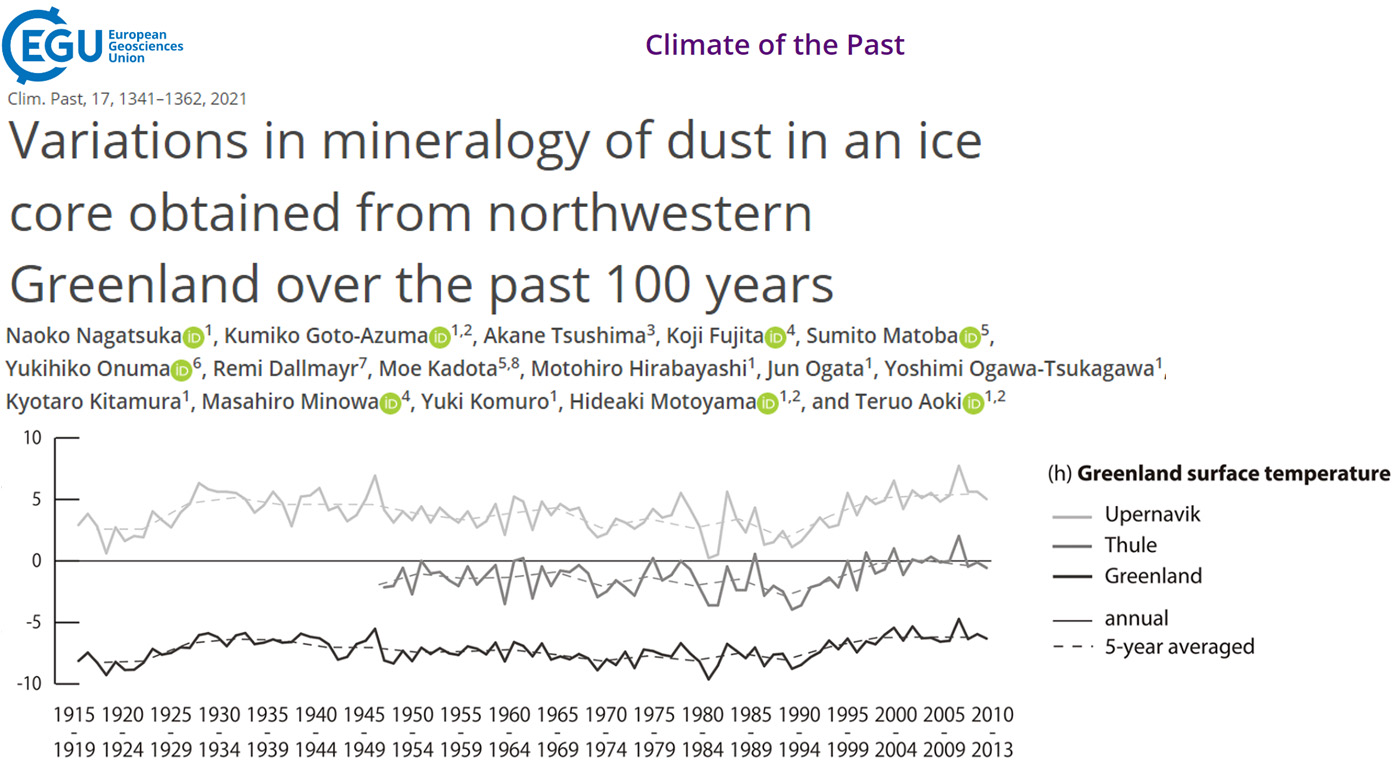
Nagatsuka et al., 2021 Greenland has had no obvious net warming since 1930s
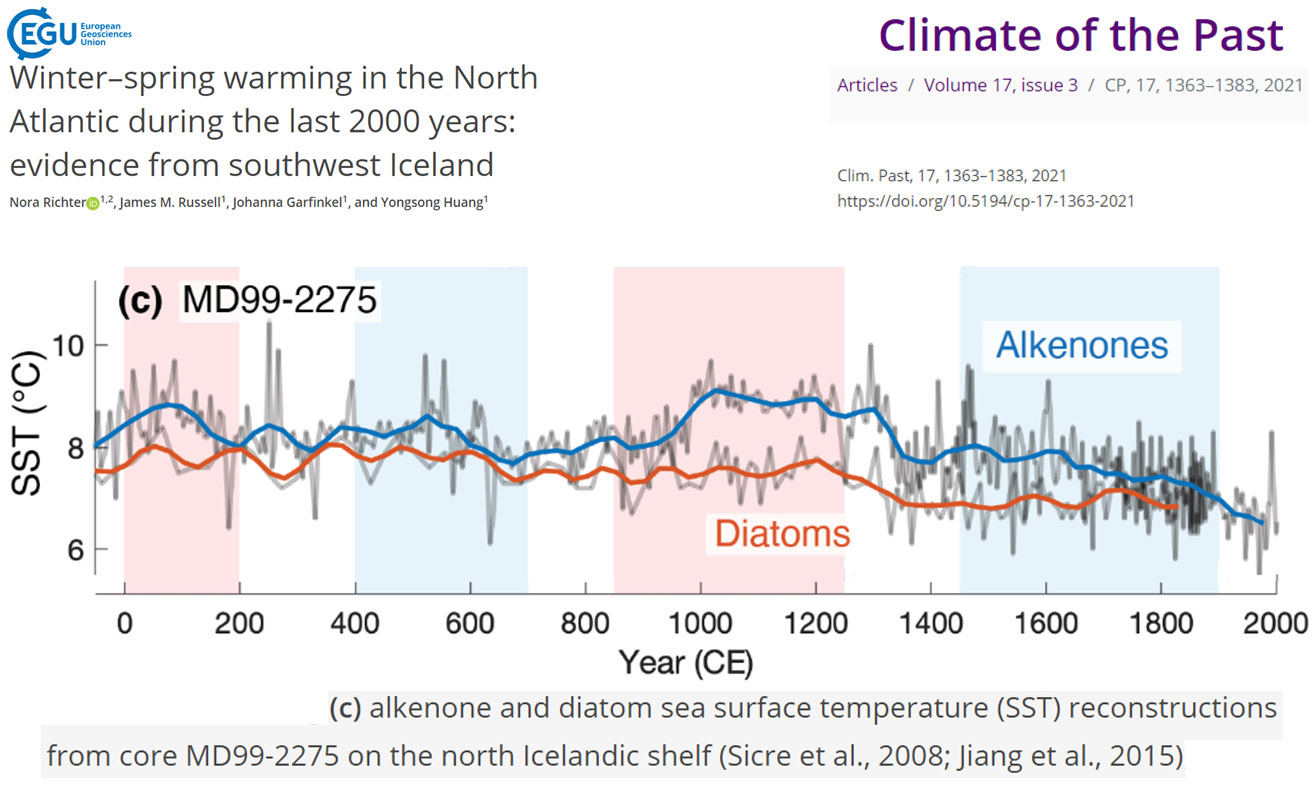
Richter et al., 2021 North Iceland 2-3°C warmer during Medieval Warm Period (1000s to 1200s AD)
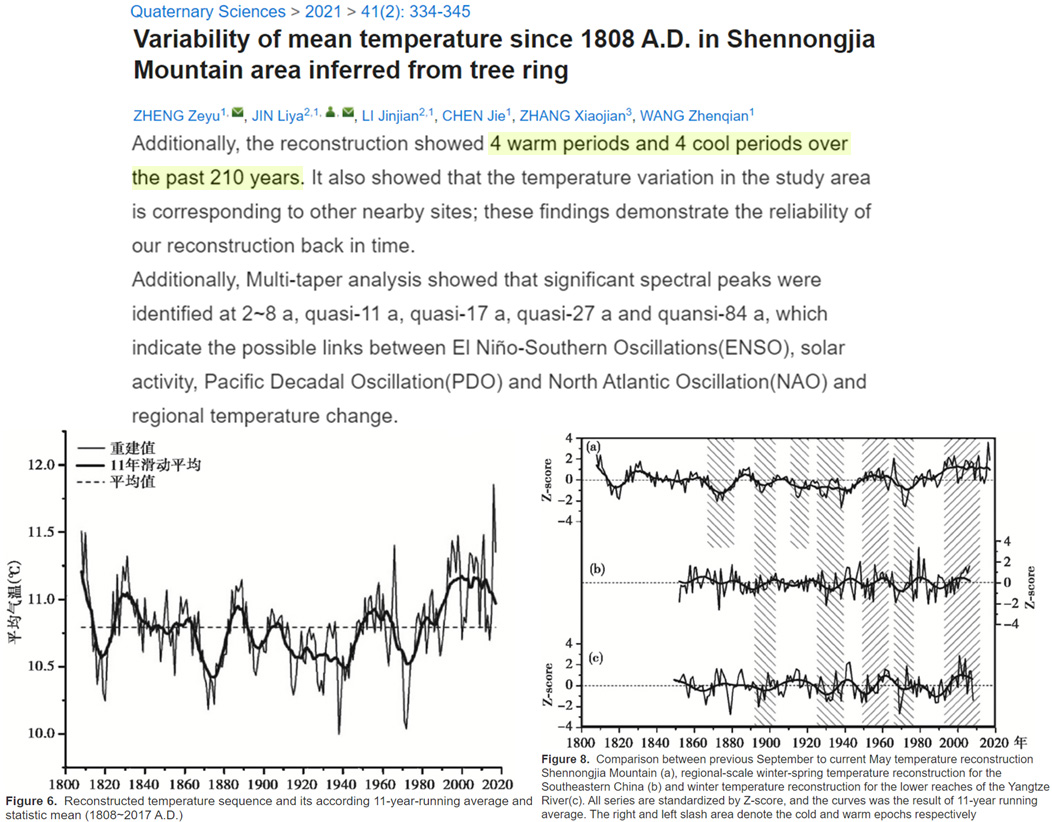
Zheng et al., 2021 Central China as warm as 2000s during early 1800s
Hannold et al., 2021 North America’s temperatures 3-5°C higher during Pliocene despite lower CO2
The MAT estimated by averaging all the calculated temperatures is 22 ± 3 ◦C (±1σ), which is significantly warmer than modern MAT in Chihuahua (18.1 ± 1.2 ◦C; ±1σ). The reconstructed temperatures at the study site ~5 Ma were consistent with the results of model simulations suggesting a 3–5 ◦C higher temperature in the Pliocene than modern along the North American Cordillera (Haywood et al., 2000; Haywood and Valdes, 2004).
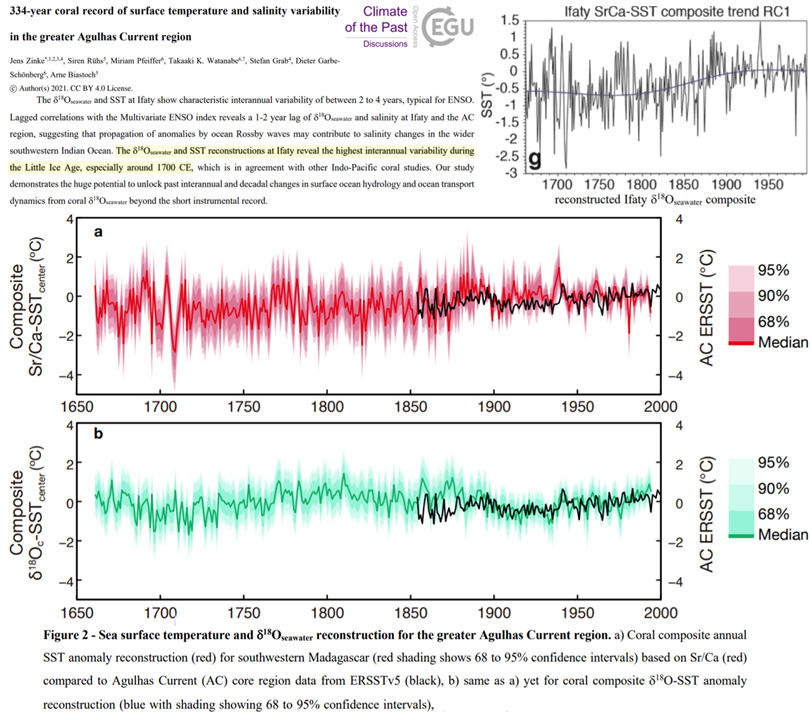
Zinke et al., 2021 Madagascar region has had no obvious net warming since 1700s
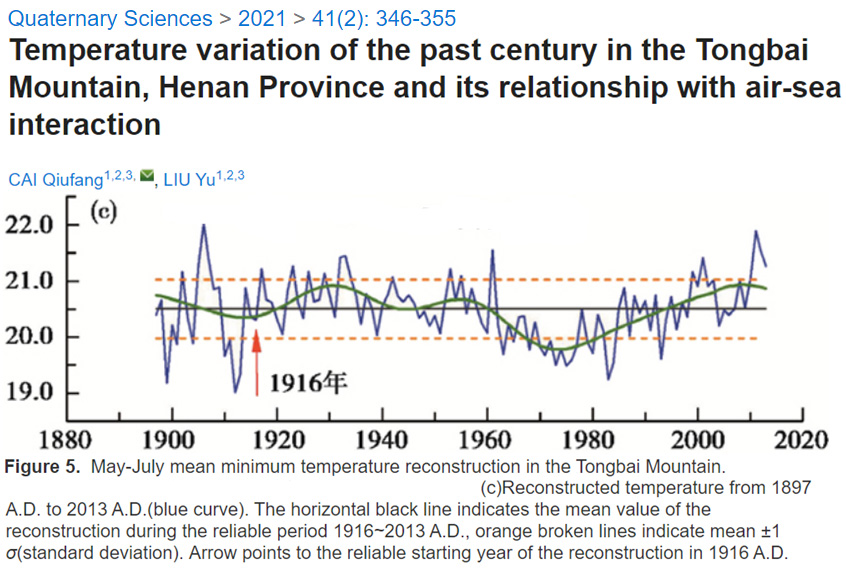
Cai and Liu, 2021 Tongbai Mountain (China) has had no obvious net warming since early 1900s
Liu et al., 2021 Northern Asia “~2–3°C warmer than today” from~8,000 to 3,000 years ago
During the Holocene Megathermal (8,000 ~ 3,000 cal yr BP), the climate of northern Asia was a Holocene thermal and humidity maximum by other proxy data (Stebich et al., 2015), with summer temperatures ~2–3°C warmer than today (Blinnikov et al., 2002; Valiranta, Kultti, & Seppa, 2006).
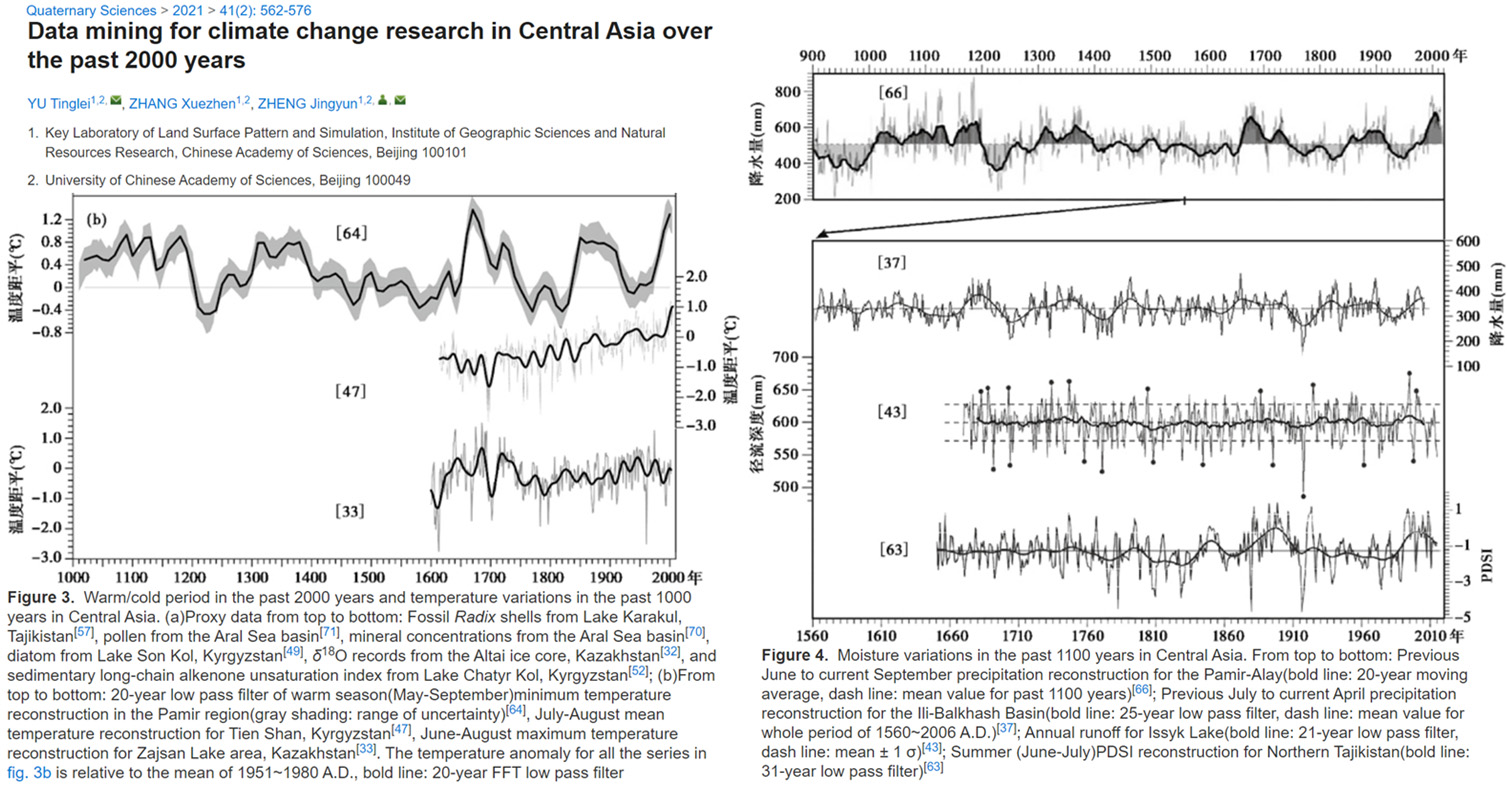
Yu et al., 2021 No net warming in Central Asia during the last 400 to 1,000 years
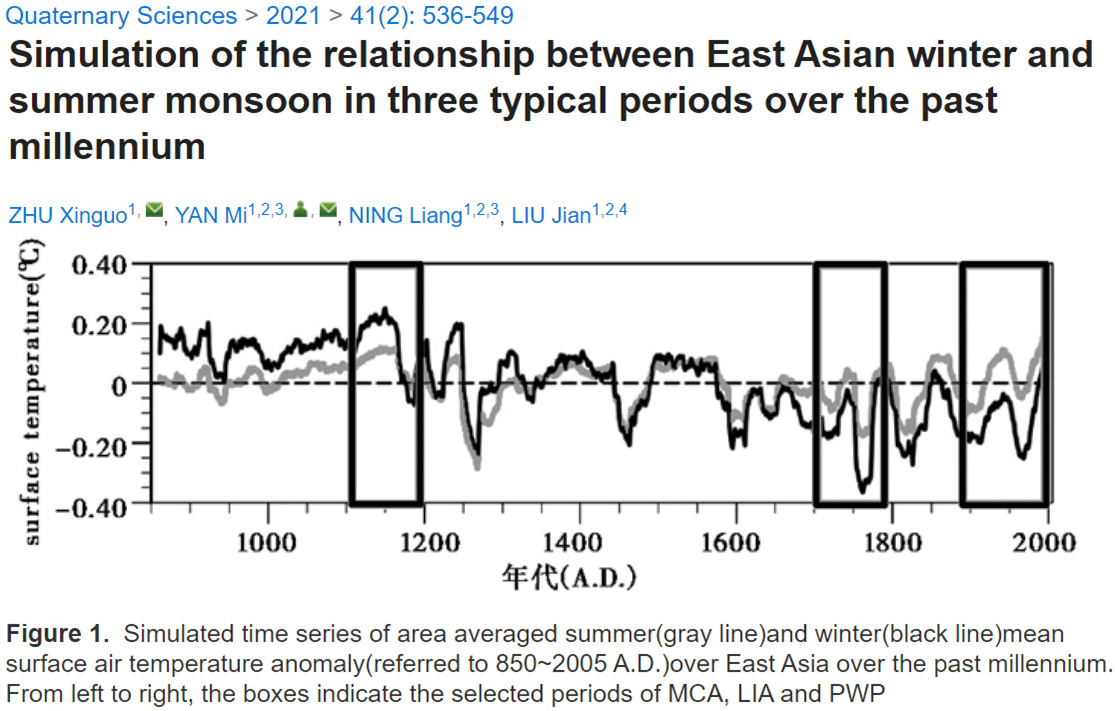
Zhu et al., 2021 Medieval Warm Period warmer than modern in East Asia
Baumer et al., 2021 Laptev Sea “4 °C warmer than today” from 11,500 to 8,400 years ago
The beginning of the Early Holocene warming at 11.6 cal. ka BP at Lake Emanda coincides with the maximum in local insolation (Berger & Loutre 1991; Fig. 4) and is consistent with warming around Lake Billyakh at 11.3 cal. ka BP (Muller € et al. 2009), in the Laptev Sea region at 11.5 cal. ka BP (Andreev et al. 2011) and at Lake El’gygytgyn at 12 cal. ka BP (Swann et al. 2010). Pollen-based climate reconstructions from the Laptev Sea region inferred temperatures 4 °C warmer than today for the interval 11.5–8.4 cal. ka BP (Andreev et al. 2011), corresponding to the Holocene Thermal Maximum (HTM) at Lake Emanda at 11.5–9.0 cal. ka BP and at Lake El’gygytgyn at 11.4– 7.6 cal. ka BP (Swann et al. 2010).
Crump et al., 2021 Eastern Canadian Arctic 3-4°C warmer during the last interglacial, when CO2 peaked at 280 ppm
The DNA metabarcoding results provide compelling evidence that dwarf birch, a relatively cold-intolerant woody shrub that typifies the Low Arctic tundra and whose northern limit is currently ∼400 km south in the Eastern Canadian Arctic … The interval with these three taxa defines the peak vegetation community at CF8 and is characteristic of Bioclimate Subzone D, which has a mean July temperature range of 7 to 9 °C (2 to 4 °C warmer than present). This shift is consistent with peak LIG warmth of ∼3 °C above the late 20th century inferred from pollen (Fig. 3) and 4 to 5 °C above the late 20th century inferred from chironomid assemblages July air temperatures inferred from pollen assemblages … are highest in the LIG and ranged from ∼4 to 8 °C
Andreev et al., 2021 Arctic Siberia “warmer-than-present” during Early Holocene, when coastline was 200-500 km farther north
Zhang et al., 2021 Northern China temperature peaked 3°C higher than today in the last 5,000 years
Before reconstructing temperature over the past 5000 yr, we first compared the brGDGT-inferred core-top temperature (average of 9 surface sediments) with local instrumental data. The reconstructed core-top temperature of ~6.5 °C is higher than the instrumental mean air temperature of ~3 °C which is calculated using the nearby Liupan Mountain Meteorological Station data (2009-2018) with the consideration of elevational differences between the lake and the station.
Goto-Azuma e tal., 2021 Greenland Holocene temperatures 2–3 °C higher than today, and 8 °C higher during the last interglacial period
Variations in terrestrial environments over the past 130,000 years were reconstructed using ion data from the NEEM ice core (Schüpbach et al., 2018). Compared with the present day, temperature during the early Holocene was 2–3 °C higher and temperature during the last interglacial period was 8 °C higher.
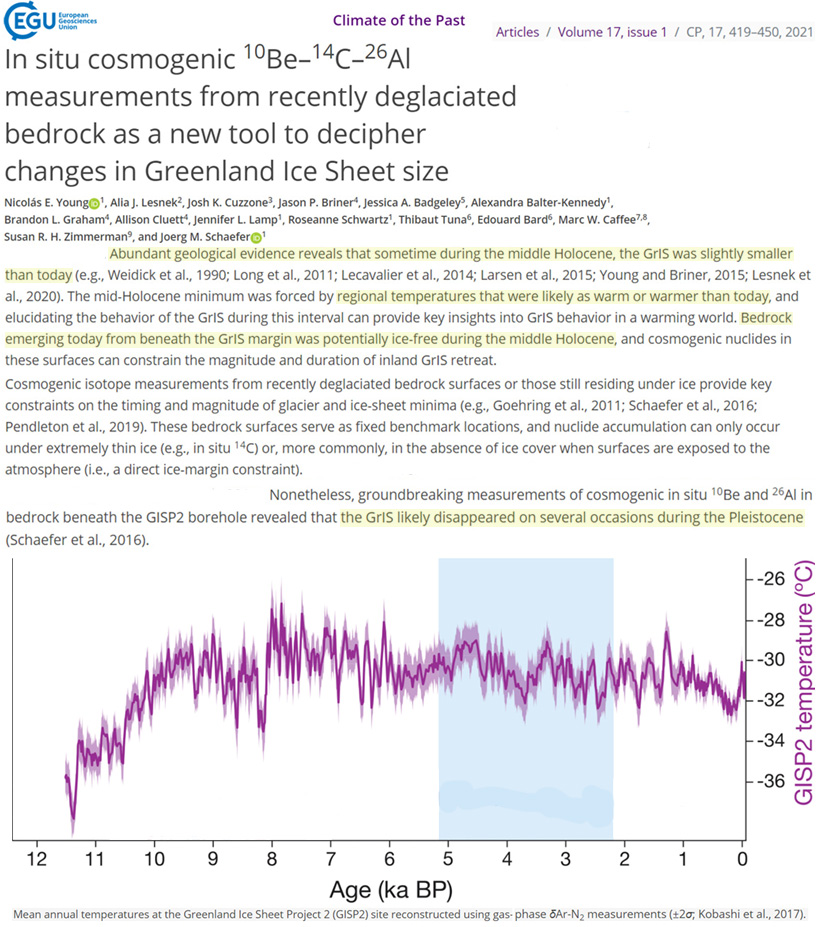
Young et al., 2021 Greenland had less ice during the middle Holocene (260 ppm CO2) and the ice sheet “likely disappeared” when CO2 peaked at only 280 ppm (Pleistocene interglacials)
Abundant geological evidence reveals that sometime during the middle Holocene, the GrIS was slightly smaller than today (e.g., Weidick et al., 1990; Long et al., 2011; Lecavalier et al., 2014; Larsen et al., 2015; Young and Briner, 2015; Lesnek et al., 2020). The mid-Holocene minimum was forced by regional temperatures that were likely as warm or warmer than today … These bedrock surfaces serve as fixed benchmark locations, and nuclide accumulation can only occur under extremely thin ice (e.g., in situ 14C) or, more commonly, in the absence of ice cover when surfaces are exposed to the atmosphere (i.e., a direct ice-margin constraint). … groundbreaking measurements of cosmogenic in situ 10Be and 26Al in bedrock beneath the GISP2 borehole revealed that the GrIS likely disappeared on several occasions during the Pleistocene (Schaefer et al., 2016).
Astakhov and Semionova, 2021 Russian Arctic had dense forests (tundra today) and sea floor temperatures were “4–8°C higher” when CO2 was 280 ppm (last interglacial)
The boreal mollusc fauna in the western Russian Arctic indicates sea floor temperatures by 4–8◦C higher than those of the present Kara Sea which is consistent with the warmest Eemian interglaciation of Western Europe … The terrestrial evidence poses a major problem: forest pollen association within thick peat layers in the Pechora Basin indicates environments much warmer than the present ones. As an example, the peat bog reconstructed from the inter-till deposits at the Seyda site (Fig. 10) suggests dense forest environment which is in great contrast with the present-day tundra, thus indicating a large shift of the vegetation zones to the north.
Kim et al., 2021 (full paper) The Arctic region 2–3°C warmer than today during the Early Holocene
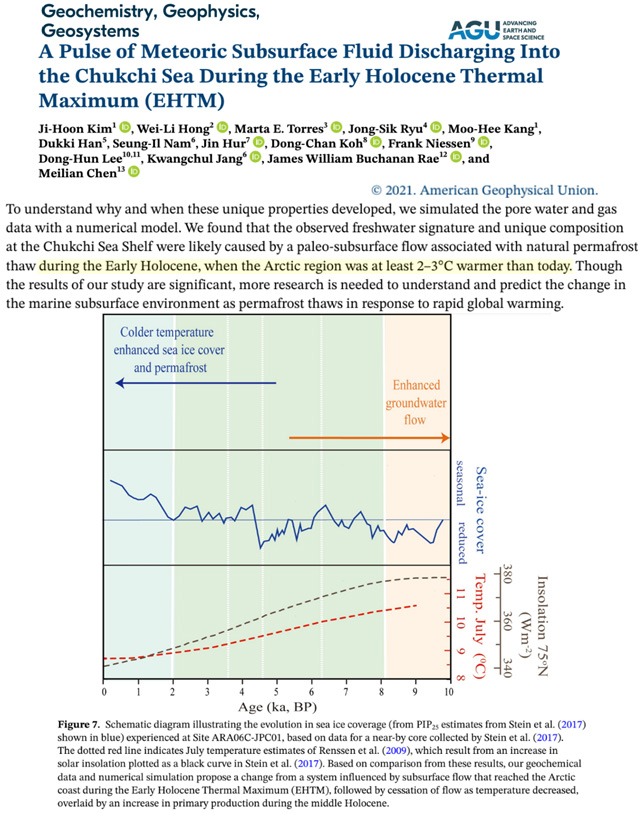
We found that the observed freshwater signature and unique composition at the Chukchi Sea Shelf were likely caused by a paleo-subsurface flow associated with natural permafrost thaw during the Early Holocene, when the Arctic region was at least 2–3°C warmer than today.
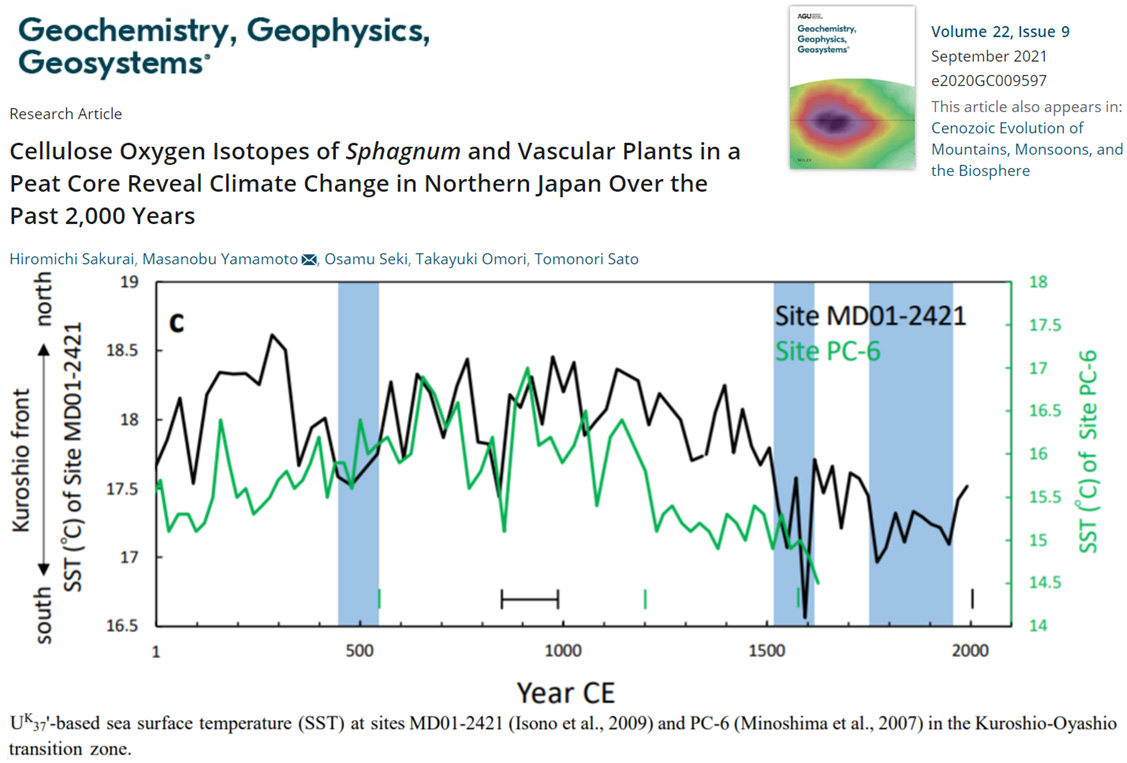
Sakurai et al., 2021 Northern Japan sea surface temperatures 1 – 1.5°C warmer than ~1990 during Medieval Warm Period
Sjögren, 2021 Northernmost Fennoscandia 1.5°C warmer than present 9,500 years ago
An overview of climate reconstructions considering summer air temperatures and effective precipitation is provided for northernmost Fennoscandia. During the earliest part of the Holocene (11,700–10,000 cal. BP), temperatures rose rapidly and were followed by mild, wet and variable conditions. An early major warming peaked around 9500 cal. BP, although many records indicate that the main Holocene warming first occurred about c. 8000 cal. BP. The sub-regional pattern of climate change suggests a defining influence of the westerlies and the North Cape Current. Non-analog climatic conditions and lags in vegetation responses to climate change may explain some of the discrepancies seen in the early Holocene between proxies. In contrast to the perceivable variable onset of the main Holocene warm period, maximum temperatures are relatively consistent between the records, indicating temperatures 1.5±0.5°C above present.
Andreev et al., 2021 Canadian Arctic temperatures “at least 15° higher than modern” with pine and spruce forests (treeless today) when CO2 was 350 ppm (Pliocene)
Early Pliocene pollen and macrofossil records from central and northern Yukon and Alaska exhibit that mixed boreal forests with pine, fir, larch, spruce, birch, alder, larch, and Douglas fir dominated the local vegetation there (e.g., Schweger et al., 2011 and references therein). In the Canadian Arctic (Ellesmere Island), an early Pliocene record from Strathcona Fjord shows that forest with larch, spruce, pine, birch and alder dominated nowadays treeless area (Fletcher et al., 2019). … Based on pollen and macrofossil records from several sites in Chukotka, Glushkova and Smirnov (2007) assumed that the Pliocene climate was much warmer than today, with mean January temperatures estimated to be −13 to −17°C (at least 15° higher than modern) and mean July temperatures 14–17°C (ca. 8–10° higher than modern). These estimates are similar to biomarker-based average mean summer temperature estimates of 15.4 ± 0.8°C in the Canadian Arctic around that time (Fletcher et al., 2019).
Walker and Meijer, 2021 Norway “1.5–2.0°C warmer than present” from 7,300 to 4,800 years ago
In terms of climatic change, Dollsteinhola is of great interest, representing a mid-Holocene (7.3–4.8 BP) assemblage, a period where higher summer temperatures were around 1.5–2.0°C warmer than present [33–37]. According to the temperature curve for the west coast of Norway [37] the post-glacial warm period lasted until 4000 years BP. The younger material from Dollsteinhola dates to the late-Holocene (4.8 BP–present), a period of decreasing summer temperatures [33–35] and higher levels of precipitation [38]. This indicates that some of the later specimens from this site would have been from a colder and wetter period.
Toth et al., 2021 Carpathians 0.5°C warmer during the last glacial (16,300 to 16,000 and 13,400 years ago) when CO2 was ~220 ppm
The maximum chironomid-inferred July mean temperatures of GI-1 at Lake Saint Anne exceed the modern value (15°C) by about 0.5°C, but only for a short period between 16.3–16 ka and at 13.4 ka … This result partially supports the model-simulation-based inference of Renssen et al. (2002) that continental Europe summer temperature was slightly warmer during the Bølling interstadial (∼(GI-1e) than modern July temperatures.
Dong et al., 2021 Chinese Loess Plateau “~2 °C higher than today” from 8,000 to 3,000 years ago
During the interval of ~17–8 ka, in response to climatic warming, we observed marked increases in shell dimensions … from ~5–6 °C lower than today during the glacial period in the CLP [Chinese Loess Plateau], to ~2 °C higher than today during the Holocene Climatic Optimum
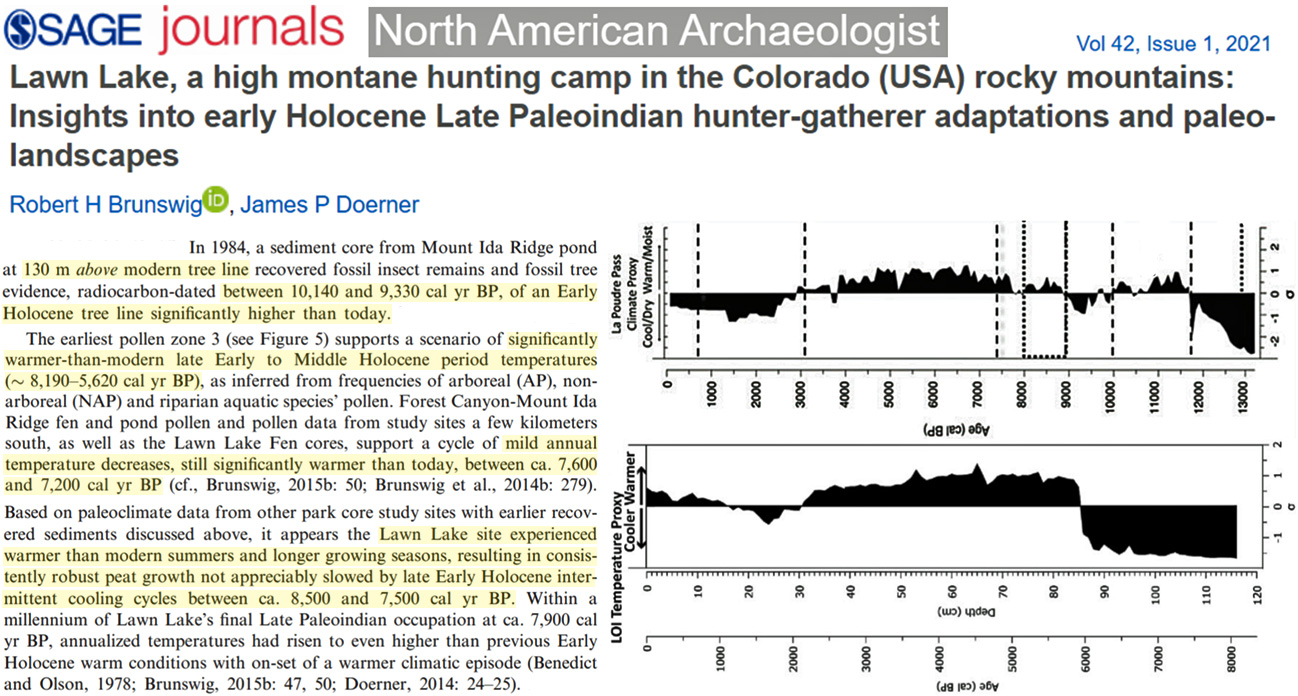
Brunswig and Doerner, 2021 Colorado (USA) “significantly warmer-than-modern late Early to Middle Holocene period temperatures (~ 8,190–5,620 cal yr BP)”
Mount Ida continental divide alpine ridgeline and mountain slope tree line reached ~130 m higher-than-modern levels between 10,140–9,330 cal yr BP, within a millennium of the end of Younger Dryas cold climate (Brunswig, 2014a: 103). Lawn Lake paleoclimate data (see below), correlated with La Poudre Pass, Sky Pond, and Loch Vail pollen and fossil insect studies and those applied to the Forest Canyon Pass-Mount Ida GIS paleoclimate model, support existence of an Early Holocene (post-Younger Dryas) climatic optimum and tree lines rising to or above modern-day levels between 10,300 and 9,700 cal BP (cf. Brunswig, 2014b: 103, 2015b: 50; Elias, 1985: 33, 35–36, 43–45). In 1984, a sediment core from Mount Ida Ridge pond at 130 m above modern tree line recovered fossil insect remains and fossil tree evidence, radiocarbon-dated between 10,140 and 9,330 cal yr BP, of an Early Holocene tree line significantly higher than today. … The earliest pollen zone 3 (see Figure 5) supports a scenario of significantly warmer-than-modern late Early to Middle Holocene period temperatures (~ 8,190–5,620 cal yr BP), as inferred from frequencies of arboreal (AP), nonarboreal (NAP) and riparian aquatic species’ pollen. Forest Canyon-Mount Ida Ridge fen and pond pollen and pollen data from study sites a few kilometers south, as well as the Lawn Lake Fen cores, support a cycle of mild annual temperature decreases, still significantly warmer than today, between ca. 7,600 and 7,200 cal yr BP (cf., Brunswig, 2015b: 50; Brunswig et al., 2014b: 279).
Zhang et al., 2021 Antarctica as-warm or warmer than today throughout the 1st millennium
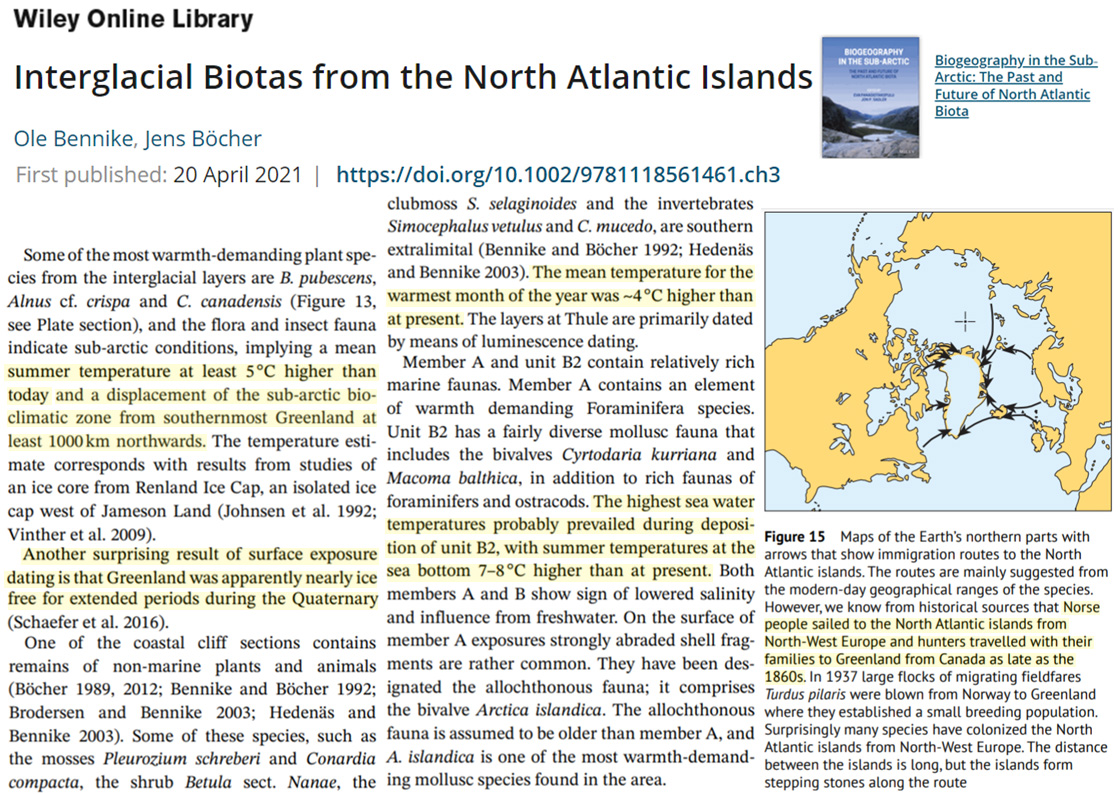
Bennike and Böcher, 2021 Greenland nearly ice-free, 5°C warmer (7–8 °C higher than at present bottom water temps) when CO2 was 280 ppm and lower (Quaternary interglacials)
Some of the most warmth-demanding plant species from the interglacial layers are B. pubescents, Alnus cf. crispa and C. canadensis, and the flora and insect fauna indicate sub-arctic conditions, implying a mean summer temperature at least 5°C higher than today and a displacement of the sub-arctic bioclimatic zone from southernmost Greenland [today] to at least 1000 km northwards. … Greenland was apparently nearly ice free for extended periods during the Quaternary [Pleistocene and Holocene, 2.6 million years ago to present]. … The highest sea water temperatures probably prevailed during deposition of unit B2, with summer temperatures at the sea bottom 7–8 °C higher than at present.
Babeshko et al., 2021 No changes in vegetation in the last 600 years in NE Fennoscandia (Russia)
Our data indicate that the peat deposits started accumulating before 9147 ± 182 cal. yr. BP. The vegetation cover in the area was mainly typical for the northern taiga zone, except for the period ~7800–5600 cal. yr. BP, when it generally resembled the middle taiga zone. The vegetation cover and peatland were greatly affected by reoccurring fires, which can be partly related to human activity. These events were associated with an increased proportion of birch in the vegetation cover (as a pioneer species) and/or water level decreases. By 600 cal. yr. BP, the peatland and the surrounding vegetation reached its current state and only minor changes had been recorded since that time. Overall, our results suggest a considerable and unexpected role of fires in the postglacial dynamics of subarctic peatlands.
Astakhov and Semionova, 2021 Northeast Europe climate “much warmer than today” when CO2 peaked at 280 ppm
Another line of evidence for this time span is inferred from inter-till terrestrial sequences in the European Northeast with forest pollen spectra suggesting a climate much warmer than today.
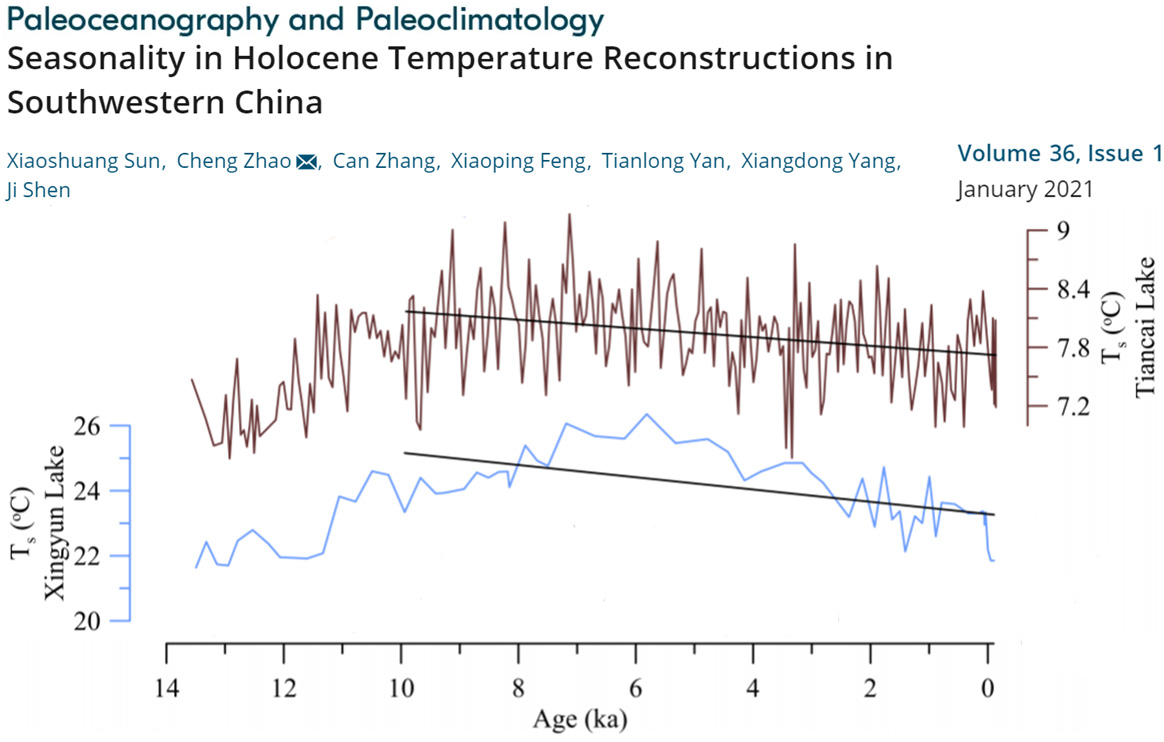
Sun et al., 2021 SW China lakes ~1-3°C warmer 5,000 to 8,000 years ago
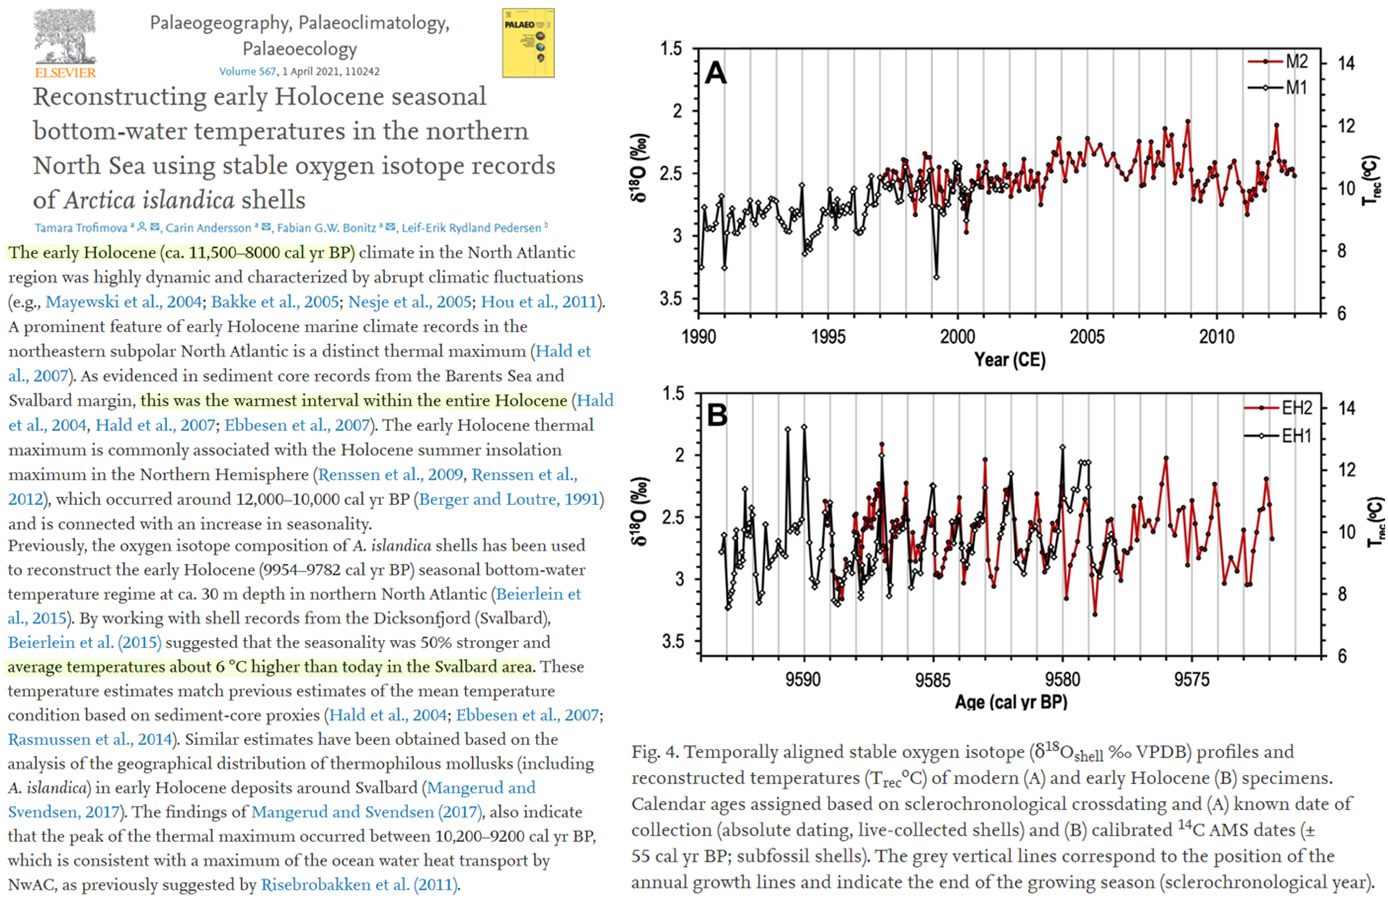
Trofimova et al., 2021 Svalbard region “average temperatures about 6 °C higher than today” during Early Holocene
The early Holocene (ca. 11,500–8000 cal yr BP) climate in the North Atlantic region was highly dynamic and characterized by abrupt climatic fluctuations (e.g., Mayewski et al., 2004; Bakke et al., 2005; Nesje et al., 2005; Hou et al., 2011). A prominent feature of early Holocene marine climate records in the northeastern subpolar North Atlantic is a distinct thermal maximum (Hald et al., 2007). As evidenced in sediment core records from the Barents Sea and Svalbard margin, this was the warmest interval within the entire Holocene (Hald et al., 2004, Hald et al., 2007; Ebbesen et al., 2007). … Previously, the oxygen isotope composition of A. islandica shells has been used to reconstruct the early Holocene (9954–9782 cal yr BP) seasonal bottom-water temperature regime at ca. 30 m depth in northern North Atlantic (Beierlein et al., 2015). By working with shell records from the Dicksonfjord (Svalbard), Beierlein et al. (2015) suggested that the seasonality was 50% stronger and average temperatures about 6 °C higher than today in the Svalbard area. These temperature estimates match previous estimates of the mean temperature condition based on sediment-core proxies (Hald et al., 2004; Ebbesen et al., 2007; Rasmussen et al., 2014). Similar estimates have been obtained based on the analysis of the geographical distribution of thermophilous mollusks (including A. islandica) in early Holocene deposits around Svalbard (Mangerud and Svendsen, 2017).
No Net Warming Since Mid/Late 20th Century
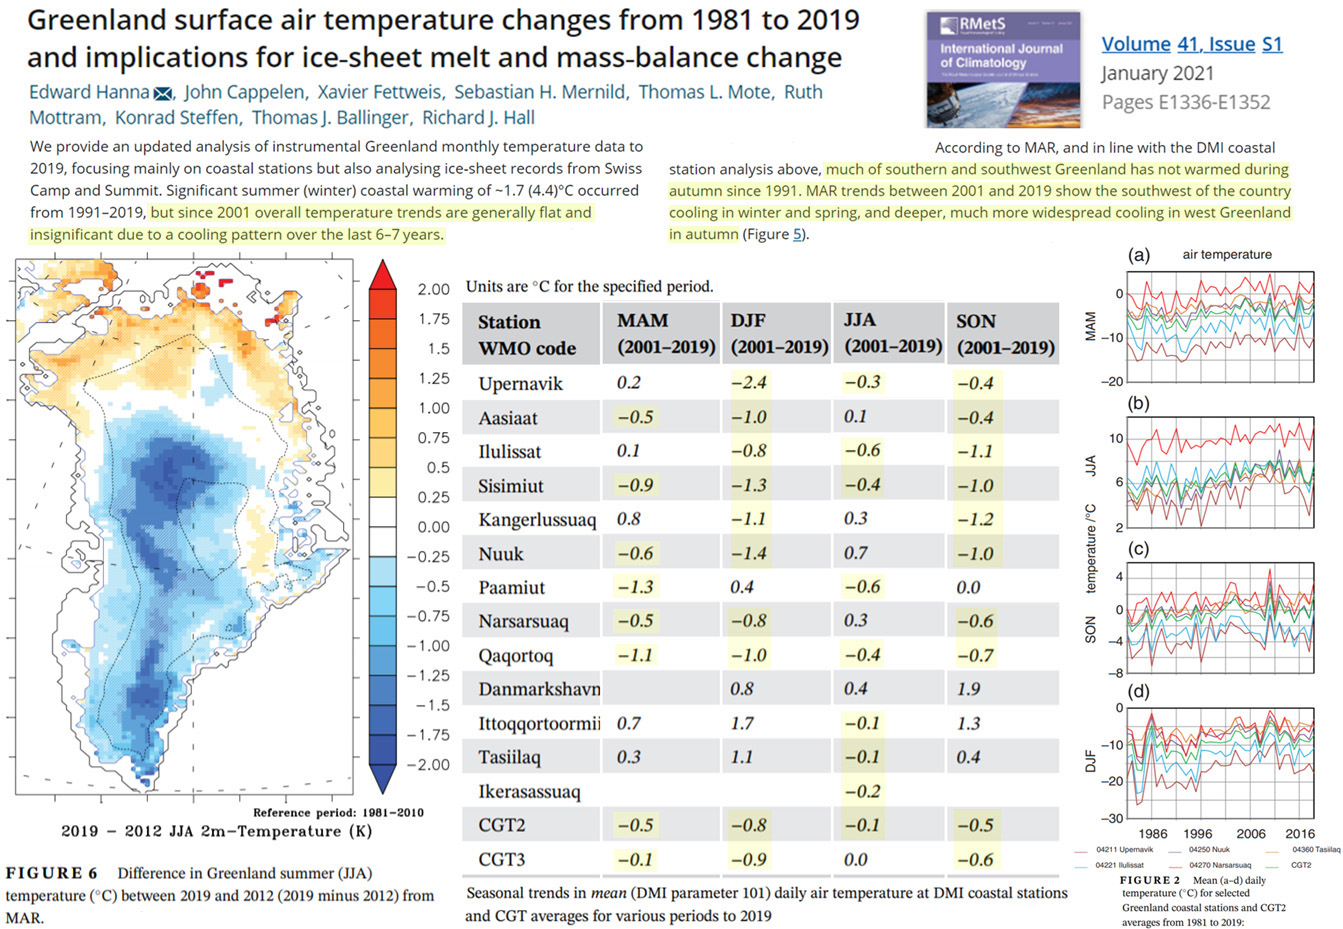
Hannah et al., 2021 Greenland has not warmed (net) since 2001 due to cooling trend since 2013
We provide an updated analysis of instrumental Greenland monthly temperature data to 2019, focusing mainly on coastal stations but also analysing ice‐sheet records from Swiss Camp and Summit. Significant summer (winter) coastal warming of ~1.7 (4.4)°C occurred from 1991–2019, but since 2001 overall temperature trends are generally flat and insignificant due to a cooling pattern over the last 6–7 years. … According to MAR, and in line with the DMI coastal station analysis above, much of southern and southwest Greenland has not warmed during autumn since 1991. MAR trends between 2001 and 2019 show the southwest of the country cooling in winter and spring, and deeper, much more widespread cooling in west Greenland in autumn
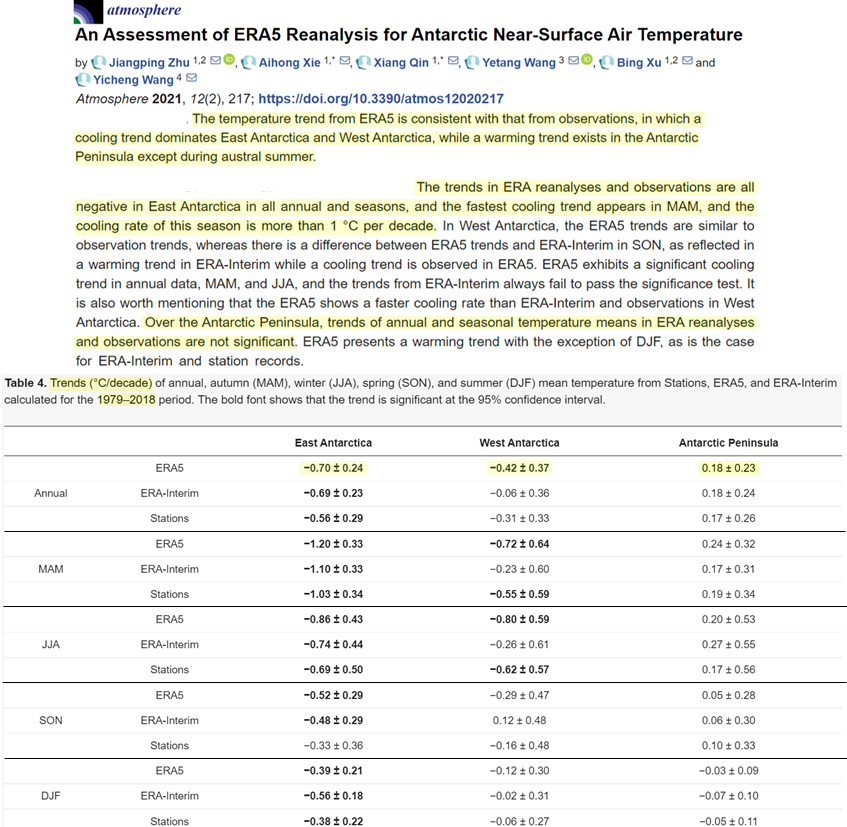
Zhu et al., 2021 E. Antarctica cooled -2.8°C, W. Antarctica cooled -1.68°C from 1979-2018
The temperature trend from ERA5 is consistent with that from observations, in which a cooling trend dominates East Antarctica and West Antarctica, while a warming trend exists in the Antarctic Peninsula except during austral summer. … The trends in ERA reanalyses and observations are all negative in East Antarctica in all annual and seasons, and the fastest cooling trend appears in MAM, and the cooling rate of this season is more than 1 °C per decade. In West Antarctica, the ERA5 trends are similar to observation trends, whereas there is a difference between ERA5 trends and ERA-Interim in SON, as reflected in a warming trend in ERA-Interim while a cooling trend is observed in ERA5. ERA5 exhibits a significant cooling trend in annual data, MAM, and JJA, and the trends from ERA-Interim always fail to pass the significance test. It is also worth mentioning that the ERA5 shows a faster cooling rate than ERA-Interim and observations in West Antarctica. Over the Antarctic Peninsula, trends of annual and seasonal temperature means in ERA reanalyses and observations are not significant. ERA5 presents a warming trend with the exception of DJF, as is the case for ERA-Interim and station records.
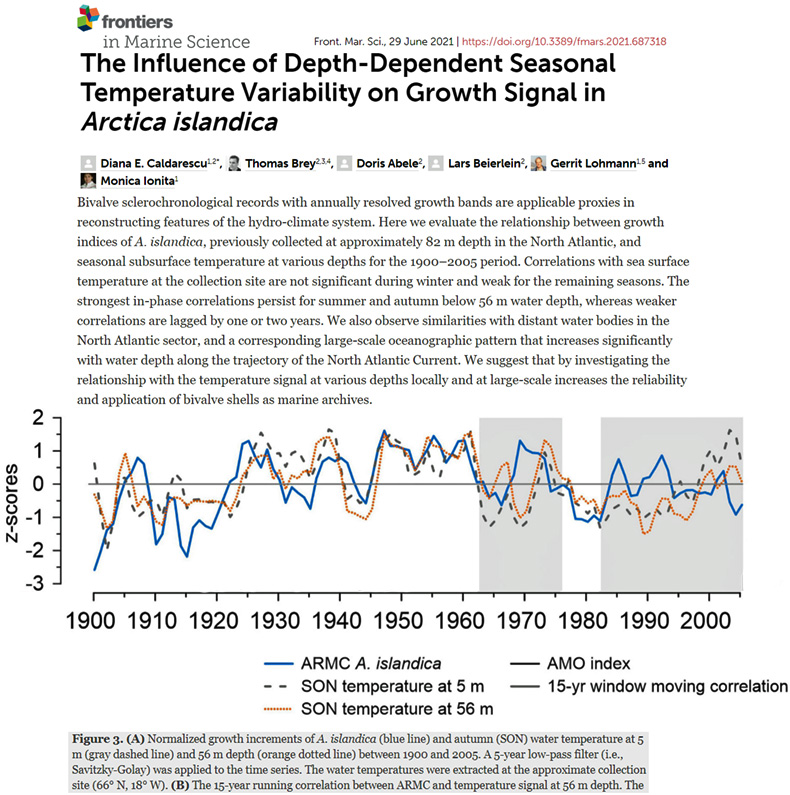
Caldarescu et al., 2021 Recent (1900-2005) North Atlantic non-warming
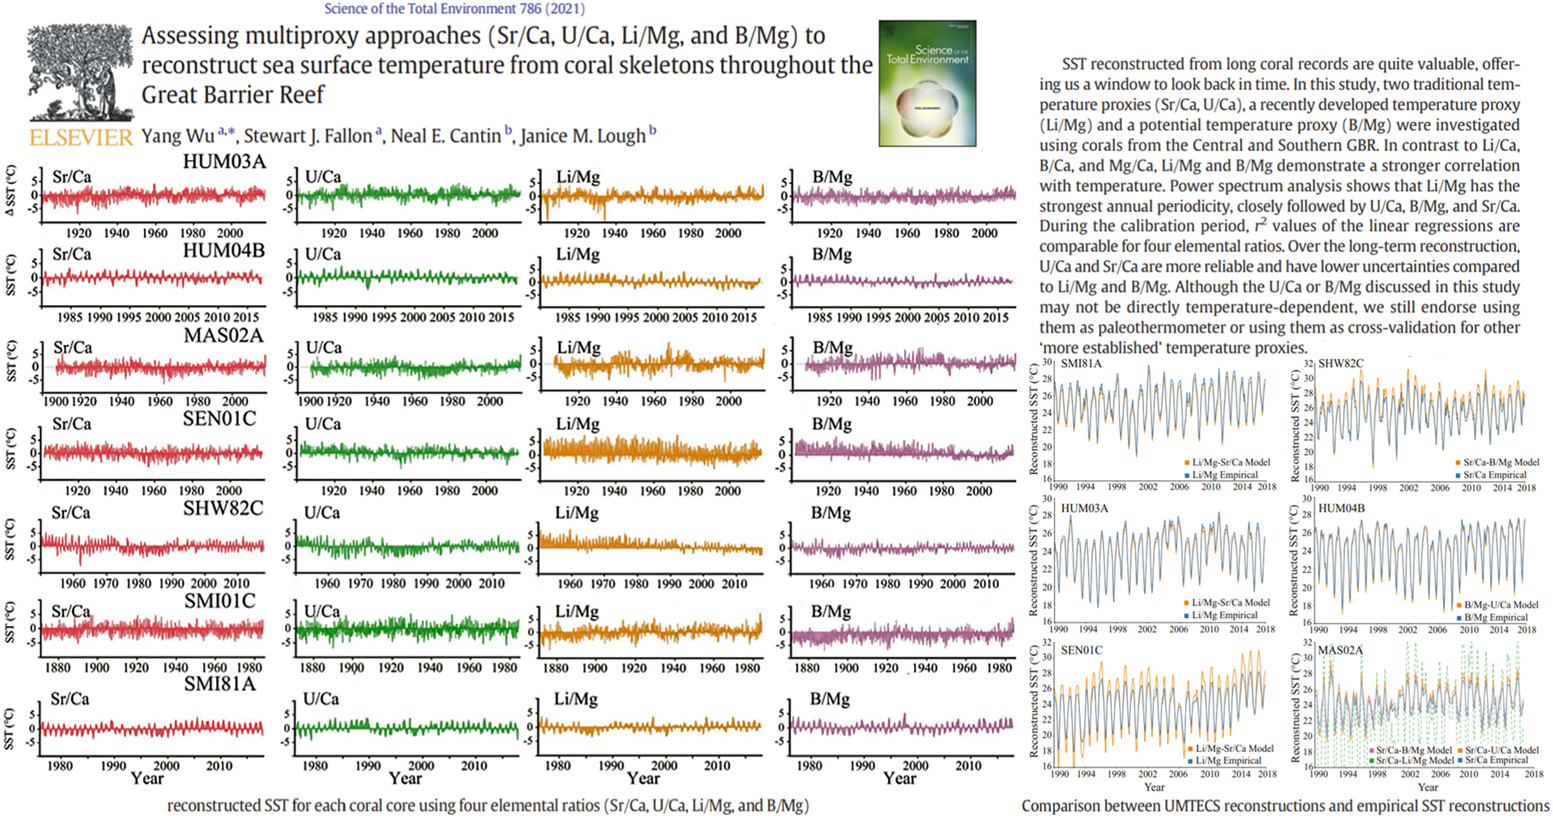
Wu et al., 2021 Recent (1900-) non-warming, Great Barrier Reef
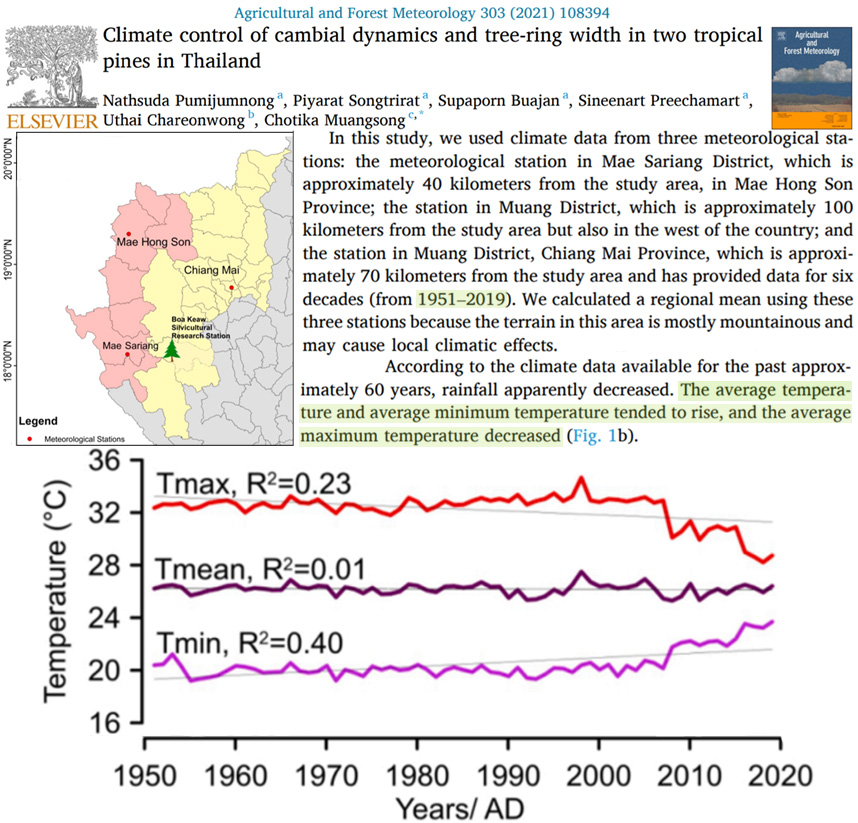
Pumijumnong et al., 2021 No net warming in Thailand since ~1960, “average maximum temperatures decreased”
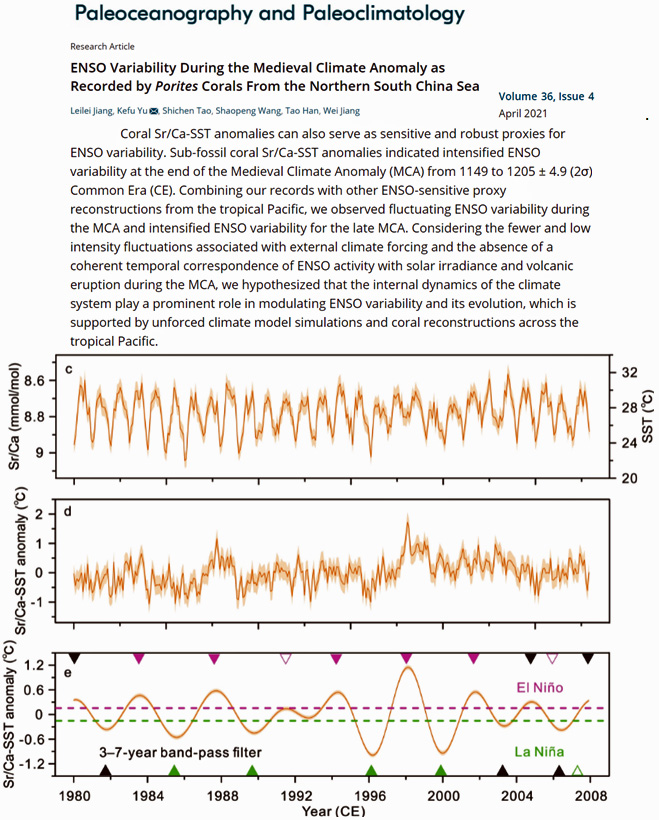
Jiang et al., 2021 No obvious net warming in Northern South China Sea since the 1980s
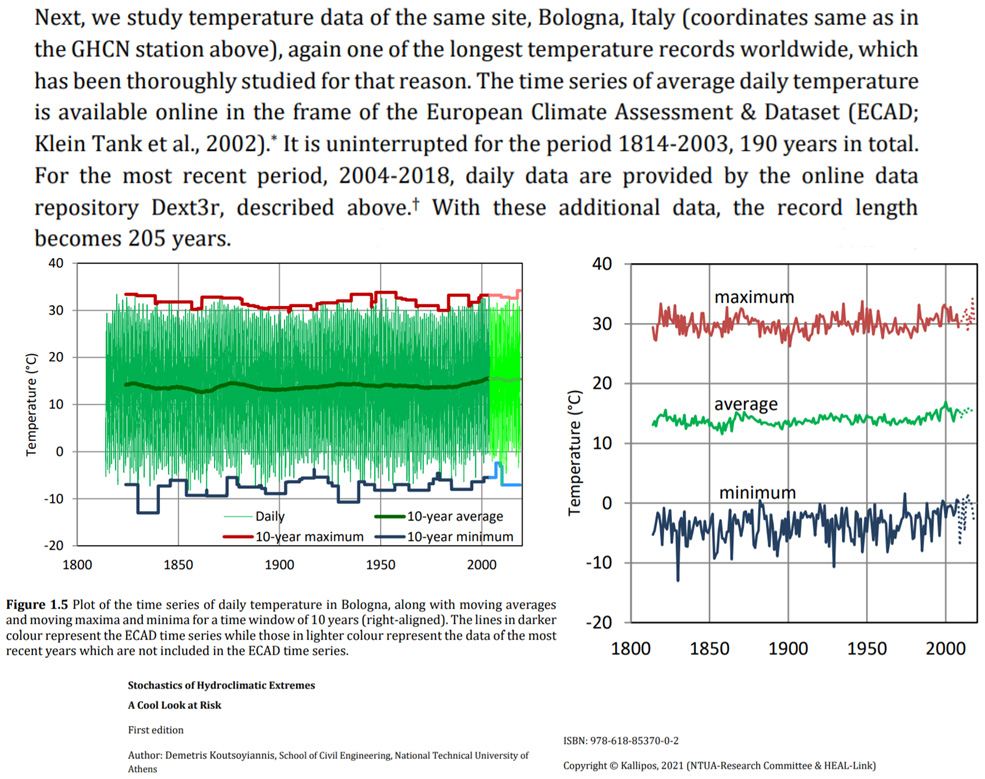
Koutsoyiannis, 2021 Bologna, Italy instrumental record 1814-2018 shows no net warming trend
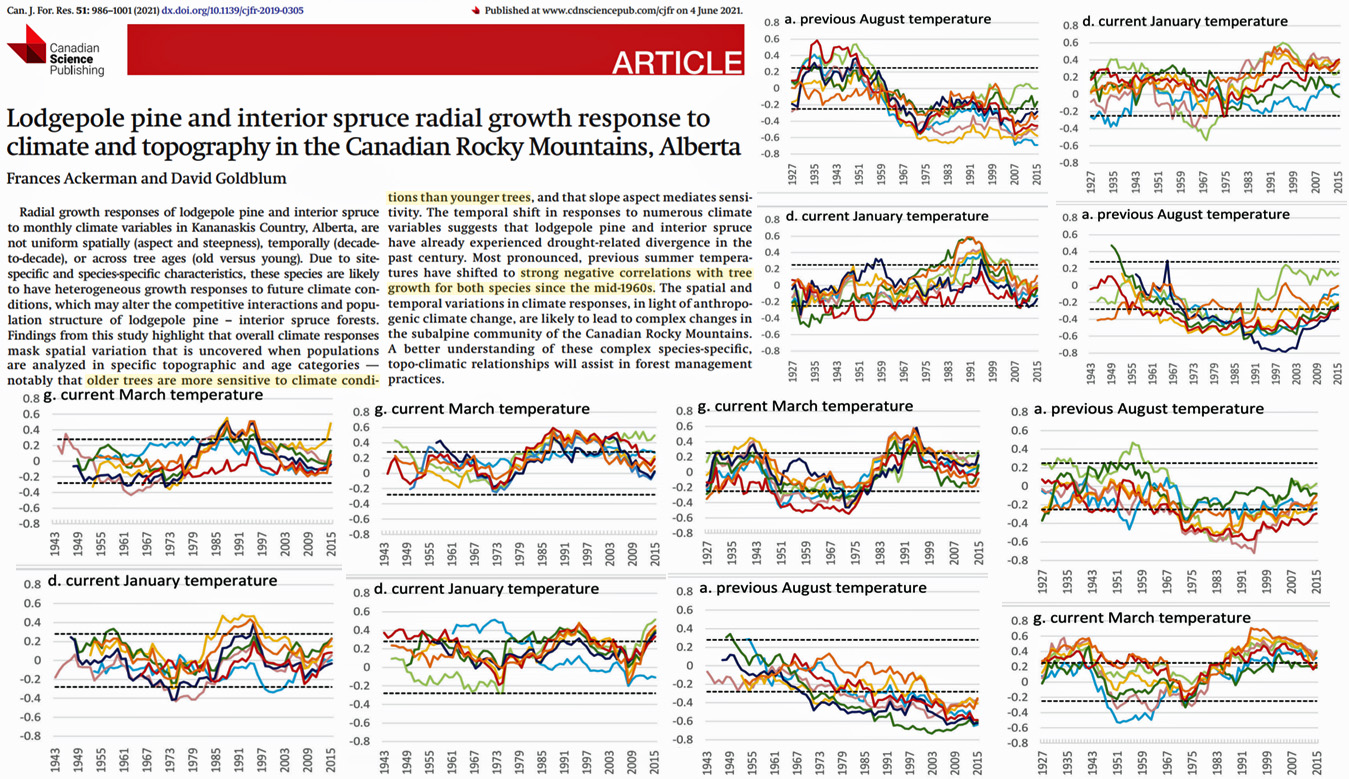
Ackerman and Goldblum, 2021 Canadian Rockies no net warming since early 20th century
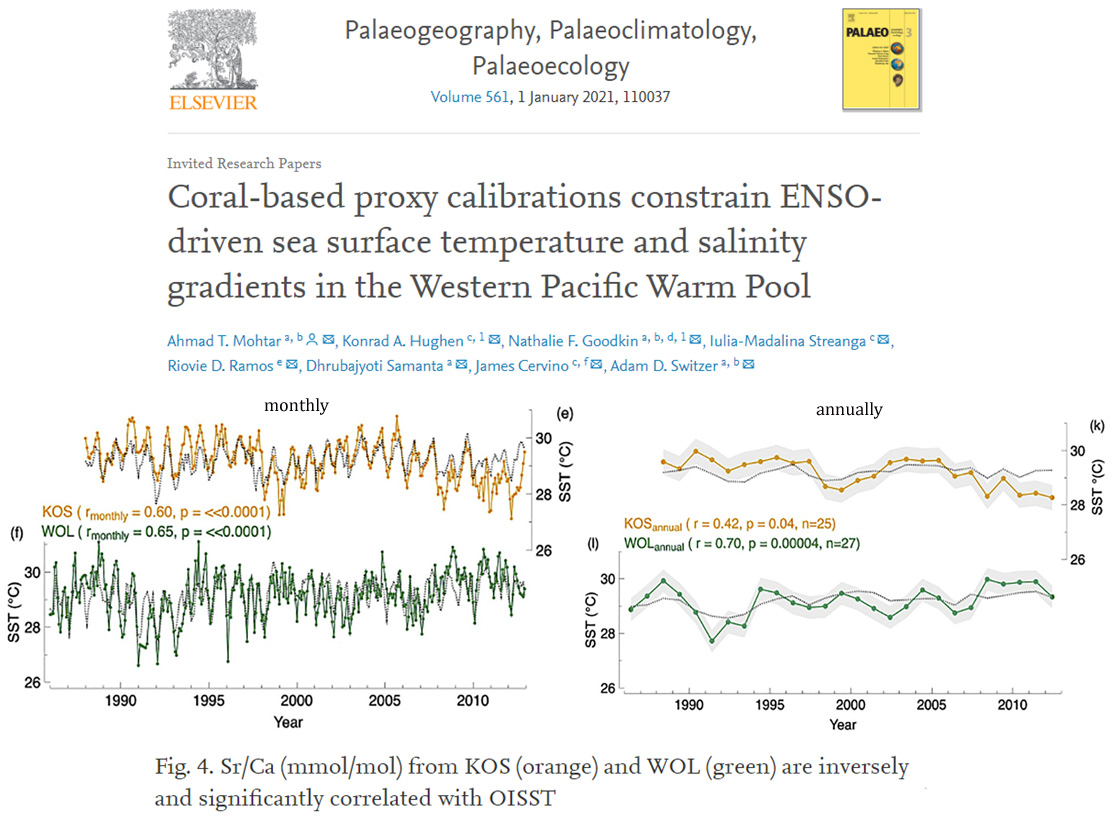
Mohtar et al., 2021 Tropical W. Pacific no net warming since 1980s
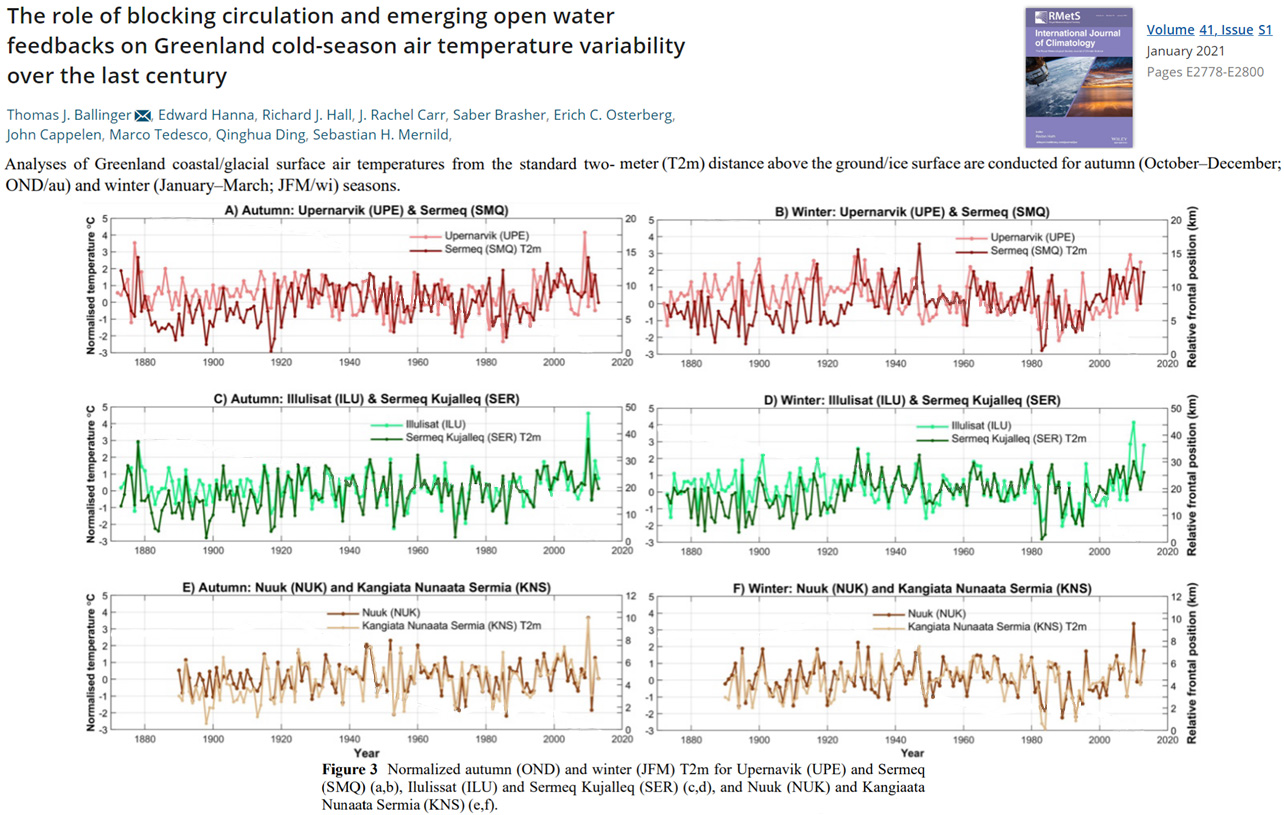
Ballinger et al., 2021 No net warming in Greenland since 1930s
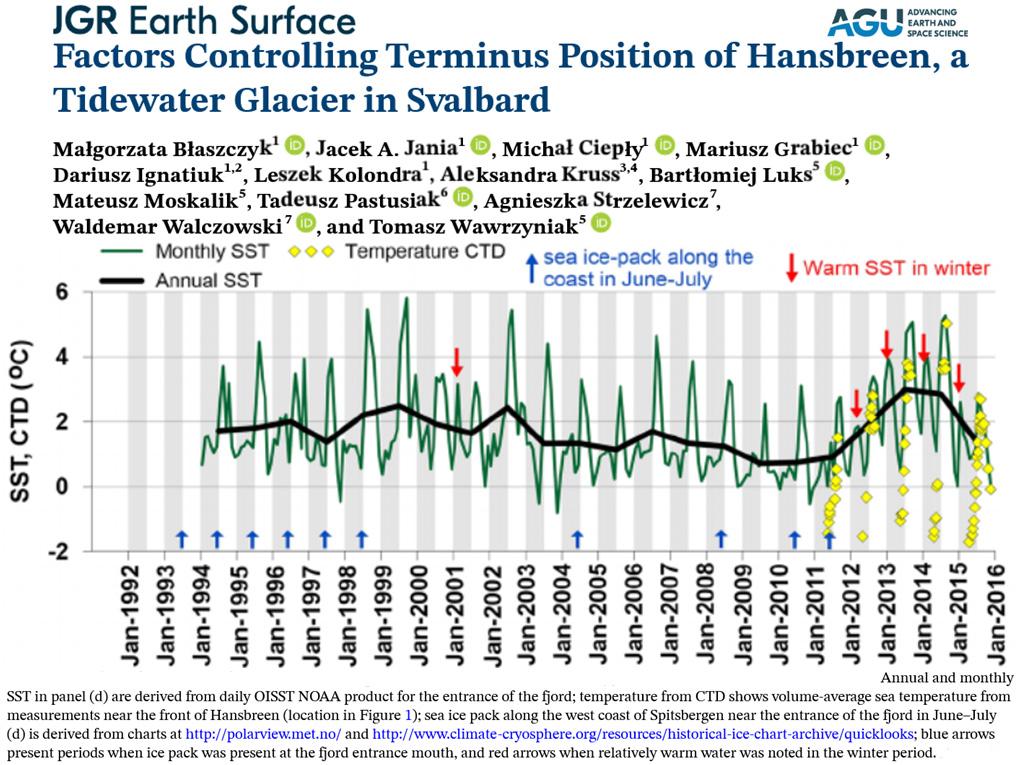
Blaszczyk et al., 2021 Svalbard has no obvious net warming since 1990s
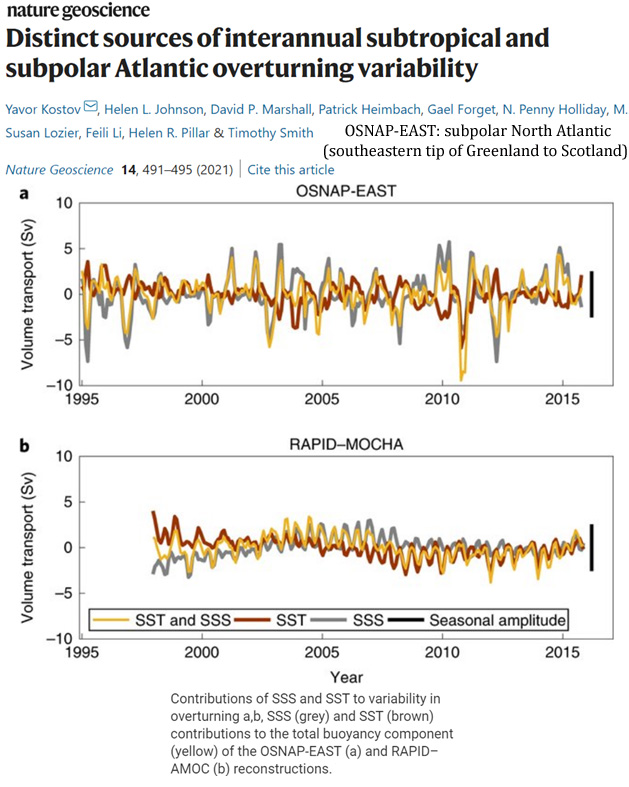
Kostov et al., 2021 Recent (1995-) non-warming, subpolar Atlantic
The Atlantic meridional overturning circulation (AMOC) is pivotal for regional and global climate due to its key role in the uptake and redistribution of heat and carbon. Establishing the causes of historical variability in AMOC strength on different timescales can tell us how the circulation may respond to natural and anthropogenic changes at the ocean surface. However, understanding observed AMOC variability is challenging because the circulation is influenced by multiple factors that co-vary and whose overlapping impacts persist for years. Here we reconstruct and unambiguously attribute intermonthly and interannual AMOC variability at two observational arrays to the recent history of surface wind stress, temperature and salinity.
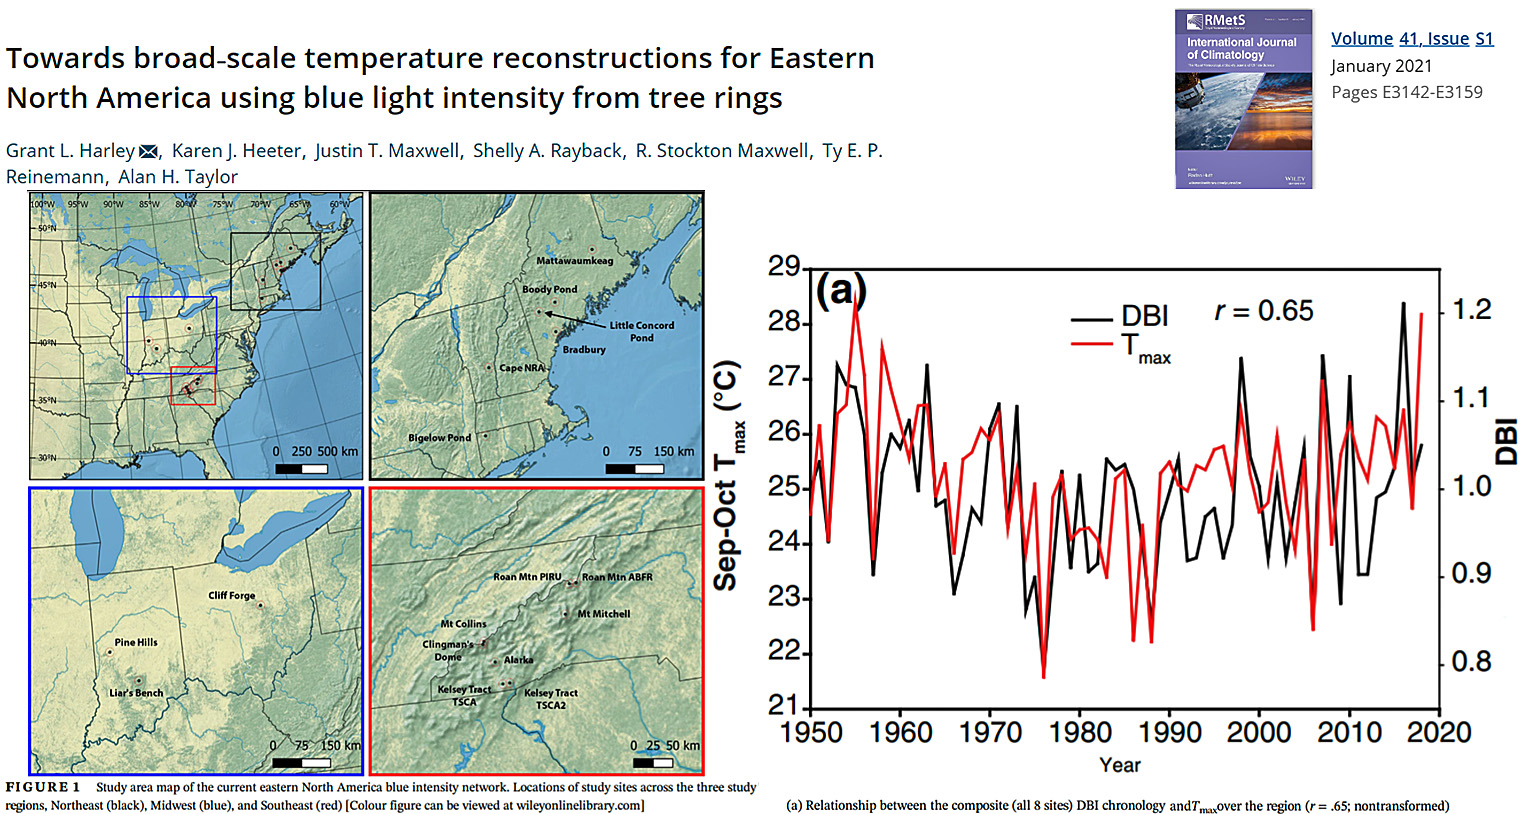
Harley et al., 2021 No net warming since 1950 in Eastern North America
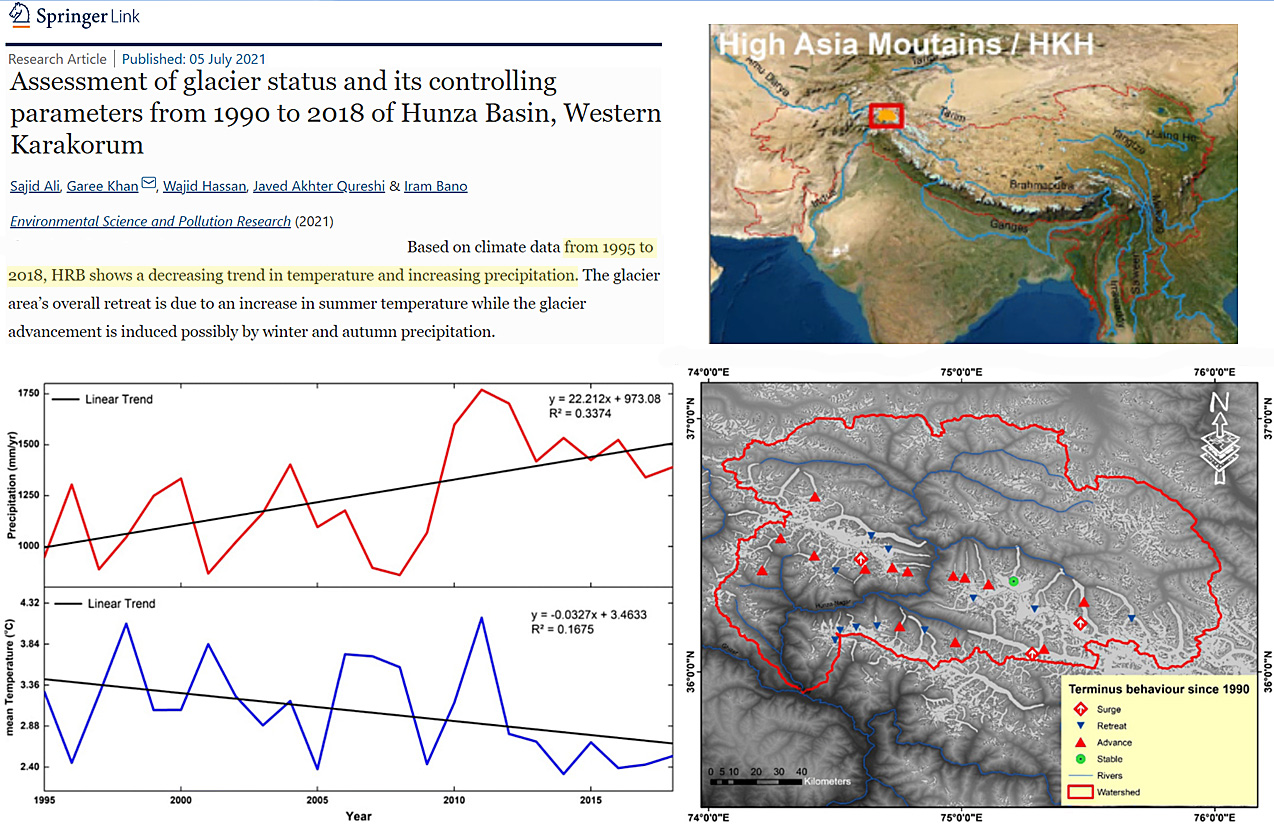
Ali et al., 2021 High Asia Mountains (Karakorum) “decreasing trend in temperature” 1995-2018
Zhang et al., 2021 Recent non-warming trend, SE China
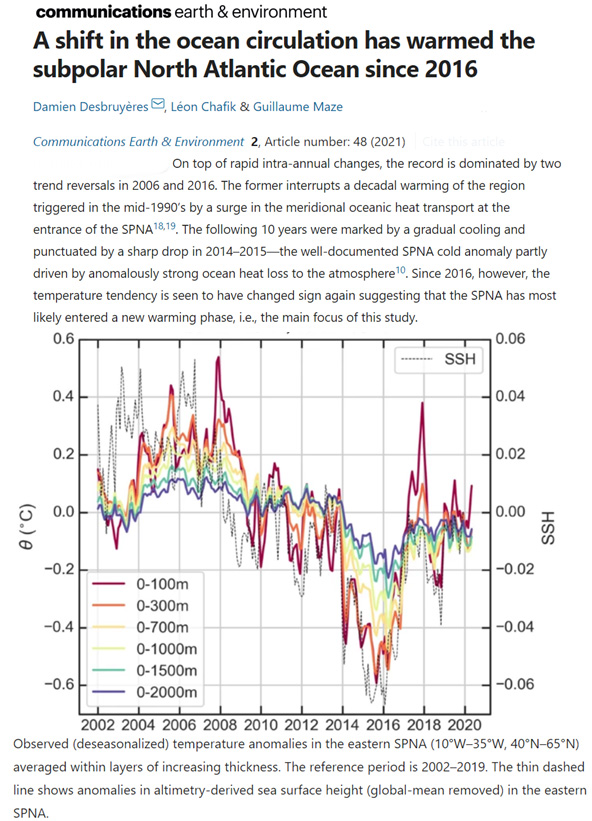
Desbruyères et al., 2021 Subpolar North Atlantic net cooling trend, 2002-2020
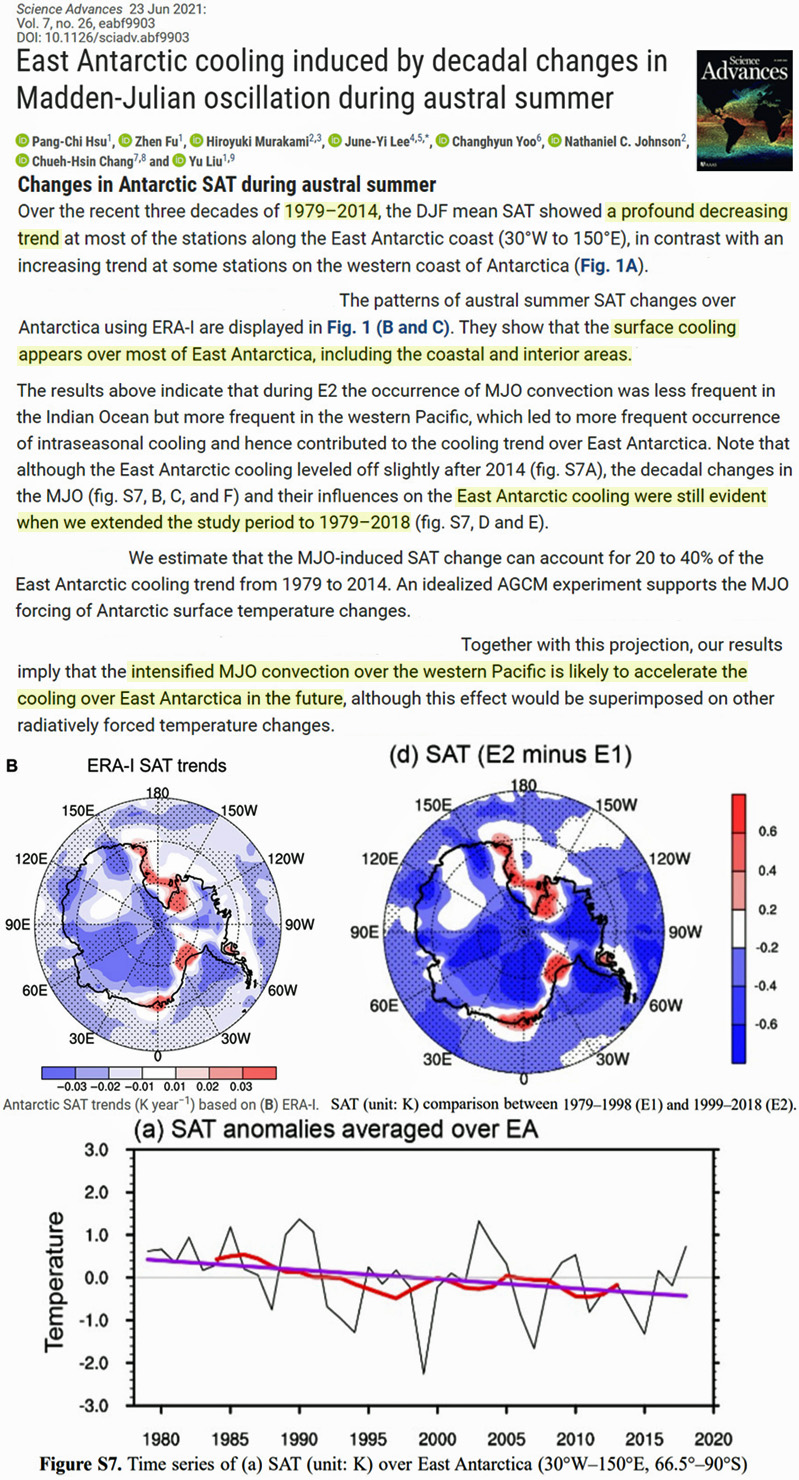
Hsu et al., 2021 East Antarctica “profound” cooling trend, 1979-2018
Over the recent three decades of 1979–2014, the DJF mean SAT showed a profound decreasing trend at most of the stations along the East Antarctic coast (30°W to 150°E), in contrast with an increasing trend at some stations on the western coast of Antarctica (Fig. 1A). … surface cooling appears over most of East Antarctica, including the coastal and interior areas. … East Antarctic cooling was still evident when we extended the study period to 2018.
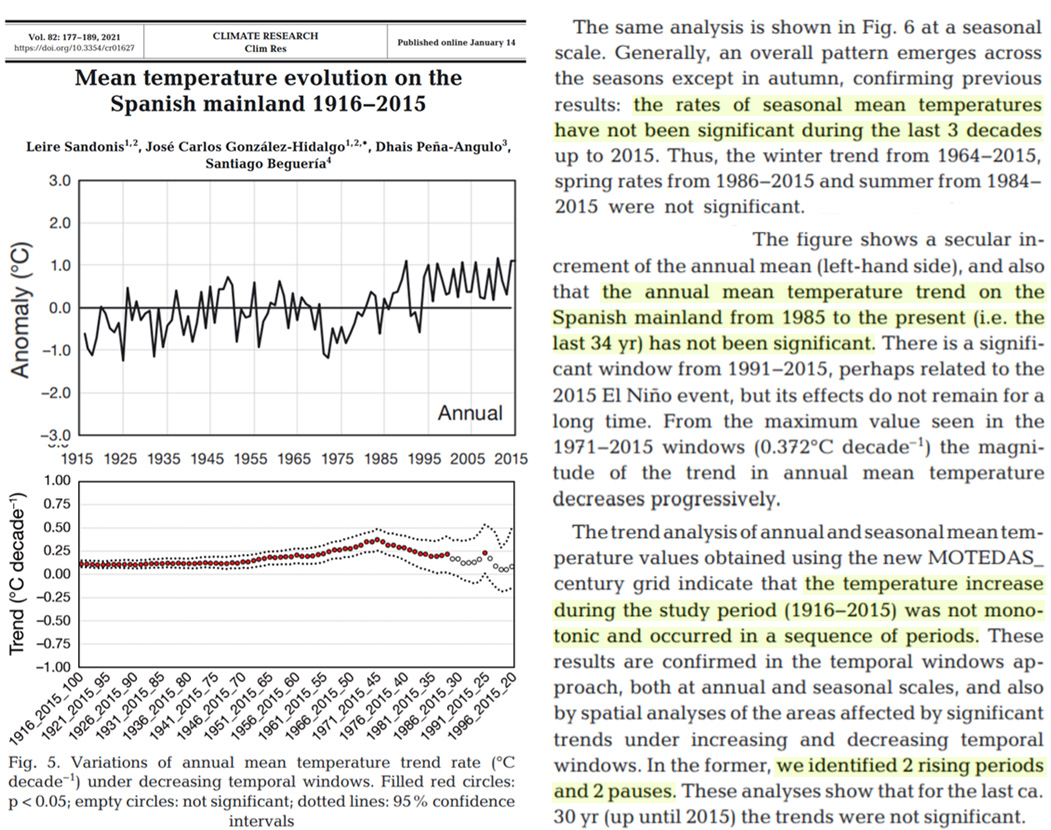
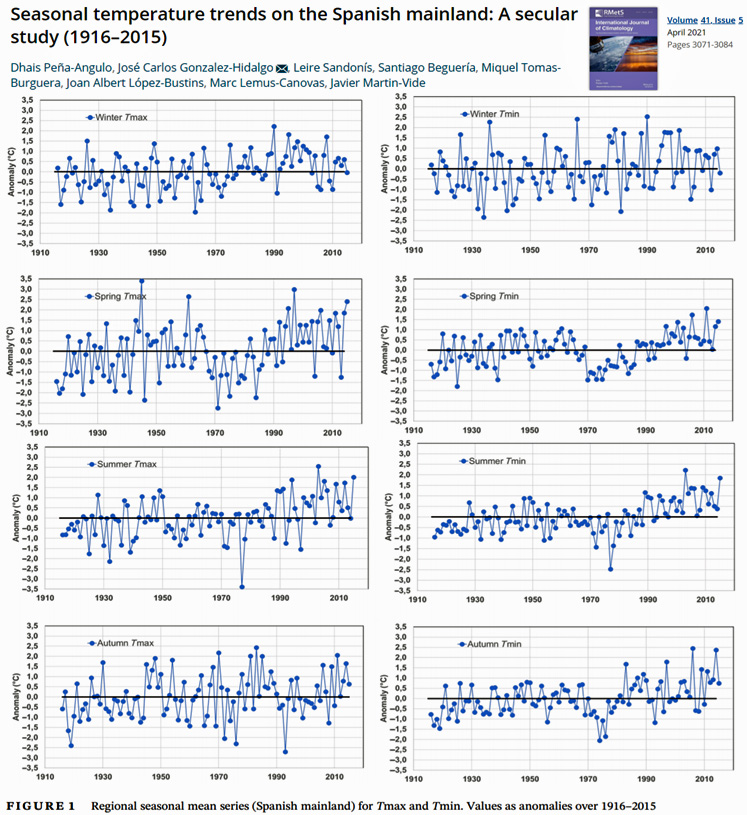
Sandonis et al., 2021 Temperature change rates “have not been significant during the last 3 decades” in Spanish mainland
The trend analysis of annual and seasonal mean temperature values obtained using the new MOTEDAS_century grid indicate that the temperature increase during the study period (1916−2015) was not monotonic and occurred in a sequence of periods. These results are confirmed in the temporal windows approach, both at annual and seasonal scales, and also by spatial analyses of the areas affected by significant trends under increasing and decreasing temporal windows. In the former, we identified 2 rising periods and 2 pauses. These analyses show that for the last ca. 30 yr (up until 2015) the trends were not significant. … The same analysis is shown in Fig. 6 at a seasonal scale. Generally, an overall pattern emerges across the seasons except in autumn, confirming previous results: the rates of seasonal mean temperatures have not been significant during the last 3 decades up to 2015. Thus, the winter trend from 1964−2015, spring rates from 1986−2015 and summer from 1984− 2015 were not significant. The data for autumn is highly irregular, and shows a brief rise in recent decades, but has not been significant since the 1970s
Peña-Angulo et al., 2021 Recent (1916-) non-warming (or modest warming) in Spanish mainland
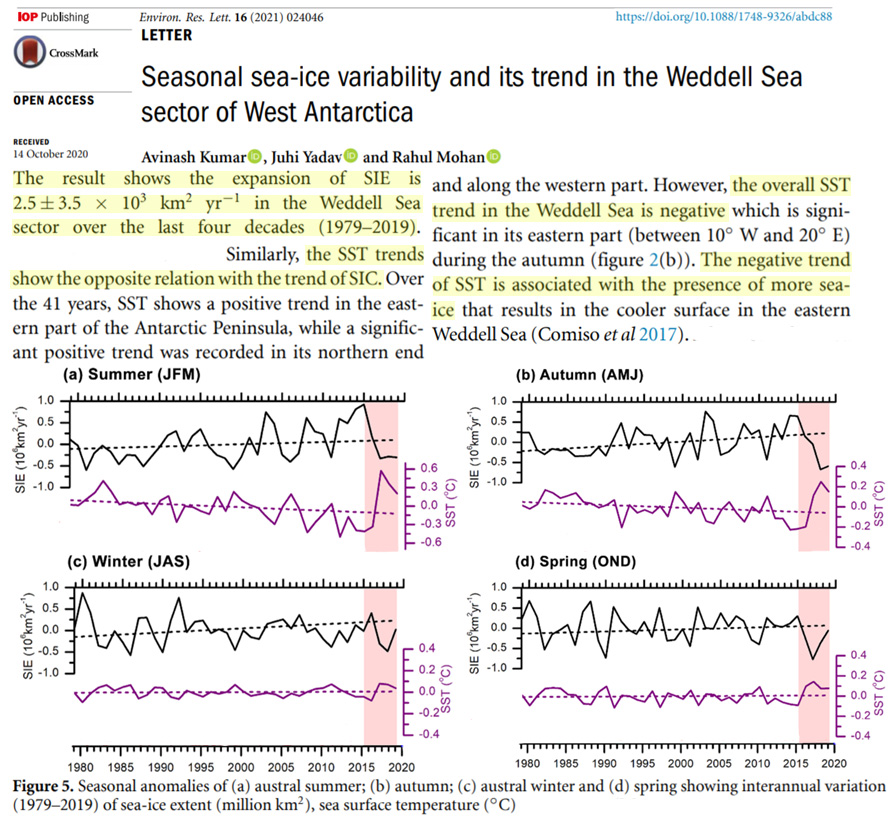
Kumar et al., 2021 Cooling trend in the Weddell Sea (1979-2019), W. Antarctica
The result shows the expansion of SIE [sea ice extent] … in the Weddell Sea sector over the last four decades (1979-2019). … The overall SST trend in the Weddell Sea is negative
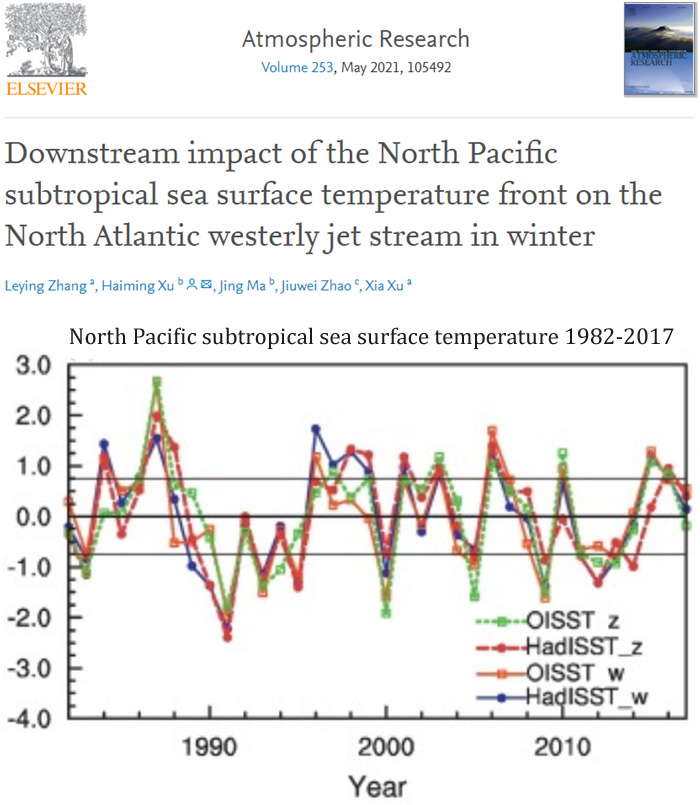
Zhang et al., 2021 Recent (1982-2017) non-warming, subtropical North Pacific
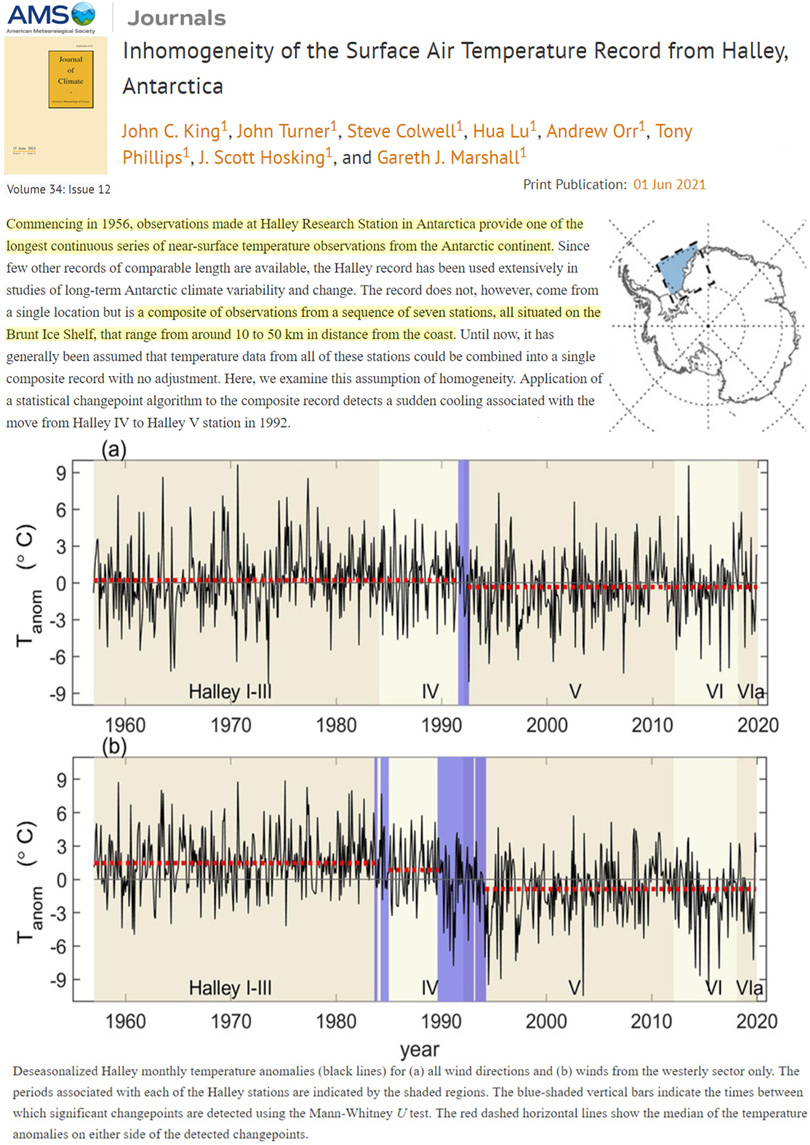
King et al., 2021 Antarctica instrumental record shows surface air temperature cooling since 1956
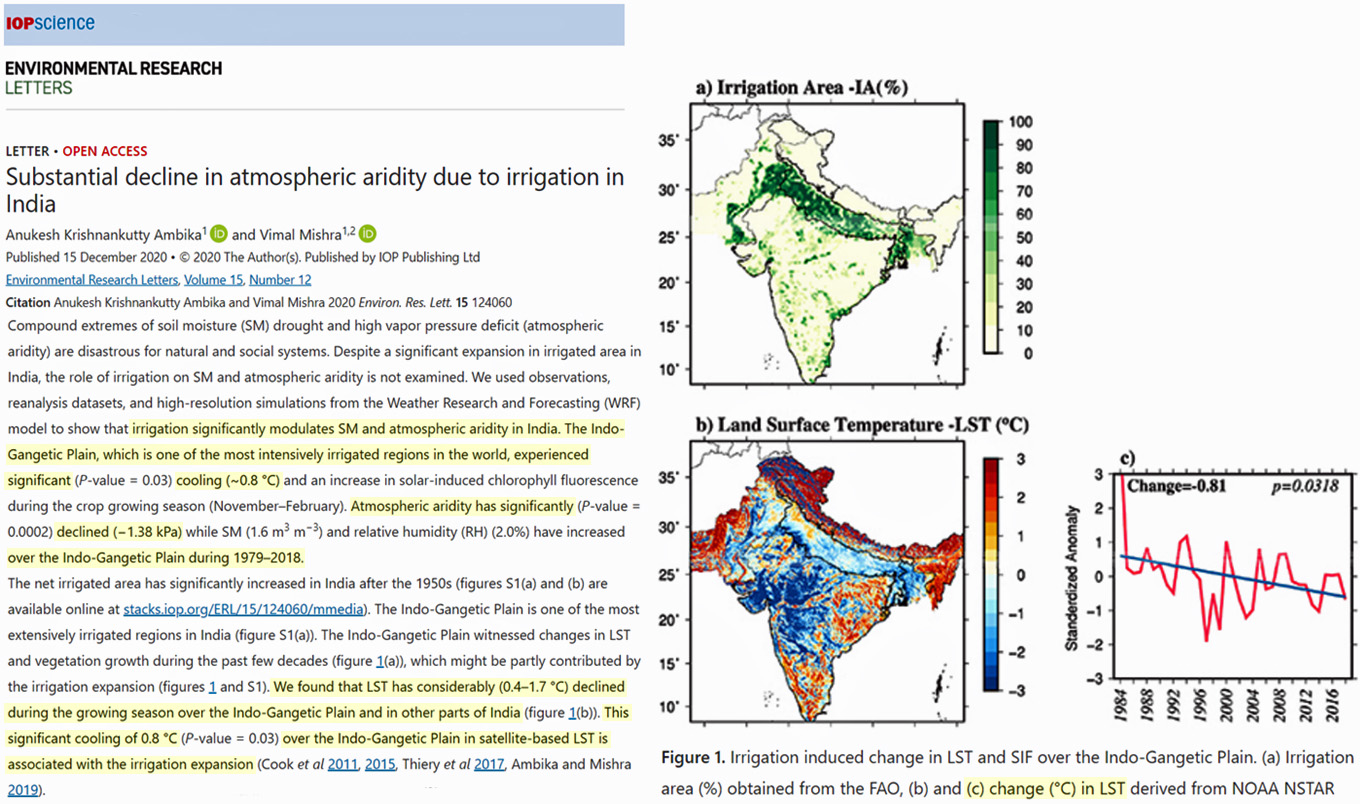
Krishnankutty Ambika and Mishra 2021 Northern India cooling -0.8°C 1979-2018 (due to water vapor/irrigation)
The Indo-Gangetic Plain, which is one of the most intensively irrigated regions in the world, experienced significant (P-value = 0.03) cooling (~0.8 °C)…during 1979–2018. … We found that LST has considerably (0.4–1.7 °C) declined during the growing season over the Indo-Gangetic Plain and in other parts of India (figure 1(b)). This significant cooling of 0.8 °C (P-value = 0.03) over the Indo-Gangetic Plain in satellite-based LST is associated with the irrigation expansion (Cook et al 2011, 2015, Thiery et al 2017, Ambika and Mishra 2019).
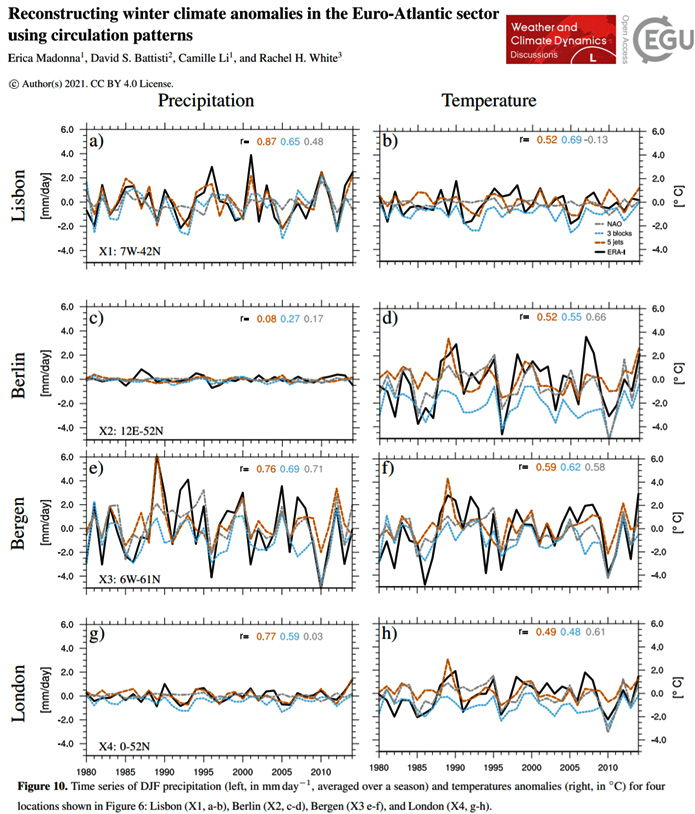
Madonna et al., 2021 Recent (1980-) cooling/non-warming in Lisbon, Berlin, Bergen, London
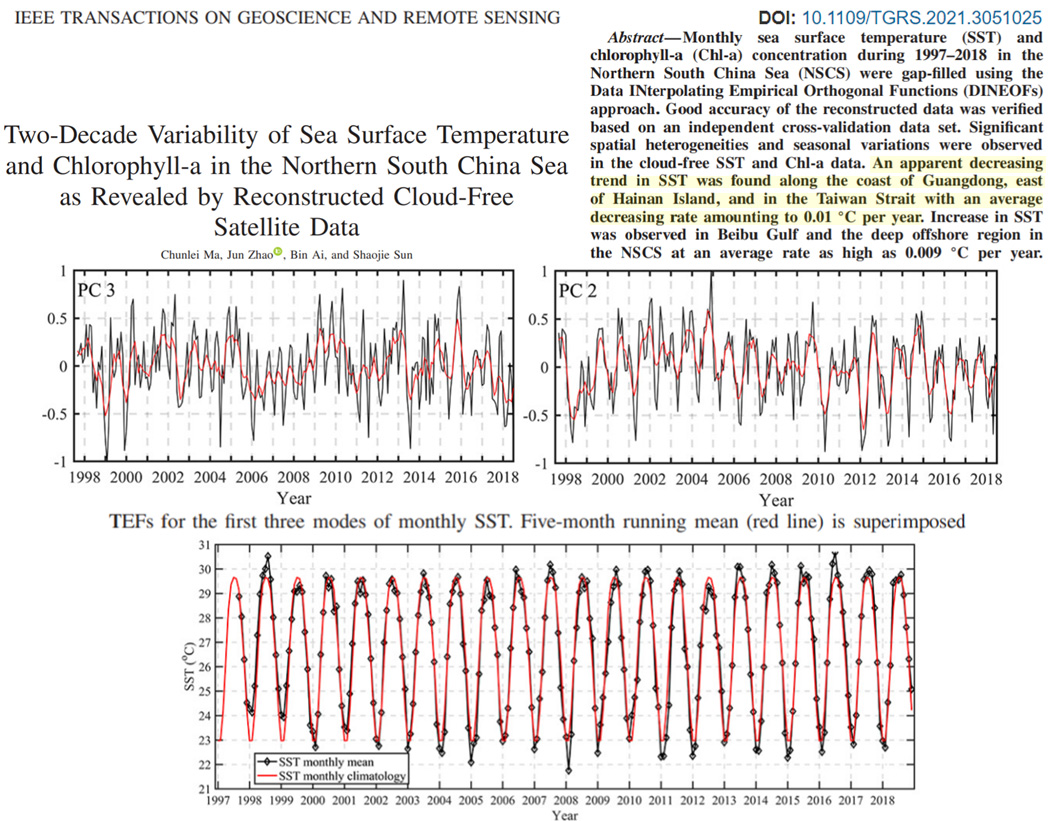
Ma et al., 2021 Recent (1997-) cooling (0.1°C per decade) in the South China Sea
Monthly sea surface temperature (SST) and chlorophyll-a (Chl-a) concentration during 1997-2018 in the Northern South China Sea (NSCS) were gap-filled using the Data INterpolating Empirical Orthogonal Functions (DINEOFs) approach. Good accuracy of the reconstructed data was verified based on an independent cross-validation data set. Significant spatial heterogeneities and seasonal variations were observed in the cloud-free SST and Chl-a data. An apparent decreasing trend in SST was found along the coast of Guangdong, east of Hainan Island, and in the Taiwan Strait with an average decreasing rate amounting to 0.01 °C per year. Increase in SST was observed in Beibu Gulf and the deep offshore region in the NSCS at an average rate as high as 0.009 °C per year.
Lack Of Anthropogenic/CO2 Signal In Sea Level Rise
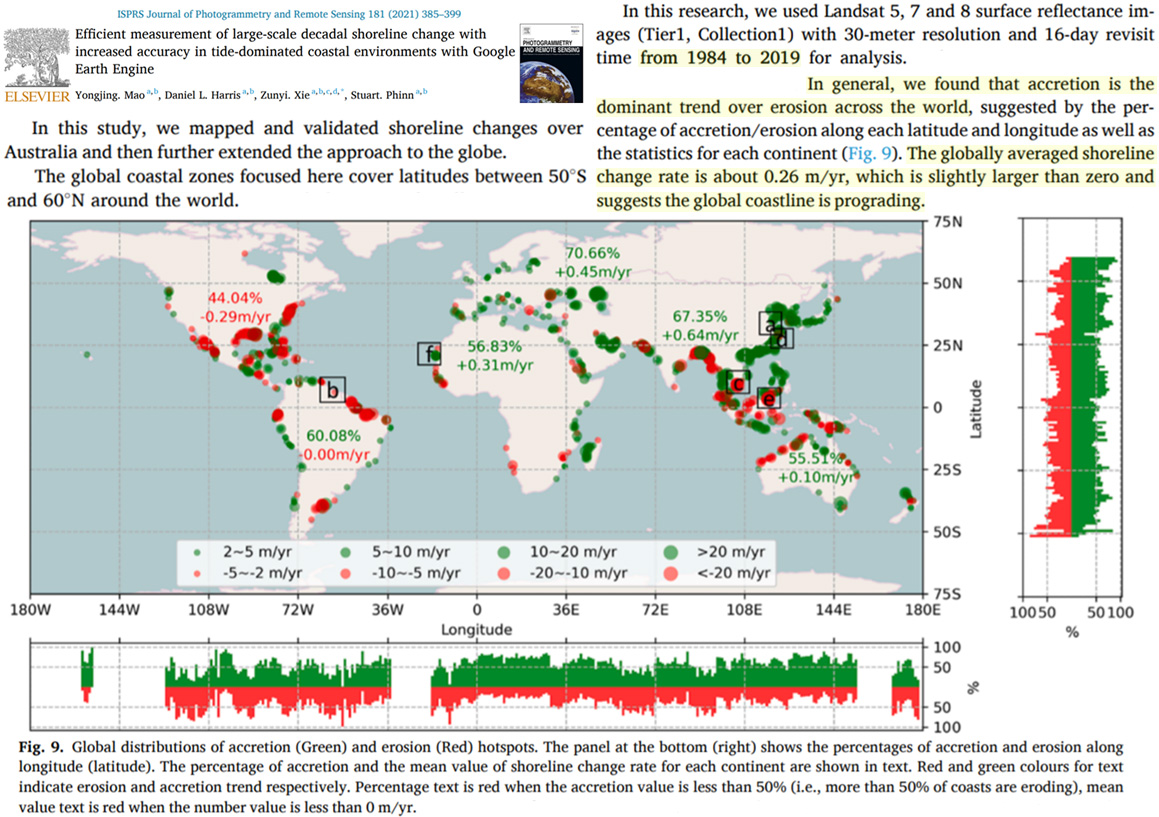
In general, we found that accretion is the dominant trend over erosion across the world, suggested by the percentage of accretion/erosion along each latitude and longitude as well as the statistics for each continent (Fig. 9). The globally averaged shoreline change rate is about 0.26 m/yr, which is slightly larger than zero and suggests the global coastline is prograding [1984-2019].
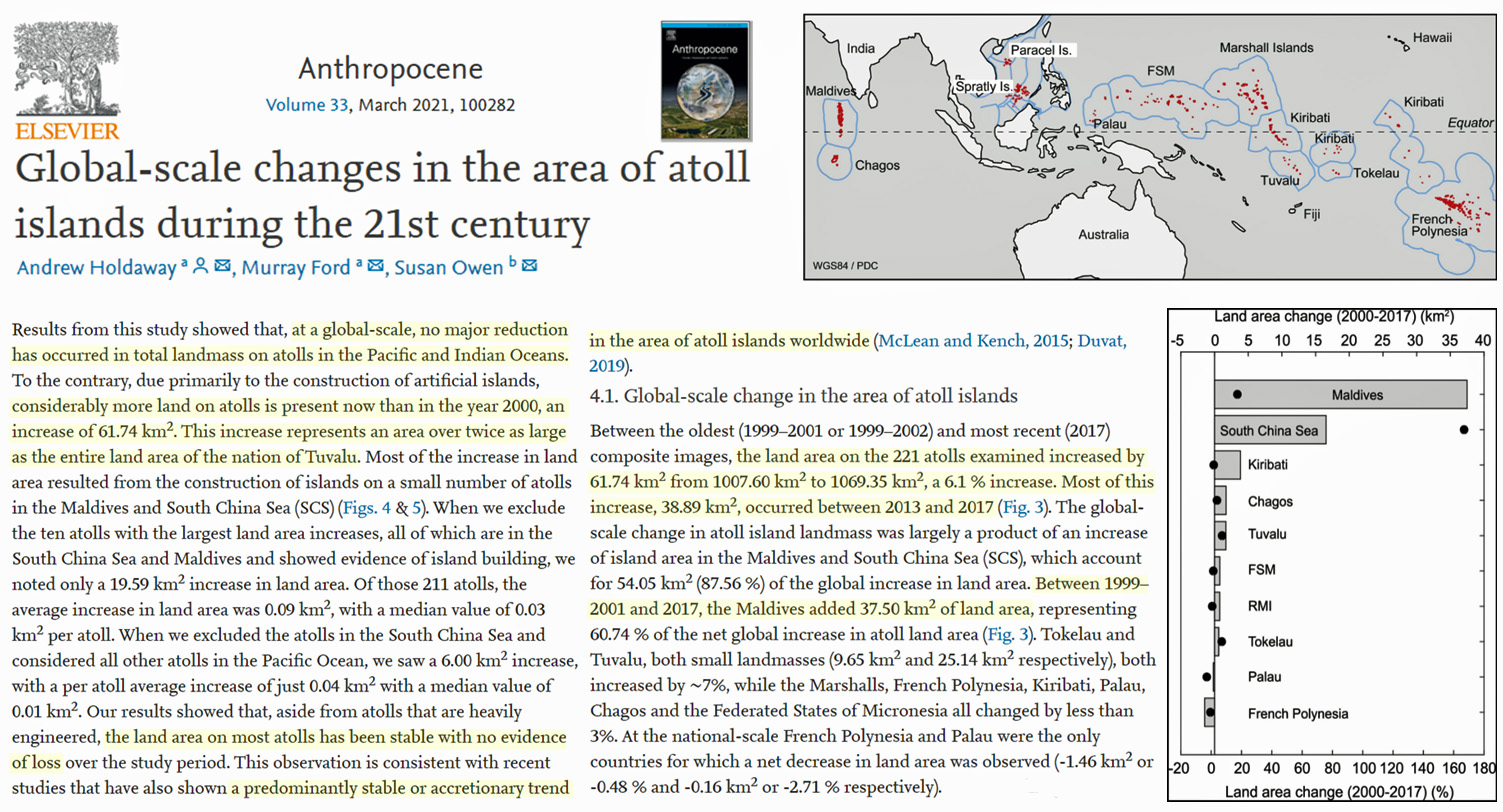
Between the oldest (1999–2001 or 1999–2002) and most recent (2017) composite images, the land area on the 221 atolls examined increased by 61.74 km² from 1007.60 km² to 1069.35 km2, a 6.1 % increase. Most of this increase, 38.89 km², occurred between 2013 and 2017 (Fig. 3). The global-scale change in atoll island landmass was largely a product of an increase of island area in the Maldives and South China Sea (SCS), which account for 54.05 km² (87.56 %) of the global increase in land area. Between 1999–2001 and 2017, the Maldives added 37.50 km² of land area, representing 60.74 % of the net global increase in atoll land area (Fig. 3). Tokelau and Tuvalu, both small landmasses (9.65 km² and 25.14 km² respectively), both increased by ∼7%, while the Marshalls, French Polynesia, Kiribati, Palau, Chagos and the Federated States of Micronesia all changed by less than 3%. At the national-scale French Polynesia and Palau were the only countries for which a net decrease in land area was observed (-1.46 km² or -0.48 % and -0.16 km² or -2.71 % respectively).
Multi-decadal atoll-island dynamics in the Indian Ocean Chagos Archipelago … This study calls upon recently discovered aerial photographs for two atolls in the Indian Ocean Chagos Archipelago. Pairing these vintage data with modern satellite imagery allows the coastline dynamics of a suite of islands to be quantified over a 36-to-50-yr. period. … Key findings include: (i) Coastlines facing the prevailing trade winds retreat through time, while those in leeward positions expand; (ii) coastline expansion and retreat are in balance such that total land area of all the considered islands is virtually static over the last 50 years … A comparison between the behavior of a broad portfolio of islands spanning the Indian and Pacific Oceans emphasizes local factors such as wind direction, to be better determinants of coastline dynamics than global factors, such as the rate of eustatic sea-level rise. In aggregate, our data suggest that atoll islands are likely to persist in the face of accelerating sea-level rise over the next decades, but their high rate of coastline dynamics will challenge human habitability.
In the 33 LTT stations along the East Coast of North America, the average relative rate of rise is 2.22 mm/yr. subjected to a small, positive acceleration of +0.0028 mm/yr2. The average relative rate of rise of the 11 stations in Canada is 0.61 mm/yr. subjected to a negative acceleration of −0.0133 mm/yr². The average relative rate of rise of the 22 stations of the United States is 3.02 mm/yr. subjected to a positive acceleration of +0.0108 mm/yr². The average absolute velocity of the 33 tide gauge instruments from the GNSS data is −0.52 mm/yr. The average absolute sea-level rise is 1.70 mm/yr. The average absolute velocity of the 33 tide gauge instruments from GIA VM2 and VM4 is −0.76 mm/yr. and −0.33 mm/yr. respectively translating in averages absolute sea-level rise of 1.46 mm/yr. and 1.89 mm/yr. from GIA VM2 and VM4, respectively. … The result here obtained is compatible with a global temperature recovery from the low temperatures of the Little Ice Age (LIA) plus the effect of subsidence. This paper adds to the many contributions, such as [25] to [28], [31] to [79] that demonstrate the world sea levels are rising slowly and with only a small acceleration component.
The tide gauge record at Brest, France, along Eastern part of Atlantic coast is one of the longest records in Europe spanning 212 years (1807–2019). … T]he assessment of Phase I segment of the records disclosed the absence of a statistically significant trend and a uniform acceleration during this period. This outcome eliminates conclusively the occurrence of a uniform acceleration during the entire 212-year data span of the tide gauge record at Brest … Among several studies that investigated sea level accelerations around the globe using TGs , Woodworth et al. (1990) reported uniform sea level decelerations −0.022± 0.036 during 1930–1985 and -0.003 ± 0.007 mm/yr² during 1870–1985. Both estimates cannot reject the null hypothesis (no acceleration) at 5% significance level² (α = 0.05). In a follow up study, Woodworth et al. (2011) reported 0.003±0.001 mm/yr2 uniform sea level acceleration during 1750–2010 at Brest that rejects the null hypothesis. More recently, Boretti (2020) estimated an average³ sea level acceleration of 0.010±0.005 mm/yr² using a quadratic model (akin to a uniform acceleration) at Brest during 1857–2018, which is borderline for rejecting the null hypothesis of a uniform acceleration.
The purpose of the work is to assess the reliability of satellite altimeter gloal mean sea level information through consistency, with other products such as ocean temperatures from thermometers or relative mean sea level records from tidal gauges, and stability of the proposed time series. The satellite altimeter global mean sea level is a mostly computational product. The result is unstable, as characterised by significant changes for the past results introduced in subsequent reconstructions. The result is conflicting with the measurements of ocean temperature, which indicates a smaller thermal expansion contribution. The result also is conflicting with the tide gauge records indicating local sea level stability.
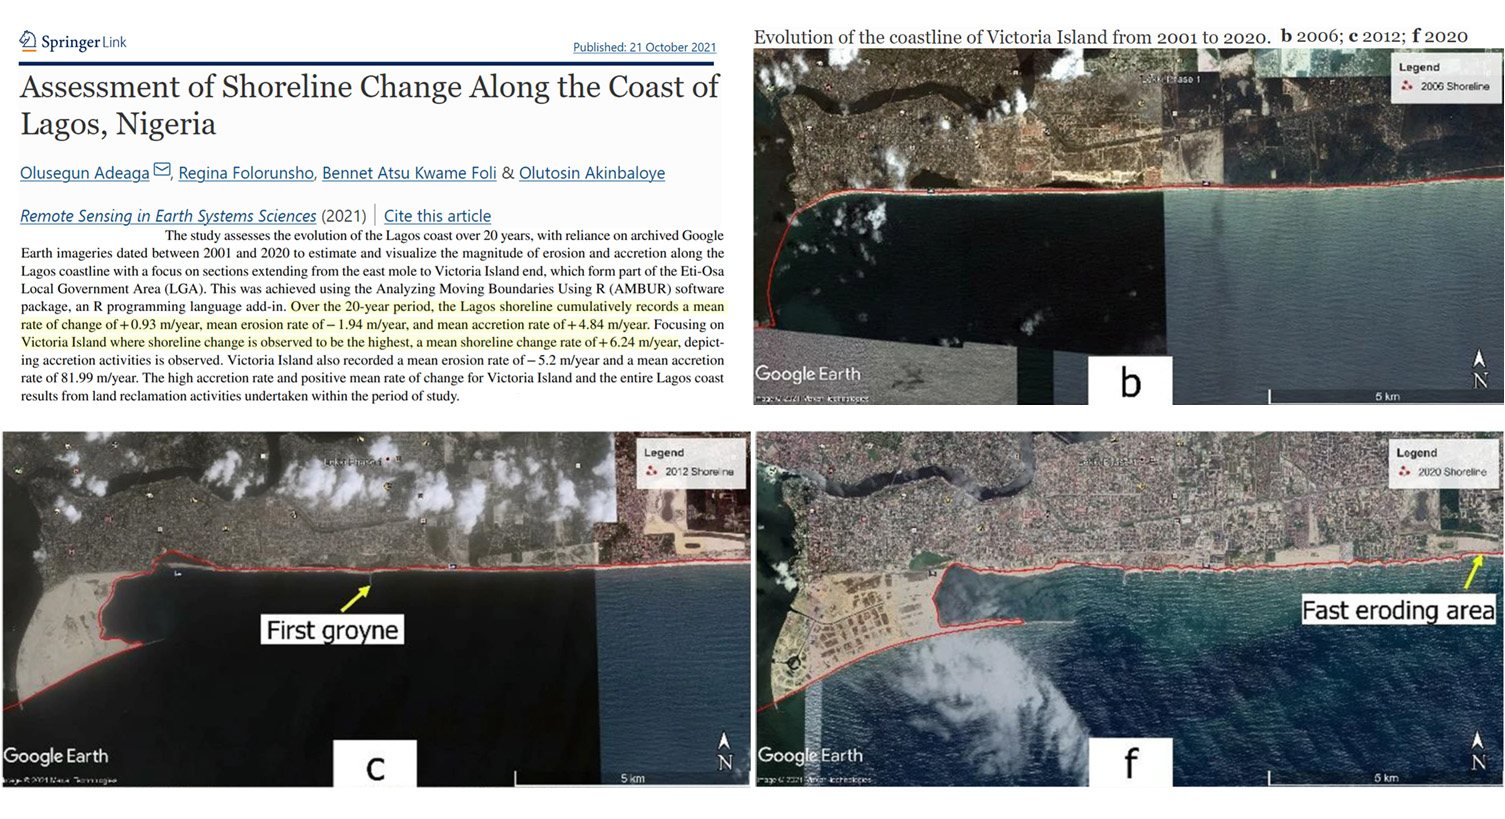
The study assesses the evolution of the Lagos coast over 20 years, with reliance on archived Google Earth imageries dated between 2001 and 2020 to estimate and visualize the magnitude of erosion and accretion along the Lagos coastline with a focus on sections extending from the east mole to Victoria Island end, which form part of the Eti-Osa Local Government Area (LGA). This was achieved using the Analyzing Moving Boundaries Using R (AMBUR) software package, an R programming language add-in. Over the 20-year period, the Lagos shoreline cumulatively records a mean rate of change of + 0.93 m/year, mean erosion rate of − 1.94 m/year, and mean accretion rate of + 4.84 m/year. Focusing on Victoria Island where shoreline change is observed to be the highest, a mean shoreline change rate of + 6.24 m/year, depicting accretion activities is observed.
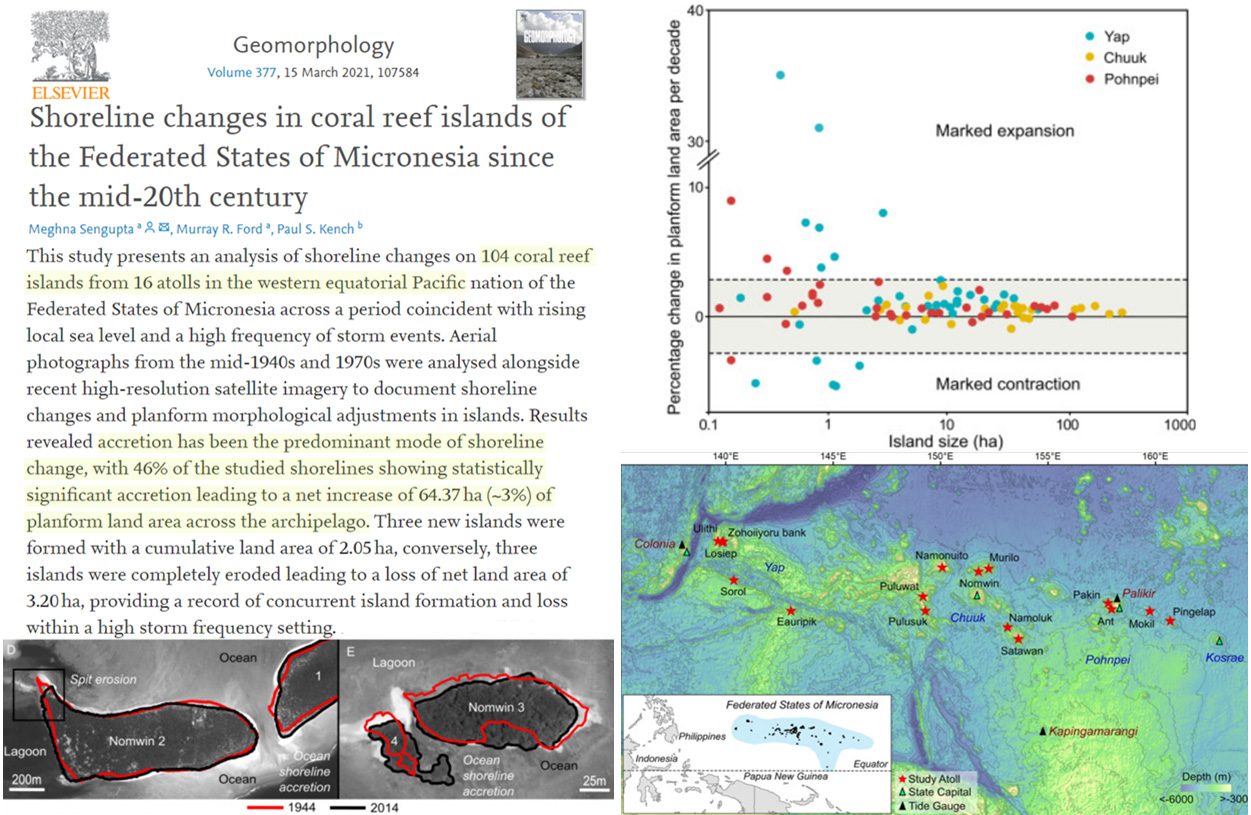
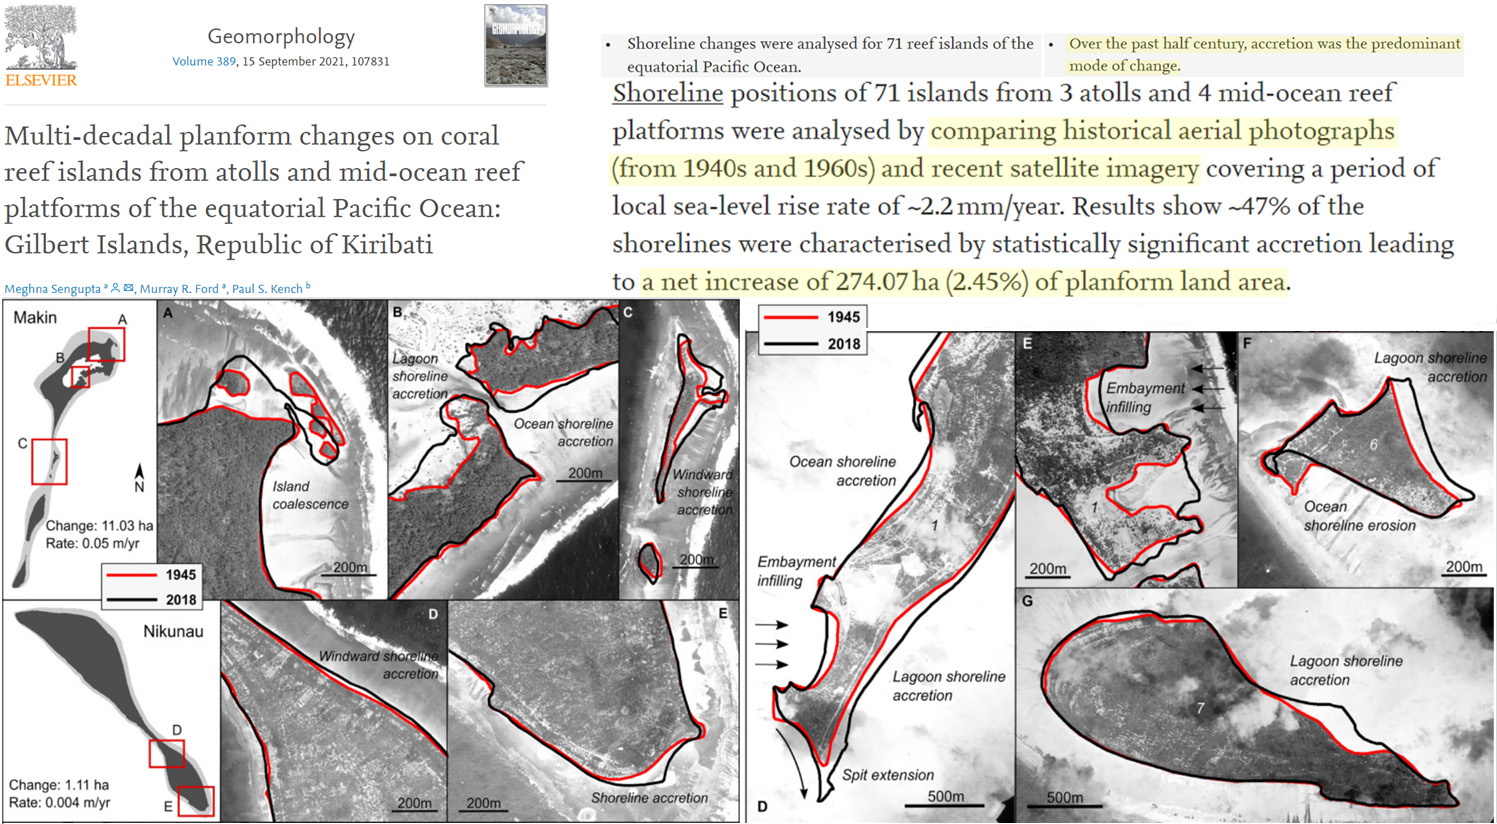
This study presents an analysis of shoreline changes on 104 coral reef islands from 16 atolls in the western equatorial Pacific nation of the Federated States of Micronesia across a period coincident with rising local sea level and a high frequency of storm events. Aerial photographs from the mid-1940s and 1970s were analysed alongside recent high-resolution satellite imagery to document shoreline changes and planform morphological adjustments in islands. Results revealed accretion has been the predominant mode of shoreline change, with 46% of the studied shorelines showing statistically significant accretion leading to a net increase of 64.37 ha (~3%) of planform land area across the archipelago.
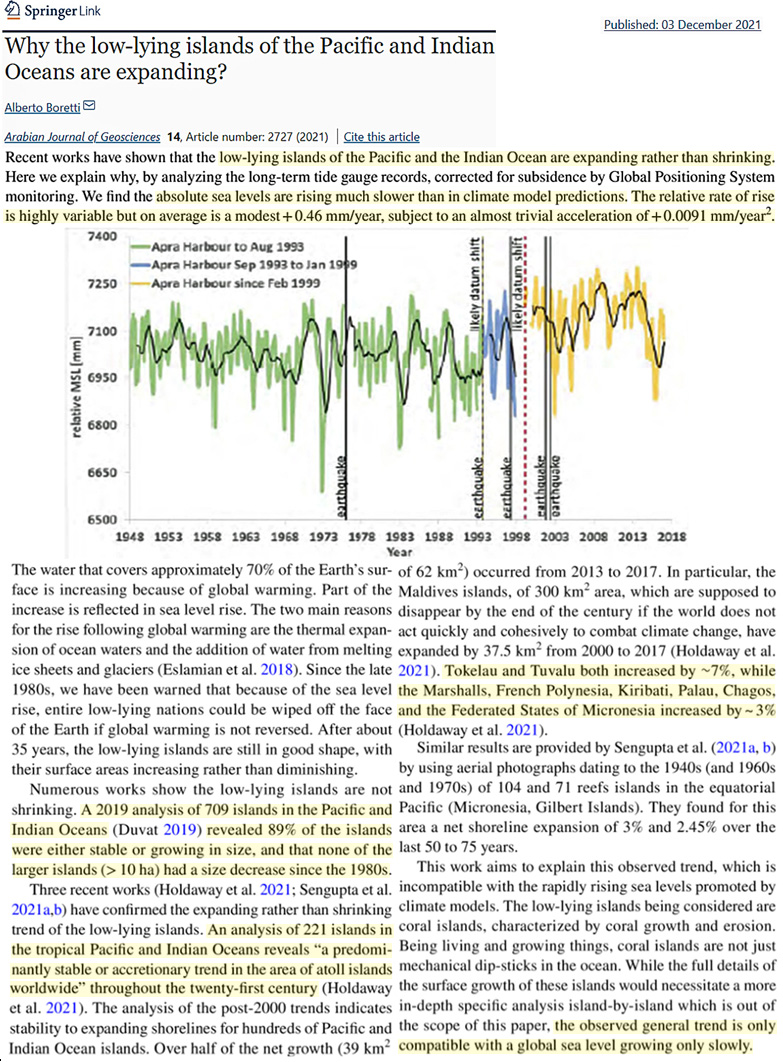
Recent works have shown that the low-lying islands of the Pacific and the Indian Ocean are expanding rather than shrinking. Here we explain why, by analyzing the long-term tide gauge records, corrected for subsidence by Global Positioning System monitoring. We find the absolute sea levels are rising much slower than in climate model predictions. The relative rate of rise is highly variable but on average is a modest + 0.46 mm/year, subject to an almost trivial acceleration of + 0.0091 mm/year².
Shoreline positions of 71 islands from 3 atolls and 4 mid-ocean reef platforms were analysed by comparing historical aerial photographs (from 1940s and 1960s) and recent satellite imagery covering a period of local sea-level rise rate of ~2.2 mm/year. Results show ~47% of the shorelines were characterised by statistically significant accretion leading to a net increase of 274.07 ha (2.45%) of planform land area.
Sea Levels Multiple Meters Higher When CO2 <280 ppm
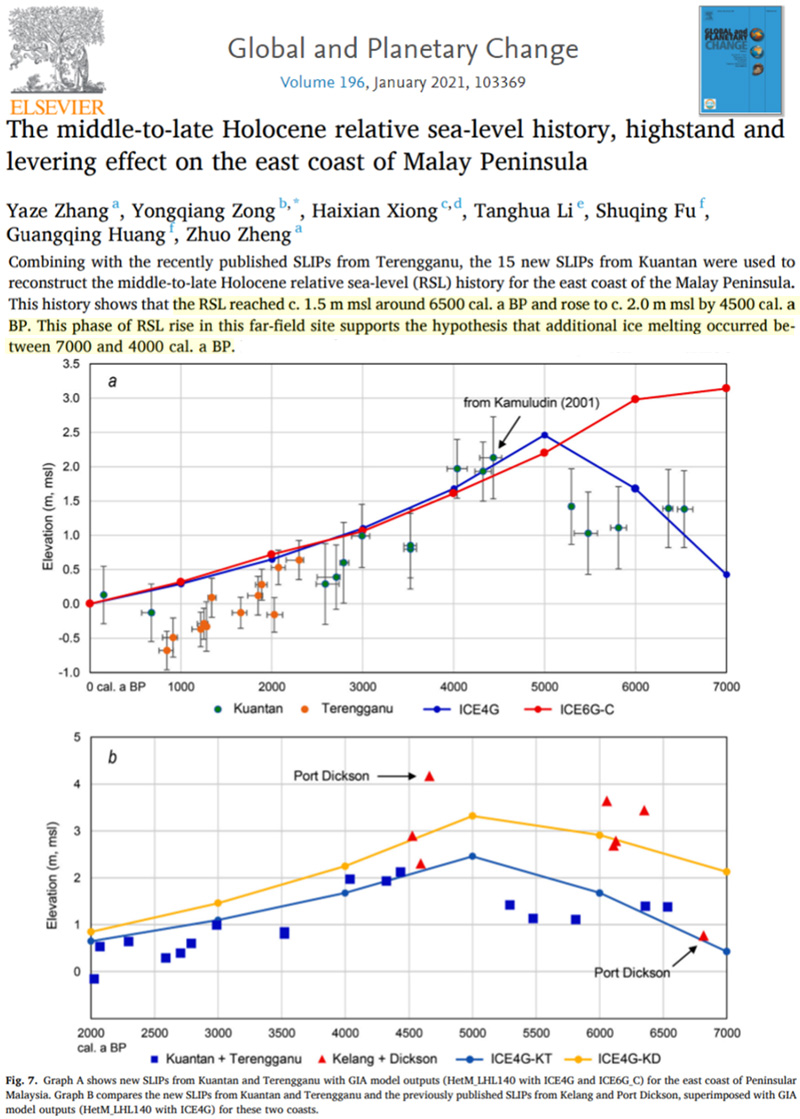
This history shows that the RSL reached c. 1.5 m msl around 6500 cal. a BP and rose to c. 2.0 m msl by 4500 cal. a BP. This phase of RSL rise in this far-field site supports the hypothesis that additional ice melting occurred between 7000 and 4000 cal. a BP.
This study illustrates the influences of sea-level on the depositional process during the last 1000 years of the southwestern delta, Bangladesh. … During the 850–1300 AD, RSL [relative sea level] was reached up to +80 cm higher than the present level where tidal-influenced bioturbated light yellow to gray mud deposited in the upper delta plain area. RSL was dropped up to −110 cm during 1300–1850 AD
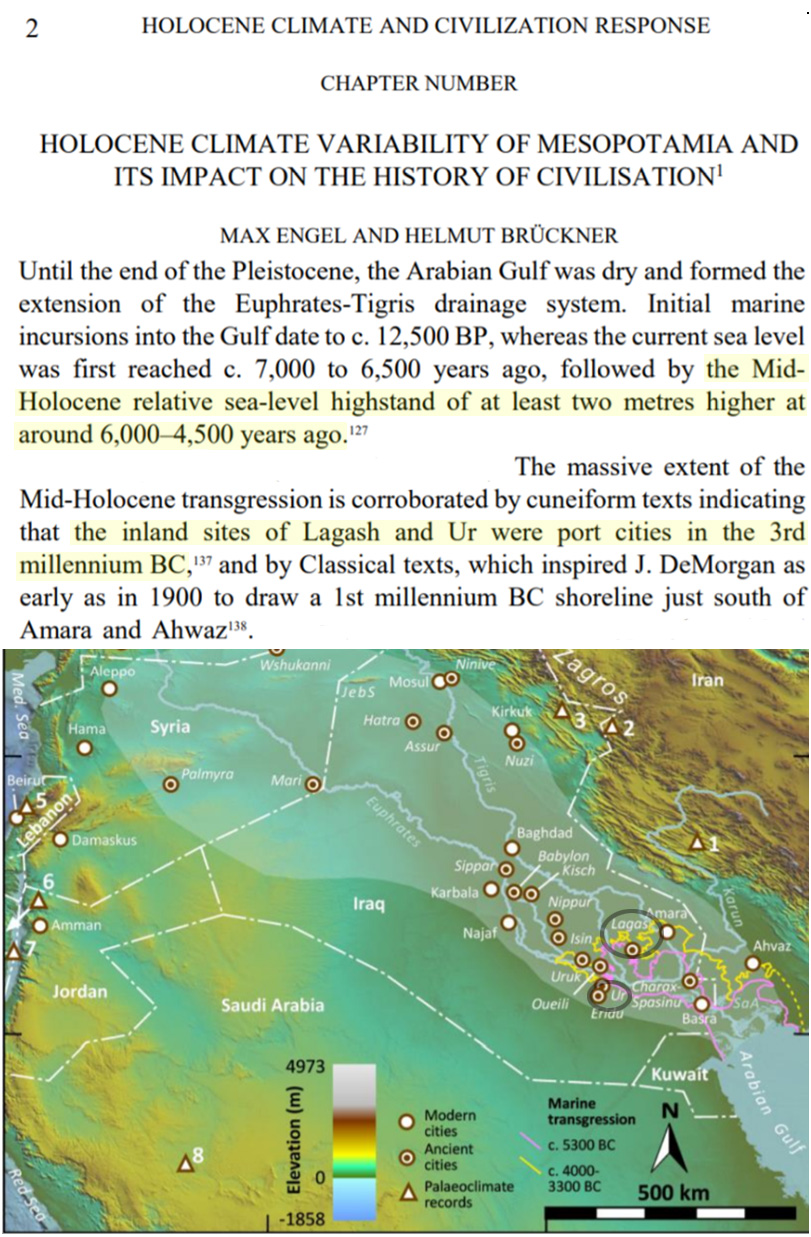
Until the end of the Pleistocene, the Arabian Gulf was dry and formed the extension of the Euphrates-Tigris drainage system. Initial marine incursions into the Gulf date to c. 12,500 BP, whereas the current sea level was first reached c. 7,000 to 6,500 years ago, followed by the Mid-Holocene relative sea-level highstand of at least two metres higher at around 6,000–4,500 years ago. … The massive extent of the Mid-Holocene transgression is corroborated by cuneiform texts indicating that the inland sites of Lagash and Ur were port cities in the 3rd millennium BC, and by Classical texts, which inspired J. DeMorgan as early as in 1900 to draw a 1st millennium BC shoreline just south of Amara and Ahwaz.
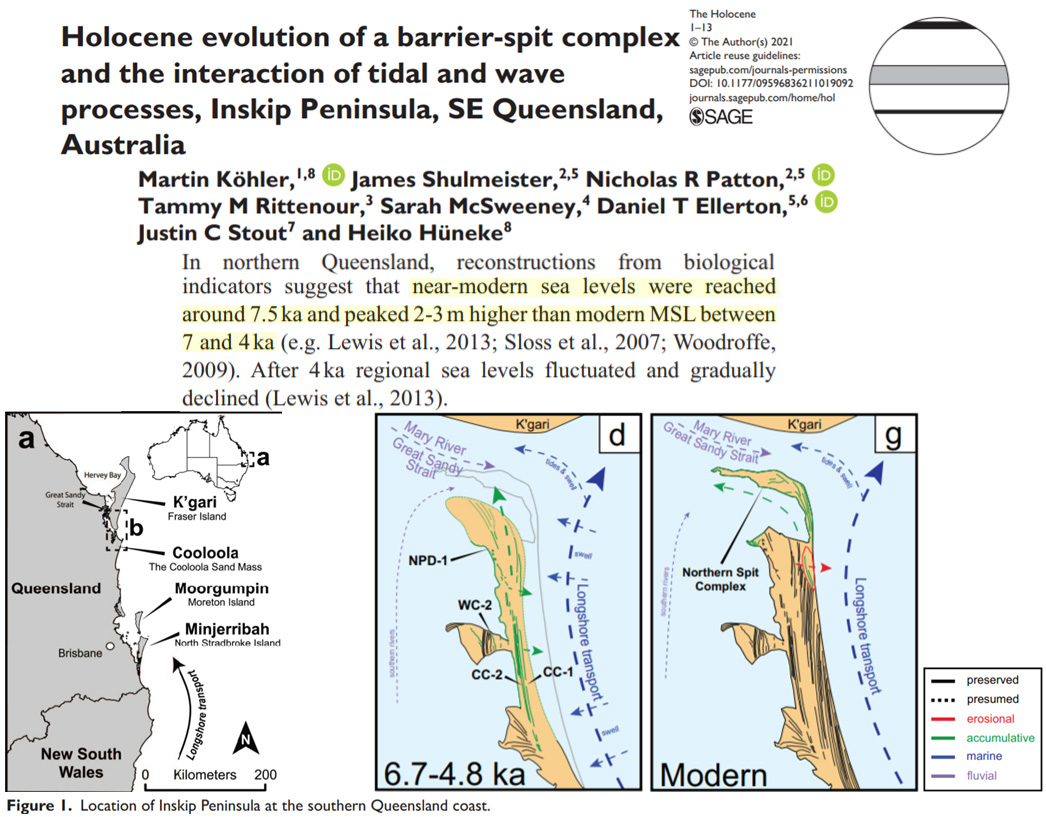
In northern Queensland, reconstructions from biological indicators suggest that near-modern sea levels were reached around 7.5ka and peaked 2-3m higher than modern MSL between 7 and 4 ka (e.g. Lewis et al., 2013; Sloss et al., 2007; Woodroffe, 2009). After 4 ka regional sea levels fluctuated and gradually declined (Lewis et al., 2013).
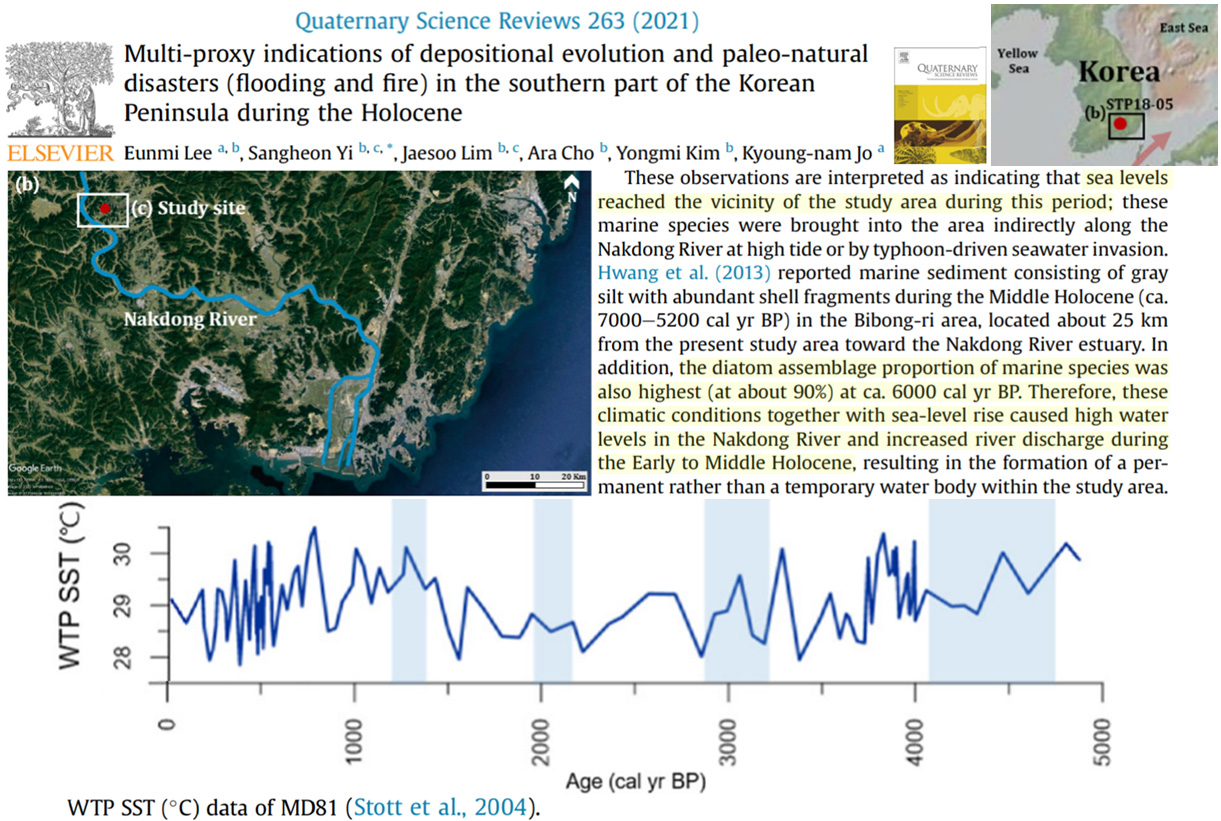
[S]ea levels reached the vicinity of the study area [today ~50 km inland] during this period. .. [T]he diatom assemblage proportion of marine species was also highest (at about 90%) at ca. 6000 cal yr BP.
Based on regional Holocene eustatic reconstructions (Lewis et al., 2013) and numerical modelling (Bryant, 1992), it is assumed for this study that the Holocene highstand was likely elevated between 1 and 2 m above present sea-level … The contemporary estuary, which occupies the two basins, corresponds to current sea-level and provides direct evidence of mid Holocene sea-levels being elevated at least 1.14 m above present.
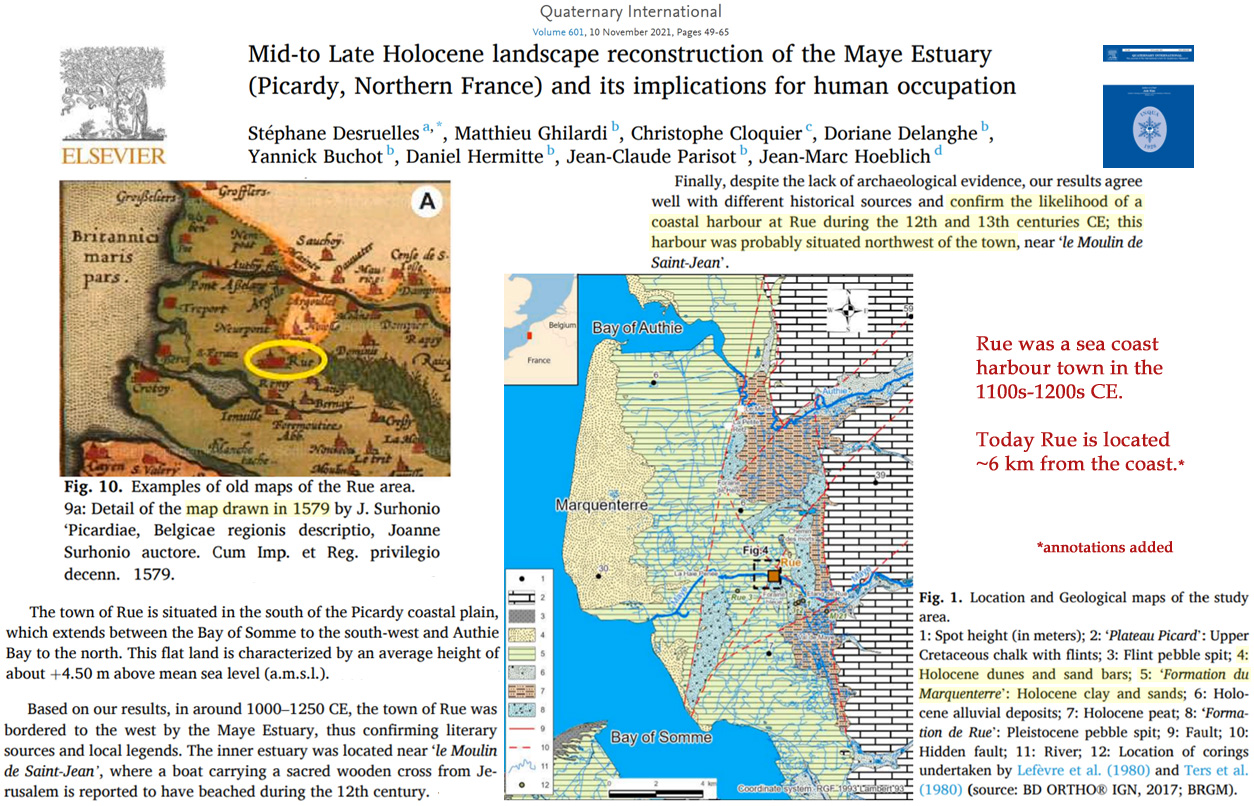
…confirm the likelihood of a coastal harbour at Rue during the 12th and 13th centuries CE
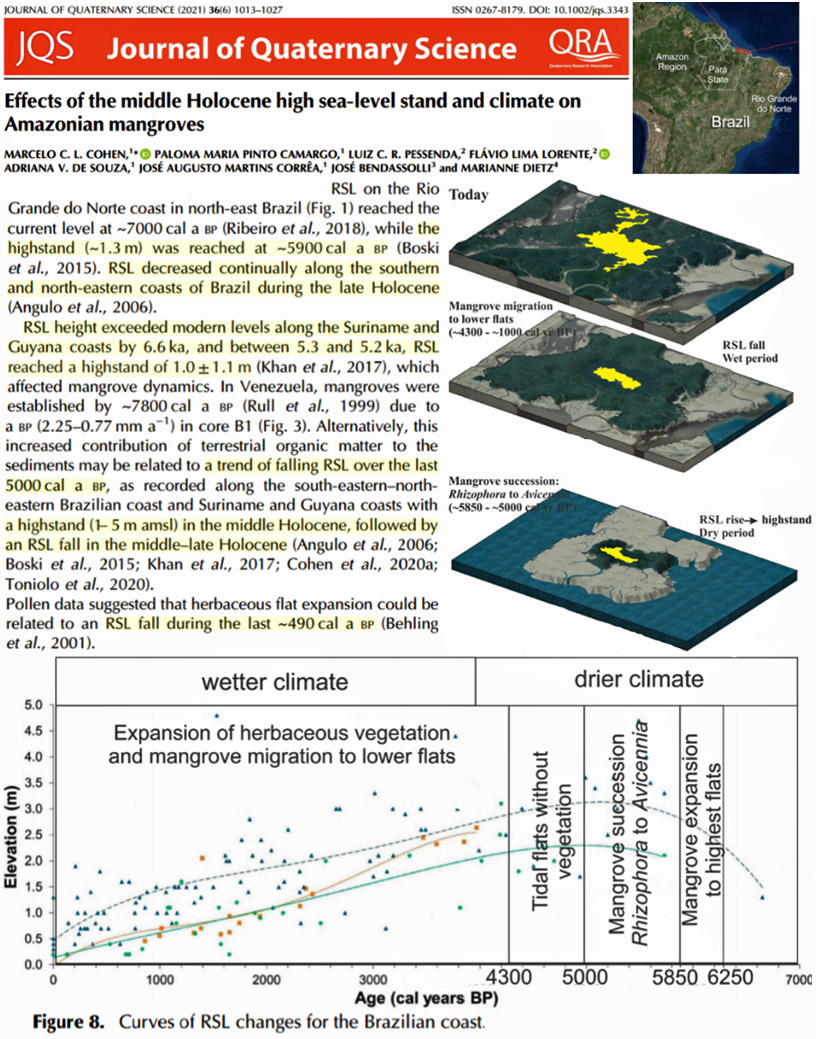
RSL on the Rio Grande do Norte coast in north‐east Brazil reached the current level at ~7000 cal a BP (Ribeiro et al., 2018), while the highstand (~1.3 m) was reached at ~5900 cal a BP (Boski et al., 2015). RSL decreased continually along the southern and north‐eastern coasts of Brazil during the late Holocene (Angulo et al., 2006). RSL height exceeded modern levels along the Suriname and Guyana coasts by 6.6 ka, and between 5.3 and 5.2 ka, RSL reached a highstand of 1.0 ± 1.1 m (Khan et al., 2017), which affected mangrove dynamics.
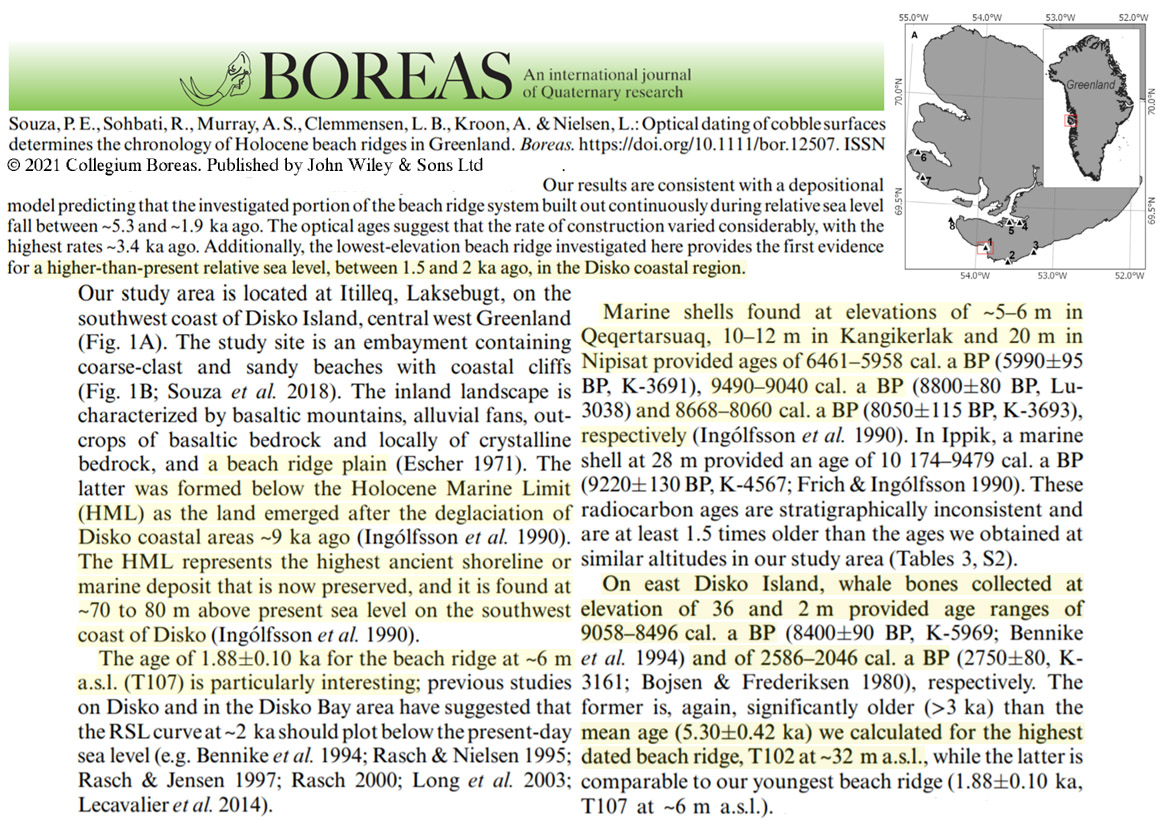
[H]igher-than-present relative sea level, between 1.5 and 2 ka ago, in the Disko coastal region. … The age of 1.88±0.10 ka for the beach ridge at ~6 m a.s.l. (T107) is particularly interesting; previous studies on Disko Bay area have suggested that the RSL curve at ~2 ka should plot below the present-day sea level … On east Disko Island, whale bones collected at elevation of 36 and 2 m provided age ranges of 9058-8496 cal. a BP…and of 2586-2046 cal. a BP, respectively.
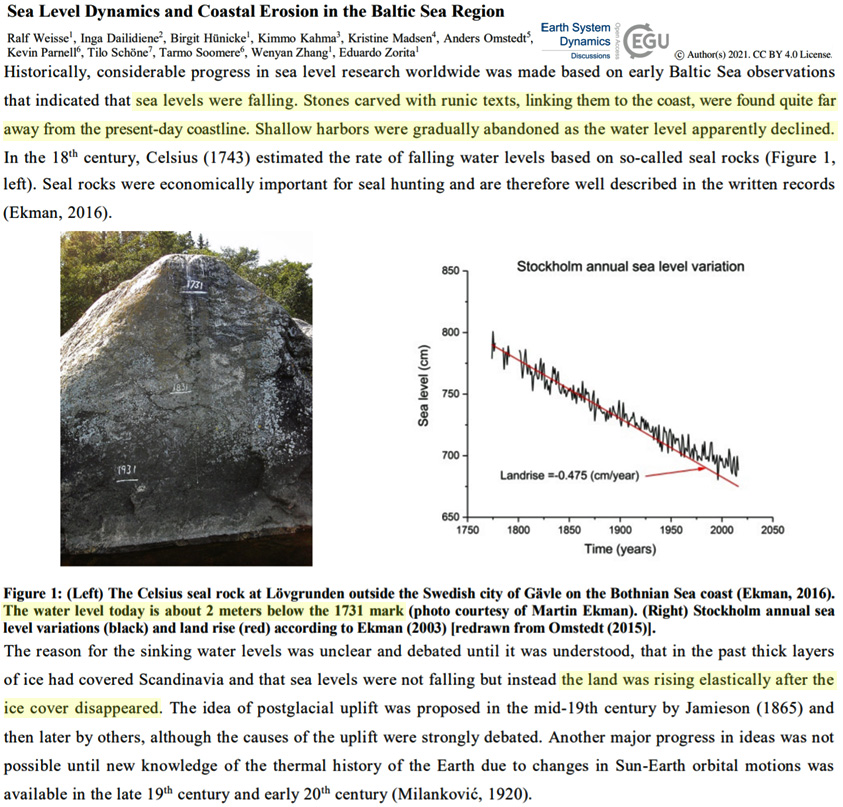
The water level today is about 2 meters below the 1731 mark
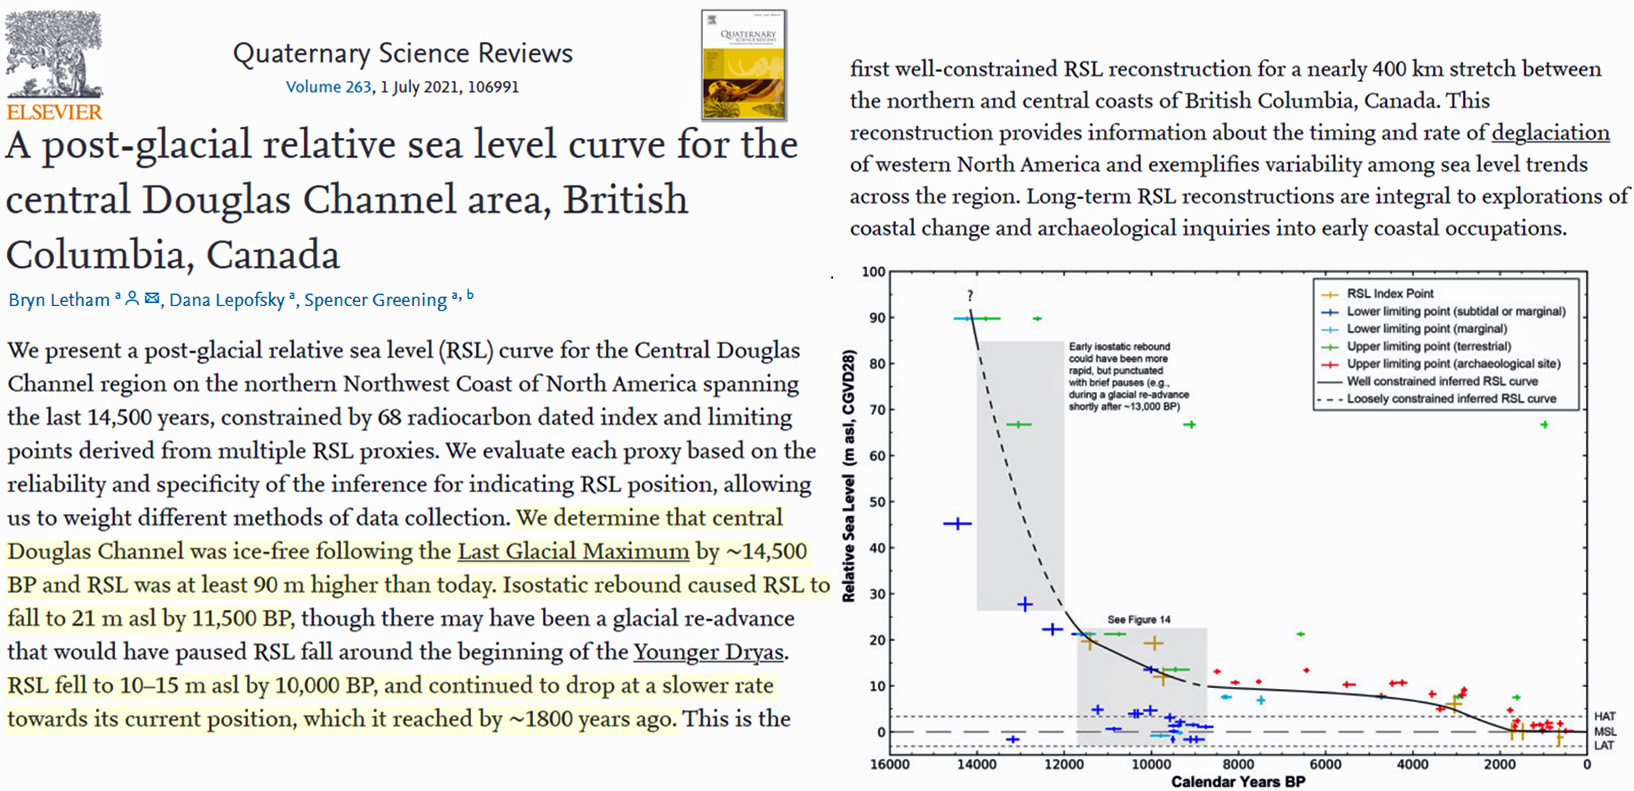
We determine that central Douglas Channel was ice-free following the Last Glacial Maximum by ∼14,500 BP and RSL was at least 90 m higher than today. Isostatic rebound caused RSL to fall to 21 m asl by 11,500 BP, though there may have been a glacial re-advance that would have paused RSL fall around the beginning of the Younger Dryas. RSL fell to 10–15 m asl by 10,000 BP, and continued to drop at a slower rate towards its current position, which it reached by ∼1800 years ago.
Beachrock is considered a good archive for past sea-levels because of its unique formation position (intertidal zone). To evaluate sea-level history in the northern South China Sea, three well-preserved beachrock outcrops (Beigang, Gongshanbei, and Hengling) at Weizhou Island, northern South China Sea were selected to examine their relative elevation, sedimentological, mineralogical, and geochemical characteristics. Acropora branches with well-preserved surface micro-structures were selected from the beachrocks and used to determine the ages of these beachrocks via U-series dating. The results show that the beachrocks are composed of coral reef sediments, terrigenous clastics, volcanic clastics, and various calcite cements. These sediments accumulated in the intertidal zone of Weizhou Island were then cemented in a meteoric water environment. The U-series ages of beachrocks from Beigang, Gongshanbei, and Hengling are 1712–768 ca. BP, 1766–1070 ca. BP, and 1493–604 ca. BP (before 1950 AD) respectively. Their elevations are 0.91–1.16 m, 0.95–1.24 m, and 0.82–1.17 m higher than the modern homologous sedimentary zones, respectively. Therefore, we concluded that the sea-level in the Meghalayan age (1766–604 ca. BP) was 0.82–1.24 m higher than the present, and that the sea-level over this period showed a declining trend.
[T]he relative sea level near Chenhang Island rose rapidly between 7800 and 6000 yr BP, slowed at ~6000 yr BP, and reached a position of about 2 m above the present-day mean sea level by 3900 yr BP. After 3900 yr BP, the sea level was stable or fell, resulting in a cessation in the reef’s upward development.
The median group age for the rising relative sea level (RSL) that killed the trees was 8602 ± 243 bp cal a bp with an estimated Mean Tide Level (MTL) of ~≤−9 m. Evidence indicates that RSL rose ~10 m along this section of coast at a rate of between of between 18.5 and 8.7 mm a–1 until ~6800 cal a bp, or earlier, before the rate of global sea level rise fell below that of the local glacial isostatic recovery.
Coastal Bangladesh is commonly regarded as being highly vulnerable to SLR; however, addressing SLR impacts on erosion and accretion and net land loss and gain is complicated by the complex diversity of the region’s coastal physical geography (Brammer 2014). Given the 1988 to 2018 timescale of this research, SLR [sea level rise] likely has had negligible impacts on shoreline change for our study region;
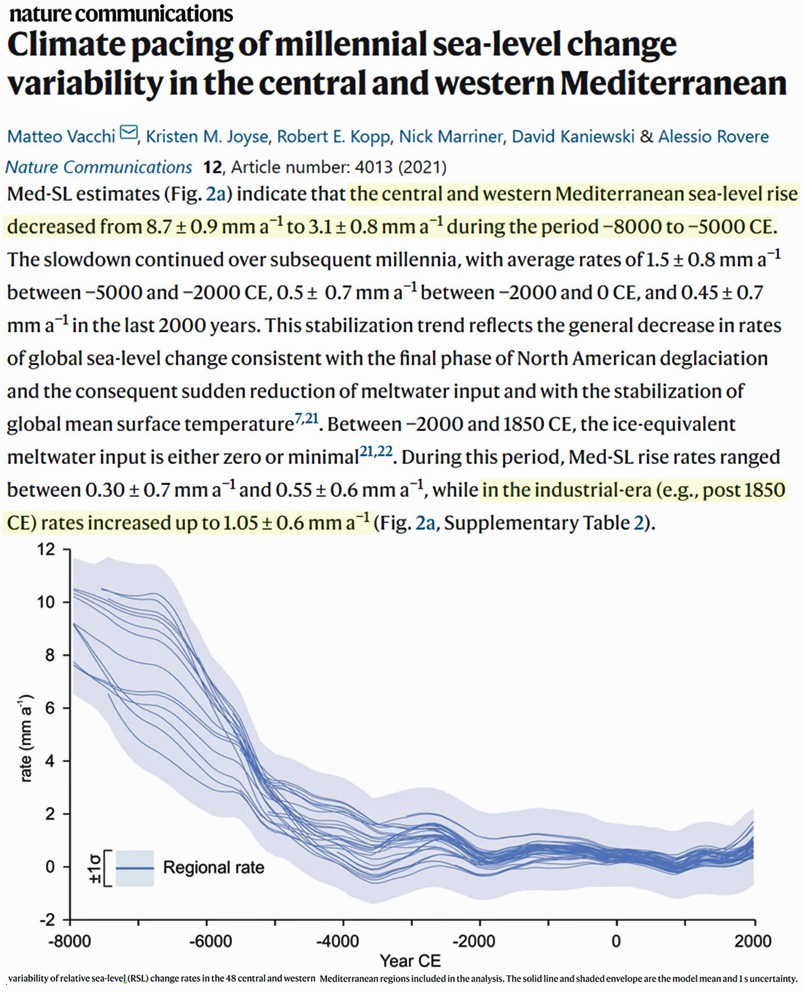
Med-SL estimates (Fig. 2a) indicate that the central and western Mediterranean sea-level rise decreased from 8.7 ± 0.9 mm a−1 to 3.1 ± 0.8 mm a−1 during the period −8000 to −5000 CE. The slowdown continued over subsequent millennia, with average rates of 1.5 ± 0.8 mm a−1 between −5000 and −2000 CE, 0.5 ± 0.7 mm a−1 between −2000 and 0 CE, and 0.45 ± 0.7 mm a−1 in the last 2000 years. This stabilization trend reflects the general decrease in rates of global sea-level change consistent with the final phase of North American deglaciation and the consequent sudden reduction of meltwater input and with the stabilization of global mean surface temperature. Between −2000 and 1850 CE, the ice-equivalent meltwater input is either zero or minimal. During this period, Med-SL rise rates ranged between 0.30 ± 0.7 mm a−1 and 0.55 ± 0.6 mm a−1, while in the industrial-era (e.g., post 1850 CE) rates increased up to 1.05 ± 0.6 mm a−1
The mid-Holocene (ca. 8200–4200 cal BP) brought about important climatic changes and environmental shifts to land and coastal systems, globally. Many of the human groups existing at that time were affected in various degrees by such important modifications to their foraging areas, including shorelines. Higher sea-levels (+1–3 m) were a prominent factor reshaping coastal landscapes and thus affecting coastal foraging in one or more ways.
[A] Holocene sea-level high-stand has been reported from the Persian Gulf to have occurred at about 6.0 ka, when sea-level was about 1–2 m above the PSL [present sea level](Felber et al., 1978; Lambeck, 1996; Uchupi et al., 1996). Recently, Lokier et al. (2015) suggested that the sea-level of the Persian Gulf was up to 1 m higher than present level already at 7.1–6.9 ka. This was followed by sea-level fall after 4.6 ka, with sea-level reaching approximately PSL between 1, 400 and 1, 200 years ago. … For summarizing Phase III, sedimentological and geochemical analyses of core Qh-B and Bu-A combined with our seismic records show a rapid sea-level rising since 7.1 ka (Fig. 12), resulting in a high-stand around 6 ka, which is the highest sea-level recorded during the past 10, 000 years (Fig. 12). … A possible impact of tectonic processes on holocene sea-level fluctuations in the Gulf has indeed been proposed by Wood et al. (2012). In contrast, a few years later another study concluded, however, that the impact of tectonic movements has been negligible, with the implication that eustatic sea level variations have been the primary control of sea level fluctuations in the Gulf (Stevens et al., 2014). … [T]he relative sea-level changes observed in the Persian Gulf are concluded to have been primarily controlled by eustatic changes rather than by local tectonic processes. … Both on the South African and Indian margin of the Indian Ocean Holocene sea-level records demonstrate a well-defined mid-Holocene sea-level highstand reaching a maximum of +3.5 m along the South African coast (Ramsay 1995) and spatially varying between +3 m and +5 m on the Indian margin (Yokoyama et al., 2019; Mann et al., 2019). … In summary, sea-level fluctuations found in our study thus appear to reflect sea-level changes of global character as reported from the Strait of Hormuz area by Regard et al. (2006), Southeast Asia (Stattegger et al., 2013; Horton et al., 2005; Xiong et al., 2018) and the Indian Ocean (Ramsay 1995; Ranasinghe et al., 2013; Yokoyama et al., 2019; Mann et al., 2019).
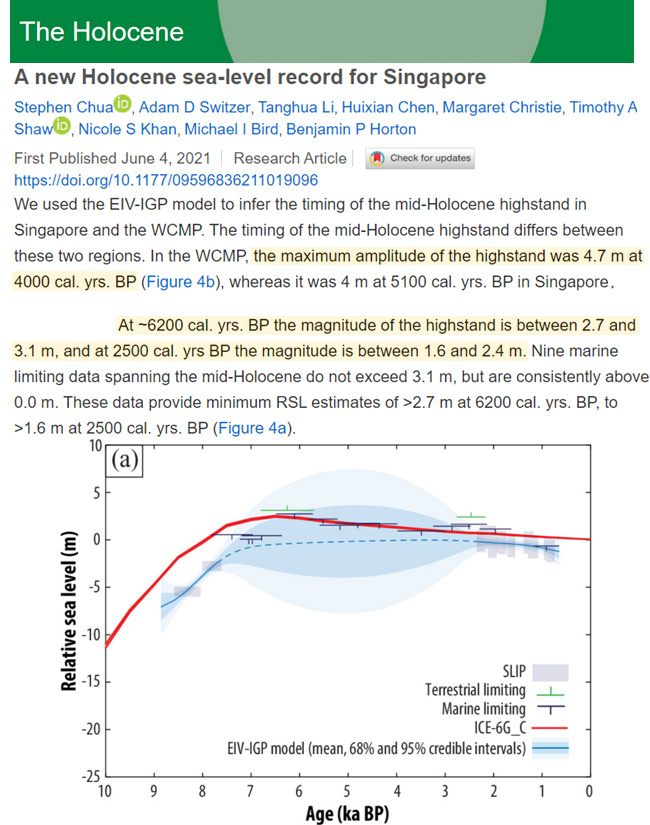
At ~6200 cal. yrs. BP the magnitude of the highstand is between 2.7 and 3.1 m, and at 2500 cal. yrs BP the magnitude is between 1.6 and 2.4 m. Nine marine limiting data spanning the mid-Holocene do not exceed 3.1 m, but are consistently above 0.0 m. These data provide minimum RSL estimates of >2.7 m at 6200 cal. yrs. BP, to >1.6 m at 2500 cal. yrs. BP (Figure 4a). … We used the EIV-IGP model to infer the timing of the mid-Holocene highstand in Singapore and the WCMP. The timing of the mid-Holocene highstand differs between these two regions. In the WCMP, the maximum amplitude of the highstand was 4.7 m at 4000 cal. yrs. BP (Figure 4b), whereas it was 4 m at 5100 cal. yrs. BP in Singapore (Figure 4c). … Limited evidence of RSL falling below present-day levels during the late-Holocene in far-field regions has been found in northern Brazil (Cohen et al., 2005) and the Maldives (Kench et al., 2019). Kench et al (2019) obtained records showing that sea-level lowstands of up to −1.4 m MSL in the Indian Ocean are coincident with cooler periods during the Late Antiquity Little Ice Age (~1500 to 1300 cal. yrs. BP) and the Little Ice Age (~700 to 100 cal. yrs. BP), but these sea-level variations are too large to be caused by climate-driven thermal contraction/expansion of seawater during the pre-industrial Common Era (Piecuch et al., 2021). The ICE-6G_C GIA model predict a near-linear RSL fall during the late-Holocene without going below 0 m because the model assumes 0 m of sea-level equivalent from the Antarctic ice sheet from 4000 cal. yrs. BP to present (Peltier et al., 2015).
We demonstrate the utility of wave-cut notches in the southern Red Sea, and present U-series dated sea-level indicators from two locations on the As-Salif Peninsula that suggest a mid-Holocene highstand of ∼0.5–1 m above present mean sea level (apmsl) at about 5–5.4 ka BP.
Glaciers, Ice Sheets, Sea Ice
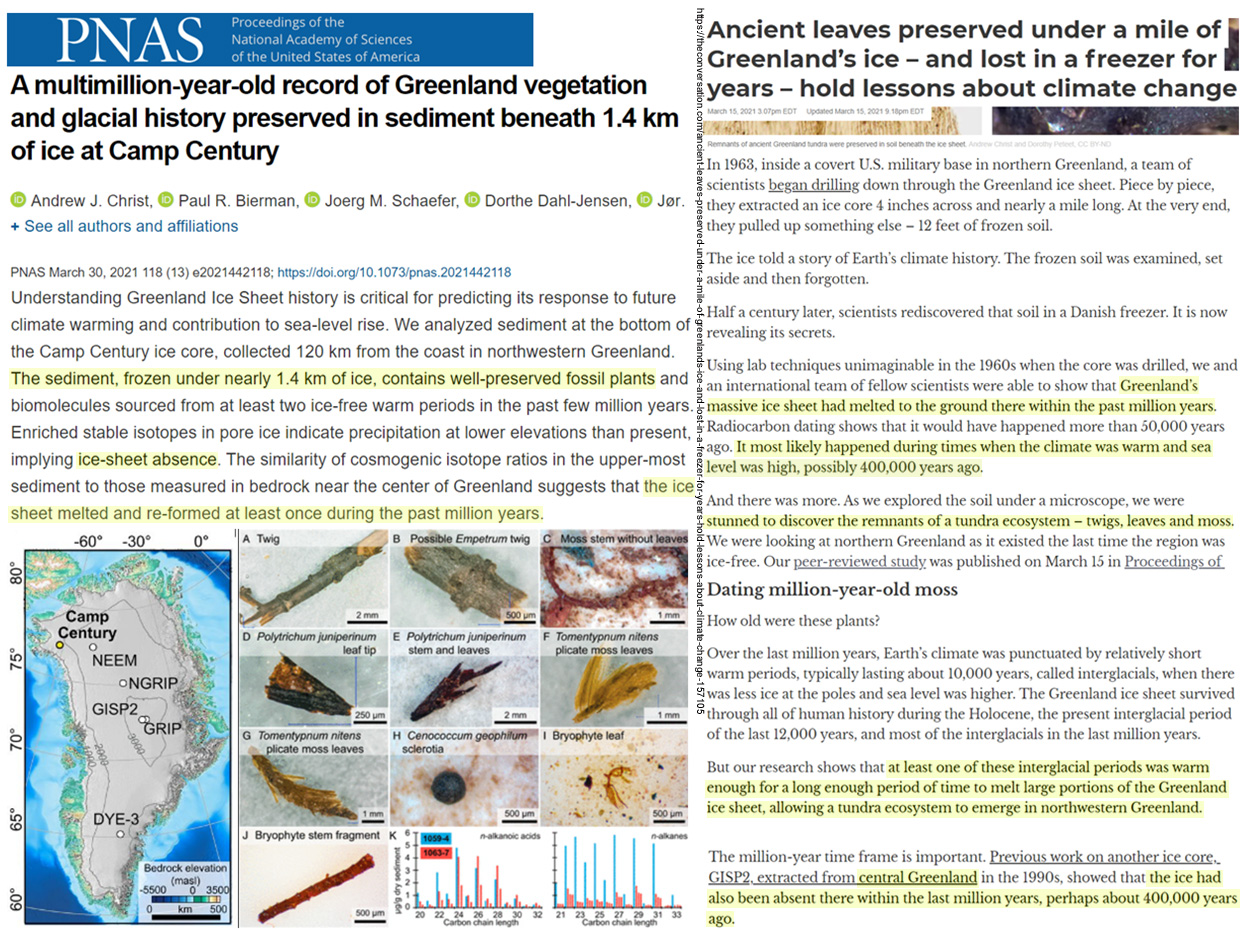
We analyzed sediment at the bottom of the Camp Century ice core, collected 120 km from the coast in northwestern Greenland. The sediment, frozen under nearly 1.4 km of ice, contains well-preserved fossil plants and biomolecules sourced from at least two ice-free warm periods in the past few million years. Enriched stable isotopes in pore ice indicate precipitation at lower elevations than present, implying ice-sheet absence.
(press release) Greenland’s massive ice sheet had melted to the ground there within the past million years. Radiocarbon dating shows that it would have happened more than 50,000 years ago. It most likely happened during times when the climate was warm and sea level was high, possibly 400,000 years ago.
Our observations underscore that sub-ice circulation is controlled by features in the bathymetry and ice as well as conditions at the relevant source. Since the previously unknown source water coming from Pine Island Bay is influenced by local meteorological conditions (11) and Pine Island Glacier (27) melting, these results indicate that the future melt rate of Thwaites and ice dynamic feedbacks may depend more on local conditions in the Pine Island region, as well as the evolving ice pinning points at Thwaites (28, 29), than predicted by existing models (19, 20).
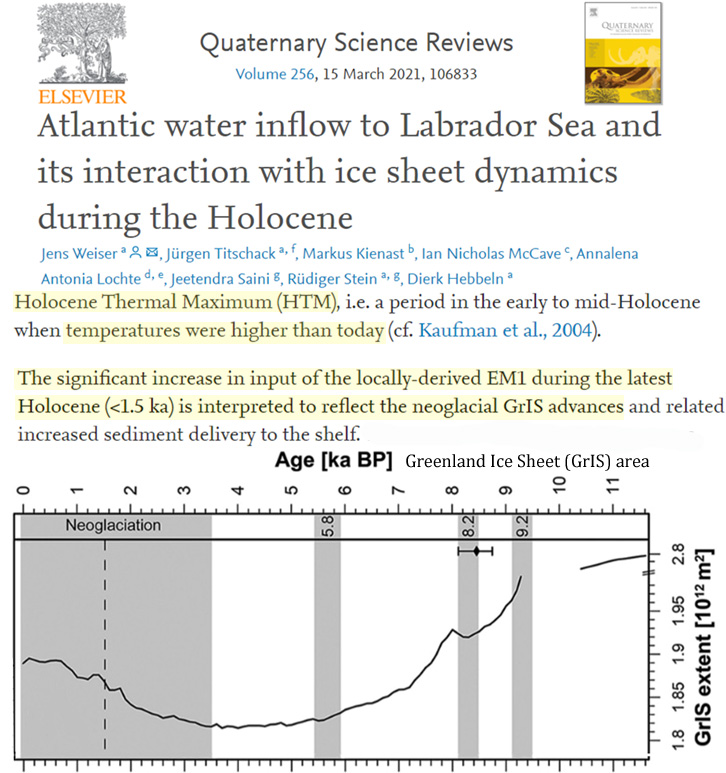
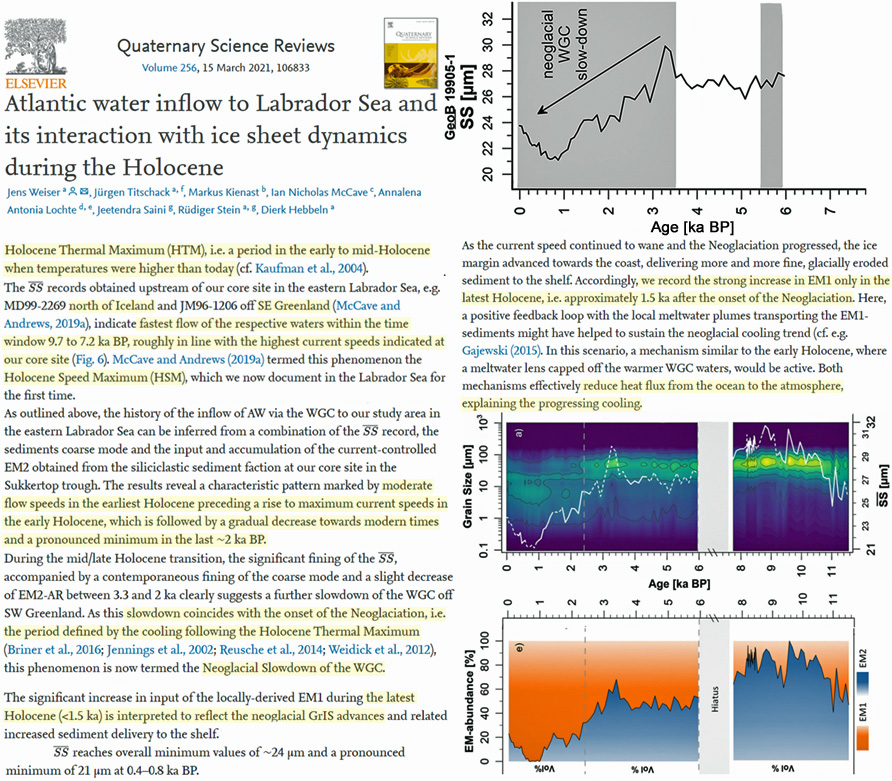
Holocene Thermal Maximum (HTM), i.e. a period in the early to mid-Holocene when temperatures were higher than today (cf. Kaufman et al., 2004). … [M]oderate [meltwater] flow speeds in the earliest Holocene preceding a rise to maximum current speeds the early Holocene, which is followed by a gradual decrease towards modern times and a pronounced minimum during the last ~2 ka BP.
Maffezzoli et al., 2021 (full paper)
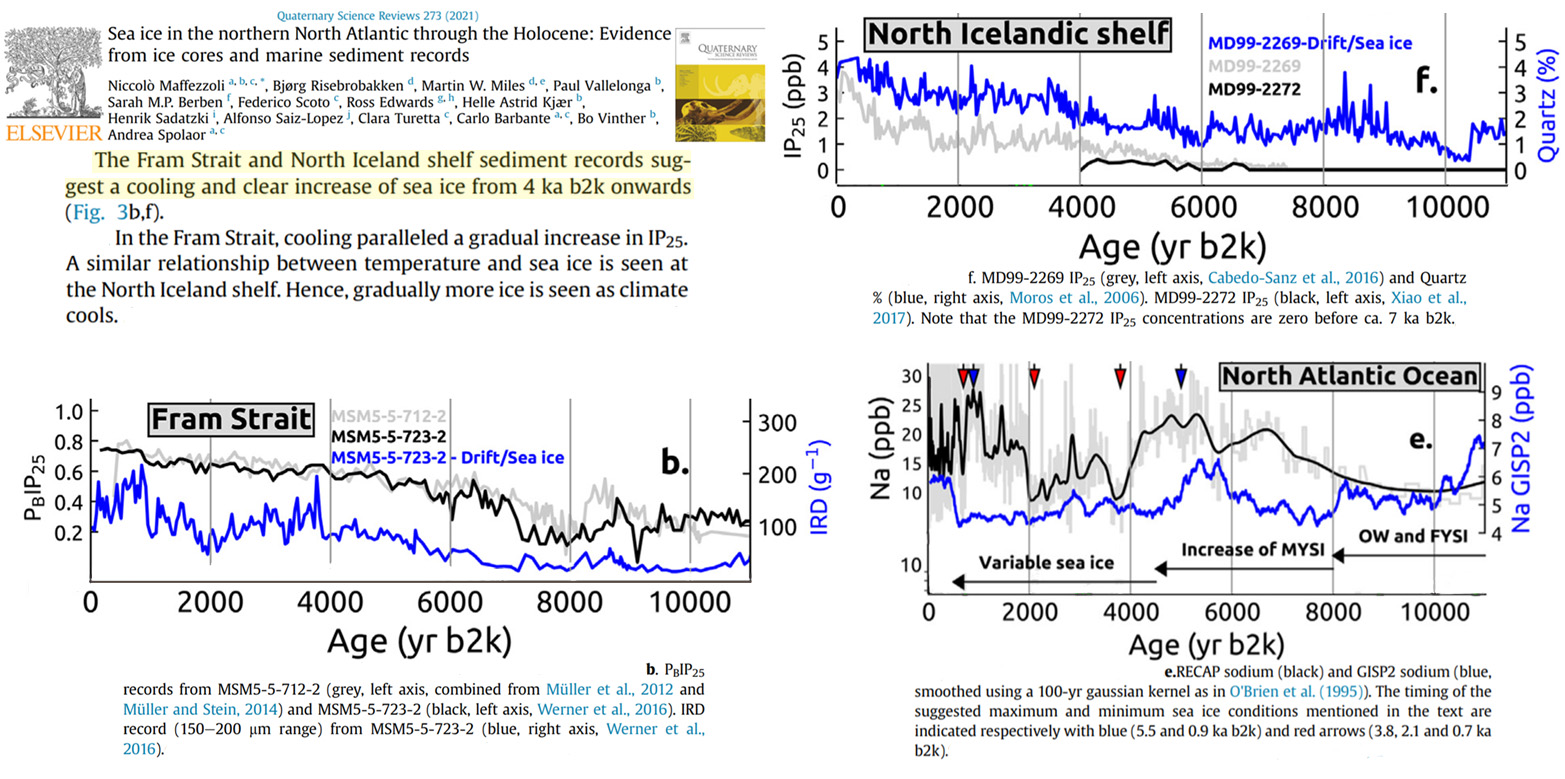
The Fram Strait and North Iceland shelf sediment records suggest a cooling and clear increase of sea ice fro 4 ka b2k onwards … [G]radually more ice is seen as climate cools. … [W]e find that sea ice was at its lowest extent and seasonal in nature during the early Holocene in all regions of the North Atlantic. Increasing sea ice signals are seen from ca. 8–9 ka b2k, in line with long-term Holocene cooling.
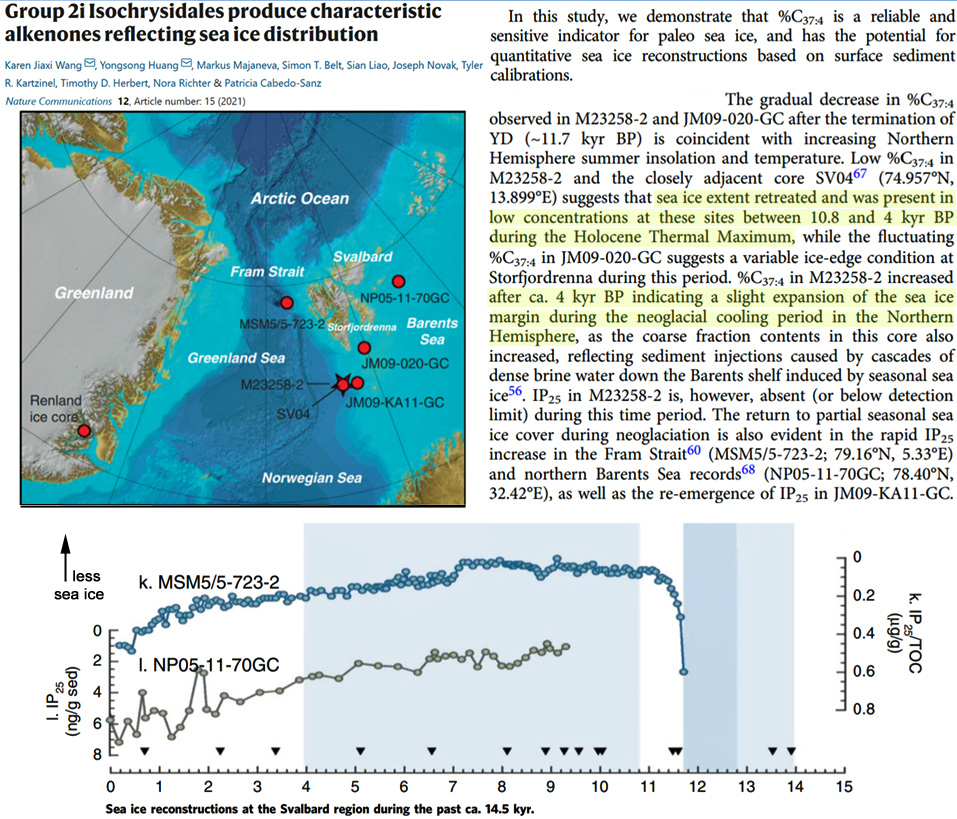
The gradual decrease in %C37:4 observed in M23258-2 and JM09-020-GC after the termination of YD (~11.7 kyr BP) is coincident with increasing Northern Hemisphere summer insolation and temperature. Low %C37:4 in M23258-2 and the closely adjacent core SV0467 (74.957°N, 13.899°E) suggests that sea ice extent retreated and was present in low concentrations at these sites between 10.8 and 4 kyr BP during the Holocene Thermal Maximum
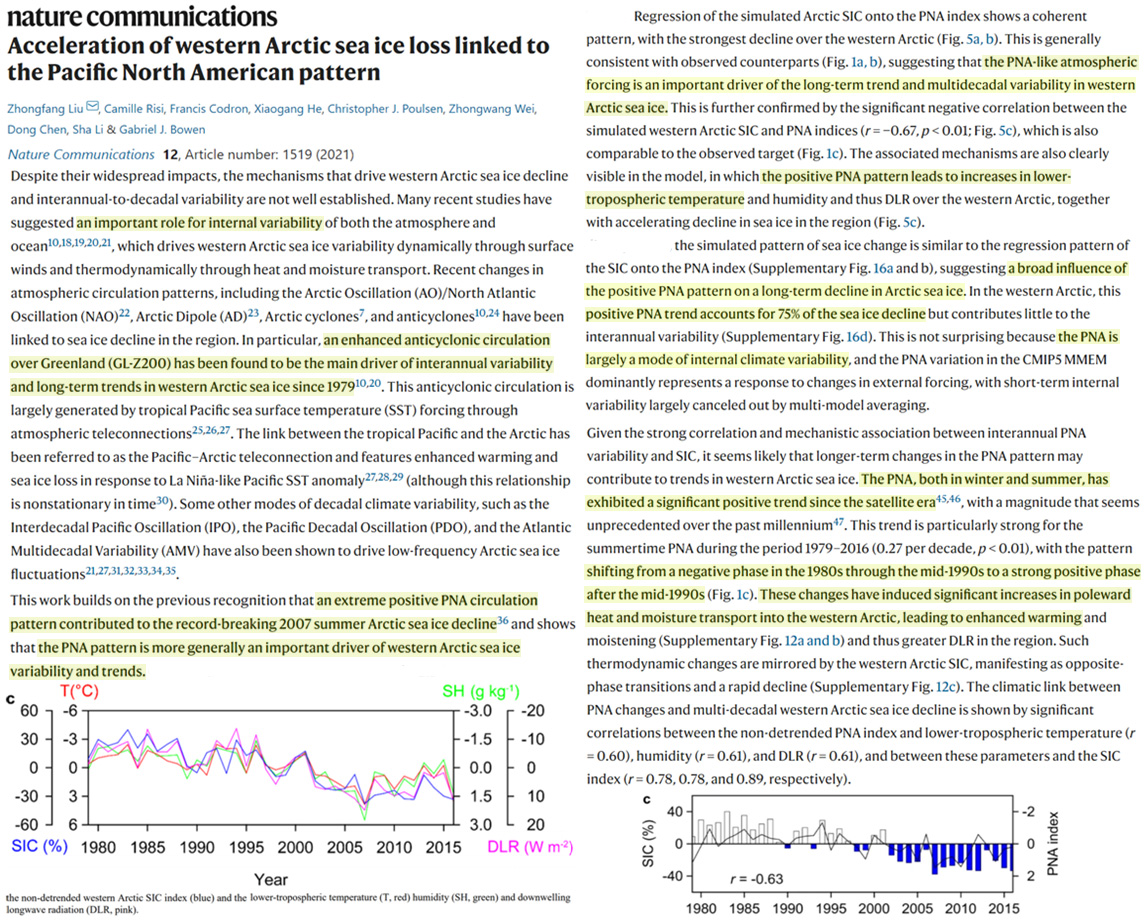
Despite their widespread impacts, the mechanisms that drive western Arctic sea ice decline and interannual-to-decadal variability are not well established. Many recent studies have suggested an important role for internal variability of both the atmosphere and ocean, which drives western Arctic sea ice variability dynamically through surface winds and thermodynamically through heat and moisture transport. Recent changes in atmospheric circulation patterns, including the Arctic Oscillation (AO)/North Atlantic Oscillation (NAO), Arctic Dipole (AD), Arctic cyclones, and anticyclones have been linked to sea ice decline in the region. In particular, an enhanced anticyclonic circulation over Greenland (GL-Z200) has been found to be the main driver of interannual variability and long-term trends in western Arctic sea ice since 1979. … The PNA, both in winter and summer, has exhibited a significant positive trend since the satellite era, with a magnitude that seems unprecedented over the past millennium. This trend is particularly strong for the summertime PNA during the period 1979–2016 (0.27 per decade, p < 0.01), with the pattern shifting from a negative phase in the 1980s through the mid-1990s to a strong positive phase after the mid-1990s (Fig. 1c). These changes have induced significant increases in poleward heat and moisture transport into the western Arctic, leading to enhanced warming and moistening (Supplementary Fig. 12a and b) and thus greater DLR in the region. Such thermodynamic changes are mirrored by the western Arctic SIC, manifesting as opposite-phase transitions and a rapid decline (Supplementary Fig. 12c). The climatic link between PNA changes and multi-decadal western Arctic sea ice decline is shown by significant correlations between the non-detrended PNA index and lower-tropospheric temperature (r = 0.60), humidity (r = 0.61), and DLR (r = 0.61), and between these parameters and the SIC index (r = 0.78, 0.78, and 0.89, respectively). … [T]he simulated pattern of sea ice change is similar to the regression pattern of the SIC onto the PNA index (Supplementary Fig. 16a and b), suggesting a broad influence of the positive PNA pattern on a long-term decline in Arctic sea ice. In the western Arctic, this positive PNA trend accounts for 75% of the sea ice decline but contributes little to the interannual variability (Supplementary Fig. 16d). This is not surprising because the PNA is largely a mode of internal climate variability, and the PNA variation in the CMIP5 MMEM dominantly represents a response to changes in external forcing, with short-term internal variability largely canceled out by multi-model averaging. … This work builds on the previous recognition that an extreme positive PNA circulation pattern contributed to the record-breaking 2007 summer Arctic sea ice decline and shows that the PNA pattern is more generally an important driver of western Arctic sea ice variability and trends. Our results from both observations and simulations suggest that recent intensification of the positive PNA pattern has contributed to the accelerated decline of western Arctic sea ice through enhanced poleward heat and moisture transport and thus increased DLR in the region.
Our observations show that the glacier snout has been progressively advancing in recent four decades, with a stepwise increase of advance velocity from 4.25±0.28 m·a¯1 between 1975 and 2009 to 32.53±4.45 m·a¯1 between 2015 and 2019.
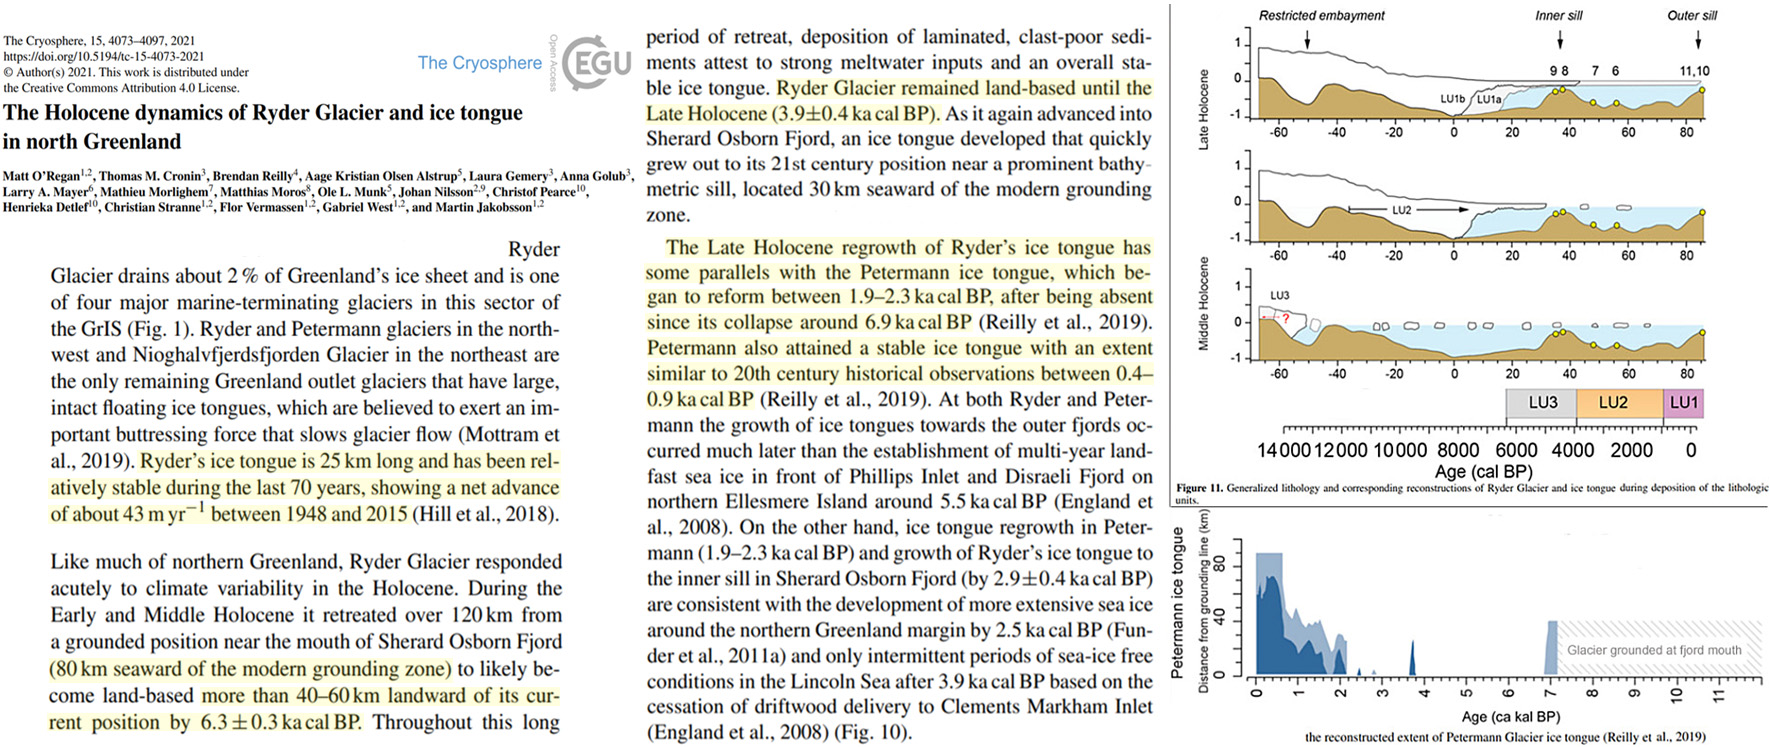
Ryder’s ice tongue is 25km long and has been relatively stable during the last 70 years, showing a net advance of about 43 m yr ¯1 between 1948 and 2015 (Hill et al., 2018). During the Early and Middle Holocene it retreated over 120k from a grounded position near the mouth of Sherard Osborn Fjord (80 km seaward ow the modern grounding zone) to likely become land-based more than 40-60 km landward of its current position by 6.3 ±0.3 ka cal BP.
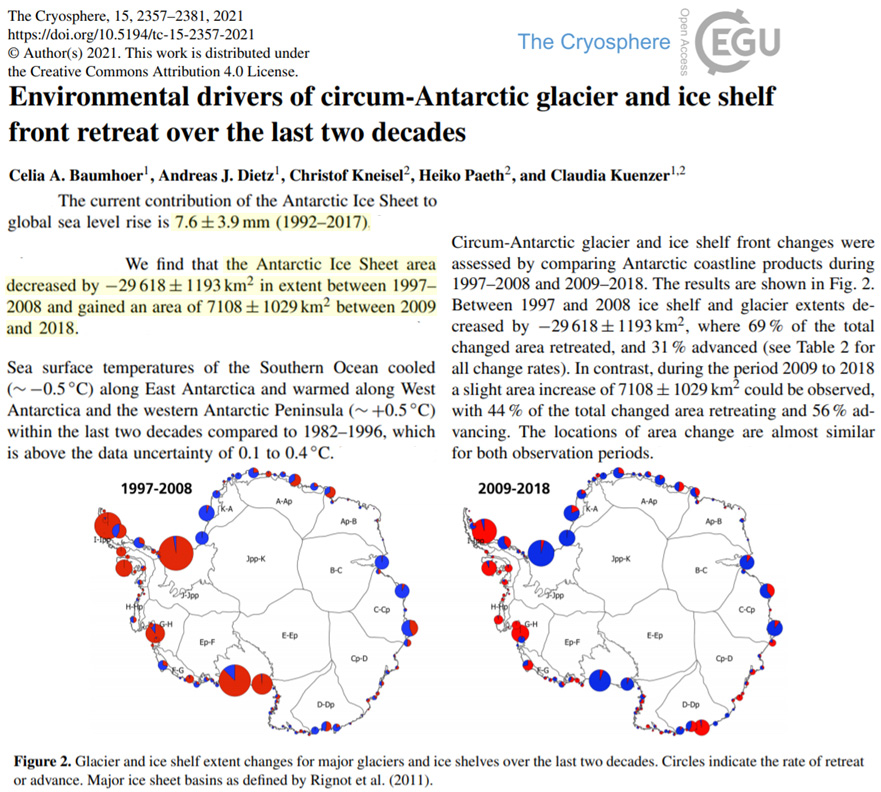
The current contribution of the Antarctic Ice Sheet to global sea level rise is 7.6 ± 3.9 mm (1992–2017) [0.3 mm/yr, 3 cm/century] … Glacier terminus positions along the EAIS experienced a phase of retreat between 1974 and 1990 followed by a phase of advance until 2012. The single exception to this advance in East Antarctica is Wilkes Land, where retreating glacier fronts were observed (Miles et al., 2016).We find that the Antarctic Ice Sheet area decreased by −29 618 ± 1193 km² in extent between 1997– 2008 and gained an area of 7108 ± 1029 km² between 2009 and 2018.
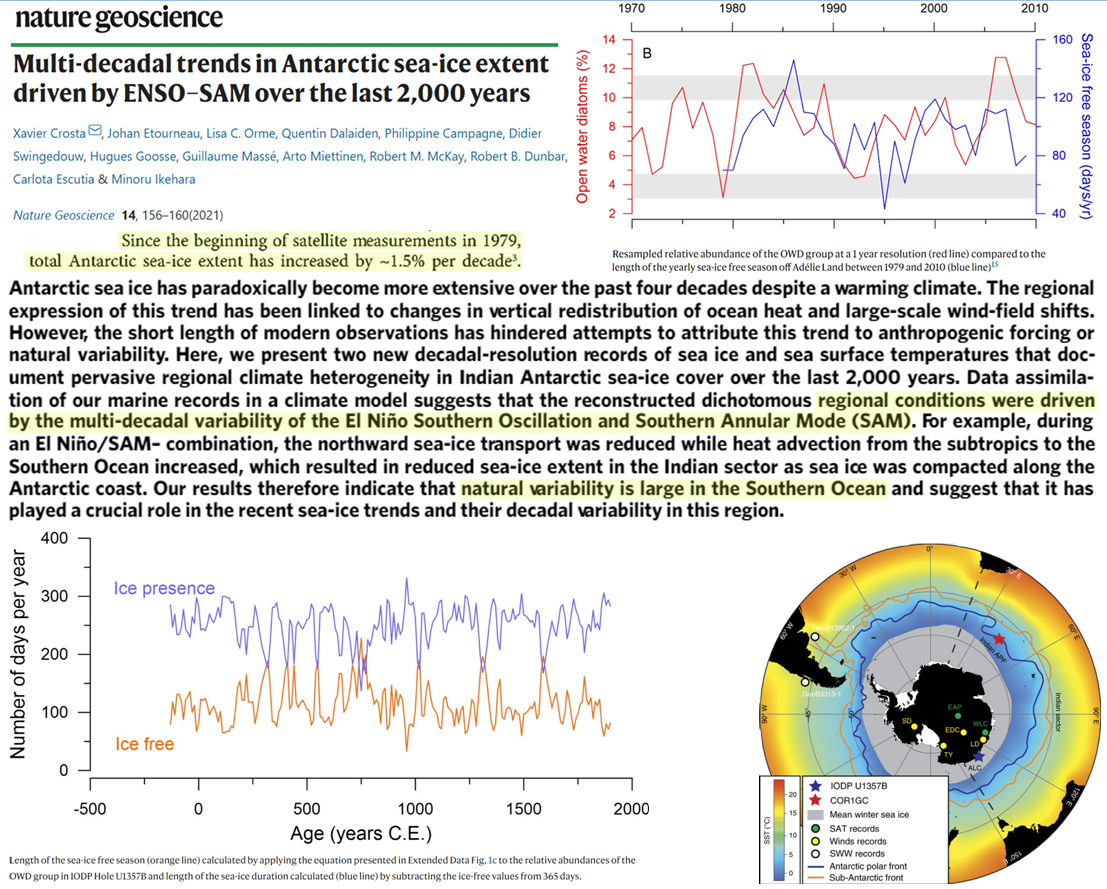
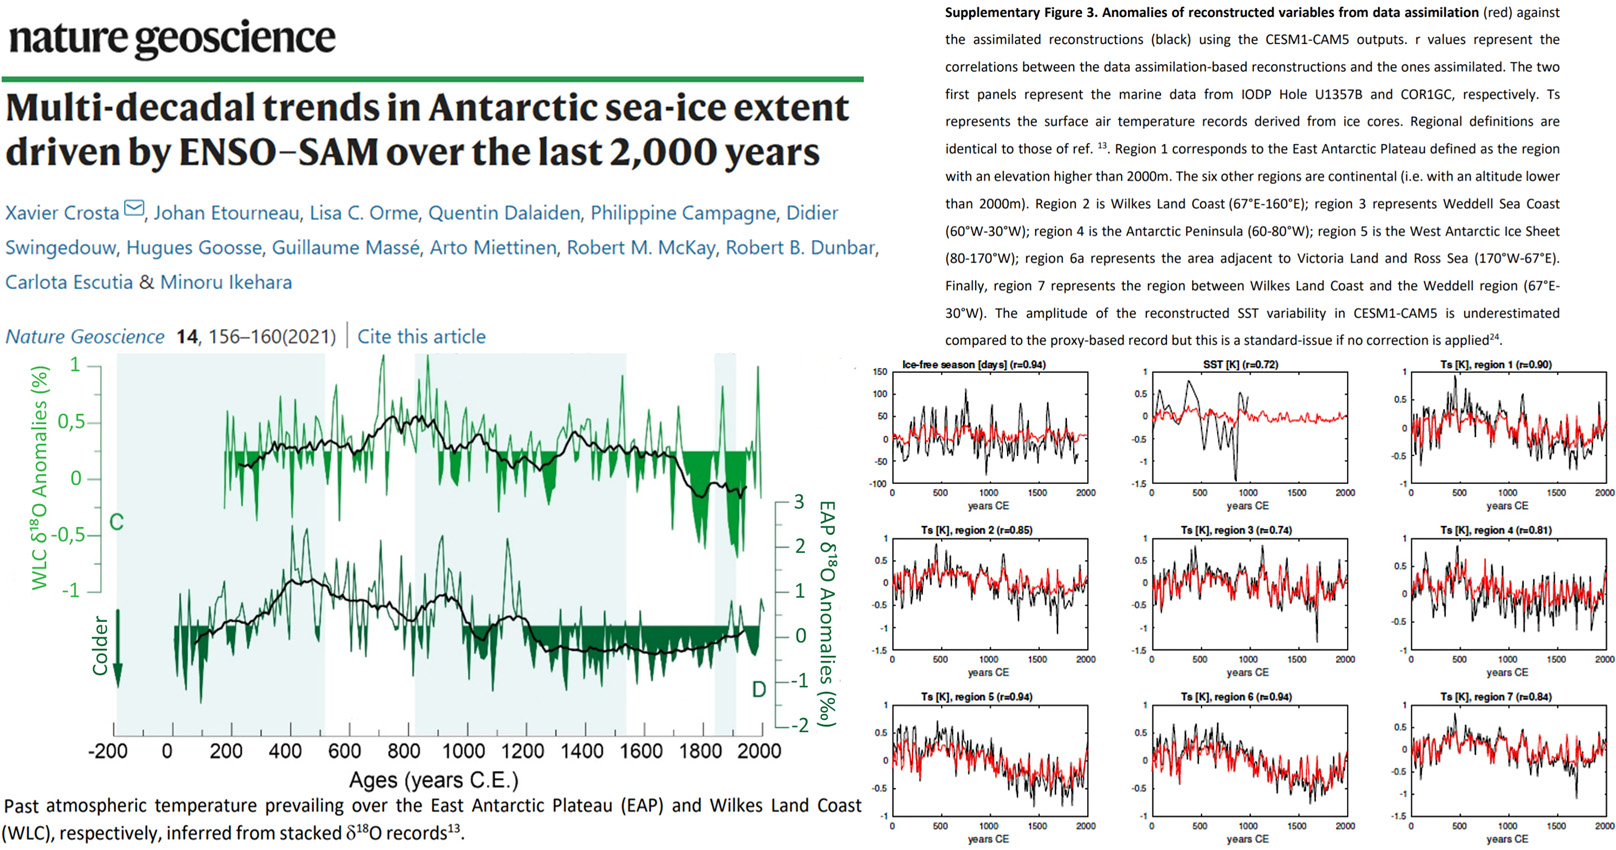
Antarctic sea ice has paradoxically become more extensive over the past four decades despite a warming climate. The regional expression of this trend has been linked to changes in vertical redistribution of ocean heat and large-scale wind-field shifts. However, the short length of modern observations has hindered attempts to attribute this trend to anthropogenic forcing or natural variability. Here, we present two new decadal-resolution records of sea ice and sea surface temperatures that doc-ument pervasive regional climate heterogeneity in Indian Antarctic sea-ice cover over the last 2,000 years. Data assimila-tion of our marine records in a climate model suggests that the reconstructed dichotomous regional conditions were driven by the multi-decadal variability of the El Niño Southern Oscillation and Southern Annular Mode (SAM). For example, during an El Niño/SAM– combination, the northward sea-ice transport was reduced while heat advection from the subtropics to the Southern Ocean increased, which resulted in reduced sea-ice extent in the Indian sector as sea ice was compacted along the Antarctic coast. Our results therefore indicate that natural variability is large in the Southern Ocean and suggest that it has played a crucial role in the recent sea-ice trends and their decadal variability in this region
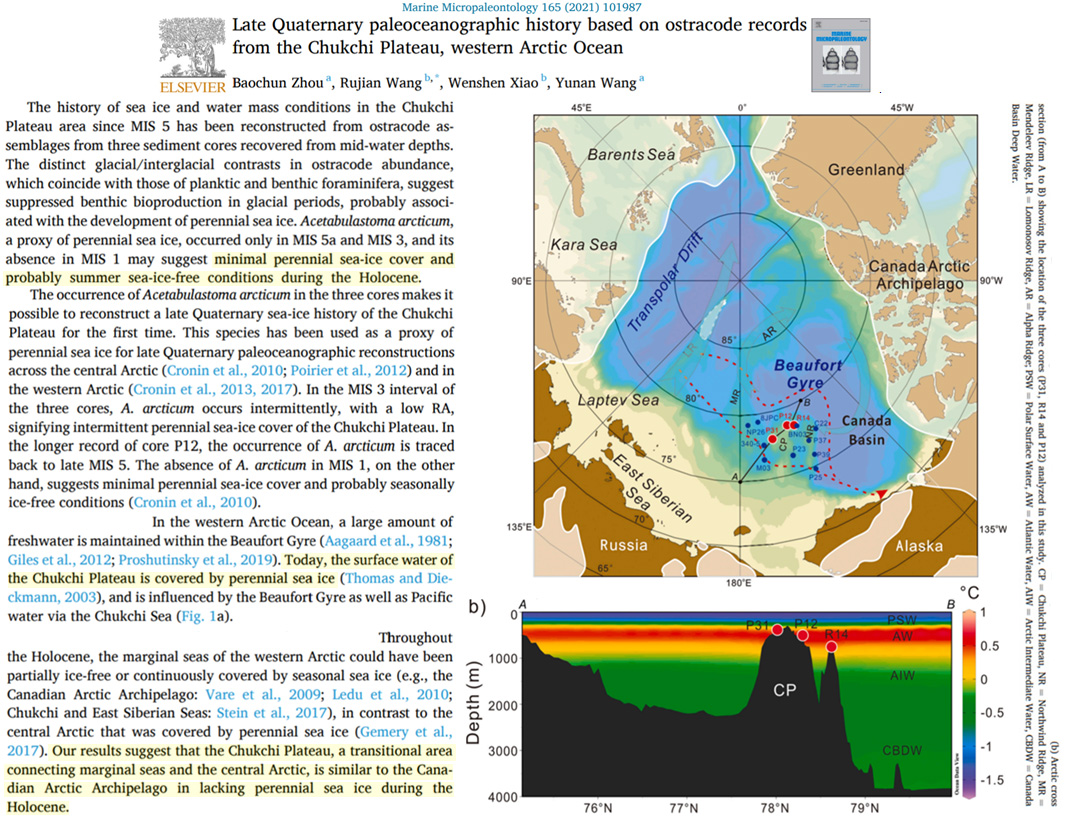
Today, the surface water of the Chukchi Plateau is covered by perennial sea ice (Thomas and Dieckmann, 2003) … Throughout the Holocene, the marginal seas of the western Arctic could have been partially ice-free or continuously covered by seasonal sea ice (e.g., the Canadian Arctic Archipelago: Vare et al., 2009; Ledu et al., 2010; Chukchi and East Siberian Seas: Stein et al., 2017), in contrast to the central Arctic that was covered by perennial sea ice (Gemery et al., 2017). Our results suggest that the Chukchi Plateau, a transitional area connecting marginal seas and the central Arctic, is similar to the Canadian Arctic Archipelago in lacking perennial sea ice during the Holocene.
Over recent decades Antarctic sea-ice extent has increased, alongside widespread ice shelf thinning and freshening of waters along the Antarctic margin. In contrast, Earth system models generally simulate a decrease in sea ice.
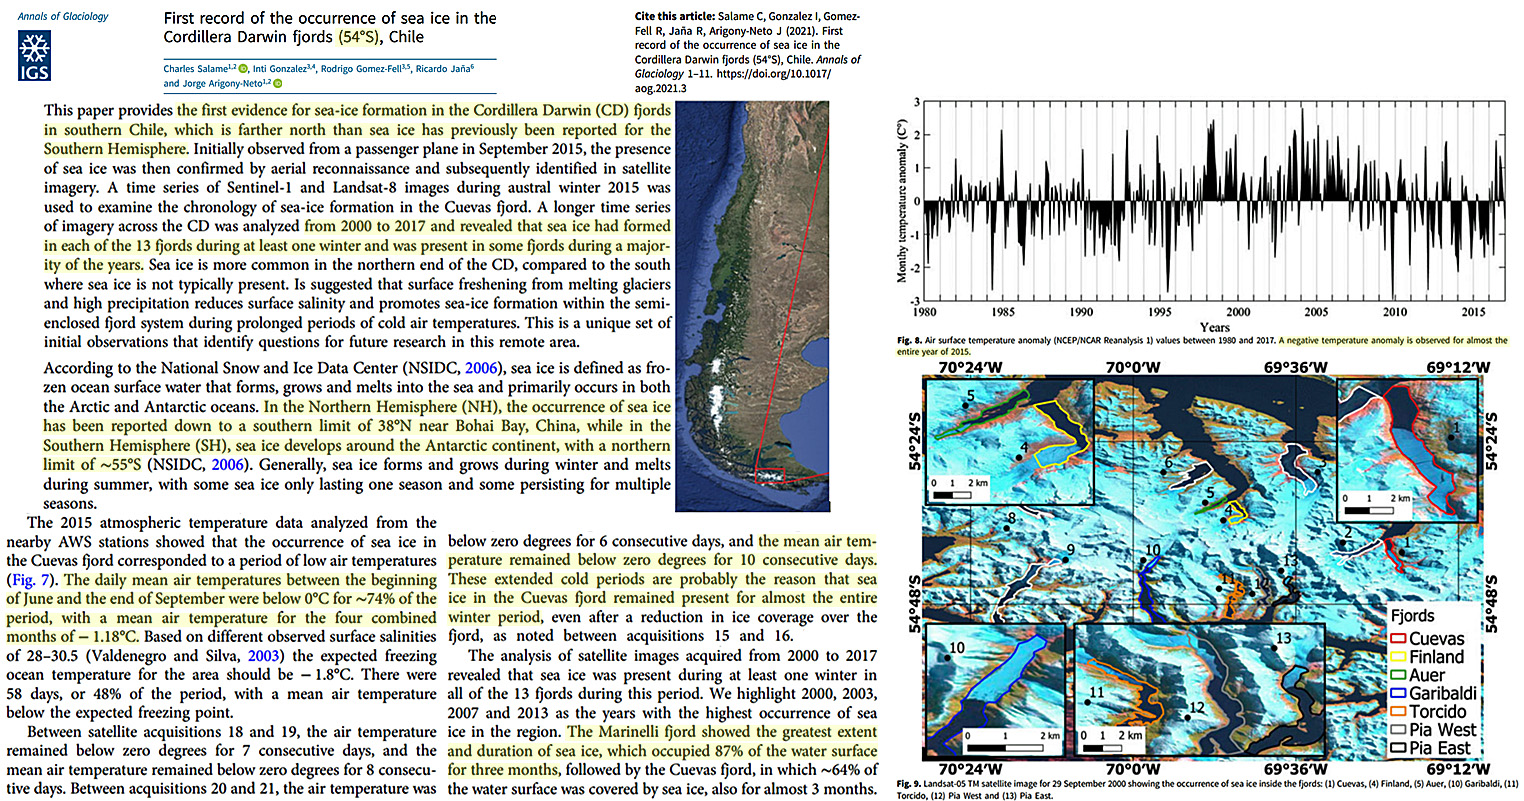
This paper provides the first evidence for sea-ice formation in the Cordillera Darwin (CD) fjords in southern Chile, which is farther north than sea ice has previously been reported for the Southern Hemisphere. … A longer time series of imagery across the CD was analyzed from 2000 to 2017 and revealed that sea ice had formed in each of the 13 fjords during at least one winter and was present in some fjords during a majority of the years.
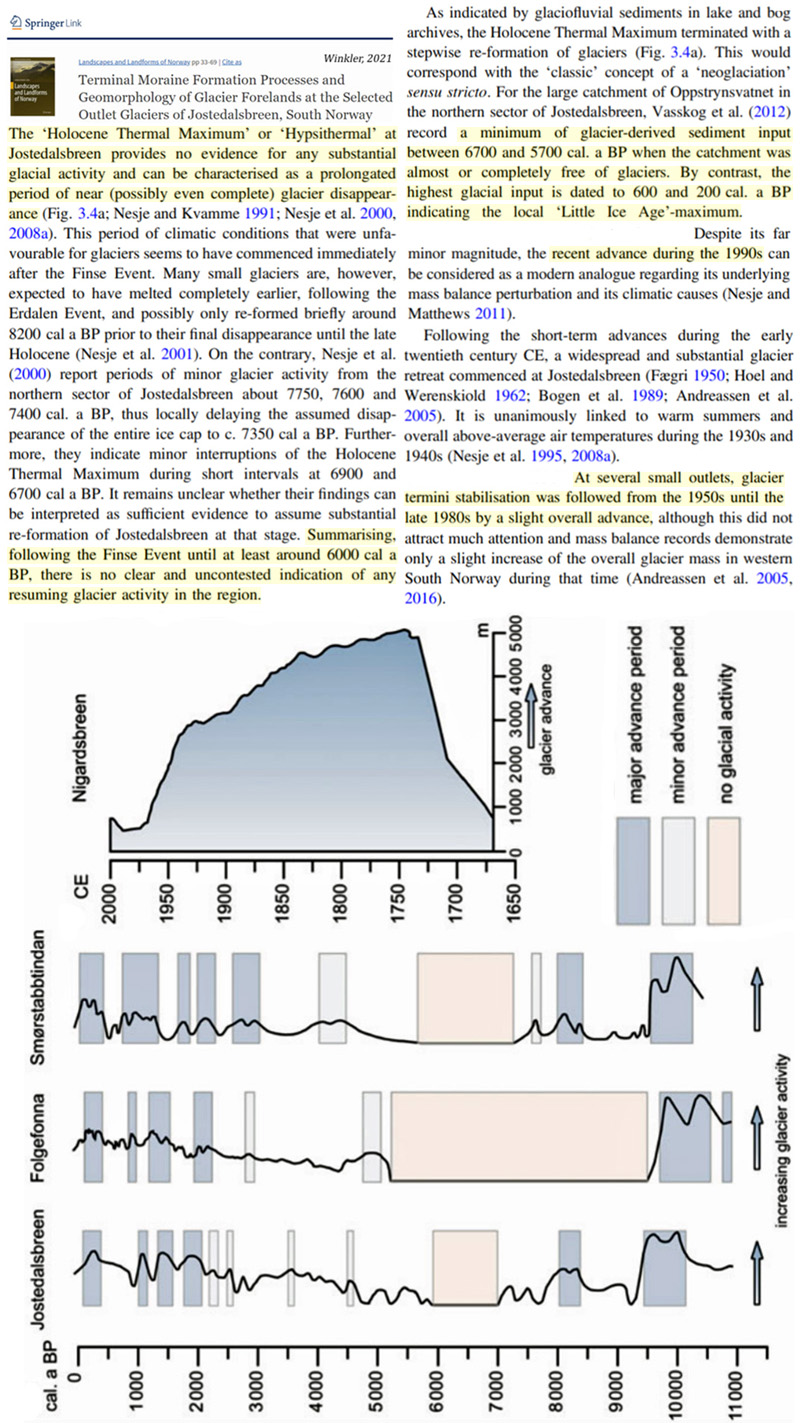
The ‘Holocene Thermal Maximum’ or ‘Hypsithermal’ at Jostedalsbreen provides no evidence for any substantial glacial activity and can be characterised as a prolongated period of near (possibly even complete) glacier disappearance (Fig. 3.4a; Nesje and Kvamme 1991; Nesje et al. 2000, 2008a). … By contrast, the highest glacial input is dated to 600 and 200 cal. a BP indicating the local ‘Little Ice Age’-maximum.
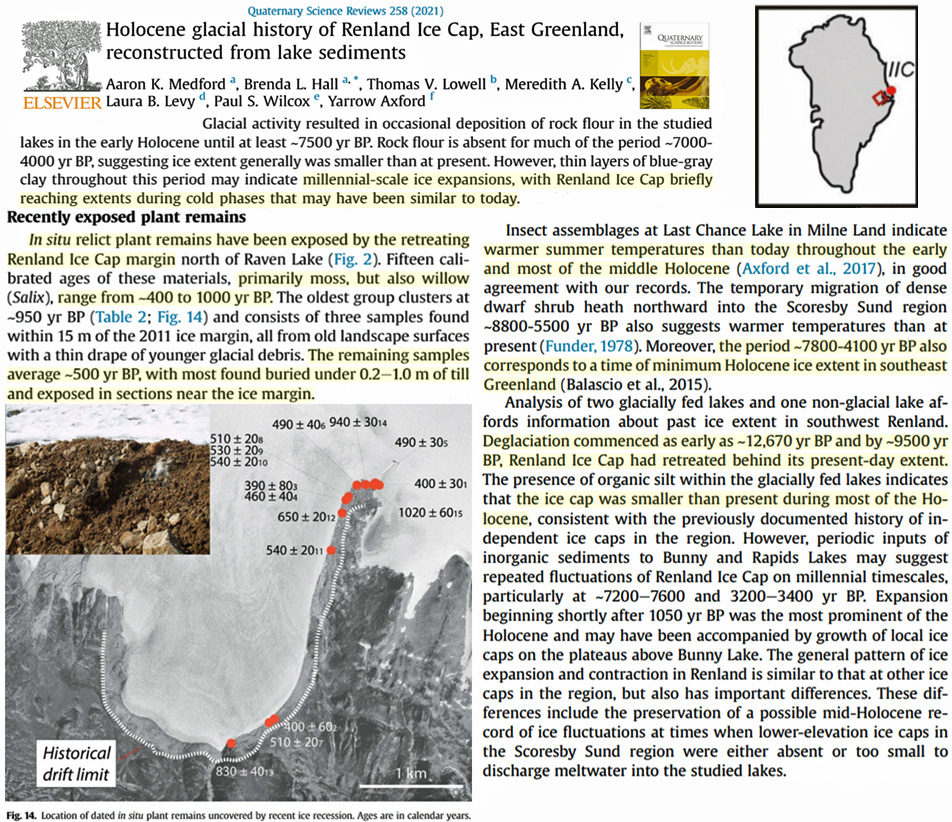
Ice extent was similar to or smaller than at present by ∼10,000 yr BP. … Glacial activity resulted in occasional deposition of rock flour in the studied lakes in the early Holocene until at least ∼7500 yr BP. Rock flour is absent for much of the period ∼7000-4000 yr BP, suggesting ice extent generally was smaller than at present. However, thin layers of blue-gray clay throughout this period may indicate millennial-scale ice expansions, with Renland Ice Cap briefly reaching extents during cold phases that may have been similar to today. … Radiocarbon dates of in situ plant remains adjacent to the present ice cap indicate a short relatively warm period ∼500 yr ago, when ice was within its AD 2011 limit, followed by glacier readvance. The general pattern of ice fluctuations in Renland is similar to that at other ice caps in the region, but also has important differences, including the preservation of a possible mid-Holocene record at times when lower-elevation ice caps in the Scoresby Sund region may have been absent.
Blanchard-Wrigglesworth et al., 2021
Antarctic sea ice extent (SIE) has slightly increased over the satellite observational period (1979 to the present) despite global warming. Several mechanisms have been invoked to explain this trend, such as changes in winds, precipitation, or ocean stratification, yet there is no widespread consensus. Additionally, fully coupled Earth system models run under historic and anthropogenic forcing generally fail to simulate positive SIE trends over this time period.
…reconstruct the variability of MCDW intrusion into the Ross Sea during the past 6,000 years. During the intervals of ∼0.7–1.6 and ∼2.8–6.0 kyr BP, enhanced MCDW intrusion increased the heat supply which warmed the surface water and reduced the coastal sea ice concentration. By contrast, reduced MCDW intrusion during ∼1.6–2.8 kyr BP caused a decrease in the penguin population via restricting food supply and/or increasing sea ice concentration.
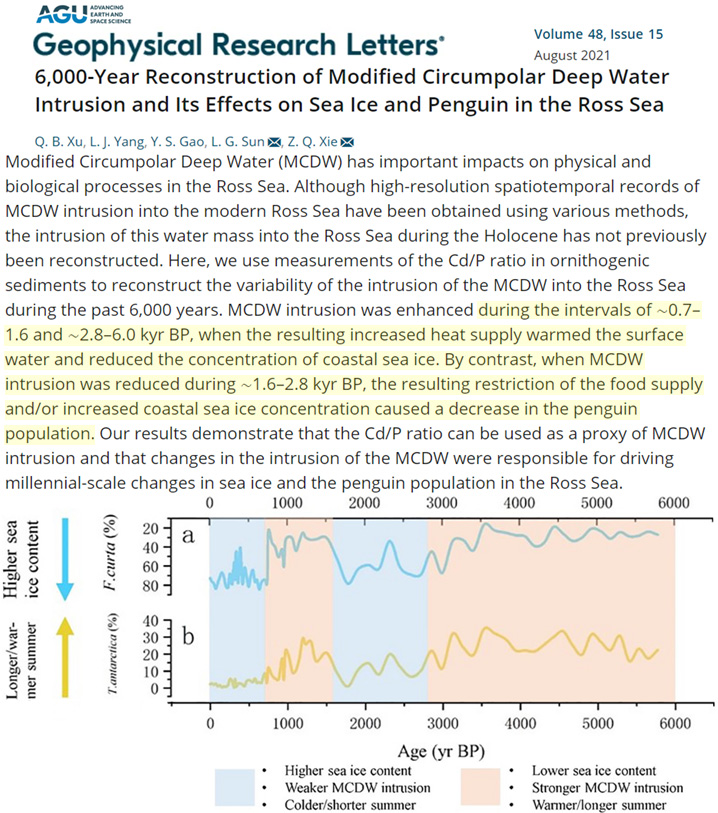
From a long-term perspective, the sea ice concentration (SIC) in the Ross Sea, the Weddell Sea, and most parts of the East Antarctic sector increased significantly during the period 1979–2013 (Turner et al., 2015; Hobbs et al., 2016). … Comiso et al. (2017) showed that negative near surface temperature trends are associated with positive trends in sea ice cover. The intensities and spatial variations of these near-surface parameters are driven by large-scale atmospheric circulation. Variability in the Southern Hemisphere atmospheric circulation can be described by the Southern Annular Mode (SAM) Index or by the El Niño Southern Oscillation (ENSO) Index.
Blocking events are mainly associated with persistent synoptic‐scale ridges of high pressure over Greenland … This means anticyclonic conditions over the ice sheet with more shortwave radiation incoming during summer, reduction in cloud cover (Hofer et al., 2017) and warm air advection from the south‐west, which increases surface ice melt due to higher temperatures and the melt‐albedo positive feedback. These more frequent blocking events are one of the main contributors to the recently observed acceleration in GrIS surface melt (Overland et al., 2012; Fettweis et al., 2013b), and have led to a significant decline in the GrIS surface mass balance (SMB) since the 1990s (van den Broeke et al., 2016; Fettweis et al., 2017; Trusel et al., 2018; Noël et al., 2019).
Many other marine archives across the Barents Sea–Svalbard region imply drastically reduced sea ice, if not completely open water conditions, during the early Holocene …. The Holocene Thermal Maximum, between 10 and 6 thousand years ago, provides an opportunity to investigate sea ice during a warmer-than-present interval. … We conclude that seasonal sea ice persisted in the northern Barents Sea during the Holocene Thermal Maximum, despite warmer-than-present conditions and Atlantic Water inflow. … An overall warmer early Holocene climate is also revealed by terrestrial data across the Svalbard archipelago, suggesting smaller glacier extents and higher air temperatures, as well as minimal sea ice covering the fjords.
LF4 contains relatively little minerogenic material, which can be interpreted in two ways, both indicating that the Åsgardfonna Ice Cap was significantly smaller than today during deposition of this facies (10.1 ± 0.4 to 3.2 ± 0.2 cal ka BP; Fig. 9d). … Our results suggest that larger Svalbard ice caps such as Åsgardfonna are very sensitive to climate changes and probably melted completely during the Holocene Thermal Maximum
Diamond et al., 2021 (NASA modern sea ice, 5.92 million km²)
Compared to the PI, an enhanced rate of LIG sea-ice melt from early May until late June leads to a consistently ice-free LIG Arctic from early August until early October (Figs 1 and 2). The minimum LIG ice area in September is 0.09 ± 0.11 million km², while the PI [pre-industrial, Little Ice Age] minimum ice area is 5.54 ± 0.98 million km². Long-term mean ice thickness during the LIG is also thinner than during the PI in all months.
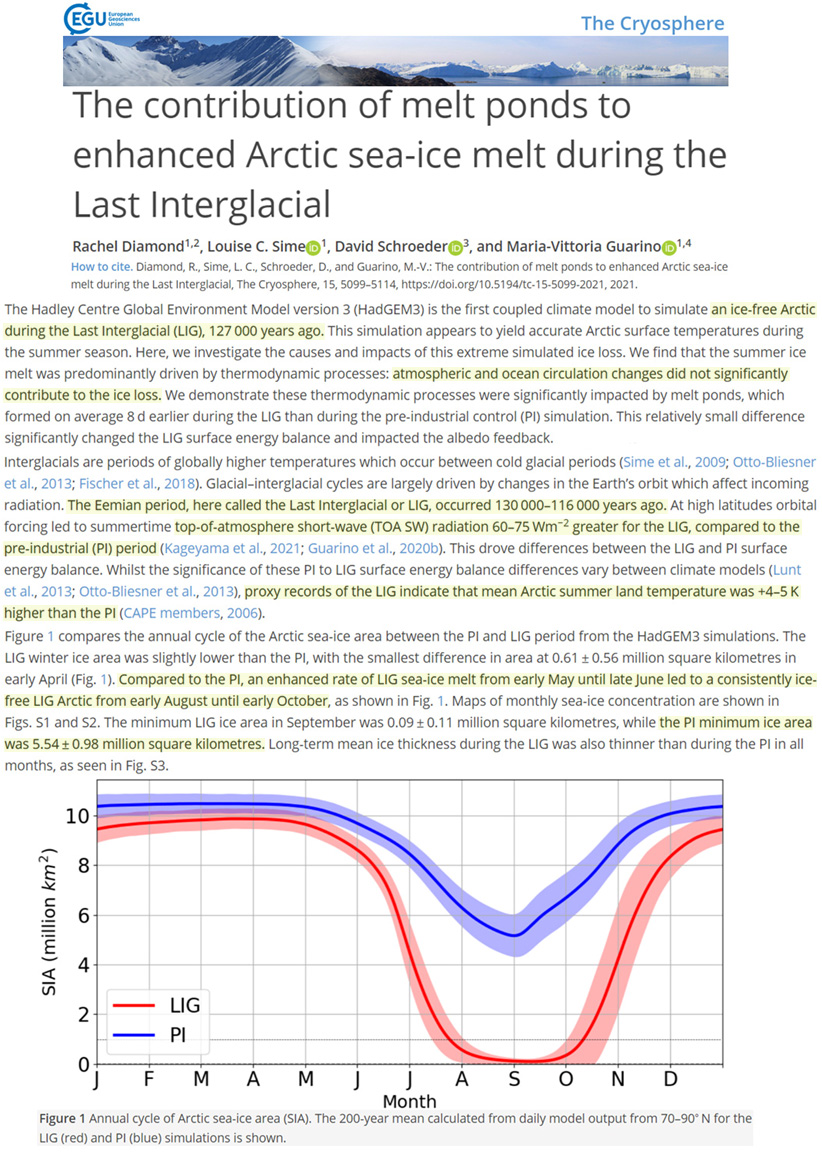
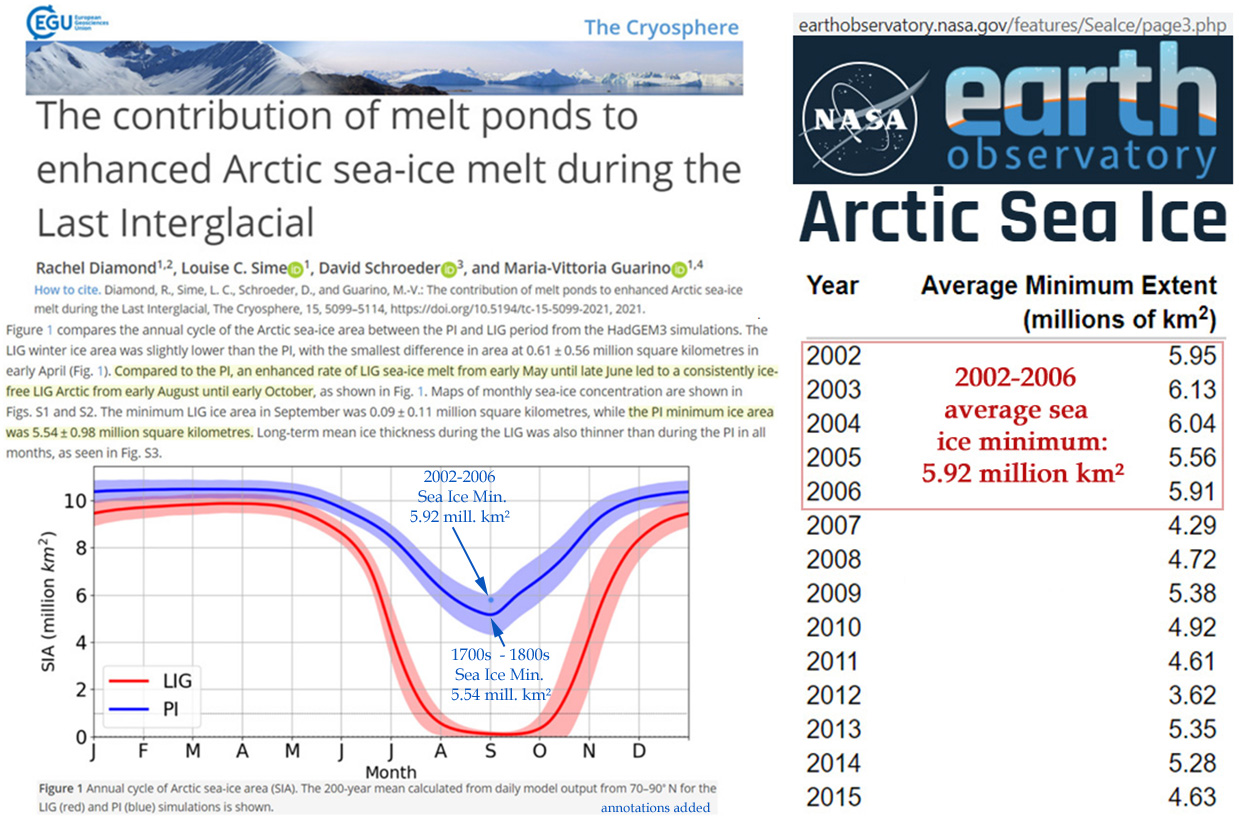
We show that the rapidly retreating Thwaites and Pope glaciers in particular are underlain by areas of largely elevated geothermal heat flow, which relates to the tectonic and magmatic history of the West Antarctic Rift System in this region. … Lithospheric and crustal properties, such as thin crust, thin elastic lithospheric thickness, and high uplift rates, as well as interpreted tectonic and magmatic features, such as individual rift basins, fault systems, and young volcanic activity, coincide with the presently observed largest ice mass loss in Antarctica (outside the northern Antarctic Peninsula) by rapid thinning and retreat of the Pine Island, Thwaites, Pope, and other glaciers in the embayment. This tectonic setting of the ASE is likely to favor relative high geothermal heat flow. Continent-wide studies of geothermal heat flow derived from magnetic and seismological data consistently indicate a substantially higher geothermal heat flow of West Antarctica compared to that of East Antarctica
Ice losses from Thwaites Glacier in West Antarctica are currently responsible for roughly four percent of the global sea-level rise. This figure could increase, since virtually no another ice stream in the Antarctic is changing as dramatically as the massive Thwaites Glacier. Until recently, experts attributed these changes to climate change and the fact that the glacier rests on the seafloor in many places, and as such comes into contact with warm water masses. But there is also a third, and until nowone of the most difficult to constrain, influencing factors. In a new study, German and British researchers have shown that there is a conspicuously large amount of heat from Earth’s interior beneath the ice, which has likely affected the sliding behaviour of the ice masses for millions of years. This substantial geothermal heat flow, in turn, are due to the fact that the glacier lies in a tectonic trench, where the Earth’s crust is significantly thinner than it is e.g. in neighbouring East Antarctica.
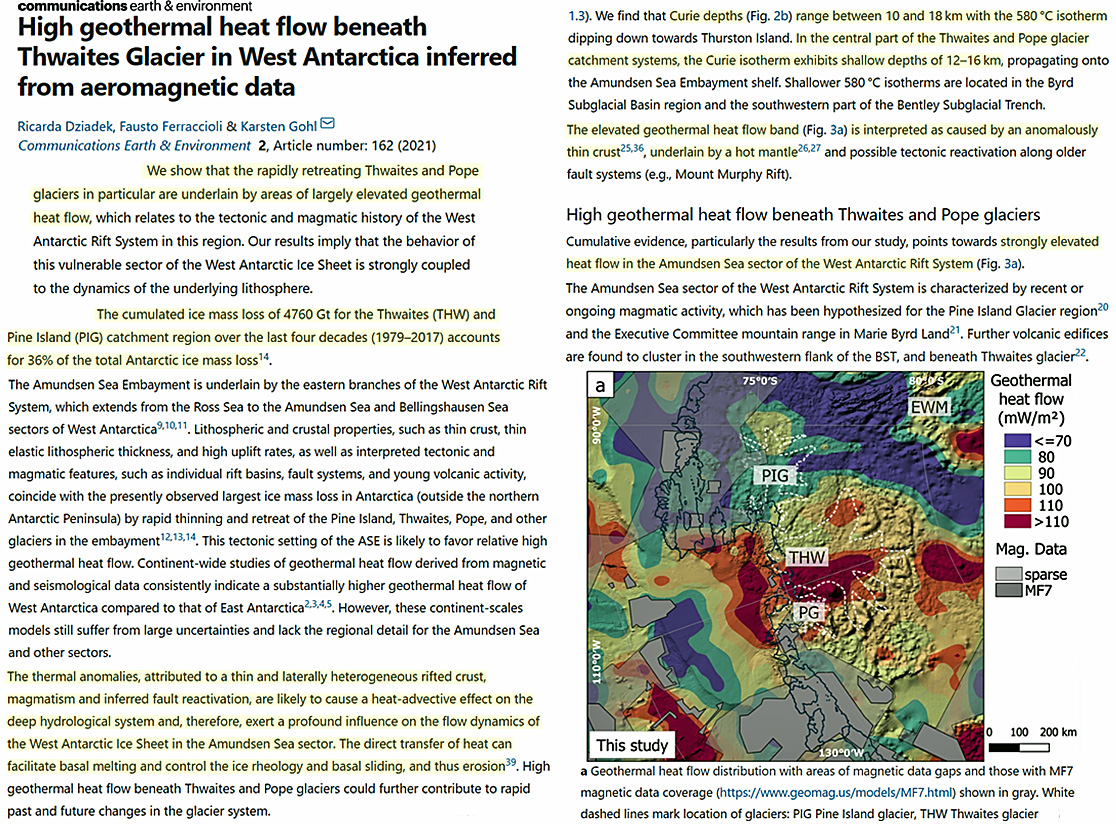
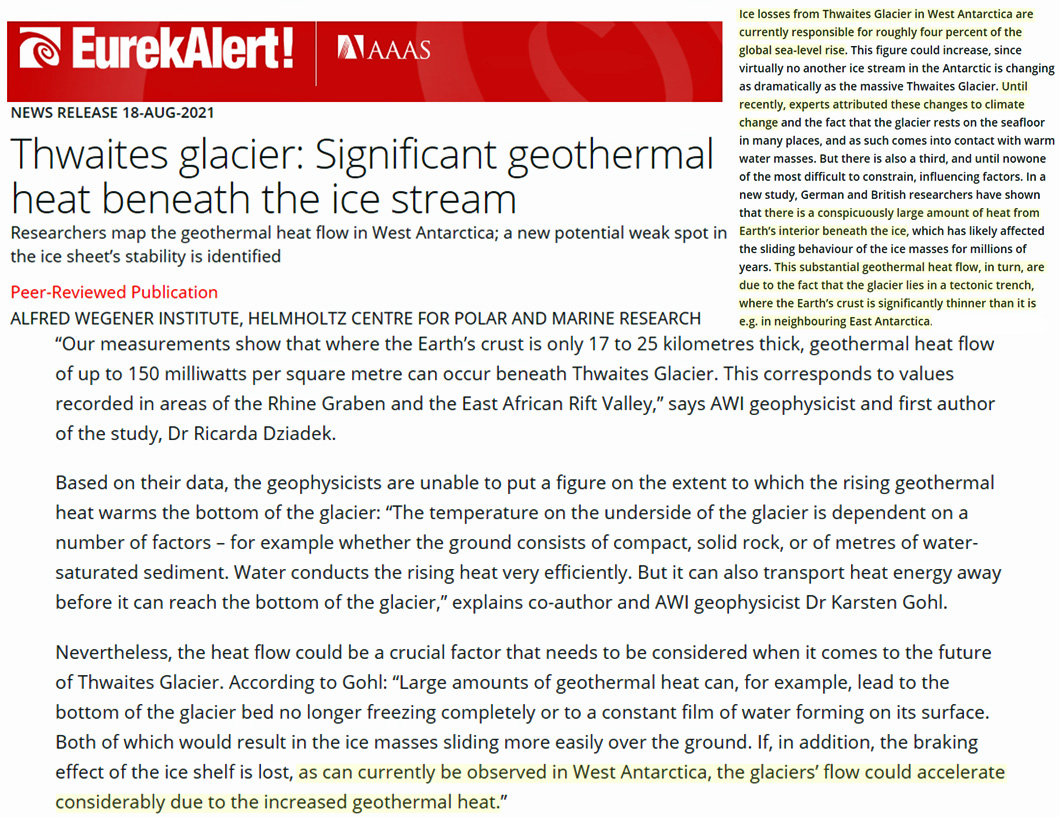
Abrupt, Degrees-Per-Decade Natural Global Warming
[N]o consensus exists yet to explain what triggers the abrupt warmings, characterized by Greenland surface temperature increases of 5–16 °C within a few decades to centuries. Among the proposed paradigms, mechanisms involving changes in Nordic Seas sea-ice cover, atmospheric circulation, or the collapse of ice shelves have been investigated. Recent studies suggest that abrupt climate variability can result entirely from unforced or noise-induced oscillations of the coupled atmosphere-ice-ocean system that alter poleward energy transport.
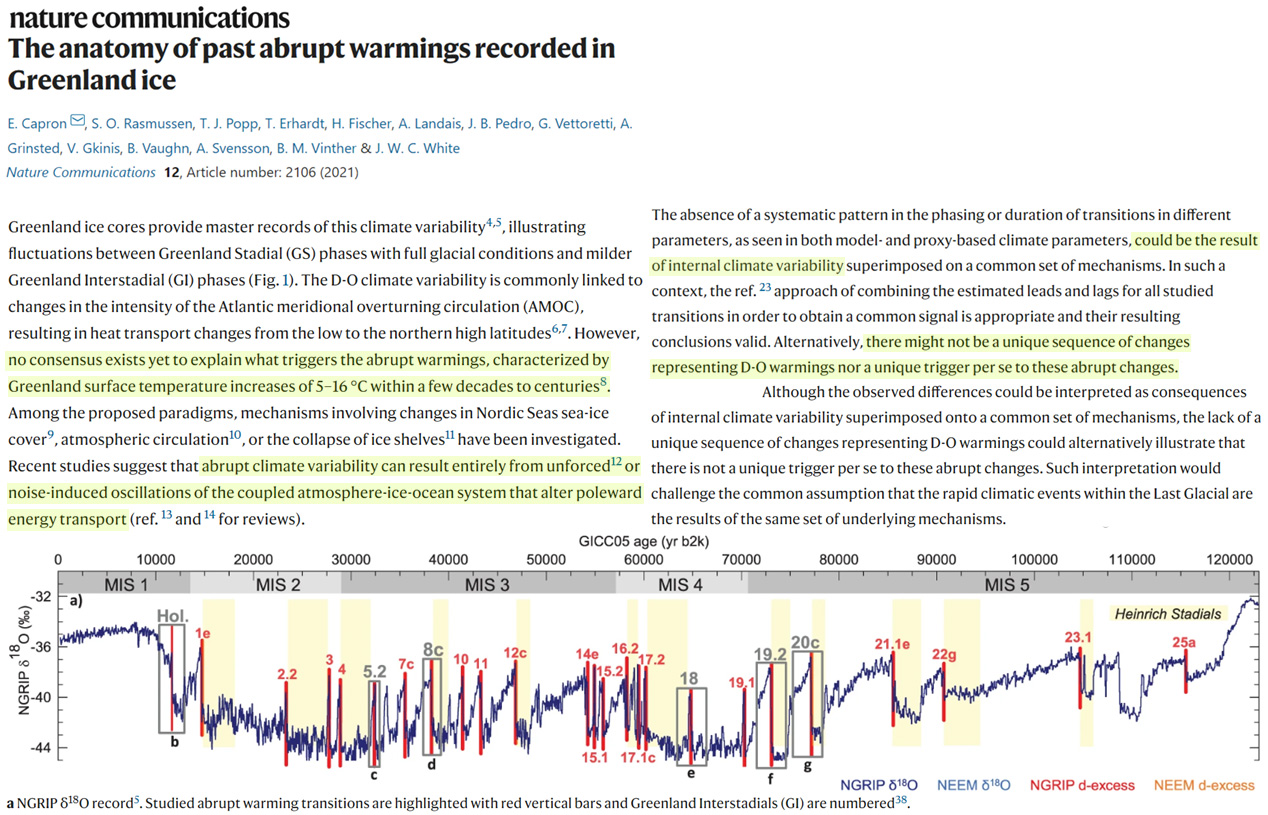
A recognition that various parts of the earth system may spontaneously oscillate, pass through tipping points or exhibit hysteresis due to nonlinear feedbacks. … A better understanding of the prevalence of chaos and variability spontaneously appearing in nonlinear systems which suggests that apparently stochastic variability may in some cases be due to relatively low-dimensional processes. … Very abrupt climate shifts between a cold glacial (stadial) state and a warmer (interstadial) state were first observed in Greenland ice core records (Dansgaard et al., 1993) and named Dansgaard-Oeschger (DO) events. The duration of the abrupt jumps is of the order decades
The lithological change to organic gyttja at 1,050 cm in our core (tentatively dated to ca. 13,400 cal BP) coincides with a drastic increase in AP and the first occurrence of terrestrial macrofossils, indicating rapid forest expansion during the Bølling–Allerød interstadial (14,685–12,650 cal BP). At the beginning of the interstadial, temperatures increased by 3–6 °C within a century in Central Europe (Brooks and Heiri 2013; von Grafenstein et al. 2013; Heiri et al. 2014), leading to large-scale reorganization of terrestrial and aquatic ecosystems (e.g. Ammann et al. 2013; Feurdean et al. 2014; Zawiska et al. 2015).
The abrupt increase of d18O values at the onset of a DO event hereby indicates an atmospheric warming of up to 15.5 °C in less than a decade (Kindler et al., 2014). The high amplitude DO events are not only evident in Greenland ice cores. They had global repercussions and are recorded in many different archives, e.g. marine sediment cores (Jansen et al., 2020; Voelker, 2002).
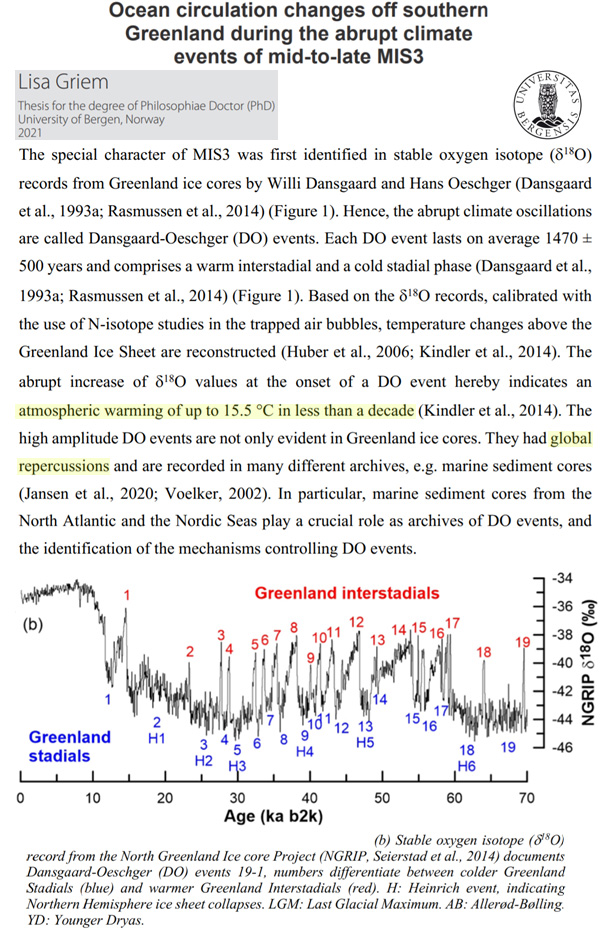


Recent Comments