Beginning in 2003, software engineer William Connolley quietly removed the highly inconvenient references to the global cooling scare of the 1970s from Wikipedia, the world’s most influential and accessed informational source.
It had to be done. Too many skeptics were (correctly) pointing out that the scientific “consensus” during the 1960s and 1970s was that the Earth had been cooling for decades, and that nascent theorizing regarding the potential for a CO2-induced global warming were still questionable and uncertain.
Not only did Connolley — a co-founder (along with Michael Mann and Gavin Schmidt) of the realclimate.com blog — successfully remove (or rewrite) the history of the 1970s global cooling scare from the Wikipedia record, he also erased (or rewrote) references to the Medieval Warm Period and Little Ice Age so as to help create the impression that the paleoclimate is shaped like Mann’s hockey stick graph, with unprecedented and dangerous 20th/21st century warmth.
A 2009 investigative report from UK’s Telegraph detailed the extent of dictatorial-like powers Connolley possessed at Wikipedia, allowing him to remove inconvenient scientific information that didn’t conform to his point of view.
“All told, Connolley created or rewrote 5,428 unique Wikipedia articles. His control over Wikipedia was greater still, however, through the role he obtained at Wikipedia as a website administrator, which allowed him to act with virtual impunity. When Connolley didn’t like the subject of a certain article, he removed it — more than 500 articles of various descriptions disappeared at his hand. When he disapproved of the arguments that others were making, he often had them barred — over 2,000 Wikipedia contributors who ran afoul of him found themselves blocked from making further contributions. Acolytes whose writing conformed to Connolley’s global warming views, in contrast, were rewarded with Wikipedia’s blessings. In these ways, Connolley turned Wikipedia into the missionary wing of the global warming movement.“
After eviscerating references to 1970s global cooling scare and the warmer-than-now Medieval Warm Period from Wikipedia, and after personally rewriting the Wikipedia commentaries on the greenhouse effect to impute a central, dominant role for CO2, Connolley went on to team up with two other authors to publish a “consensus” manifesto in 2008 that claimed to expose the 1970s global cooling scare as a myth, as something that never really happened.
Peterson, Connolley, and Fleck (2008, hereafter PCF08) published “The Myth of the 1970s Global Cooling Scientific Consensus” in Bulletin of the American Meteorological Society, hoping to quash once and for all the perception that there were scientists in the 1960s and 1970s who agreed the Earth was cooling (and may continue to do so), or that CO2 did not play a dominant role in climate change.
The Concoction Of ‘Consensus’ Achieved Via Exclusion
The primary theme of PCF08 can be summarized in 4 succinctly quoted sentences from the paper:
“[T]he following pervasive myth arose [among skeptics]: there was a consensus among climate scientists of the 1970s that either global cooling or a full-fledged ice age was imminent. A review of the climate science literature from 1965 to 1979 shows this myth to be false. … During the period from 1965 through 1979, our literature survey found 7 cooling, 20 neutral, and 44 warming papers. … There was no scientific consensus in the 1970s that the Earth was headed into an imminent ice age. Indeed, the possibility of anthropogenic warming dominated the peer-reviewed literature even then.”
William Connolley and colleagues claimed that the determination of scientific “consensus” regarding global cooling and the influence of CO2 on climate during the 1970s could be divined by counting scientific publications that fell into arbitrarily-defined categories which allowed them to intentionally exclude hundreds of papers that would undermine the alleged myth-slaying purpose of the paper.
The PCF08 authors decided that when “quantifying the consensus” (by counting publications), a scientific paper could only be classified as a “cooling” paper if it projected that future temperatures would (continue to) decline, or that a “full-fledged ice age was imminent.” Papers published during the arbitrarily chosen 1965-’79 era that affirmed the climate had already been cooling for decades, that this cooling wasn’t a positive development, and/or that the effects of CO2 on climate were questionable or superseded by other more influential climate change mechanisms … were not considered worthy of classification as a “cooling” paper, or as a paper that disagreed with the claimed “consensus” that said the current (1960s-’70s) global cooling will someday be replaced by CO2-induced global warming.
Of course, the global cooling scare during the 1970s was not narrowly or exclusively focused upon what the temperatures might look like in the future, or whether or not an ice age was “imminent”. It was primarily about the ongoing cooling that had been taking place for decades, the negative impacts this cooling had already exerted (on extreme weather patterns, on food production, etc.), and uncertainties associated with the causes of climatic changes.
By tendentiously excluding 1960s and 1970s publications that documented global cooling had been ongoing and a concern, as well as purposely excluding papers that suggested the climate’s sensitivity to CO2 forcing is weak or questionable relative to other mechanisms, the authors could brazenly claim that there were only 7 papers published in the scientific literature between 1965 and 1979 that disagreed with the “consensus” opinion that global warming would occur at some point in the future (due to CO2 increases). According to PCF08, there were 44 papers that fell into the latter warming-is-imminent-due-to-CO2 category from 1965-’79, ostensibly entitling them to claim that dangerous anthropogenic global warming projections “dominated” the scientific literature even then.
An 83% Global Cooling/Weak CO2 Influence Scientific ‘Consensus’ During 1960s, ’70s
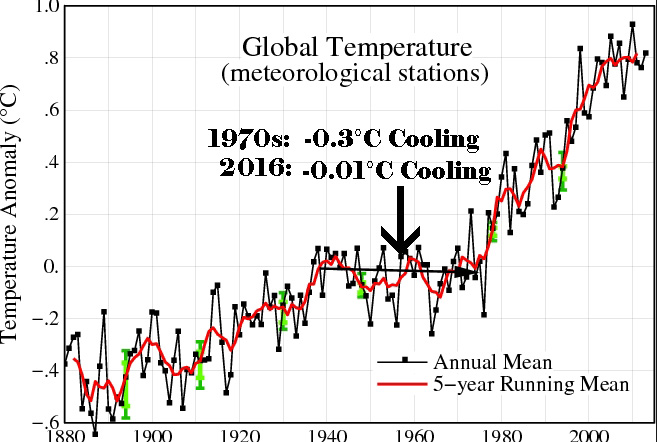
As will be shown here, the claim that there were only 7 publications from that era disagreeing with the presupposed CO2-warming “consensus” is preposterous. Because when including the papers from the 1960s and 1970s that indicated the globe had cooled (by -0.3° C between the 1940s and ’70s), that this cooling was concerning (leading to extreme weather, drought, depressed crop yields, etc.), and/or that CO2’s climate influence was questionable to negligible, a conservative estimate for the number of scientific publications that did not agree with the alleged CO2-warming “consensus” was 220 papers for the 1965-’79 period, not 7. If including papers published between 1960 and 1989, the “non-consensus” or “cooling” papers reaches 285.
Again, these estimates should be viewed as conservative. There are likely many dozen more scientific papers from the 1960s-’70s cooling scare era that would probably fall into the category of a “cooling” paper, but have not yet been made available to view in full online.
But let us say that the PCF08 claim is true, and that there were indeed only 44 papers published between 1965-’79 that endorsed the position that the Earth’s climate is predominately shaped by CO2 concentrations, and thus the Earth would someday start warming as the models had suggested. Interestingly, if we were to employ the hopelessly flawed methodology of divining the relative degree of scientific “consensus” by counting the number of papers that agree with one position or another (just as blogger John Cook and colleagues did with their 2013 paper “Quantifying the Consensus…” that yielded a predetermined result of 97% via categorical manipulation), the 220 “cooling” papers published between 1965-’79 could represent an 83.3% global cooling consensus for the era (220/264 papers), versus only a 16.7% consensus for anthropogenic global warming (44/264 papers).
The 1970s Global Cooling Scare Was Not Mythological
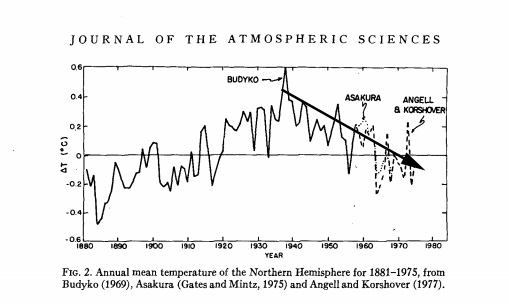
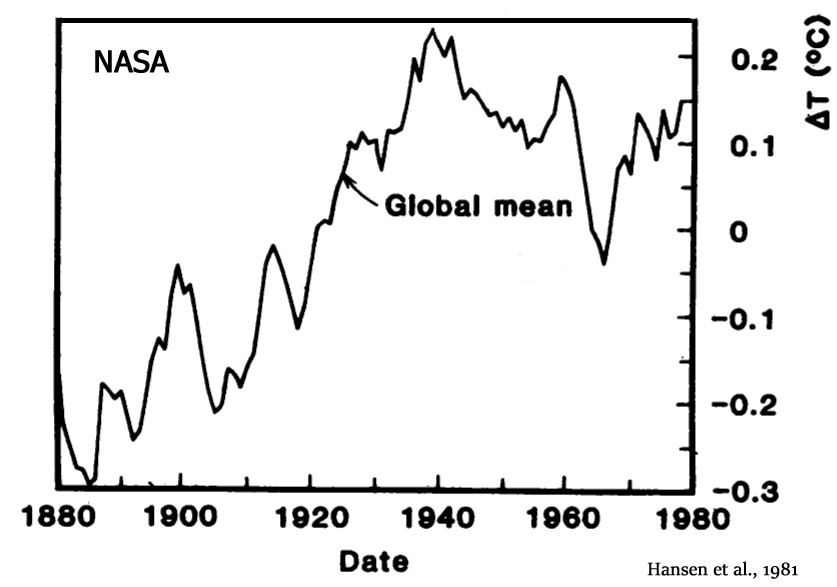
In reviewing the available scientific literature from the 1960s-’80s, it is plainly evident that there was a great deal of concern about the ongoing global cooling, which had amounted to -0.5°C in the Northern Hemisphere and -0.3°C globally between the 1940s and 1970s.
Of course, this inconvenient global-scale cooling of -0.3°C between the 1940s and 1970s has necessarily been almost completely removed from the instrumental record by NASA (GISS) and the MetOffice (HadCRUT). After all, the observations (of cooling) conflicted with climate modeling. Overseers of the surface temperature datasets (such as the MetOffice’s Phil Jones or NASA’s Gavin Schmidt) have recently adjusted the -0.3°C of cooling down to just hundredths of a degree of cooling. NASA GISS, for example, has reduced (via “adjustments”) the global cooling down to about -0.01°C between the 1940s and 1970s, as shown below. It is likely that, during the next few years of adjustments to past data, the mid-20th century global cooling period will disappear altogether and mutate into a warming period.
For those who actually experienced the non-mythological cooling scare during the 1960s and 1970s (that has since been made to disappear from graphs), the consequences of the -0.5° Northern Hemispheric cooling (especially) were frequently discussed in scientific publications. There were geoengineering strategies proposed by scientists to melt Arctic sea ice. Droughts and floods and extreme weather anomalies/variability were blamed on the ongoing global cooling. Glaciers were advancing, even surging at accelerated rates during this period. Sea ice growth and severe Arctic cooling meant that the oceans were much less navigable. Crop growth and food production slowed as the Earth cooled, which was of great concern to world governments. Severe winters in the 1960s and 1970s led many climatologists to assume that the Earth was returning to an 1800s-like Little Ice Age climate. Observations of mammals migrating to warmer climates during the 1960s and 1970s due to the colder temperatures were reported in scientific papers.
Synonyms for the 1960s-’70s climate cooling conditions commonly used in the literature were words such as deterioration, recession, detrimental, and severe. In contrast, warming periods such as during the warmer Medieval times or the warm-up during the first half of the 20th century were referred to positively, or as optimum (i.e., the Medieval Warm Period was referred to as the “Little Optimum”).
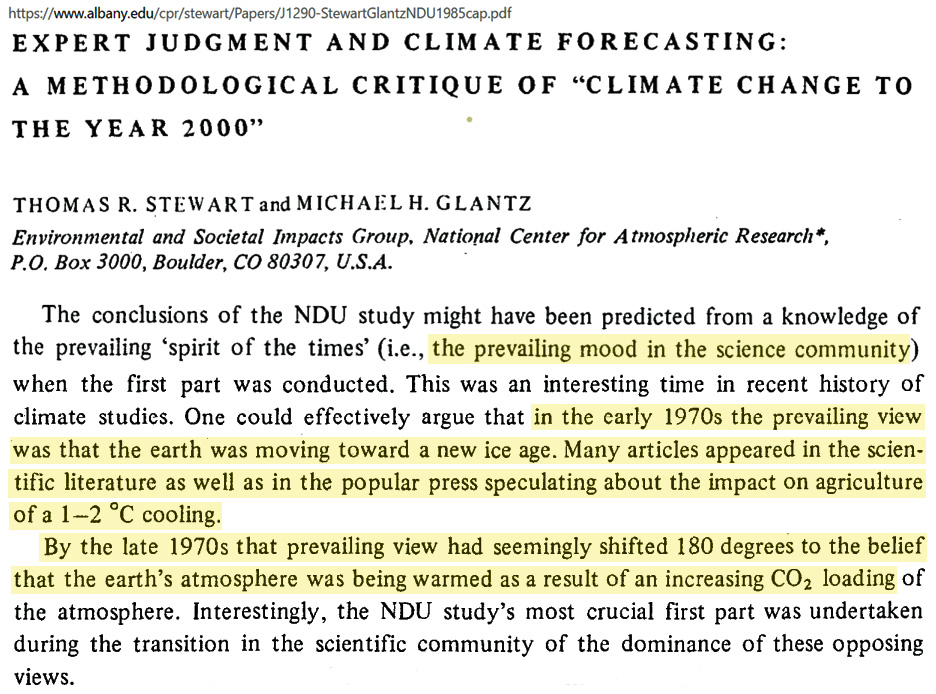
According to Stewart and Glantz (1985), in the early 1970s it was the “prevailing view” among scientists that the Earth was headed into another ice age. It wasn’t until the late ’70s that scientists changed their minds and the “prevailing view” began shifting to warming. This is in direct contradiction to the claims of PCF08, who allege warming was the prevailing view among scientists in the 1960s and early 1970s too. Furthermore, as recently as 1985, it was still acknowledged that “the causes of global climate change remain in dispute.”
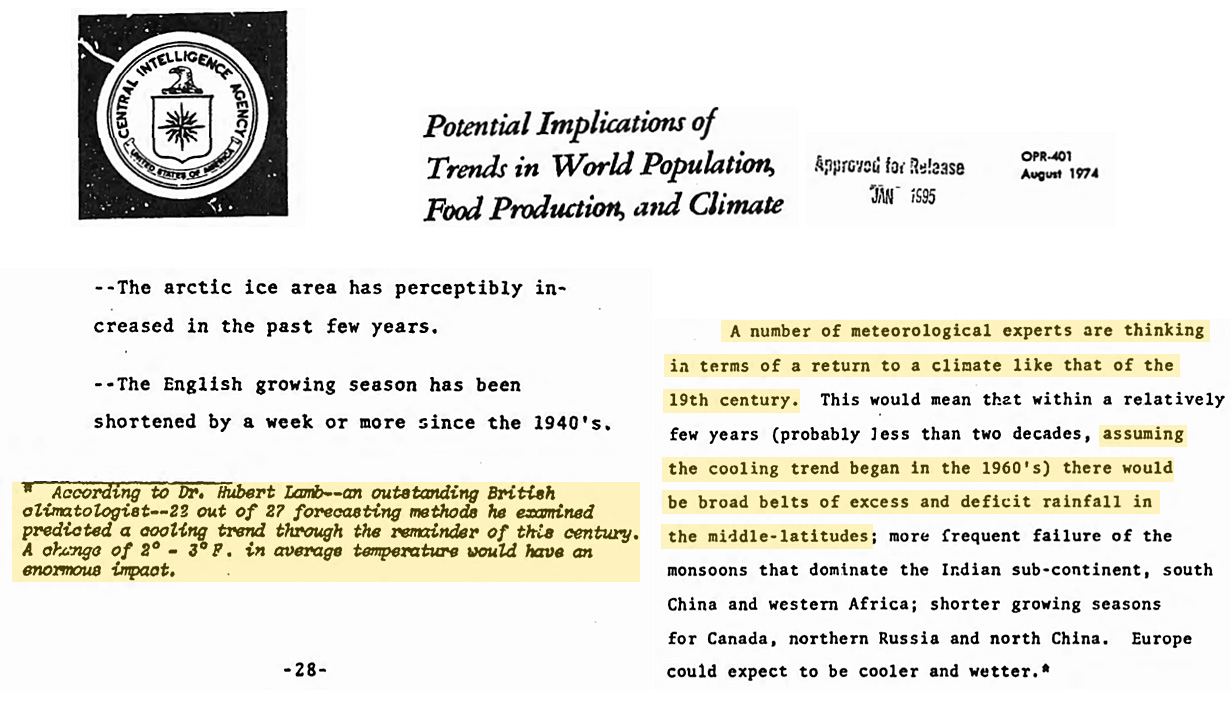
According to scientists reporting to the U.S. Central Intelligence Agency (1974), 22 of 27 forecasting methods predicted a cooling trend for the next 25 years, and “meteorological experts” were thinking an 1800s climate was around the corner, with the concomitant return to monsoon failures, shorter growing seasons, and “violent weather”.
U.S. Central Intelligence Agency,1974
The Selective Emphasis On Particular Scientific ‘Facts’ To Advance An Agenda
It is rather ironic that the below quote impugning the motives of “skeptics” by Connolley and his co-authors (PCF08) appeared in a paper that insisted the 1970s concerns about global cooling never really happened from a scientific standpoint, and their “proof” that it never really happened is that they could only manage to locate 7 scientific papers (via selection bias) that supported this “contrarian” view:
“Underlying the selective quotation of the past literature is an example of what political scientist Daniel Sarewitz calls ‘scientization’ of political debate: the selective emphasis on particular scientific ‘facts’ to advance a particular set of political values. In this case, the primary use of the myth is in the context of attempting to undermine public belief in and support for the contemporary scientific consensus about anthropogenic climate change by appeal to a past “consensus” on a closely related topic that is alleged to have been wrong.”
William Connolley may have successfully erased the Medieval Warm Period and 1970s cooling concerns from the pages of Wikipedia. He may have successfully written over 5,400 original Wikipedia articles in an attempt to persuade the public to believe in a dominant role for humans and CO2 in causing climate changes. But the internet has a long and expansive memory, and it is unforgiving when opportunists and activists attempt to dupe the public by concocting false narratives and employing the very same practice of “scientization” they hypocritically claim to deride.
285 Scientific Publications Affirming A Global Cooling/Weak CO2 Influence ‘Consensus’
Again, there were at least 285 scientific publications that did not agree with the alleged CO2-warming “consensus” opinion during the 1960s to 1980s. The list is divided into several sub-sections:
Cooling Since 1940, Forecasts for Continued Cooling/Ice Age (156 papers)
Dubious Human Influence on Climate, Low CO2 Climate Sensitivity (44 papers)
Rising CO2 Leads to Cooling (7)
Uncertainties, Lack of Climate Understanding, Climate Modeling Problems (30)
Miscellaneous Questionable Human, CO2 Influence on Climate (12)
Non-CO2 Climate Change Mechanisms (26)
Warmer past despite lower CO2 (10)
What follows is a list of over 285 papers published during the 1960s, 70s and 80s showing there was a near consensus of an imminent global cooling – a point that some activist scientists falsely dispute. They should have been far more careful in their review of the literature.
Cooling Since 1940, Forecasts for Continued Cooling/Ice Age (156 papers)
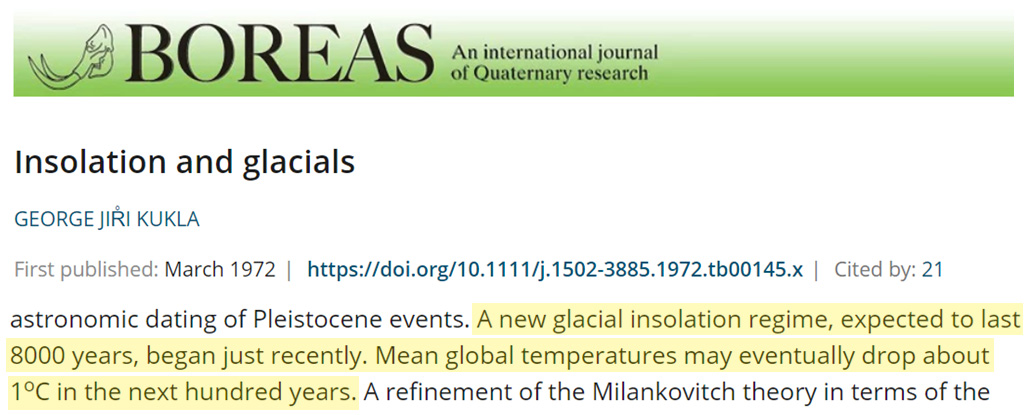
1. Kukla, 1972 Climatic changes result from variables in planetary orbits which modulate solar energy emission and change seasonal and latitudinal distribution of heat received by the Earth. Small insolation changes are multiplied by the albedo effect of the winter snow fields of the Northern Hemisphere, by ocean-atmosphere feedbacks, and, probably, by the stratospheric ozone layer. The role of volcanic explosions and other aperiodic phenomena is secondary. The immediate climate response to insolation trends permits astronomic dating of Pleistocene events. A new glacial insolation regime, expected to last 8000 years, began just recently. Mean global temperatures may eventually drop about 1oC in the next hundred years. A refinement of the Milankovitch theory in terms of the lunar orbit and more data on solar periodicities are needed for reliable long range predictions.
2. Ellsaesser , 1974 Has man, through increasing emissions of particulates, changed the climate? It is estimated that man now contributes 13.6% of the 3.5 x 10⁹ tons of primary and secondary particulates presently emitted to the atmosphere annually. … [W]hile an anthropogenic upward trend in airborne particulates existed in the past, it was halted and may even have been reversed over the past few decades. … The 1968 AAAS Symposium on Global Effects of Environmental Pollution initiated a flood of papers supporting monotonically if not exponentially increasing pollution. The particulate increases were usually cited as at least contributing to the post 1940 cooling and possibly capable of bringing on another ice age.
[F]or 50 or so years the world has been warmer than at any time in the last 300 years; in the 1940’s warmer than at any time during the last 1000 years. Since 1945 there has been a cooling trend and we are now nearly back down to the averages of the early 19th century. None of the calculations of which I am aware found that the man augmented CO2 could have contributed more than a small fraction of the warming up to 1940. Whatever the cause of the warming the post 1940 cooling appears to be primarily a return to normal. … Of the climatic problems raised the CO2 one is best understood. There is essentially universal agreement that atmospheric CO2 is increasing, increasing as a result of the consumption of fossil fuels and that this should enhance the “greenhouse” effect leading to a warming of the planetary surface. The strongest support for the upward trend in airborne particulates derives from the failure of observational data to support our understanding of the CO2 effect. Yet no one ever hears the argument that man might consider a deliberate increase in particulates to counter the CO2 effect or alternatively that the CO2 effect is just what is needed to prevent or delay the onset of the next glacial advance which is now imminent according to students of this problem. The failure of these latter arguments to receive equal time indicates a decided bias in our systems for informational exchange and it is the possibility that such a decided bias can exist that I consider to be the greatest threat to our future.
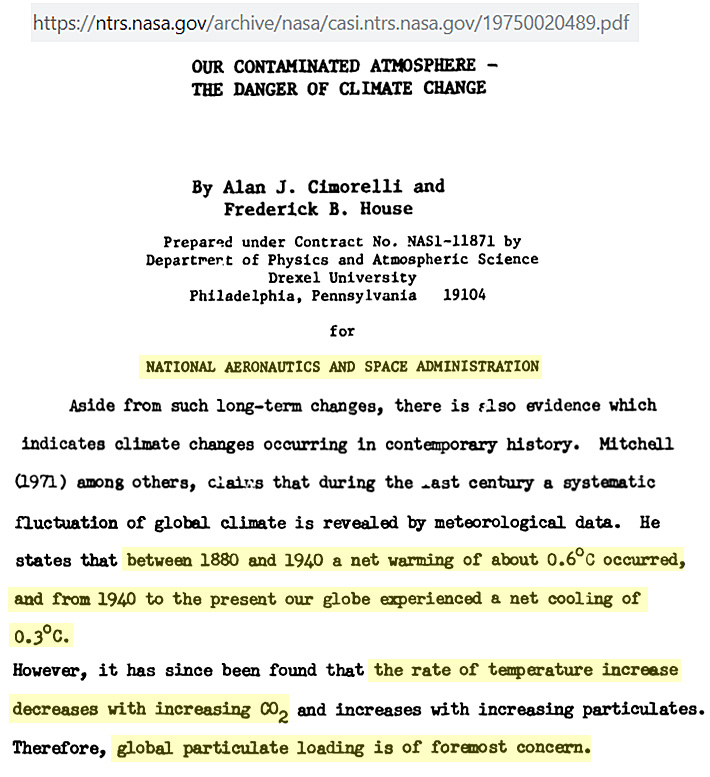
3. Cimorelli and House, 1974 Aside from such long-term changes, there is also evidence which indicates climate changes occurring in contemporary history. Mitchell (1971) among others, claims that during the last century a systematic fluctuation of global climate is revealed by meteorological data. He states that between 1880 and 1940 a net warming of about 0.6°C occurred, and from 1940 to the present our globe experienced a net cooling of 0.3°C. … The effect of increasing global concentrations of CO2 is to increase the average global surface temperature. … As for increasing global concentrations of particulate matter, the opposite is true. Due to the backscattering characteristics of the particles an increase in the albedo occurs which produces a decrease in average global surface temperature. … Since it had been thought that the two effects canceled one another, their use as criteria for developing standards has not been considered. However, it has since been found that the rate of temperature increase decreases with increasing CO2 and increases with increasing particulates. Therefore, global particulate loading is of foremost concern. … Sellers (1973) has developed a climate model which quantitatively relates particulate loading to surface temperature. He has shown that an increase in man-made global particulates by a factor of 4.0 will initiate an ice-age. In order that we safeguard ourselves and future generations from a self-imposed ice-age it is necessary that we effectively monitor global concentrations of particulate matter. … Their results showed that an increase by a factor of eight of global CO2 concentrations will produce an increase in surface temperature of less than 2°C, whereas increasing particulate concentration by a factor of four could decrease the mean surface temperature as much as 3.5°C. Therefore, as the global concentrations of both CO2 and particulates are increased, it is the radiative shielding effect of the particulates which plays the dominate role. … Ludwig and Morgan, 1970, predict that man’s potential to pollute will increase six-to-eight fold in the next fifty years. All of these studies point to the possibility, in the not so distant future, of man polluting himself into an ice age.
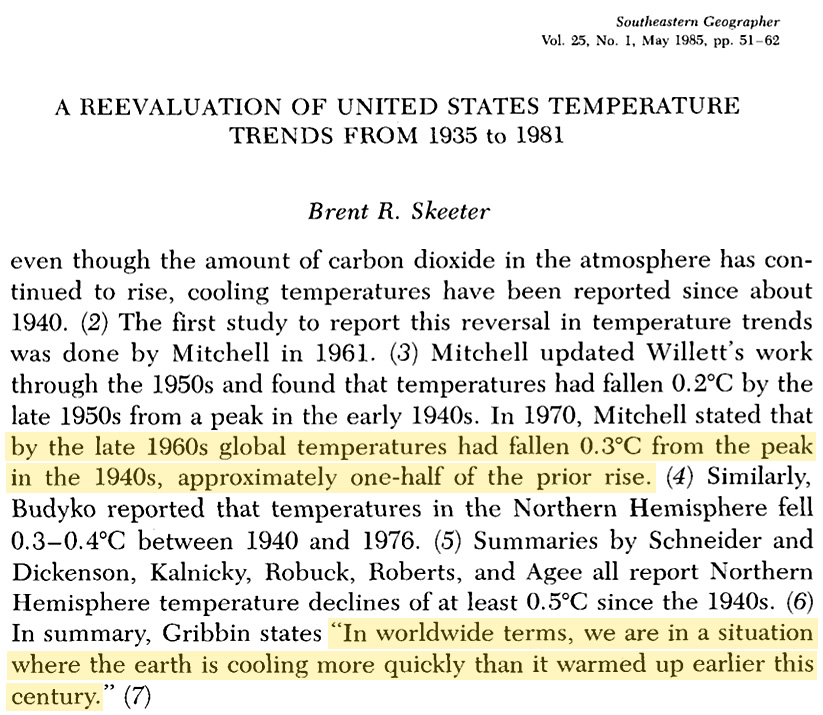
4. Skeeter, 1985 Numerous studies of global and hemispheric temperature trends have been undertaken in recent decades. One of the earliest studies was done by Willett in 1950. Willett analyzed temperature records of fifty years for 54 stations. He found that global temperatures increased 1°F (0.6°C) between 1885 and 1940. Winter temperatures during this same period were found to increase by 2.2°F (1.2°C). The most pronounced warming was in the high latitudes of the Northern Hemisphere. This warming trend conformed with the temperature trend that climatologists had expected to exist due to the increasing levels of carbon dioxide in the atmosphere. However, even though the amount of carbon dioxide in the atmosphere has continued to rise, cooling temperatures have been reported since about 1940. The first study to report this reversal in temperature trends was done by Mitchell in 1961. Mitchell updated Willett’s work through the 1950s and found that temperatures had fallen 0.2°C by the late 1950s from a peak in the early 1940s. In 1970, Mitchell stated that by the late 1960s global temperatures had fallen 0.3°C from the peak in the 1940s, approximately one-half of the prior rise. Similarly, Budyko reported that temperatures in the Northern Hemisphere fell 0.3-0.4°C between 1940 and 1976. Summaries by Schneider and Dickenson, Kalnicky, Robuck, Roberts, and Agee all report Northern Hemisphere temperatures declines by at least 0.5°C since the 1940s. In summary, Gribbin states “In worldwide terms, we are in a situation where the earth is cooling more quickly than it warmed up earlier this century. From the above it is clear that the general consensus in the recent literature is that there has been a cooling in the Northern Hemisphere since the early 1940s.
5. Agee, 1980 Evidence has been presented and discussed to show a cooling trend over the Northern Hemisphere since around 1940, amounting to over 0.5°C, due primarily to cooling at mid- and high latitudes. Some regions of the middle latitudes have actually warmed while others, such as the central and eastern United States, have experienced sharp cooling. A representative station for this latter region is Lafayette, Ind., which has recorded a drop of 2.2°C in its mean annual temperature from 1940 through 1978. The cooling trend for the Northern Hemisphere has been associated with an increase of both the latitudinal gradient of temperature and the lapse rate, as predicted by climate models with decreased solar input and feedback mechanisms. … Observations and interpretation of sunspot activity have been used to infer a direct thermal response of terrestrial temperature to solar variability on the time scale of the Gleissberg cycle (∼90 years, an amplitude of the 11-year cycles). Measurements at the Greenwich Observatory and the Kitt Peak National Observatory, as well as other supportive information and arguments, are presented to hypothesize a physical link between the sunspot activity and the solar parameter. On the time scale of the Gleissberg cycle when the mean annual sunspot number exceeds 50 it is proposed that global cooling may be initiated due to the decreased insolation. This is also supported by umbral-to-penumbral ratios computed and interpreted by Hoyt (1979a).
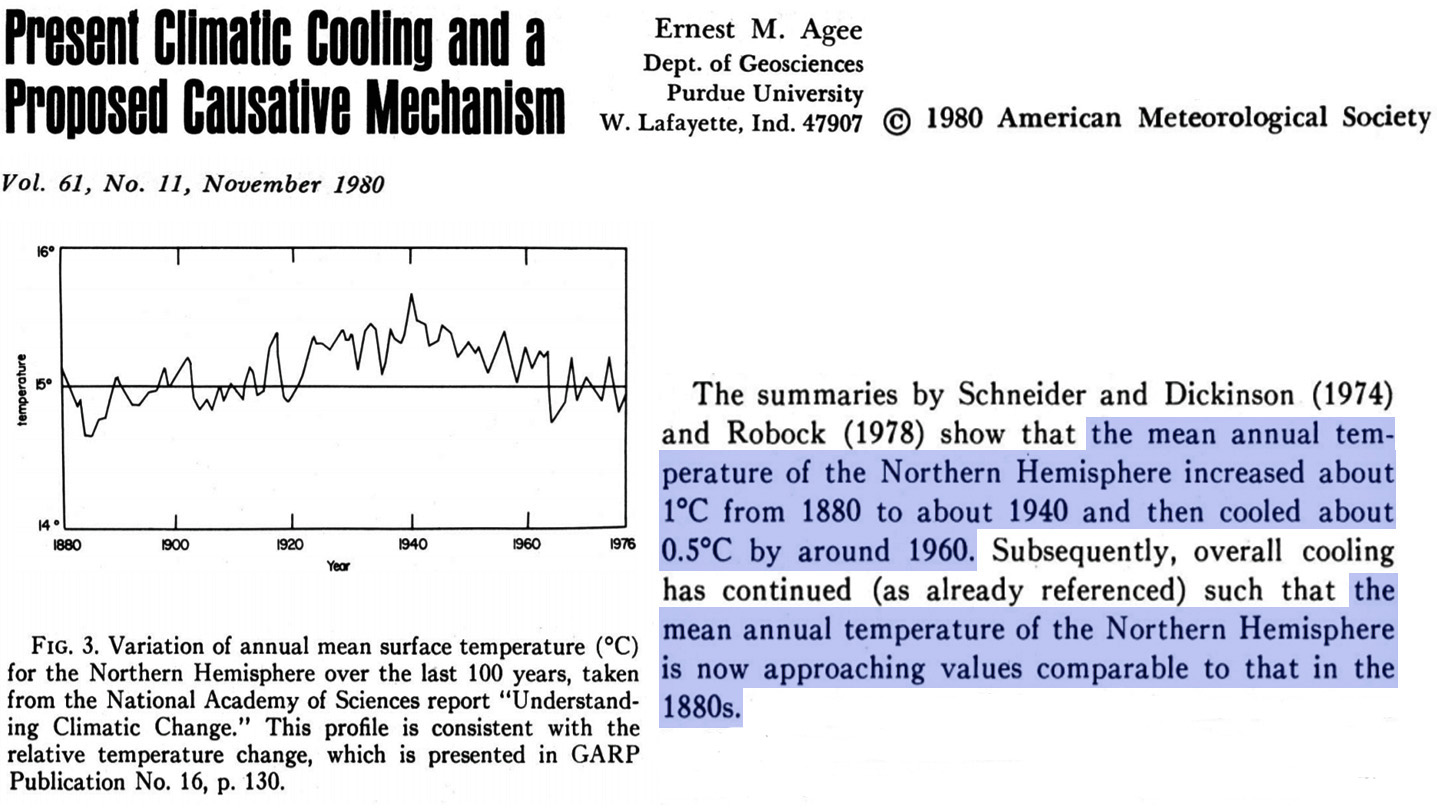
The summaries by Schneider and Dickinson (1974) and Robock (1978) show that the mean annual temperature of the Northern Hemisphere increased about 1°C from 1880 to about 1940 and then cooled about 0.5°C by around 1960. Subsequently, overall cooling has continued (as already referenced) such that the mean annual temperature of the Northern Hemisphere is now approaching values comparable to that in the 1880s. This present cooling trend has also been shown by Williams and Van Loon (1976) for the region 15°-80°N, and amounts to -0.26°C for the period 1942-72. A critical consideration, as they state, is the role (if any) played by the tropics and the Southern Hemisphere to counterbalance this cooling. Nonetheless, the evidence the seems clear that above 15°N the Northern Hemisphere is experiencing a significant climate cooling trend, and the apparent controversy over warming or cooling (or neither) should not exist. In passing, the work by Lorenz (1968, 1970, 1976, 1979) deserves further notice, namely that “climatic change” might just be the natural variations due to the complex non-linear interactions among various components of the climate system.
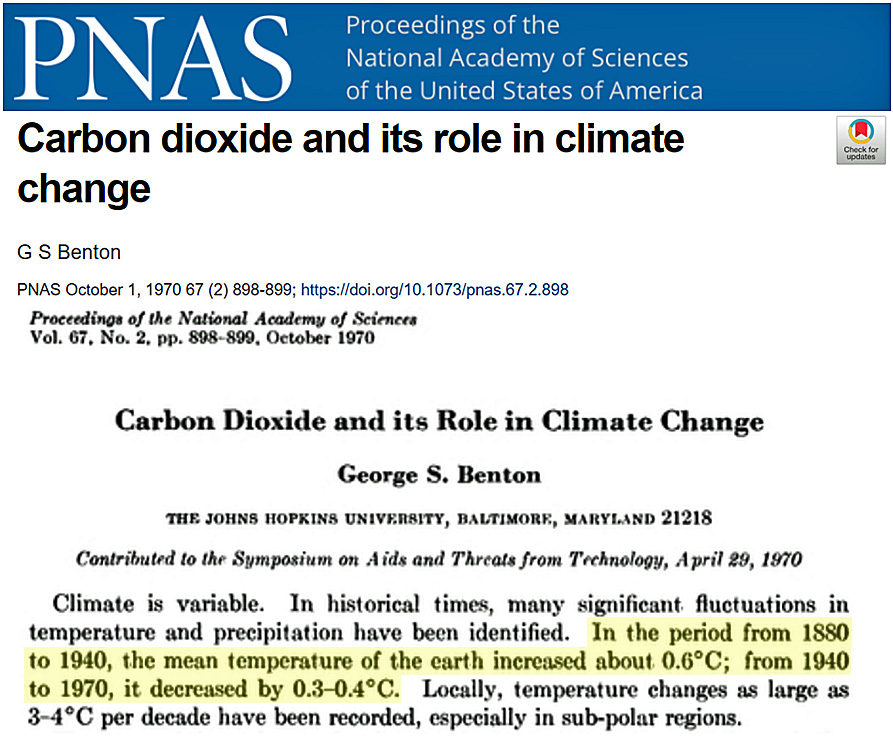
6. Benton, 1970 Climate is variable. In historical times, many significant fluctuations in temperature and precipitation have been identified. In the period from 1880 to 1940, the mean temperature of the earth increased about 0.6°C; from 1940 to 1970, it decreased by 0.3-0.4°C. Locally, temperature changes as large as 3-4°C per decade have been recorded, especially in sub-polar regions. … The drop in the earth’s temperature since 1940 has been paralleled by a substantial increase in natural volcanism. The effect of such volcanic activity is probably greater than the effect of manmade pollutants.
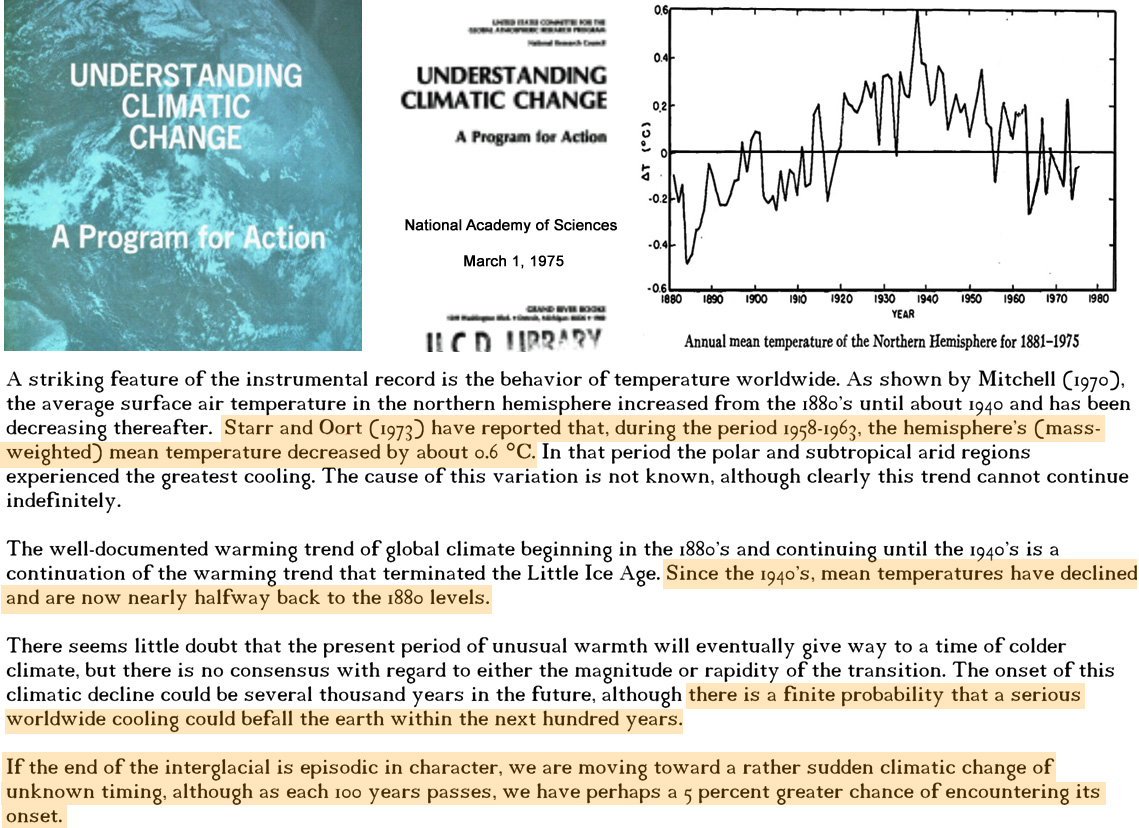
7. National Academy of Science, 1975 A striking feature of the instrumental record is the behavior of temperature worldwide. As shown by Mitchell (1970), the average surface air temperature in the northern hemisphere increased from the 1880’s until about 1940 and has been decreasing thereafter. Starr and Oort (1973) have reported that, during the period 1958-1963, the hemisphere’s (mass-weighted) mean temperature decreased by about 0.6 °C. In that period the polar and subtropical arid regions experienced the greatest cooling. The cause of this variation is not known, although clearly this trend cannot continue indefinitely. … The well-documented warming trend of global climate beginning in the 1880’s and continuing until the 1940’s is a continuation of the warming trend that terminated the Little Ice Age. Since the 1940’s, mean temperatures have declined and are now nearly halfway back to the 1880 levels.
There seems little doubt that the present period of unusual warmth will eventually give way to a time of colder climate, but there is no consensus with regard to either the magnitude or rapidity of the transition. The onset of this climatic decline could be several thousand years in the future,although there is a finite probability that a serious worldwide cooling could befall the earth within the next hundred years. … If the end of the interglacial is episodic in character, we are moving toward a rather sudden climatic change of unknown timing, although as each 100 years passes, we have perhaps a 5 percent greater chance of encountering its [the next glacial’s] onset.
8. Hare, 1971 It is discouraging to have to start by admitting that future changes in the atmosphere may be the result of the inherent instability of the atmospheric circulation, and not of environmental changes that we can detect, and perhaps control. If the environmental forcing does not change, moreover, its effects may be masked by free internal fluctuation of opposite sign. Much of our research into the causes of post-climatic variation is based on the assumption that they are not so masked, just as we often assume that the atmosphere is deterministic and unique in behavior when we argue for bigger computers and bigger appropriations. … Explaining past climates and predicting future climates are complementary processes. As Murray Mitchell pointed out, also at Boulder (Mitchell, 1968), we are miles away from explaining the past, whose record is so blurred that there remain open “many degrees of freedom for the construction of altogether new hypotheses.” He laid stress where I shall place it today — on the view that explaining climatic variation must rest on an adequate theory of existing climate. Until we can argue backwards and forwards in time from such a secure foundation we shall continue to be the blind led by the blind.
[M]ost recent years of hemispheric surface temperatures (Mitchell, 1970) show rises of about 0.6C over the 0-80N belt between 1880 and 1940, followed by a subsequent decline to current temperatures about 0.3C above 1880. The Southern Hemisphere seems to be in phase [with the Northern Hemisphere], but amplitudes are rather smaller. There have probably been small, corresponding changes in sea temperatures. Precisely what the fluctuations reflect is not clear, though they mean large changes in stored energy. … Recent debates have been about the relative effectiveness of dust and carbon dioxide influences … It is clear, however, that sound meteorological estimates of the troposphere and surface warming to be expected from this increase [in CO2] (e.g., Manabe and Wetherland, 1967) do not account for the observed temperatures variations. The rise between 1880 and 1940 was much greater than the computed carbon dioxide effect, and since 1940 temperatures have actually fallen as the rise in [CO2] mixing ratio accelerated.
The second hypothesis much in vogue — that the cooling is due to widespread atmospheric turbidity — derives from this fact. There have been reports of substantial increases in turbidity … [which] have greatly accelerated in recent years … There has also been an upsurge in vulcanism since 1948, after a 30-year period of quiet (Lamb, quoted by Mitchell, 1970). The unfortunate lack of systematic observations of dustiness … makes precision impossible … It seems clear that the observed turbidity increases are real, and are effective in lowering temperatures; moreover, they are due in some part to human interference. Quantitative estimates, however, are not yet really credible.
9. Gribbin, 1975 A recent flurry of papers has provided further evidence for the belief that the Earth is cooling. There now seems to be little doubt that changes over the past few years are more than a minor statistical fluctuation. … On page 45 of this issue of Nature, Wahl and Bryson compare recent sea surface temperature patterns with those of cooler regimes in the past, and conclude that over the period from 1951 to 1972 there was a decline corresponding “to a return of about one-sixth of the way to full ice age.” … The observed cooling corresponds to a re-establishment of the ‘Little Ice Age’ which persisted for several hundred years up to the end of the nineteenth century; it may be that all that has happened since 1950 is that the unusually mild spell of the first part of this century has ended.
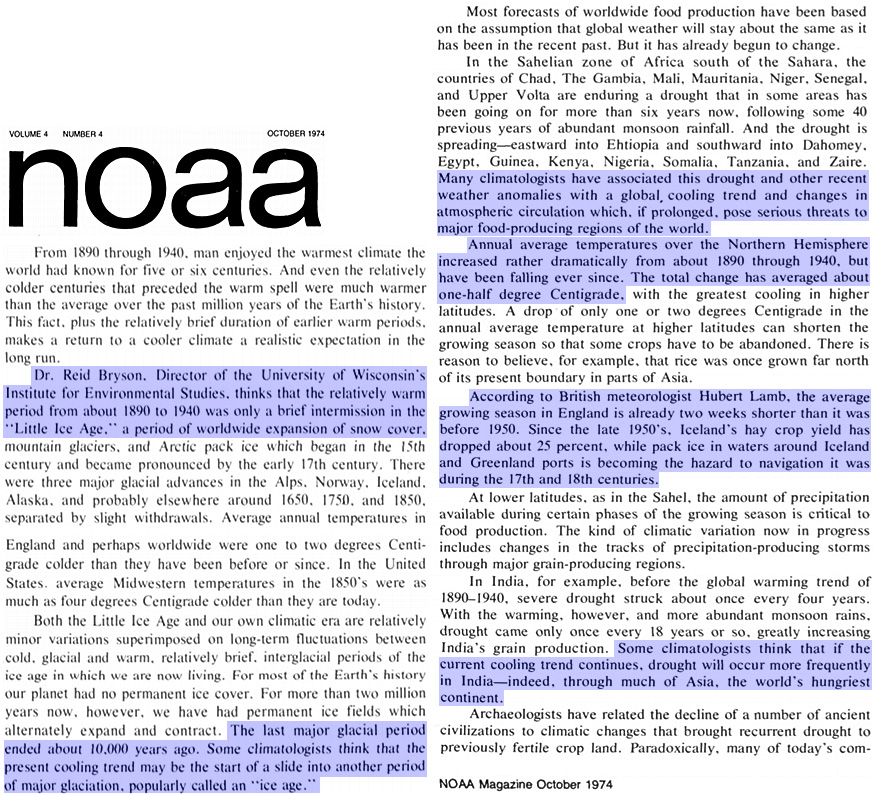
10. NOAA, 1974 In the Sahelian zone of Africa south of the Sahara, the countries of Chad, The Gambia, Mali, Mauritania, Niger, Senegal, and Upper Volta are enduring a drought that in some areas has been going on for more than six years now, following some 40 previous years of abundant monsoon rainfall. And the drought is spreading—eastward into Ehtiopia and southward into Dahomey, Egypt, Guinea, Kenya, Nigeria, Somalia, Tanzania, and Zaire. … Many climatologists have associated this drought and other recent weather anomalies with a global cooling trend and changes in atmospheric circulation which, if prolonged, pose serious threats to major food-producing regions of the world. … Annual average temperatures over the Northern Hemisphere increased rather dramatically from about 1890 through 1940, but have been falling ever since. The total change has averaged about one-half degree Centigrade, with the greatest cooling in higher latitudes. A drop of only one or two degrees Centigrade in the annual average temperature at higher latitudes can shorten the growing season so that some crops have to be abandoned. … [T]he average growing season in England is already two weeks shorter than it was before 1950. Since the late 1950’s, Iceland’s hay crop yield has dropped about 25 percent, while pack ice in waters around Iceland and Greenland ports is becoming the hazard to navigation it was during the 17th and 18th centuries. … Some climatologists think that if the current cooling trend continues, drought will occur more frequently in India—indeed, through much of Asia, the world’s hungriest continent. … Some climatologists think that the present cooling trend may be the start of a slide into another period of major glaciation, popularly called an “ice age.”
11. U.S. Central Intelligence Agency,1974 (1) “Potential Implications of Trends in World Population, Food Production, and Climate” According to Dr. Hubert Lamb–an outstanding British climatologist–22 out of 27 forecasting methods he examined predicted a cooling trend through the remainder of this century. A change of 2°-3° F. in average temperature would have an enormous impact. [pg. 28, bottom footnote] … A number of meteorological experts are thinking in terms of a return to a climate like that of the 19th century. This would mean that within a relatively few years (probably less than two decades, assuming the cooling trend began in the 1960’s) there would be brought belts of excess and deficit rainfall in the middle-latitudes; more frequent failure of the monsoons that dominate the Indian sub-continent, south China and western Africa; shorter growing seasons for Canada, northern Russia and north China. Europe could expect to be cooler and wetter. … [I]n periods when climate change [cooling] is underway, violent weather — unseasonal frosts, warm spells, large storms, floods, etc.–is thought to be more common. … Why has the earth cooled? There are three main factors involved affecting how much sunlight reaches the earth and how much is re-radiated into space: volcanic dust, man-made dust, and carbon dioxide . The transparency of the atmosphere to incoming sunlight and heat is affected by dust. The main variable sources of dust are volcanic activity and man-made pollution. In the early part of this century, volcanic activity decreased markedly and this increased transparency; temperatures rose. Bryson estimates that transparency was little affected by man’s activities until about 1930 but that since then, man-caused dust has increased rapidly. And, since the mid-1950’s volcanic activity has again become important.
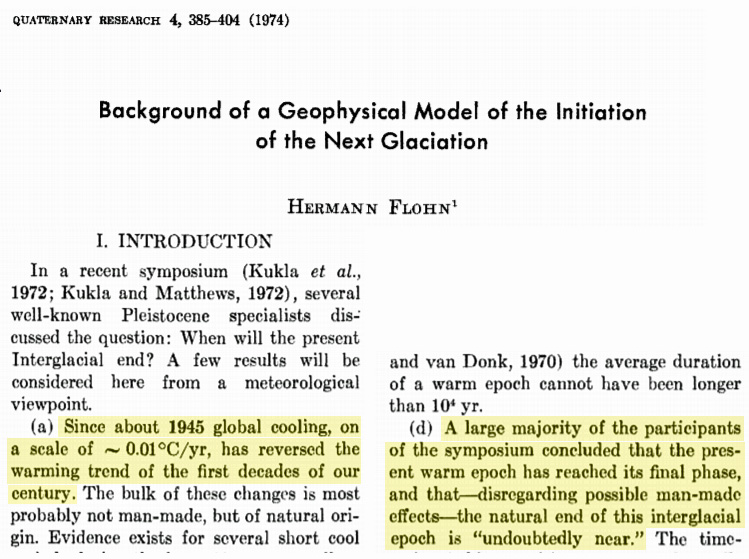
12. Flohn, 1974 Since about 1945 [to 1974], global cooling, on a scale of -0.01°C/yr [-0.3°C total], has reversed the warming trend of the first decades of our century. The bulk of these changes is probably not man-made, but of natural origin. … A large majority of the participants of the symposium concluded that the present warm epoch has reached its final phase, and that—disregarding possible man-made variations are comparable in scale with the effects–the natural end of this interglacial epoch is “undoubtedly near”.
13. Stewart and Glantz, 1985 (full paper) The conclusions of the NDU study might have been predicted from a knowledge of the prevailing ‘spirit of the times’ (i.e., the prevailing mood in the science community) when the first part was conducted. This was an interesting time in recent history of climate studies. One could effectively argue that in the early 1970s the prevailing view was that the earth was moving toward a new ice age. Many articles appeared in the scientific literature as well as in the popular press speculating about the impact on agriculture of a 1-2°C cooling. By the late 1970s that prevailing view had seemingly shifted 180 degrees to the belief that the earth’s atmosphere was being warmed as a result of an increasing CO2 loading of the atmosphere. … The causes of global climate change remain in dispute. Existing theories of climate, atmospheric models, and actuarial experience are inadequate to meet the needs of policymakers for information about future climate. In the long run, research may lead to reliable forecasts of climate. For the present, however, policymakers have no recourse but to heed expert judgments – subjective and contradictory though they may be – about future world climate and its effects on agriculture and other sectors of the economy. Informed, expert judgments on the likelihood of change, or the odds for a repetition of some event, are useful to the decisionmaker weighing the costs, benefits, and risks of alternative policies (NDU, 1978. p. ix).
14. Curry, 1969 At least four major periods of increased mean snowfall and cooler, cloudier summers during the last 10,000 years resulted in four periods of multiple glacial advance in the Sierra Nevada. These occurred (1) between 6000 and 7000 years ago, (2) between 2000 and 2600 years ago, (3) around 1000 years ago, and (4) between 650 years ago and the present. The latest major period of net accumulation and advance in all cirques that are presently occupied by residual glaciers occurred between 1880 and 1908 with a peak from 1895 to 1897. [By including the last 650 years to the present, the authors strongly imply that the present 1960s-era climate had not sufficiently warmed enough to be distinguished from the post-1400 AD Little Ice Age.]
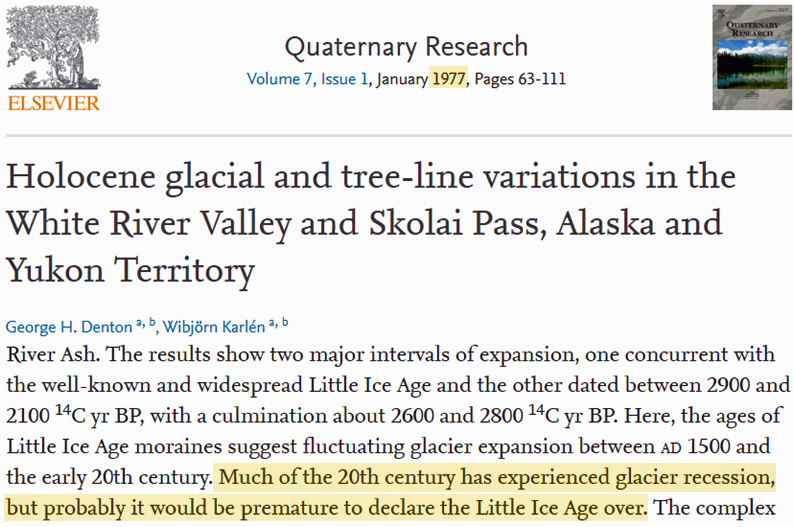
15. Denton and Karlén, 1977 Here, the ages of Little Ice Age moraines suggest fluctuating glacier expansion between ad 1500 and the early 20th century. Much of the 20th century has experienced glacier recession, but probably it would be premature to declare the Little Ice Age over. The complex moraine systems of the older expansion interval lie immediately downvalley from Little Ice Age moraines, suggesting that the two expansion intervals represent similar events in the Holocene, and hence that the Little Ice Age is not unique.
16. Denton and Karlén, 1973 Viewed as a whole, therefore, the Holocene experienced alternating intervals of glacier expansion and contraction that probably were superimposed on the broad climatic trends recognized in pollen profiles and deep-sea cores. Expansion intervals lasted up to 900 yr and contraction intervals up to 1750 yr. Dates of glacial maxima indicate that the major Holocene intervals of expansion peaked at about 200–330, 2800, and 5300 calendar yr BP, suggesting a recurrence of major glacier activity about each 2500 yr. … Moreover, comparison of presumed analogues such as the Little Ice Age and the Younger Dryas, or the Alleröd and the Roman Empire-Middle Ages warm interval, show marked similarities. These results suggest that a recurring pattern of minor climatic variations, with a dominant overprint of cold intervals peaking about each 2500 yr, was superimposed on long-term Holocene and Late-Wisconsin climatic trends. Should this pattern continue to repeat itself, the [ongoing, current] Little Ice Age will be succeeded within the next few centuries by a long interval of milder climates similar to those of the Roman Empire and Middle Ages. … The most prominent explanation of short-term C14 variations involves modulation of the galactic cosmic-ray flux by varying solar corpuscular activity. If this explanation proves valid and if the solar constant can be shown to vary with corpuscular output, it would suggest that Holocene glacier and climatic fluctuations, because of their close correlation with short-term C14 variations, were caused by varying solar activity. [The use of future tense in the statement that the Little Ice Age “will be succeeded within the next few centuries by a long interval of milder climates” similar to the Medieval and Roman Warm Periods strongly implies that the authors did not agree that modern (1970s) climate had sufficiently emerged from the Little Ice Age to yet qualify as a warm interval , and that it might be a “few centuries” before this warm period might commence.]
17. Potter et al., 1981 Sagan et al. have suggested that the cumulative impact of anthropogenic albedo changes may have contributed to global climate changes [cooling] in the past and that its effect may be continuing. Using a statistical dynamic climate model (SDM) with more realistic surface albedo changes than previously used, we have computed the combined impact of desertification of the Sahara and deforestation of the tropical rain forest. While the model computed a surface cooling of 0.6 K for the Northern Hemisphere, the global mean of ~0.2 K was substantially less than the 1 K [of anthropogenic global cooling] suggested by Sagan et al. We infer that man’s cumulative impact on planetary surface albedo over the past few thousand years has had a small and probably undetectable effect on global climate.
18. Brinkmann, 1979 Introduction: Concern about the impact of the recent downward trend in the average surface temperature for the ‘Northern Hemisphere’ (Reitan, 1974; Angell and Korshover, 1975) on the world food supply has led to an increasing interest in possible changes in the length of the growing season (NRC, 1976; NRC, 1977). There is also concern over possible increases in weather variability and its impact on food supply (Thompson, 1975). Increased variability has been proposed to be linked to hemispheric cooling and associated amplification of the circumpolar wave pattern which would cause greater extremes in weather (Bryson, 1975; Lamb, 1975). Most studies of climatic variability have been concerned with variance on the monthly, season, and annual scale (van Loon and Williams, 1978; Ratcliffe et al., 1978). But it is also possible that the variability of daily temperatures is changing, which could affect the length of the growing season. An increase in the magnitude and/or frequency of very low daily minimum temperatures, for instance, could result in a later onset of the ‘freeze free’ season and an earlier end.
19. Wright, 1972 The Holocene has already run a course of at least 10,000 yr. If it is like earlier interglacials, it will end soon, giving way to gradually developing cold conditions, which may not lead to glacial maxima for tens of thousands of years.
20. U.S. Central Intelligence Agency, 1974 (2) “A Study of Climatological Research as it Pertains to Intelligence Problems” The western world’s leading climatologists have confirmed recent reports of a detrimental global climate change. The stability of most nations is based upon a dependable source of food, but this stability will not be possible under the new climatic era. A forecast by the University of Wisconsin projects that the earth’s climate is returning to that of the neo-boreal era (1600-1850) – an era of drought, famine, and political unrest in the western world [the Little Ice Age]. … The world is returning to the type of climate which has existed over the last 400 years. That is, the abnormal climate of agricultural-optimum is being replaced by a normal climate of the neo-boreal era.
The climate change [global cooling] began in 1960, but no one including the climatologists recognized it. Crop failures in the Soviet Union and India during the first part of the sixties were attributed to the natural fluctuation of the weather [instead of global cooling]. India was supported by massive U.S. grain shipments that fed over 100 million people. To eat, the Soviets slaughtered their livestock, and Premier Nikita Khrushchev was quietly deposed. … During the remainder of the 1960s, the climate change remained hidden in those back washes of the world where death through starvation and disease were already a common occurrence. The six West African countries south of the Sahara…became the first victims of the climatic change [global cooling]. The failure of the African monsoon beginning in 1968 has driven those countries to the edge of economic and political ruin. They are now effectively wards of the United Nations and depend on the United States for a majority of their food supply. … Later, in the 1970s, one nation after another experienced the impact of the climatic change [global cooling]. The headlines from around the world told a story not fully understood or one we don’t want to face, such as: • Burma (March 1973) – little rice export due to drought • North Korea (March 1973) – record high grain import reflected poor 1972 harvest • Costa Rica and Honduras (1973) – worst drought in 50 years • United States (April 1973) -“flood of the century along the Great Lakes” • Japan (1973) – cold spell seriously damaged crops • Pakistan (March 1973) – Islam planned import of U.S. grain to off-set crop failure due to drought • North Vietnam (September 1973) – important crop damaged by heavy rains • Manila (March 1974) – millions in Asia face critical rice shortage • Ecuador (April 1974) – shortage of rice reaching crisis proportion; political repercussions could threaten its stability • USSR (June 1974) – poor weather threatens to reduce grain yields in the USSR • China (June 1974) – droughts and floods • India (June 1974) – monsoons late • United States (July 1974) – heavy rain and droughts cause record loss to potential bumper crop
Because of the global cooling trend, the lower edge of the circumpolar vortex has in recent years stayed farther south during the summer, in the position shown by the smaller band near the equator. It has kept the high pressure zones farther south too, blocking the monsoons out of regions where they are vital to the survival of hundreds of millions of people. At the same time, the vortex’s semistationary wave patterns have altered, affecting rainfall patterns in temperate regions and making the climate more variable. The deeper wave over the U.S., for example, is believed responsible for recent cold winters in the West and mild ones in the East. The West has been subjected to north winds; the East, the return flow. Although some evidence exists that the cooling trend has affected wind patterns in the Southern Hemisphere as well, weather statistics are scanty.
Since the late 1960s, a number of foreboding climatic predictions has appeared in various climatic, meteorological, and geological periodicals, consistently following one of two themes. (1) A global climatic change was underway (2) This climatic change would create worldwide agriculture failures in the 1970s. … Early in the 1970s, a series of adverse climatic anomalies occurred: • The world’s snow and ice cover had increased by at least 10 to 15 percent. • In the eastern Canadian area of the Arctic Greenland, below normal temperatures were recorded for 19 consecutive months. Nothing like this had happened in the last 100 years. • The Moscow region suffered its worst drought in three to five hundred years. • Drought occurred in Central America, the sub-Sahara, South Asia, China, and Australia. • Massive floods took place in the midwestern United States … Within a single year, adversity had visited almost every nation on the globe. … With global climatic-induced agricultural failures of the early 1970s, the stability of many governments has been seriously threatened. Many governments have gone to great lengths to hide their agricultural predicaments from other countries as well as from their own people. It has become increasingly imperative to determine whether 1972 was an isolated even or – as the climatologists predicted – a major shift in the world’s climate.
21. Robock, 1978 Instrumental surface temperature records have been compiled for large portions of the globe for about the past 100 years (Mitchell, 1961; Budyko, 1969). They show that the Northern Hemisphere annual mean temperature has risen about 1°C from 1880 to about 1940 and has fallen about 0.5 °C since then (Figs. 1-3). Various attempts to simulate this temperature record (Schneider and Mass, 1975; Pollack et at., 1976; Bryson and Dittberner, 1976) have all focused on external causes, such as volcanic dust, solar constant variations and anthropogenic effects. It is possible, however, that even in the absence of any external forcing a unique climate may not exist. Climate change may be a natural internal feature of the land-oceanic-atmosphere (climate) system. … Three runs were made testing anthropogenic effects of CO2, aerosols and heat. … One could sum the anthropogenic effects for each region, which would show almost no effect in the NH and warming in the SH. Drawing conclusions from this exercise would not be meaningful, however, due to our lack of understanding of the aerosol effect. All the effects almost double every 20 years. They are not of sufficient magnitude to have much effect on the observational records, which end about 1960, but may have a measurable effect in the near future. The relative magnitudes of the effects may change in the future due to changing human pollution policies. Restrictions on particulate pollution and anticipated measures against sulfate aerosols will lessen the effects of industrial aerosols. Increased dependence on nuclear energy would increase the ratio of heat to CO2 effect, while an increased dependence on coal would not. … Because the magnitudes of the effects are small, and may cancel, it cannot be concluded that these high correlations show that man has produced climate change.
22. Magill, 1980 Recent anomaloous weather conditions of the 1970s have revealed the possibility that significant aberrations in global climate have and are occurring with serious consequences. The 1970s have seen a generally overall greater variability and instability of global weather. Regions in Asia, Central America, and Africa have witnessed a higher frequency of monsoon failure which has led to a prevalence of severe drought conditions and an extension of desert boundaries. Whereas in other parts of the globe, severe flooding has been recorded. … Records of past climates have indicated that a greater variability of climate is generally synonymous with a major cooling trend in temperatures. … [A] general consensus that a major upheaval in climate is taking place. …There is no way of determining, however, whether or not the world is entering into another major ice age or if the present cooling of temperatures is simply a pause in the warming trend that began in the mid-1800s. At present, insufficient knowledge is available on the delicate balance among the various interacting factors controlling climate to determine precisely the future course of climate.
23. Bryson and Wendland, 1975 The trend of world temperature in this century appears to be directly related to the trends of atmospheric carbon dioxide content and atmospheric turbidity (dustiness). Both are believed by various scholars to be related to human activities. Since 1940, the effect of the rapid rise of atmospheric turbidity appears to have exceeded the effect of rising carbon dioxide, resulting in a rapid downward trend of temperature. There is no indication that these trends will be reversed, and there is some reason to believe that man-made pollution will have an increased effect in the future.
24. Karl et al., 1984 An appreciable number of nonurban stations in the United States and Canada have been identified with statistically significant (at the 90% level) decreasing trends in the monthly mean diurnal temperature range between 1941–80. The percentage of stations in the network showing the decrease is higher than expected due to chance throughout the year, with a maximum reached during late summer and early autumn and a minimum in December. Monte Carlo tests indicate that during five months the field significance of the decreasing range is above the 99% level, and in 12 months above the 95% level. There is a negligible probability that such a result is due to chance. … The physical mechanism responsible for the observed decrease in the diurnal range is not known. Possible explanations include greenhouse effects such as changes in cloudiness, aerosol loading, atmospheric water vapor content, or carbon dioxide.
25. Hoffert and Flannery, 1985 Introduction: As described m ore fully in the accompanying state-of-the-art report on the Detecting the Climatic Effects of Increasing Carbon Dioxide (see Chapter 4 by Wigley et al. 1985), there is no clear indication of a monotonic warming over this period [1880-1980], as would be anticipated from the observed build up of CO2 in the atmosphere. Instead, these data sets indicate a complex picture including interannual variability and, perhaps, some systematic trends. Indeed, the global temperatures seem to have increased from 1885- 1935, and the extent of Arctic sea ice decreased from 1925-1945. This was followed, however, by a leveling off and then a subsequent decrease in temperature. Although it is possible that the data sets are incomplete, these surface air temperatures do not appear to display the monotonic increase in global mean temperatures predicted by CO2-driven climate models. This does not necessarily mean an absence of an effect thus far, because the superposition of climatic variability from other ay obscure the signal. Among other things, therefore, transient climate models are needed to address whether historical records are consistent with predictions of past warming from increasing CO2 concentrations, as well as where and when a climate change is likely to be observed in the future.
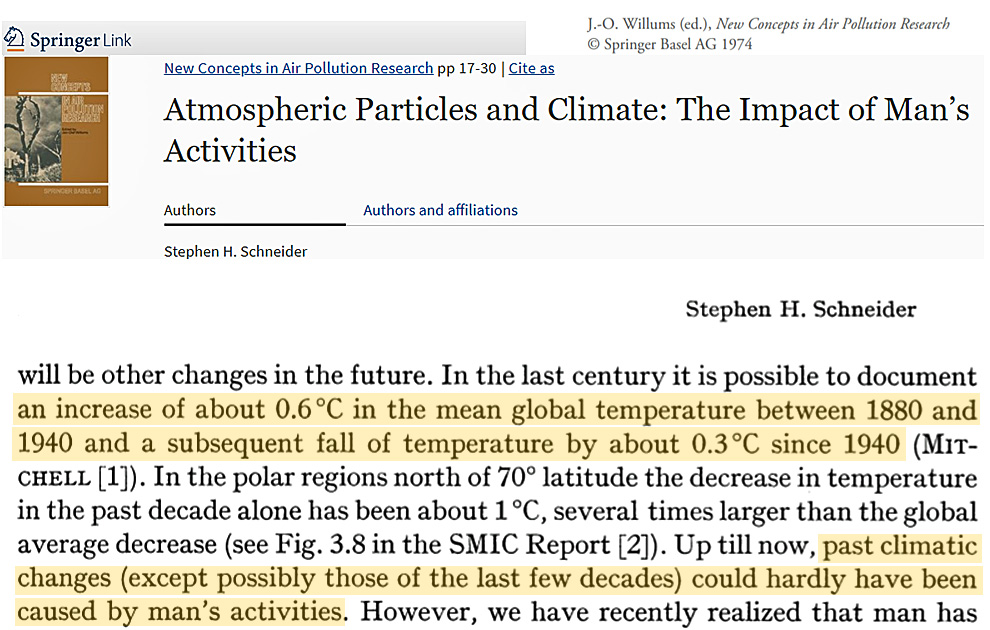
 26. Schneider, 1974 In the last century it is possible to document an increase of about 0.6°C in the mean global temperature between 1880 and 1940 and a subsequent fall of temperature by about 0.3°C since 1940. In the polar regions north of 70° latitude the decrease in temperature in the past decade alone has been about 1°C, several times larger than the global average decrease (see Fig. 3.8 in the SMIC Report). Up till now, past climatic changes (except possibly those of the last few decades [of cooling temperatures]) could hardly have been caused by man’s activities. However, we have recently realized that man has altered the face of the earth and the composition of the atmosphere on such a large scale that his influence can no longer be ignored relative to nature’s. … Two of the most publicized means by which it is thought man could influence climate are related to the dumping of CO2 and ‘dust’ particles (or gases such as SO2 which are subsequently converted to atmospheric particles) into the atmosphere, from activities that are usually associated with the burning of fossil fuels. … Some scientists already feel that particles might be responsible for the recently observed decrease in the earth’s temperature.
27. Bradley and Miller, 1972 The climatic warming trend since the 1880s, which seems to have been global in extent and was manifested by an upward trend in mean annual (and particularly mean winter) temperatures, seems to have given way since the 1940s to a cooling trend, which is most marked in higher latitudes.
28. Collis, 1975 It is not clear how such favorable and relatively consistent conditions are related to the higher temperatures in this century or the peaking of temperatures around 1940. The reversal of this warming trend, however, could mark the beginning of a new ice age as some climatologists have indicated. It should be noted, though, that even if we are in fact heading for another ice age, many years or decades will elapse before this will become apparent.
29. Haber, 1974 A meteorologist and Director of the Institute for Environmental Studies at the University of Wisconsin, Dr. Bryson believes that the Earth is moving toward an inevitable climate change; the consequences, he says, are already being felt – tragically – in the drought-plagued belt of West Africa called the Sahel. The global climate will become cooler, Bryson predicts, the pattern of rainfall will change, and a southward movement of the subtropical deserts will take place. Since rainfall and climate affect crop growth, since crop growth affects food supply, and since food supply affects life itself, Bryson’s prediction may be of paramount importance to mankind. The drought that has gripped West Africa since the late 1960s is just one reminder that climate cannot be taken for granted. There is little “green” on present-day Greenland, but sedimentary remains, deep below the thick slab of ice that blankets four-fifths of the island, reveal prehistoric existence of oak and chestnut trees and other forms of verdure. In northern Europe, deposits formed 40,000 years ago include fossils of palms and other plants associated with warmer climes.
30. Ghil, 1975 We turn now to the question of which features of atmospheric phenomena are “most important.” Certainly temperature is one of them …. Also humidity, wind direction and intensity, cloud amount and precipitation, all play a major role in determining what is perceived as weather and hence should be time-averaged (and, possibly, space-averaged) into climate. … Some attribute the assumed decreases in solar radiation to changes in the parameters of the motions of our planet (Milankovitch, 1969), others to airborne volcanic dust due to an increase in volcanic activity (Fuchs and Patterson, 1947), and so on. There has also been a concern about a possible climatic catastrophe [global cooling] being imminent because of the increase in the quantity of industrial pollutants in the atmosphere (Rasool and Schneider, 1971). [CO2 not mentioned as a “most important” feature of atmospheric climate determinants.]
31. Wahl, 1968 A comparison of climatic data for the eastern United States from the 1830’s and 1840’s with the currently valid climatic normals indicates a distinctly cooler and, in some areas, wetter climate in the first half of the last century. The recently appearing trend to cooler conditions noticed here and elsewhere could be indicative of a return to the climatic character of those earlier years [1830s, 1840s]. … This penultimate climatic episode, called the “Neoboreal” by Baerreis and Bryson (1965) and also frequently referred to as the “Little Ice Age” (Brooks, 1951) apparently started during the middle of the 16th century at a time of glacial advances both in Europe and North America. It continued as a distinctly cooler, and, in some regions, wetter period well into the 19th century. Following it was a warming trend that between 1880 and 1940 to 1950 became quite pronounced in very many regions of the Northern Hemisphere. During the last two decades there appears to be some evidence that this warming trend of the last 100 yr. has changed over recently to a distinct new deterioration of the climate, leading to conditions that in the 1960’s appear to approach those which were generally found around the turn of the century or even earlier, i.e. a return to the climatic character of the 19th century … A downward trend of the mean temperature, especially in early fall, will tend to increase the likelihood of early frosts (such as Wisconsin experienced in 1965 with some killing frost in lowlands on July 6) and thus may require changes in agricultural practices. One should not forget that an average decrease in mean monthly averages of about 4° is equivalent to a displacement of the isotherms by about 4° latitude or 250 to 300 mi., or to reaching a certain temperature threshold about 10 days earlier in fall.
32. Eichenlaub, 1970 Evidence suggests that lake effect snowfall has significantly increased during the past several decades, particularly in Southern Michigan and Northern Indiana. While the observed changes cannot be definitively ascribed to any single factor, it seems likely that a general cooling of winter temperatures may be partially responsible for this climatic change. [M]any of the snowfall time-series curves for the lake stations show downward trends during the 1920’s and 1930’s, at the height of the recent warm period, and the more recent snowfall increase has coincided with a general world-wide cooling which has occurred in the last several decades [1940s-1970s]. Recent evidence derived from [isotope] analysis of ice core samples on the Greenland ice cap indicates a continuance of this cooling trend for another 20 or 30 years [through the 1990s].
33. Budyko, 1969 To answer the question of in what way the climate will change in the future, it is necessary to establish the causes of Quaternary glaciations initiation and to determine the direction of their development. Numerous studies on this problem contain various and often contradictory hypotheses on the causes of glaciations. … [A] rise in temperature that began at the end of the last century stopped in about 1940, and a fall in temperature started. The temperature in the northern hemisphere that increased in the warming period by about 0.6oC then decreased by the middle of the fifties by 0.2oC. A compartively short-period rise in temperature with smaller amplitude was also observed in the last years of the [19th] century. … Thus, it seems probable that the present changes in the Earth’s temperature are determined mainly by the atmospheric transparency variations that depend on the level of volcanic activity.
34. Hughs, 1970 Convection in the Antarctic Ice Sheet Leading to a Surge of the Ice Sheet and Possibly to a New Ice Age … [A] surge of the ice sheet appears likely.
35. Fletcher, 1970 [F]rom about 1890 to 1940 the general but irregular trend was toward growing strength of the global atmospheric circulation, northward displacement of the polar fronts in both the atmosphere and the ocean, northward displacement of ice boundaries in both the arctic and antarctic, weaker development of anticylones over the continents and more northward cyclone paths. These dynamic changes were reflected by a dramatic warming of the arctic and of the North Atlantic, and aridity in the south central parts of North America and Eurasia. Conversely, recent decades have exhibited opposite trends: weakening planetary circulation, southward shifts of ice boundaries and cyclone paths and sharp cooling and different rainfall patterns over continents. … Less than 20,000 years ago the Wisconsin ice sheet covered North America from the Atlantic to the Pacific and was up to two miles thick. Most of this vast ice mass melted during the only a few thousand years, raising the level of the world ocean by several hundred feet. This warming culminated in a “climatic optimum” from about 4000-2000 B.C., during which world temperatures were four to five degrees warmer than they are now and rainfall patterns were very different. … [T]he secondary “climatic optimum” around 1000 A.D. [was] a period characterized by a relatively dry, warm and storn-free North Atlantic which permitted the great viking colonization of Greenland and Newfoundland. The decline, from about 1300 A.D., with one partial recovery from about 1400 to 1550, continued to about 1750, culminating in the “little ice age” of 1650-1840. During the cooling period, North Atlantic ice boundaries advanced and the Viking colonies were extinguished. The warming since the cooling climax of the 1700s continued irregularly up to the 1940s, when renewed cooling seems to have set in.
36. Thompson, 1975 A cooling trend in the world’s climate would have serious effects in the monsoon belts depending on whether or not the recent changes in snow and ice cover in the polar regions were responsible for the droughts in Africa and the failure of the monsoons over South Asia. The cooling and shrinking of the atmosphere at the higher latitudes is believed to have brought the subtropical anticyclones nearer to the tropical rainbelt and have caused a shifting of the monsoon belt. The regions that would be most severely affected by a continuation of the cooling trend to the year 2000 would be the higher latitudes (above 50 degrees) where spring wheat is grown and the warm band below 30 degrees latitude where rice is the principal grain crop.
37. Fletcher, 1968 Since the “little ice age” of 1650-1840, which climaxed the cooling trend from about 1300, a new warming trend predominated which seems to have reached a climax in the 1920’s, followed by cooling since about 1940, at first irregularly but then sharply since about 1960. The periods of general warming were accompanied by increasing vigor of the westerly zonal circulation in both hemispheres, bringing a more maritime climate to the continents, more northerly cyclone tracks and a pronounced warming of the Arctic. From 1890 to 1940 the mean thickness of Arctic pack ice decreased by more than 1/3rd (Ahlmann, 1945). Since about 1940 the reverse pattern has occurred, with weakened zonal circulation, greater development of blocking anticyclones over continents in winter, more variable and southerly cyclone paths, and a colder Arctic. … [T]he sharp global cooling of the past decade indicates that other factors are more influential than increasing CO2. For example, Moller (1953) estimates that a 10% change in CO2 can be compensated by a 3% change in water vapor or a 1% change in mean cloudiness. Moreover, the oceans have an enormous capacity to absorb CO2, which also varies with temperature; that is, colder oceans can store more CO2. Thus, warming oceans could be a primary cause of increasing CO2 in the atmosphere.
38. Schneider, 1978 In the short term (left) the temperature has risen by about 1/2 degree Celsius since the 1880s, and from the middle 1940s to the middle 1960s it dropped about 1/4 degree. What’s wrong with this picture is that there should be large error bars on it, because there are still vast regions of oceans not covered by thermometers.
39. Sanchez and Kutzbach, 1974 Departures of mean annual precipitation and temperature for the decade 1961–1970 from the 1931–1960 averages are illustrated on maps of the tropical and subtropical portions of the American continents. Certain features of midlatitude climatic anomalies appear to be associated with concurrent anomalies in the tropics. There is an apparent southward shift of circulation features in this longitudinal sector of both hemispheres. A review of selected literature on latitudinal climatic shifts and atmosphere-ocean interaction suggests some similarities between the patterns of climate in the 1960s and the climate of the Little Ice Age.
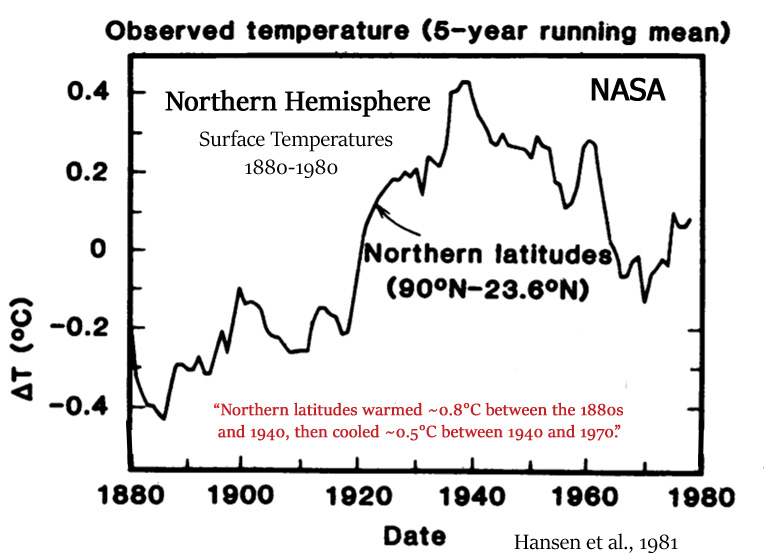
40. Hansen et al., 1981 (NASA) The major difficulty in accepting this theory has been the absence of observed warming coincident with the historic CO2 increase. In fact, the temperature in the Northern Hemisphere decreased by about 0.5°C between 1940 and 1970, a time of rapid CO2 buildup. … Northern latitudes warmed – 0.8°C between the 1880’s and 1940, then cooled – 0.5°C between 1940 and 1970, in agreement with other analyses.
41. Moran and Morgan, 1977 In Wisconsin, the growing season became cooler and shorter from 1958 into the mid-1960s. These trends accompanied a pronounced drop in the mean annual tropospheric temperature of the Northern Hemisphere. Although Northern-Hemispheric—tropospheric temperatures continued to fall (albeit at a lesser rate) from the mid-1960s through 1973, the growing season in Wisconsin showed a general trend toward lengthening and warming. In view of concern over the potential impact of climatic variation upon agriculture, these observations point out the need for a detailed examination of the modes of translation of hemispheric—tropospheric temperature trends to climatic changes at ground level, and at smaller temporal and spatial scales.
42. Gates, 1976 Recorded data show that from 1940 to the early 1970s the average temperature in the Northern Hemisphere slowly decreased, with a net cooling of approximately 1°F [-0.55 °C] over the continents and less cooling over the oceans. We also know that during the period from about 1890 to 1940 the air over at least the continents of the Northern Hemisphere underwent a gradual warming of over 1.5°F [+0.83°C]. … Whether such fluctuations are primarily the result of man’s activities or are only natural climatic variations remains an open question. … From historical records we also know that similar climate fluctuations have previously occurred over at least portions of the earth. The time around 1000 A.D., for example, was one of unusual warmth in the North Atlantic and European region and was characterized by relatively mild winters over a period of several hundred years. This has been called the climatic optimum, and it coincides with the period Viking exploration and settlement of Greenland and North America.
43. Andrews et al., 1972 Baffin Island is thus a critical area in which to monitor glaciologial and climatological changes. The processes that are involved may be taking the world toward the next full glaciation. … Mean summer temperatures have declined throughout the 1960s to a level cooler than for approximately 40 yr. … On a regional basis, winter precipitation has increased by more than 30% over the last 10 yr. Both the winter-warming trend and the increased precipitation are presumably related to a change in the frequency of southerly airflow types advecting warm moist air into the region. The net effect has been for heavier falls of snow in winter and with lower summer temperatures and therefore less melting (Jacobs et al, 1972), resulting in notably increased glacierization. … Recent field observations and comparisons with aerial photographs taken late in the ablation seasons of 1949 and 1960 provide verification of a recent climatic deterioration. … [A]t least two corries snowfree in 1960 are presently occupied by incipient glaciers. … The present Neoglacial ice is nearly as extensive as the late glacial stade.
44. Potter et al., 1975 Of the various mechanisms suggested by which man might change the planetary climate, the removal of tropical rain forests to increase arable acreage seems to be one of the more imminent. For this reason we selected this as one of the first problems to be tested in our recently updated climate model. Bearing in mind the fallibility of computer simulations, we find overall global cooling and a reduction in precipitation: a larger tropical reduction being almost balanced by a subtropical increase.
45. Allen et al., 1976 In recent decades, however, a general cooling has been apparent in high latitudes. In northeast Greenland this appears to have been of the order of 0.3°C for the period 1940 to 1959.
46. Ya-feng et al., 1978 Since the fifties the decline of temperature and the increase of precipitation have been the predominant trend in the western part of China. According to the dendroclimatological data obtained from several places, the declining temperature trend will continue till the end of this century or the beginning of the next [late 1990s to early 2000s]. From this we predict that the number of advancing glaciers may increase considerably in the days to come. But the relation between the fluctuations of glaciers and the changes of climate is very complex. The law ruling the fluctuations of glaciers is still left to a considerable extent to the systematic study and observation of us all.
47. Ložek, 1972 The dwindling formation of tufa spring deposits and their partial destruction both in occupied and unoccupied areas indicate that the Holocene warm interval is in the late phase. The recent slope deposits are reminiscent of early glacial sections both by their lithology and fauna reflecting existence of large open spaces. Whereas in early glacials the deforestation resulted from the change of climate, the recent one is almost entirely a product of man.
48. McCormick and Ludwig, 1967 Theoretical considerations and empirical evidence indicate that atmospheric turbidity, a function of aerosol loading, is an important factor in the heat balance of the earth-atmosphere system. Turbidity increase over the past few decades may be primarily responsible for the decrease in worldwide air temperatures since the 1940’s
49. Mitchell, 1971 Turning to the presumed effect of such large-scale background aerosol increases, a number of authors have called attention to the coincidence between these increases and a systematic decline of worldwide average temperature in the past two or three decades, and have considered the possibility of a causal connection between the two phenomena (McCormick and Ludwig, 1967; Bryson, 1968; Budyko, 1969; Bryson and Wendland, 1970; Mitchell, 1970). … With particular regard to the recent cooling trend of worldwide climate, the attribution of this cooling (or any significant part of it) to secular increases in atmospheric particles from human activities now appears unlikely, not merely on quantitative grounds (see Mitchell, 1970) but on qualitative grounds as well. Indeed, long-term increases of particulate pollution of the atmosphere by man may serve to augment, rather than oppose, other warming effects of human activities, such as the increasing carbon dioxide content and direct thermal pollution of the atmosphere. In that event the observed climatic cooling of the past quarter century emerges more persuasively than ever as a natural geophysical phenomenon, with man the innocent bystander.
50. Shultz and Hillerud, 1978 Kukla and associates (1977) presented “new data on climatic trends” and showed that during the last 30 years in the Northern Hemisphere, the oscillatory cooling has not yet reversed. Shultz (1972) reported on the northern migration of the armadillos and other southern vertebrates into the Kansas, Colorado and Nebraska region of the Great Plains during the 1930’s to 1950’s. Then there was a sudden reversal of the migration to the south during the 1960’s and 1970’s as cooling began to take place. The recent migrations, of course, were the result of minor climatic changes which often go unnoticed. Observations of the present climatic trends as well as those of the past are necessary if we are to interpret our environments of the future. We now know that climatic changes may happen at a more rapid rate than we had thought, but much more research must be done before accurate long-range climatic forecasting can be accomplished. Certainly man must be prepared to face climatic disasters and adjust to them.
51. Kukla and Gavin, 1981 Autumns in the Northern Hemisphere during the 1974–78 pentad were substantially cooler than in the pentad ending in 1938 [1934-’38]. Zonally averaged surface air temperature in October along latitude 80°N was 4.8°C lower, while summers were 0.6°C warmer. The recent pentad is cooler between 20 and 80°N in all seasons except spring when virtually no change was detected. The largest temperature difference was observed in autumn and winter in the high latitudes, which is a region of negative surface heat balance.
52. Norwine, 1977 Around 1900, a radically different climate stage set in, probably worldwide, one of warming (see Figure 1). … Well, all that was nice while it lasted, but a substantial cooling phase of deterioration has characterized the last 25 to 30 years
53. Reitan, 1974 Mean monthly temperatures for the Northern Hemisphere were determined for the years 1955 through 1968 following the same procedures used by H. C. Willett and J. M. Mitchell, Jr., in their studies of long-term trends. It was found that the downward trend they reported starting in the 1940s continued, though interrupted, into the 1960s. The temperature data when combined with radiation data and other components of the hemispheric energy budget led to the formulation of the response ratio, the relationship between change in incoming solar radiation and change in temperature. When this response ratio was applied to the reported trends in direct solar radiation and to the decrease in direct solar radiation following the eruption of Agung in 1963, a probable cause-effect relationship was suggested.
54. Schneider and Dickinson, 1974 [A]bout 1000 years ago a relatively mild period permitted Viking exploration of the North Atlantic region. Several hundred years later, at the onset of the ‘little ice age,’ the Norse colonies in Greenland were wiped out, and the historical chronicles tell of long harsh winters that brought suffering and deprivation to Europe. Milder climate has returned in modern times, but the optimum (warmest) condition occurred in the 1940’s, and since then, there has been a fairly rapid cooling in the high latitudes of the northern hemisphere. The relatively benign climate that we have taken for granted in the latter half of the twentieth century is not characteristic of all periods since the retreat of the ice age. … Climate-induced famine is even more serious today. Already, 6 consecutive years of drought have ravaged large populations in parts of central Africa known as the ‘Sahel.’ The drought has left millions of people near starvation, and the number of deaths approaches hundreds of thousands. There are hints that the situation may yet worsen [e.g., Winstanley, 1973; Bryson, 1973].
55. Kukla and Kukla, 1972 An insolation chronology is introduced here, which is based entirely on astronomic factors (on the so called Milankovitch mechanism of Earth orbital elements). It is independent of any geologic or geochronologic dating systems. Two alternating units comprise the insolation chronology. The positive insolation regime (PIR) is an episode defined by progressively increasing winter irradiation in the Northern Hemisphere, whereas the negative insolation regime (NIR) is an episode of progressively decreasing winter irradiation. … It is observed that the positive insolation regime designated as PIR 110, which started at 11,000 YBP, has ended recently. The new negative insolation regime, NIR 0/ + 8, will last for the next 8000 yr. Inasmuch within the last radiometrically dated 150,000 yr no NIR is known to correlate with generally warm interval, the prognosis is for a long-lasting global cooling more severe than any experienced hitherto by civilized mankind.
56. Sancetta et al., 1972 If the Eemian is taken as the analog of the present interglacial, a point in time 116,000 YBP becomes the historical model for today’s ocean, and the North Atlantic is now approaching a time of severe cooling.
57. Bodhaine and Pueshel, 1973 The effect of the atmospheric aerosol load on the earth’s climate has been of great concern during the past decade. McCormick and Ludwig (1967), Bryson (1968) and Mitchell (1970) suggested an increase of particulate loading would lead to a decrease in incoming solar radiation that would, in turn, lead to a general cooling of the earth’s temperature as observed during the past 30 years. Subsequently, other investigators (Charlson and PIlat, 1969; Mitchell, 1971) have suggested that the inclusion of the absorption effects of tropospheric aerosols could very well lead to a warming at the earth’s surface . It is generally agreed that stratospheric aerosols would lead to surface cooling, whereas uncertainty prevails about the consequences of an increase in tropospheric particulate loading. … Solar radiation has been monitored at Mauna Loa Observatory, Hawaii … since 1957. Since then there has been no significant change at Mauna Loa attributable to anthropogenic sources (Ellis and Pueschel, 1971).
58. King and Willis, 1975 Starr and Oort (1973) have made a comprehensive study of meteorological temperatures, using about 10 million individual measurements of temperature, to derive the average temperature of the bulk of the atmospheric mass in the northern hemisphere for each of the 60 months between May 1958 and April 1963. If the mean seasonal variation is subtracted from the monthly values to yield the residual temperatures, it is found that the spatially averaged temperature fell by about 0.60° C during the 5 years. A comparison of the temperatures with the monthly mean sunspot numbers during the same period suggests that the declining temperature trend may be associated with the decline in solar activity. This suggestion is supported by the fact that smoothed variations of temperature and sunspot number are both relatively flat during the first and last years of the 5-year period. Alternatively, it appears that Earth’s magnetic dipole is moving slowly into the northern hemisphere (Nagata, 1965) and the magnetic field is, on the average, gradually increasing there; this behavior may lead, in some unknown way, to the decrease of northern hemisphere meteorological temperatures.
59. Idso, 1982 A potential negative feedback relationship between atmospheric relative humidity and surface air temperature is described. Together with a recently proposed negative feedback mechanism involving atmospheric CO2, the phenomenon may be sufficient to prevent the global ice catastrophies which are a common prediction of many climate models following initial development of ice age conditions, and could well be of importance for the problem of the cool sun in Earth’s early history.
60. Chaston, 1980 Much of the Northern Hemisphere experienced a dramatic upsurge in snowfall during the 1970s as compared with the previoius decades. … Whether the “Snowy Seventies” heralded the dawn of a major cooling trend or is merely a temporary anomaly is highly debatable. One may ask fifty meteorologists for his/her opinion on climatic change and inevitably receive fifty differing opinions. This is why meteorology is so exciting: even with relatively advanced computer programs and the complete set of equations of motion of the atmosphere, we are far from truly understanding the mechanics of Mother Nature.
61. Ellsaesser, 1975 In recent years there have appeared a rash of papers claiming an upward trend in airborne particulates, which is presumed to have already reversed the alleged CO2 induced heating of the atmosphere observed between the 1880’s and 1940’s and to pose the further threat of inducing another ice age. Allusions to the trend have become so common that many authors now cite it as an accepted reality requiring neither qualification nor attribution by reference.
62. Arrigo, 1982 The decade of 1971-80 was 1.5°F cooler than 1931-40. The latest 40-year period of general cooling in annual values is a result of down trends in winter, summer, and fall seasonal temperatures
63. Lamb, 1966 The large-scale circulation of the atmosphere during the current decade has produced patterns that had never been seen earlier in this century, but which seem to represent a recurrence of a regime that prevailed over long periods before 1895. The decline of the temperature-zone westerlies and increased frequency of blocking in high latitudes have been associated with anomalies (or changes) of temperature and rainfall regime that are having serious effects in many parts of the world, and meteorology is being confronted with a demand for climatic forecasting for which no adequate scientific basis yet exists. Nevertheless, it is an urgent practical matter to take stock of the present climatic position and to assess the probability of the new climatic regime continuing –albeit subject to normal year-to-year and decade-to-decade variations. The investigation here reported of some of the gross features of world climatic behaviour since 1960 apparently discloses an abrupt return to conditions as they were before the well-known warming of climates in the early 20th century–indeed a reversal of the change of behaviour of the large-scale wind circulation that took place about 1895. Increased meridionality of the wind flow over extra-tropical latitudes has been accompanied by an opposite change in the intensified development of the narrow equatorial low-pressure zone. A few previous step-like changes of climate of similar magnitude can be found by surveying what is known of the climatic history of the last 1000 years, but they are rare and apparently never less than forty-fifty years (oftener 150-200 years) apart. On this evidence, something like the climatic regime of the years since 1960 should probably be expected to persist till the end of the century or beyond
64. Gordon, 1981 Lichenometric dating suggests that the maximum recent extent of cirque and small valley glaciers occurred before about A.D. 1850, although there is evidence for more extensive valley glacierization before about A.D. 1745. Between about 1850 and about 1968/69 progressive recession of the glaciers was interrupted by brief periods of reactivation during the 1880s, 1920s, and early 1940s. Since about 1968/69 the glacier fronts have advanced by up to 158 m following a marked climatic recession [cooling] during the 1960s and early 1970s. In general, fluctuations of the glaciers have been in sympathy with prevailing climatic trends and show a relatively rapid response following temperature changes and a lagged response of at least 9 yr following precipitation changes.
65. Starr and Oort, 1973 Between May 1958 and April 1963 the mean temperature of the atmosphere in the northern hemisphere fell by about 0.60° C. Each monthly mean temperature is based on about 150,000 to 200,000 measured temperatures.
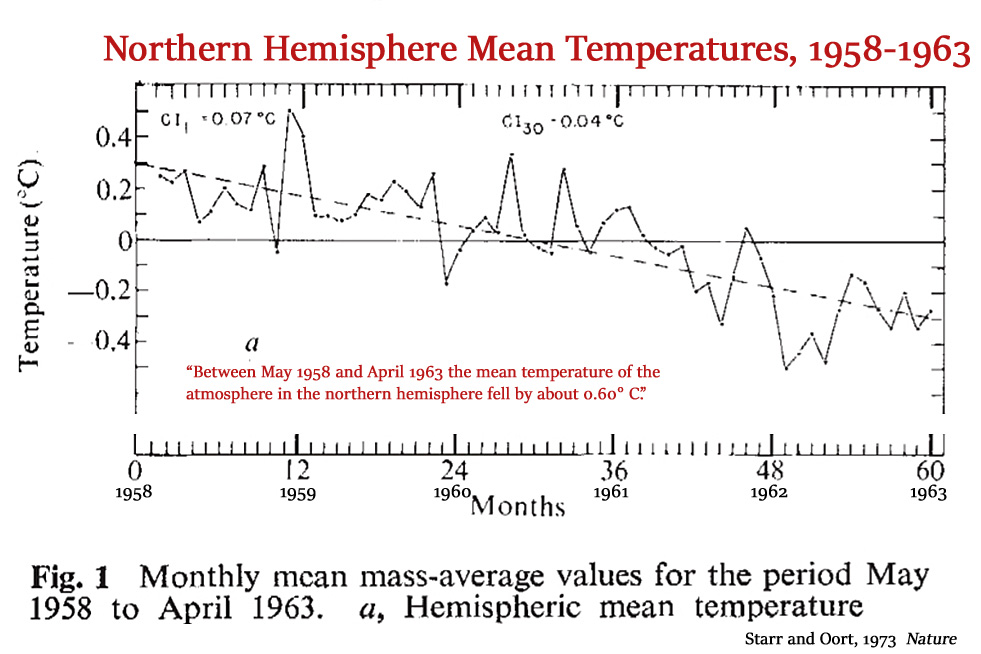
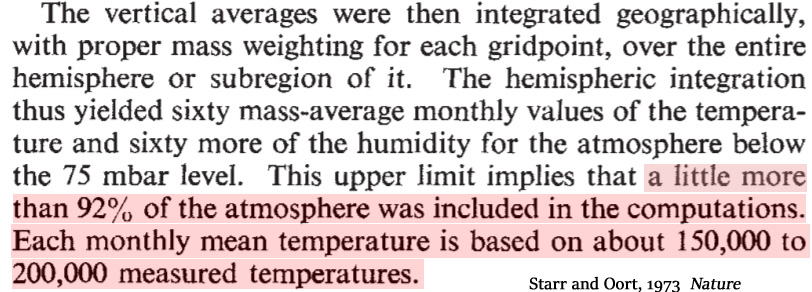
66. Stockton and Boggess, 1979 Van Loon and Williams (1976) suggest that regional trends in surface temperature are indeed connected with long wave circulation changes, that the greatest variations appear above 500 N. latitude, but that the changes may be compensated for in other regions. For example, during 1942-1972 there appears to have been a change of -1.4°C in the mean temperature above 600 N. latitude but this appears to have been offset by a +0.20°C change over the area between 300 N. to 300 S. latitude. Budyko and Asakura (in NAS, 1975) show that for the period 1880-1969, average temperature for the northern hemisphere attained a maximum around 1940 and decreased until 1969. More recent records, however, indicate the decrease has leveled off and during the last 5 years and there has actually been little change. Budyko-Asakura’s average temperature data for the northern hemisphere (Figure 2) shows the range of change between 1880 to 1940 to be approximately 1.1°C.
67. Barry, 1977 The dominant circulation regime over the Northern Hemisphere changed from meridional (north/south) to zonal (west/east) about 1917 (Dzerdzeevski and Sergin, 1972), giving rise to the observed warming trends, and this mode continued until the early 1950s, when a reversal [cooling] took place. … Cooling over the eastern Arctic in the summers of the 1960s was pronounced, leading to lower temperatures than for 30 to 40 years in Baffin Island. … [I]n the early 1970s there was evidence that snowbanks, identifiable on aerial photographs of the Cumberland Peninsula, Baffin Island, taken in 1959, had become much more extensive as a result of increased winter snowfall and reduced summer snowmelt. Although such growth may easily be reversed by a single warm summer, the pattern is suggestive of what may happen more persistently during a prolonged phase of climatic deterioration. The cooling observed over Baffin Island during the 1960s and early 1970s appears to be closely related to shifts in the standing waves in the hemispheric westerly circulation reported by Namias (1969, 1970). … Air reconnaissance data for the last two decades shows that between about 1963 and 1972 there was a significant increase in the severity of [sea] ice conditions for July through September in Baffin Bay (Dunbar, 1972). This apparently matches without any lag the cooling (up to 1972) in the eastern Canadian Arctic noted by Bradley and Miller (1972).
68. Wahl and Lawson, 1970 Lamb (1966) had already suggested that it appears likely that we have passed the height of the warming episode in the first half of this century and are now reverting to a pattern characterized by lower zonal flow and intensification of the trough/ridge systems, essentially a reestablishment of the climatic character of the last century.
69. Thompson, 1977 Recent theoretical studies (Pollack and others, 1976) and empirical evidence (Newell, 1970) indicated that variations in the concentration of particles in the atmosphere is an important component in the heat balance of the earth-atmosphere system. Some investigators (McCormick and Ludwig, 1967; Bryson, 1968; Rasool and Schneider, 1971) attributed the decrease in mean air temperatures of the northern hemisphere since the 1940’s to an increase in the atmospheric aerosol load. … Mitchell (1975) found a correlation between an increase in the quantity of volcanically-injected stratospheric material and a decrease in mean temperatures in the northern hemisphere for the period since 1880 A.D.
70. Absolon, 1972 The present assemblages of Ostracods in Central Europe resemble the assemblages known from the earliest phases of Holocene. This observation supports the view that the termination of the present warm interval is to be expected in the near future.
71. Lentfer, 1972 Several authors have presented data indicating that sections of the Arctic have experienced warming trends prior to about 1950 and have experienced cooling trends since that time. … The mean ice thickness was one-third less and the mean air temperature 4°C higher in 1937-40 than in 1893-96. Dorf (1960) quotes Willett (1950) who states that in Spitsbergen mean winter temperatures have risen about 8°C between 1910 and 1950. Dorf (1960) also quotes Ahlmann (1953) who reports ice free ports in Spitsbergen to be open to navigation about 7 months of the year as compared with only 3 months 50 years earlier. Mitchell (1965) states that world climate during the past century has been characterized by a warming trend from the 1880’s to the 1940’s. Thereafter, the warming trend appears to have given way to a cooling trend that has continued to at least 1960 with some evidence that it was continuing in 1965.
72. Palmer, 1973 This article reviews the information on the climatic effect of carbon dioxide and aerosols and outlines man’s part in contributing to their occurence. Recent downward trends in the average surface temperature of the biosphere has lead some scientists to conclude that albedo increases due to the effect of aerosol backscatter is the causative mechanism. While there is evidence for and against this hypothesis, this paper emphasizes that albedo changes due to aerosol modification of cloud cover may be a more significant mechanism for explaining temperature trends.
73. Angell and Korshover, 1977 Between 1958 and 1965 there was a significant cooling averaging about 0.3°C over much of the globe, but since 1965 the temperature variations have been small.
74. Bryson and Ross, 1977 The authors of this paper show, based on some examples from climatic history, that climate can change rapidly and that these changes can have drastic effects on world food production, as well as on other aspects of economic and cultural life. The historical examples are the Arctic expansions of around 1900 B.C. and A.D. 1200. The authors also describe a presently occurring Arctic [ice] expansion and its world-wide effects on climate to date.
75. Newell, 1974 Changes in the poleward energy flux by the atmosphere and ocean as a possible cause for ice ages … At present the ocean carries an appreciable fraction of the transport, for example about three-eighths at 30°N. In the cold mode it is suggested that the ocean carries less, and the atmosphere more, than at present. The between the modes is seen as a natural imbalance in the atmosphere-ocean energy budget with a gradual warming of the ocean during an Ice Age eventually cluminating in its termination. At the present the imbalance is thought to correspond to a natural cooling of the ocean, which will lead to the next Ice Age.
76. Wahl and Bryson, 1975 Recent changes in Atlantic surface temperatures … Rodewald recently published brief notes about the temperature measurements of the sea surface made by nine North Atlantic weather ships during the past two decades. His remarks were prompted by the regrettable fact that several of these ocean stations are being discontinued, a decision which will make it much more difficult to monitor the temperature trends in the North Atlantic. He presented average annual temperature values for overlapping 5-yr periods, showing a distinctive decrease of 0.56 °C from the 1951–55 period to the 1968–72 period
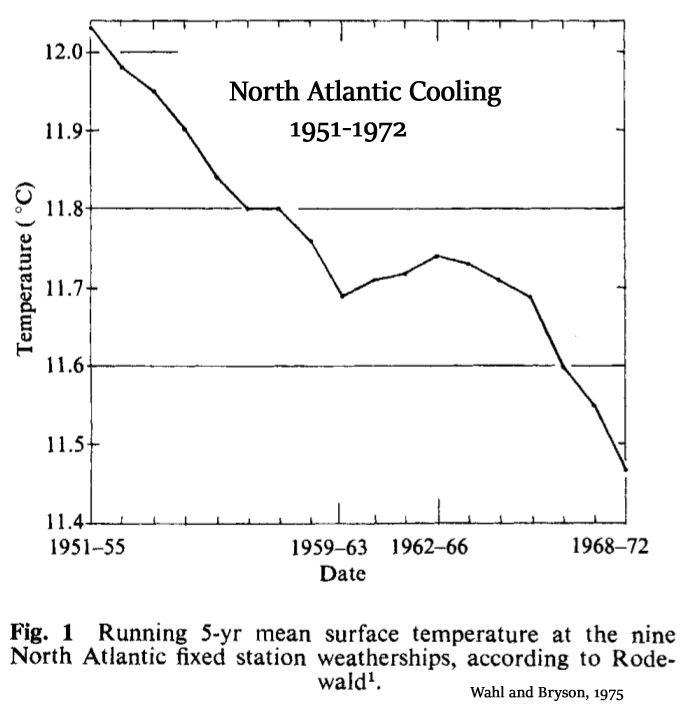
77. Gordon, 1980 Recent climatic trends in the Arctic have been characterised by a general cooling between the mid-1950s and the late-1960s, followed by a return to warmer conditions in the early 1970s (refs 1,2). Throughout the Canadian Arctic Archipelago and at Thule in north-west Greenland a marked decrease in summer temperature occurred after 1963, and winter precipitation increased. These changes were accompanied by a lowering of the average July freezing level height by as much as 500 m, decreased glacier mass loss and increased glaciation.
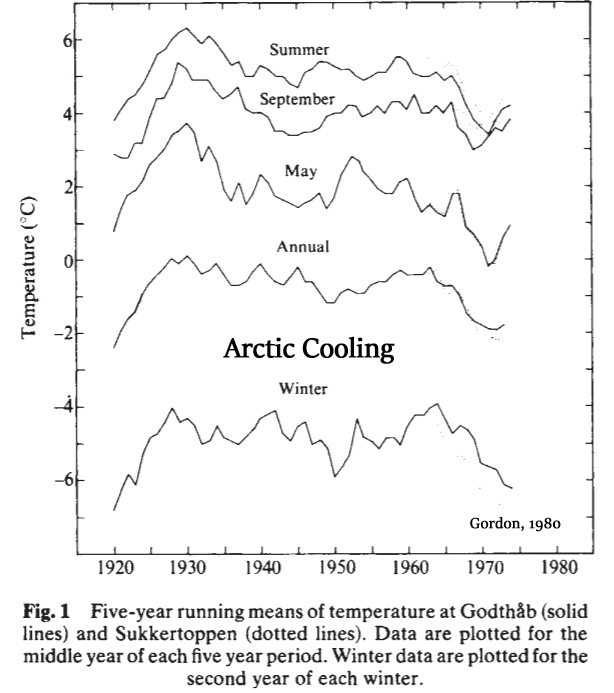
78. Williams, 1978 It has been suggested that the Laurentide Ice Sheet originated with extensive perennial snow cover, and that the snow cover affected climate so as to aid ice-sheet development. In this study, a large increase in extent of October 1st snow cover in the Canadian Arctic from 1967–1970 to 1971–1975 is compared to changes in October means of other climate variables. Over the area of snow-cover expansion, mean surface air temperature decreased by up to 3°C, mean 500-mbar height was lowered by over 60 m, and precipitation was increased by up to a factor of two. These effects, if applied to the entire summer, together with the temperature change computed by Shaw and Donn for a Northern Hemisphere summer insolation minimum (the Milankovich effect), can account for glacierization of the Central Canadian Arctic.
79. Barrett, 1971 Changes in concentration of those atmospheric constituents which contribute to the planetary albedo can give rise to climatic alterations. … These computations show that substantial depletions of irradiance can result from moderate to heavy particulate loadings, and that an increase in man-made particulate emissions by a factor of 50 or more could give rise to a general cooling of serious magnitude.
80. Mörner, 1972 When Will the Present Interglacial End? … We are now living under interglacial climatic conditions, the Present Interglacial of Flandrian Interglacial Age. It will certainly be followed by the Future Ice Age. … Several articles in this volume provide material strongly in favor of Alternative II of Fig 1. This would mean we are now rapidly approaching a future situation equivalent to the “Pre-Brörup Stadial” characterized by continental glaciation over Fennoscandia and the Kolar Peninsula and tundra or park-tundra conditions in most of the rest of Europe (the”Pre-S. Pierre Stadial” of North America was similarly characterized by continental glaciation over northeastern North America and alpine glaciations in the mountain regions of the West Coast).
81. Miles, 1978 The cooling of the Northern Hemisphere since 1940 has been variously interpreted as the overture to the next Ice Age, the effect of industrial pollution in the atmosphere or of a decline in the solar output. Are we in a position to judge between these various interpretations and to make a prediction for the next few decades? The link with the next Ice Age may be dismissed as a confusion of timescales; the explanation in terms of atmospheric pollution merits careful examination but seems unlikely to be adequate on its own. Natural fluctuations must also be considered.
82. Verma et al., 1984 Dewey and Heim (1981) have studied variations in N.H. [Northern Hemisphere] seasonal snow cover based on satellite observations and have found that there was an overall increase in snow-cover area from 1966 to 1980. They also noted that there has been a trend toward earlier, more extensive snow cover in the fall and slower ablation in the spring. Their observations are supported by the results of a model study conducted by Choudhary and Kukla (1979) where-in they noted that the addition of more CO2 to the atmosphere could significantly reduce the shortwave energy absorbed at snow and ice surfaces and thus delay the recrystallisation of snow and dissipation of pack-ice, resulting in a cooling rather than a warming effect. They additionally noted that this process may contribute to an extension of snow and ice seasons marked by delayed snowmelt in spring, and early snow deposition in autumn. Thus, during the last 3 decades, larger winter cooling anomalies, supported by observations and model studies, have greatly influenced the climate pattern – made it cooler and unstable.
83. Borisov, 1969 Soviet climatologists are vitally concerned with the problem of ameliorating [warming up] the climate of Siberia and other northern lands as a means of developing these regions for an expanding population. P. M. Borisov, a candidate in geographic sciences, Moscow, examines one means of warming the climate by the transport of Atlantic Ocean water across the Arctic Basin. This could be done by pumping water out of the Arctic Ocean at the Bering Strait, thus accelerating the flow of warmer Atlantic water into the basin. Flow direction would be controlled by means of a dam across the Bering Strait. Borisov predicts dramatic improvement in Arctic climate would result. [Climatologists were concerned/interested in warming the climate via geoengineering in 1969.]
84. Flecher, 1969 Since the “little ice age” of 1650-1840, which climaxed the cooling trend from about 1300, a new warming trend predominated which seems to have reached a climax in this century, followed by cooling since about 1940, at first irregularly but more sharply since about 1960.
SPECIFIC SCHEMES FOR CLIMATE MODIFICATION
Ice Free Arctic Ocean The largest scale enterprise that has been discussed is that of transforming the Arctic into an ice free ocean. As was noted earlier this has been most carefully studied by the staff of the Main Geophysical Observatory in Leningrad. … It is possible that the capacity of present technology may be sufficient to accomplish this task. but this has not been established. Three basic approaches have been proposed (Fletcher 1965): (1) influencing the surface reflectivity of the ice to cause more absorption of solar heat; (2) large scale modification of cloud conditions by seeding; (3) increasing the inflow of warm water from the Atlantic.
Bering Strait Dam Soviet engineer Borisov (1959, 1967) has been the most active proponent of the much publicized Bering Strait Dam. The basic idea is to increase the inflow of warm Atlantic water by stopping or oven reversing the present northward flow of colder water through Bering Strait. The dam would be 50 miles long and 150 feet high.
Deflecting the Kuroshio Current The Pacific Ocean counterpart of the Gulf Stream is the Kuroshio Current, a small branch of which enters the Sea of Japan and exits to the Pacific between the Japanese islands. It has been proposed that the narrow mouth of Tatarsk Strait be blocked by a giant “water valve” to increase the warm inflow to the Sea of Okhotsk and reduce the winter ice there.
[Scientists at the time were considering geoengineering “schemes” that may facilitate climate warming.]
85. Battan, 1970 This article give a brief review of Soviet articles on weather modification published since about 1964. … Budyko (1964) examined various questions dealing with climate modification. He noted that the melting of the arctic ice would have important effects on climate and stated that there are a number of ways by which the arctic ice cap can be annihilated. … When this happens, it is claimed, winters will become less severe, the growing season will be lengthened, the probability of early autumn and late spring frosts will be decreased, the number of arid years will be decreased and the northern boundary of many types of vegetation will be shifted northward. [Scientists proposing climate modifications (annihilating Arctic sea ice)to warm the planet and reap the benefits.]
86. Hollin, 1969 Wilson suggests that in the Pleistocene the surge coolings were sufficient to trigger the northern ice ages. If so, interglacial pollen profiles should show rapid but temporary marine transgressions beginning at the break of climate. Evidence suggesting such transgressions occurs in England and the United States, but is still insufficient to disprove explanations such as local downwarping. There is no evidence yet for surges in Wisconsin or Post-glacial time. There is some evidence that the Antarctic Ice Sheet is currently building up, but this could be a response to a Post-glacial accumulation increase rather than the prelude to a surge.
87. Holdren and Ehrlich, 1971 Global Ecology: Readings toward a rational strategy for man [pgs. 76,77] … It seems, however, that a competing effect has dominated the situation since 1940. This is the reduced transparency of the atmosphere to incoming light as a result of urban air pollution (smoke, aerosols), agricultural air pollution (dust), and volcanic ash. This screening phenomenon is said to be responsible for the present world cooling trend—a total of about .2°C in the world mean surface temperature over the past quarter century. This number seems small until it is realized that a decrease of only 4°C would probably be sufficient to start another ice age. Moreover, other effects besides simple screening by air pollution threaten to move us in the same direction. In particular, a mere one percent increase in low cloud cover would decrease the surface temperature by .8°C. We may be in the process of providing just such a cloud increase, and more, by adding man-made condensation nuclei to the atmosphere in the form of jet exhausts and other suitable pollutants. A final push in the cooling direction comes from man-made changes in the direct reflectivity of the earth’s surface (albedo) through urbanization, deforestation, and the enlargement of deserts. The effects of a new ice age on agriculture and the supportability of large human populations scarcely need elaboration here. Even more dramatic results are possible, however; for instance, a sudden outward slumping in the Antarctic ice cap, induced by added weight, could generate a tidal wave of proportions unprecedented in recorded history.
88. Kalnicky, 1974 The mean temperature for the Northern Hemisphere had a warming trend from 1890 to 1950 and a cooling trend since 1950. The eastern and central United States had colder temperatures in 1961–1970 than in 1931–1960.
89. Kotlyakov, 1980 His latest results (Kukla et al., 1977) indicate clearly a cooling of most of the Northern Hemisphere in the period from 1950 to 1975, reaching 0.1-0.2°C per decade (Fig. 3).
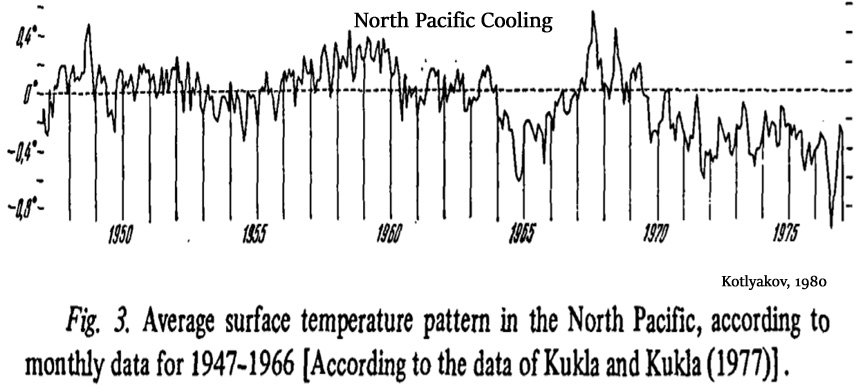
90. Yamamoto et al., 1977 Fluctuations of the global climate have been one of the most interesting problems in meteorology. Recently the concern for this problem is increasing in relation to the possible climatic impact by man-made global air [aerosol] pollution. … Several attempts to estimate global temperature conditions have been successfully made by the use of meteorological network data. With long-period data from more than 100 stations, Willett had obtained the zonal mean of the surface air temperature for respective 10-degree latitude zone, avoiding the overweight in region of dense networks, such as Europe and North America. With these zonal mean temperatures at each latitude, the global mean temperature was computed. By Willett’s method, Mitchell presented the trend of the global mean of the surface air temperature, which shows a warming from the decade of 1880 to that of 1940, and afterwards cooling.
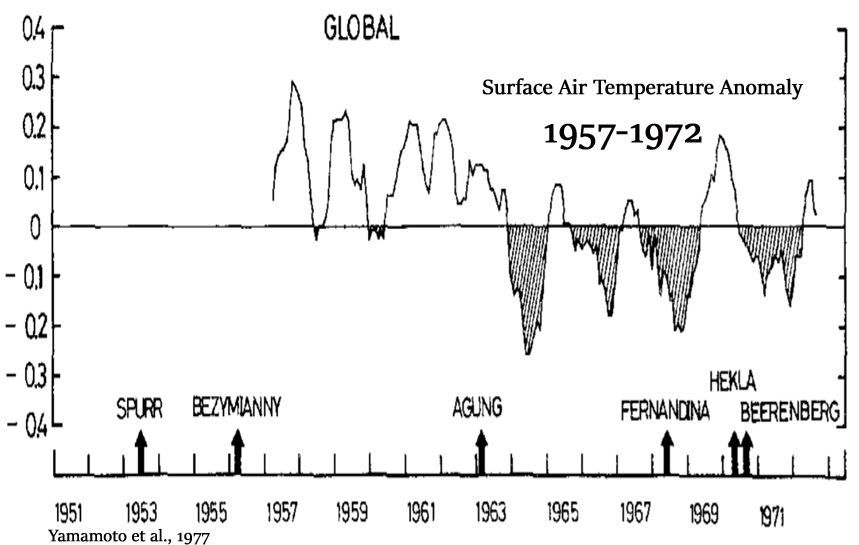
91. Kelly et al., 1982 The 1880’s [in the Arctic] was the coolest decade during the study period, and was followed by a warming of 0.65°C to the 1900’s. Cooling then occurred; the average temperature during the 1910’s was ~0.45°C below the 1900’s. This cooling is less noticeable in the Northern Hemisphere average temperature d. Rapid warming affected the Arctic during the late 1910’s and 1920’s, with the average temperature peaking during the late 1930’s. A warming of ~1.60°C occurred between 1917 and 1921 [Arctic]. While the average temperature of the Arctic was at a maximum in the 1930’s, the average temperature of the Northern Hemisphere was greatest in the decade of the 1940’s. After the 1930’s, temperatures fell: a drop of 0.85°C occurred up to the 1960’s.
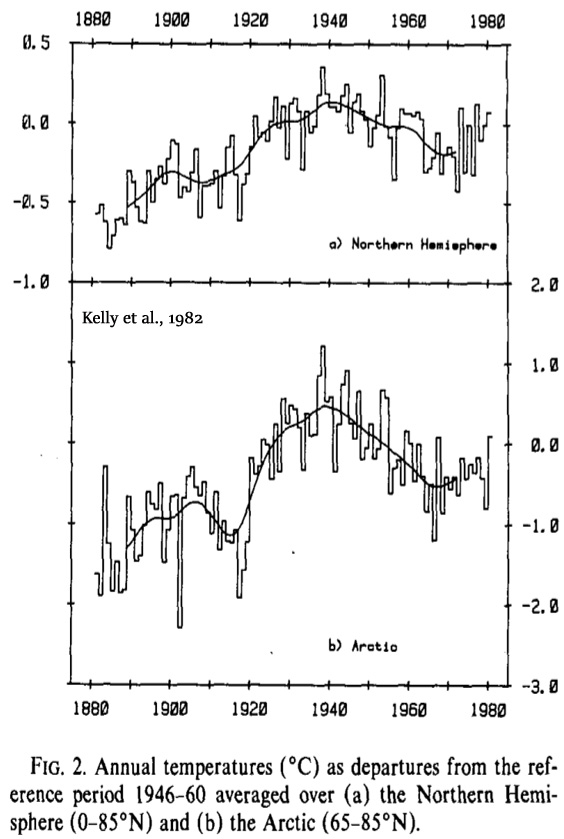
92. Eichenlaub, 1971 Evidence derived from the carefully screened temperature record at Eau Claire, Mich., and from radiosonde data at Sault Ste. Marie, Mich., supports the conclusion of Wahl and Lawson that a return to the temperature and circulation features of the early and mid-19th century in the eastern United States may be underway. … Definite cooling tendencies appeared in summer and winter, particularly during seasonal extreme months of July and January. Figure 2 shows 10-yr moving averages of monthly temperatures for June, July, and August. All 3 mo[nths] show temperature declines since the height of the recent climatic optimum during the 1930s. July temperatures have decreased about 3.5°F since the decades beginning with the early 1930s, and August temperatures have decreased about 3°F since the decades beginning with the late 1930s and early 1940s.
93. Schultz, 1972 The nine-banded armadillos (Dasypus novemcinctus) have been moving northward in the Great Plains region from the late 1800s to the 1950s but now seem to be retreating from their lately acquired northern range. The armadillos have a nontypical homoiothermic blood system which makes them fairly vulnerable to cold climates. Many other adjustments of animal ranges have taken place in the Holocene, even during the past few centuries and evidence indicates that in many cases climate changes played an important role.
94. Landsberg, 1976 Howard A Wilcox (1975) [in his book] Hothouse Earth, has both polar ice caps melting as a result of heat rejection from human energy consumption; the second [book], by Nigel Calder (1975), The Weather Machine, warns of an imminent ice age. That leaves us where we were before; both can not be right. … The basic model Wilcox adopts is the Budyko-Sellers radiation equilibrium concept, slightly modified. He discounts feedbacks, has no concept of the role of the oceans, and leaves out all transport and eddy dissipation effects. Where the climatologists have cautiously and conservatively made tentative calculations with 1-2% changes in the solar “constant,” Wilcox regales us to an energy rejection equal to the present solar energy income by about the year 2200. He generously omits the evidently minor concomitant CO2 effects [as a factor affecting warming]. Perturbingly, there are nowhere real error limits placed on any of the estimates.
Calder’s book takes us to the other extreme. He gives a composite word picture that inexorably leads to an ice age. Mr. Calder is a science writer, who bases his views essentially on talking to scientists and reading literature selectively. Thus the book essentially is a review. … Calder’s vivid portrayal of catastrophic weather events are a tribute to him as a writer, but the conclusions he draws from them are very shaky. Of course, we are all very distressed by the human consequences of such events as the Sahel drought or the damages wrought by hurricane Agnes, but are they really indications of climatic change [global cooling]? … [I]n talking about the Indian monsoons he clearly advocates that these have become weaker and will be further weakened by a cooling of the earth; he then disparagingly quotes the Indian Meteorological Service stating that there are no trends in rainfall in the subcontinent corresponding to global warming or cooling. … He also reads from the record of the cores that ice caps can swoop down on us suddenly. For this he coins the term “snowblitz,” a rapid extension of the snow cover that will not melt in the summer. So we shall be frozen out at latitude 50°N, by his own calculations (without error limits), in the next century or two.
CONTINUE TO PART 2 HERE


Recent Comments