I. Solar Influence On Climate (133)
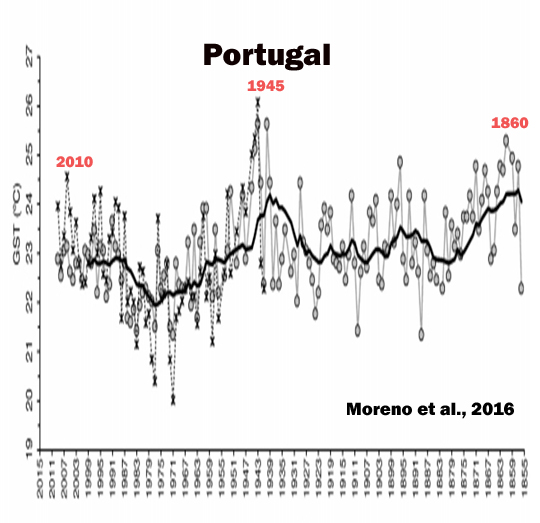
1. Moreno et al., 2016 The major external forcing of the climate system derives from the Sun. A solar signature has been found in global mean surface temperatures, with evidence directly related to two noticeably different features of the Sun’s dynamics: its short-term irradiance fluctuations and secular patterns of 22-year and 11-year cycles (Scafetta and West, 2008). … [I]t is recognized that solar forcing manifestations denote a strong spatial and seasonal variability (Usoskin et al., 2006), and this would be the reason why it might be illusive to seek a single global relationship between climate and solar activity (de Jager, 2005). Thus, Le Mouël et al. (2009) stated that a regional approach may allow one to identify specific forms of solar forcing, where and when the solar input is most important. … [S]olar footprints on terrestrial temperatures [are] due to the strong non-linear hydrodynamic interactions across the Earth’s surface, and the accepted longerterm solar activity influence creating temperature oscillations for tens or even hundreds of years (Scafetta and West, 2003, 2007, 2008). … These spectral analysis results appear to support a solar forcing with regards to Minho GHD [grape harvest dates]
2. Yamakawa et al., 2016 This study attempted to determine the relationships between solar activity and SST. Instrumental data from 1901 to 2011 revealed a significant positive relationship on a global basis. … The analysis of the relationship between variations in solar activity and SST from 1901 to 2011 indicated that sunspot numbers and SST were positively correlated in wide areas, with statistically significant positive correlations in many regions. … Analyses of the relationships between solar activity and the Earth’s climate system also revealed relationships between variations in solar activity and circulation in the troposphere. It is worthy of note that the highest coefficients at a 29-month lag were found in the relationships both between SSN [sunspot number] and PDO [Pacific Decadal Oscillation], and SSN and CP El Niño with statistical significance at the 99% confidence level, respectively.
3. Luening and Vahrenholt, 2016 The amplitude of the observed temperature fluctuations is often more than 1°C and thus has a similar or even greater range than the warming that has occurred since the Little Ice Age. Furthermore, many of these Holocene, natural climate fluctuations show the same level of abruptness as the 20th-century warming. A common characteristic of many of the documented millennial climate fluctuations is their good match with solar activity changes, as well as a North Atlantic climate record by Bond et al. (2001). Besides solar activity changes, internal millennial ocean cycles may have contributed to the observed climate oscillations.
4. de Larminat, 2016 [T]he recent anthropogenic contribution is found to be less than the contribution of solar activity. Reflecting the predominance of internal variability in the error output, the natural contribution (solar and volcanic activities, plus internal variability) becomes clearly much greater than the anthropogenic contribution in the recent warming.
5. Harde, 2016 Including solar and cloud effects as well as all relevant feedback processes our simulations give an equilibrium climate sensitivity of CS = 0.7 °C (temperature increase at doubled CO2) and a solar sensitivity of SS = 0.17 °C (at 0.1 % increase of the total solar irradiance). Then CO2 contributes 40 % and the Sun 60 % to global warming over the last century.
6. Bonomo et al., 2016 The calcareous nannofossil assemblages as well as their diversity index are modulated by oscillation in solar activity, where minima in solar activity correspond to minima calcareous nannofossil diversity and vice versa. In particular, the antiphase correlation between the abundance of Reworked Coccoliths and the North Atlantic Oscillation index, which modulates winter precipitation, suggests that this biotic index could be used as a reliable proxy to reconstruct the variations in the hydrographic basin runoff of the Volturno and Garigliano rivers. In addition, power spectral and wavelet analysis carried out on both signals documented the occurrence of climatic cycles of the duration of about 95 yr. From 1900 AD upwards, a turnover in the periodicity from 95 yr climatic cycles to 22–26 yr cycles occurred in the Reworked Coccoliths signal, suggesting a strong control of solar forcing (Hale cycle) over the last century.
7. Malik et al., 2016 In this study, we undertake another effort towards understanding the role of the Sun in changing or varying the Earth’s climate on seasonal to decadal time scale. We focus on effects of varying solar activity on All Indian Summer Monsoon Rainfall (AISMR) and try to investigate how much the prediction of AISMR on a seasonal to decadal time scale can be improved by considering the solar irradiance variability in climate models. … Further, in our analysis we have found strong statistical evidence of the influence of solar activity on AMO and AISMR[All Indian Summer Monsoon Rainfall]. We have found highly statistically significant evidence that North Atlantic SSTs are positively correlated with TSI on annual (CC 0.46), decadal (CC 0.55) and multidecadal time scales (CC 0.42) during the period 1600-2000. Also AMO influences the Niño3 and AISMR.
8. Salau et al., 2016 Discussion of the Results: For each location, the mean temperature increases with rising insolation [surface solar radition] while the resulting increase in the precipitation is highest among the three variables. … The mean temperature and precipitation, averaged over 1980–2010 (1983–2010 for Abuja), are also compared. Overall, the investigation shows a linear relationship between the solar radiation and the induced temperature, thus indicating that the observed variations in the temperature are mainly controlled by the insolation forcing.
9. Kodera et al., 2016 Conclusion: In summary, diverse aspects of the solar signal on the Earth’s surface can be explained solely by solar UV heating changes in the upper stratosphere which penetrate the troposphere through two pathways: the stratospheric westerly jet in the extratropics, and the stratospheric mean meridional circulation in the tropics, as suggested by Kodera and Kuroda (2002). … [C]entennial-scale solar signals could also be explained by a change in the spectral distribution of solar irradiance, with changes only in the UV part of the solar spectrum, even if the change in total energy was negligibly small.
10. Hassan et al., 2016 The various techniques have been used to confer the existence of significant relations between the number of Sunspots and different terrestrial climate parameters such as rainfall, temperature, dewdrops, aerosol and ENSO etc. …This study uses a Markov chain method to find the relations between monthly Sunspots and ENSO data of two epochs (1996–2009 and 1950–2014) … [P]erfect validation of dependency and stationary tests endorses the applicability of the Markov chain analyses on Sunspots and ENSO data. This shows that a significant relation between Sunspots and ENSO data exists.
11. Salas et al., 2016 The investigation assesses the influence of recent climatic events in the water resources and the aquifer dynamics in the Huasco watershed by means of the analysis of precipitation, streamflow and piezometric levels during the last 50 years. … Water reservoirs in the main aquifer (Section III) and in the Santa Juana dam are highly sensitive to ENSO oscillation climatic patterns. … .Spectral analysis identified the presence of a 22.9-year cycle in piezometric levels of the alluvial aquifer of the Huasco River. This cycle is consistent with the 22-year Hale solar cycle, suggesting the existence of a solar forcing controlling the ENSO oscillations.
12. Nurtaev, 2016 Introduction: Sunspot number time series can be conceived as indicators of climate trends. Extraterrestrial solar-irradiance variations are associated with variations in regional climatology by means of global atmospheric circulation. [S]olar observations over the last century show a long term increase trend of solar activity. During this period also was observed an increase in temperature in the Northern Hemisphere.
13. Malik and Brönnimann, 2016 We conclude that the positive relation between AISMR [All Indian Summer Monsoon Rainfall] and solar activity, as found by other authors, is due to the combined effect of AMO, PDO and multi-decadal ENSO variability on AISMR. The solar activity influences the ICFs [internal climate forcings] and this influence is then transmitted to AISMR. … We also find that there is statistical significant negative relationship between AISMR and ENSO on inter-annual to centennial time scale and the strength of this relationship is modulated by solar activity from 3 to 40 year time scale.
14. Perone et al., 2016 Evident correlation among solar activity, ENSO effect, tree ring during 20th century … Tree rings reveal climatic variations through years, but also the effect of solar activity in influencing the climate on a large scale. … In the Chilean and Argentinian sites, significant agreement between the time series of tree rings and the 11-year solar cycle was found during the periods of maximum solar activity. Results also showed oscillation with periods of 2–7 years, probably induced by local environmental variations, and possibly also related to the El-Niño events. … These results provided new evidence on the solar activity-climate pattern-tree ring connections over centuries.
15. Mursula, 2016 Solar mass emission and climate … The new long-term information also allows interesting possibilities to more reliably study the long-term evolution of solar effects in the Earth’s atmosphere and climate. E.g., there is evidence that processes related to HSSs [solar wind streams] may modulate regional/hemispheric climate patterns, in particular the NAO/NAM oscillation. Moreover, other, independent climate effects due to the HMF [heliospheric magnetic field] have been suggested.
16. Gray et al., 2016 Results from a previous 11-year solar cycle signal study of the period 1870–2010 (140 years; ~13 solar cycles) that suggested a 3–4 year lagged signal in SLP over the Atlantic are confirmed by analysis of a much longer reconstructed dataset for the period 1660–2010 (350 years; ~32 solar cycles). … Corresponding analysis of DJF [December-February]-averaged Atlantic / European blocking frequency shows a highly statistically significant [solar] signal at ~1-year lag that originates primarily from the late winter response. The 11-year solar signal in DJF [December-February] blocking frequency is compared with other known influences from ENSO and the AMO and found to be as large in amplitude and have a larger region of statistical significance.
17. Zhou et al., 2016 A significant correlation between the solar wind speed (SWS) and sea surface temperature (SST) in the region of the North Atlantic Ocean has been found for the Northern Hemisphere winter from 1963 to 2010, based on 3-month seasonal averages. … SST responds to changes in tropospheric dynamics via wind stress, and to changes in cloud cover affecting the radiative balance. Suggested mechanisms for the solar influence on SST include changes in atmospheric ionization and cloud microphysics affecting cloud cover, storm invigoration, and tropospheric dynamics. … [D]irect solar inputs, including energetic particles and solar UV, produce stratospheric dynamical changes. Downward propagation of stratospheric dynamical changes eventually further perturbs tropospheric dynamics and SST.
18. Ball et al., 2016 Solar variability can influence surface climate, for example by affecting the mid-to-high-latitude surface pressure gradient associated with the North Atlantic Oscillation. One key mechanism behind such an influence is the absorption of solar ultraviolet (UV) radiation by ozone in the tropical stratosphere, a process that modifies temperature and wind patterns and hence wave propagation and atmospheric circulation. The amplitude of UV variability is uncertain, yet it directly affects the magnitude of the climate response: observations from the SOlar Radiation and Climate Experiment (SORCE) satellite show broadband changes up to three times larger than previous measurements.
19. Tedesco et al., 2016 The surface energy balance and meltwater production of the Greenland ice sheet (GrIS) are modulated by snow and ice albedo through the amount of absorbed solar radiation. Here we show, using space-borne multispectral data collected during the 3 decades from 1981 to 2012, that summertime surface albedo over the GrIS decreased at a statistically significant (99 %) rate of 0.02 decade−1 between 1996 and 2012. … Net solar radiation is the most significant driver of summer surface melt over the GrIS (van den Broeke et al., 2011; Tedesco et al., 2011), and is determined by the combination of the amount of incoming solar radiation and surface albedo.
20. Elsharkawy and Elmallah, 2016 [C]ross-correlation and spectral analysis techniques are applied to investigate the influence of terrestrial and extraterrestrial parameters, represented by North Atlantic Oscillations, NAO, and sunspot number, Rz, respectively, upon regional temperature. … Correlation results showed highest influences upon autumn and winter coast temperatures by Rz [sunspot number] and NAO during 1981-2010. … NAO is a potential transmitter of solar forcing as it acts as a mediator between the Sun and Earth’s climate.
21. Scafetta, 2016 The quasi-secular beat oscillations hindcast reasonably well the known prolonged periods of low solar activity during the last millennium such as the Oort, Wolf, Sporer, Maunder and Dalton minima, as well as the 17 115-year long oscillations found in a detailed temperature reconstruction of the Northern Hemisphere covering the last 2000 years. The millennial cycle hindcasts equivalent solar and climate cycles for 12,000 years. Finally, the harmonic model herein proposed reconstructs the prolonged solar minima that occurred during 1900- 1920 and 1960-1980 and the secular solar maxima around 1870-1890, 1940-1950 and 1995-2005 and a secular upward trending during the 20th century: this modulated trending agrees well with some solar proxy model, with the ACRIM TSI satellite composite and with the global surface temperature modulation since 1850. … [R]esults clearly indicate that both solar and climate oscillations are linked to planetary motion and, furthermore, their timing can be reasonably hindcast and forecast for decades, centuries and millennia.
22. Czymzik et al., 2016 Flood frequency in both records is significantly correlated to changes in solar activity from the solar Schwabe cycle to multi-centennial oscillations. These significant correlations suggest a solar influence on the frequency of hydroclimate extremes in central Europe. Similar configurations of atmospheric circulation during periods of increased flood frequency and reduced solar activity, as expected to be caused by the so-called solar top-down mechanism by model studies, might indicate that the observed solar activity–flood frequency linkage is related to this feedback. … [N]umerous empirical associations between the activity of the Sun and climate variables like temperature, precipitation, atmospheric circulation and frequency and intensity of hydrometeorological extremes indicate a solar influence on climate on regional scales (Adolphi et al., 2014; Bond et al., 2001; Fleitmann et al., 2003; Gray et al., 2010; Lockwood, 2012; Wirth et al., 2013).
23. Serykh and Sonechkin, 2016 Basing on a mathematical idea about the so-called strange nonchaotic attractor (SNA) in the quasi-periodically forced dynamical systems, the currently available re-analyses data are considered. It is found that the El Niño – Southern Oscillation (ENSO) is driven not only by the seasonal heating, but also by three more external periodicities (incommensurate to the annual period) associated with the ~18.6-year lunar-solar nutation of the Earth rotation axis, ~11-year sunspot activity cycle and the ~14-month Chandler wobble in the Earth’s pole motion.
24. Gopalswamy, 2016 Coronal mass ejections (CMEs) are relatively a recently discovered phenomenon—in 1971, some 15 years into the Space Era. It took another two decades to realize that CMEs are the most important players in solar terrestrial relationship as the root cause of severe weather in Earth’s space environment.
25. Bronck and Sirocko, 2016 The statistical analysis of all 92 historical freezing events showed that 80 events occurred during a negative NAO winter phase. The bootstrap test defined the results as extremely significant. To understand the climatic forcing behind the freezing chronology the NAO data set was smoothed by a three point running mean filter and compared with the 11- year cyclicity of the sunspot numbers. A complete NAO cycle can be observed within each solar cycle back to 1960 and from 1820 to 1900. … [T]he 11 year solar periodicity is related to various parts of the Earth/Ocean/Atmosphere system and not only to the stratospheric signal. However, the NAO is the dominating mediator to implement a solar component into the European winter extremes.
26. Scafetta, 2016 This study investigates the existence of a multi-frequency spectral coherence between planetary and global surface temperature oscillations by using advanced techniques of coherence analysis and statistical significance tests. … [U]sing the canonical coordinates analysis at least five coherent frequencies at the 95% significance level are found at the following periods: 6.6, 7.4, 14, 20 and 60 years. Thus, high resolution coherence analysis confirms that the climate system can be partially modulated by astronomical forces of gravitational, electromagnetic and solar origin. … Numerous evidences for a solar influence on the climate at multiple scales are also well-known (e.g.: Hoyt and Schatten, 1997). More recently, several authors have advocated a planetary theory of solar and climate oscillations on shorter scales (e.g.: Abreu et al., 2012, Charvátová, 2009, Cionco and Soon, 2015, Hung, 2007, Jakubcová and Pick, 1986, Jose, 1965, McCracken et al., 2013, McCracken et al., 2014, Mörner et al., 2013, Mörner, 2015, Puetz et al., 2014, Salvador, 2013, Solheim, 2013, Tan and Cheng, 2013, Tattersall, 2013 and Wilson, 2013) … A coupling between planetary oscillations and climate change must necessarily involve a complex and long chain of physical mechanisms that are being investigated in the scientific literature. … Finally, an astronomically induced albedo variation could easily induce climatic variations. In fact, if the Earth’s albedo oscillates by just a few percent driven by astronomical forcings, the resulting oscillations would be sufficient to induce the observed climatic oscillations because these are of the order of a fraction of Celsius degree.
27. Martínez-Asensio et al., 2016 Autumn sea level extremes vary with the 11-year solar cycle at Venice as suggested by previous studies but a similar link is also found at Trieste. In addition, a solar signal in winter sea level extremes is also found at Venice, Trieste, Marseille, Ceuta, Brest and Newlyn. The influence of the solar cycle is also evident in the sea level extremes derived from a barotropic model with spatial patterns that are consistent with the correlations obtained at the tide gauges. This agreement indicates that the link to the solar cycle is through modulation of the atmospheric forcing.
28. Weißbach et al., 2016 Compared to single records, this stack represents the mean δ18O signal for northern Greenland that is interpreted as proxy for temperature. Our northern Greenland δ18O stack indicates distinctly enriched [warm] δ18O values during medieval times, about AD 1420 ± 20 and from AD 1870 onwards. The period between AD 1420 and AD 1850 has depleted [cold] δ18O values compared to the average for the entire millennium and represents the Little Ice Age. The δ18O values of the 20th century are comparable to the medieval period but are lower than that about AD 1420. …. The solar activity and internal Arctic climate dynamics are likely the main factors influencing the temperature in northern Greenland.
29. Svensmark et al., 2016 [press release ] Solar activity has a direct impact on the Earth’s cloud cover … The solar eruptions are known to shield Earth’s atmosphere from cosmic rays. However the new study, published in Journal of Geophysical Research: Space Physics, shows that the global cloud cover is simultaneously reduced, supporting the idea that cosmic rays are important for cloud formation. The eruptions cause a reduction in cloud fraction of about 2 percent corresponding to roughly a billion tonnes of liquid water disappearing from the atmosphere. Since clouds are known to affect global temperatures on longer timescales, the present investigation represents an important step in the understanding of clouds and climate variability.
“Earth is under constant bombardment by particles from space called galactic cosmic rays. Violent eruptions at the Sun’s surface can blow these cosmic rays away from Earth for about a week. Our study has shown that when the cosmic rays are reduced in this way there is a corresponding reduction in Earth’s cloud cover. Since clouds are an important factor in controlling the temperature on Earth our results may have implications for climate change,” explains lead author on the study Jacob Svensmark of DTU. … The effect from Forbush decreases on clouds is too brief to have any impact on long-term temperature changes. However, since clouds are affected by short term changes in galactic cosmic radiation, they may well also be affected by the slower change in Solar activity that happens on scales from tens to hundreds of years, and thus play a role in the radiation budget that determines the global temperature. The Sun’s contribution to past and future climate change may thus be larger than merely the direct changes in radiation, concludes the scientists behind the new study.
30. Lenz et al., 2016 Two palynological analyses of 6.3 and 70 kyr long records with a temporal resolution of 70 and 700 years respectively confirm vegetation and climate variability in the sub-Milankovitch range. This variability clearly corresponds to cyclic climate fluctuations indicating the influence of solar activity and a millennial-scale variability of the El Niño–Southern Oscillation also seen during the Quaternary icehouse system.
31. Haig and Nott, 2016 The development of a new tropical cyclone activity index spanning the last 1500 years has enabled the examination of tropical cyclone climatology at higher temporal resolution than was previously possible. Here we show that in addition to other well-known climate indices, solar forcing largely drives decadal, interdecadal, and centennial cycles within the tropical cyclone record.
32. Arsenovic et al., 2016 We investigate the influence of Middle Range Energy Electrons (MEE; typically 30-300 keV) precipitation on the atmosphere using the SOCOL3-MPIOM chemistry-climate model with coupled ocean. … Results show that during geomagnetically active periods MEE [Middle Range Energy Electrons] significantly increase the amount of NOy and HOx in the polar winter mesosphere, in addition to other particles and sources, resulting in local ozone decreases of up to 35%. These changes are followed by an intensification of the polar night jet, as well as mesospheric warming and stratospheric cooling. … A surface air temperature response is detected in several regions, with the most pronounced warming occurring in the Antarctic during austral winter. Surface warming of up to 2 K is also seen over continental Asia during boreal winter.
33. Wang et al., 2016 The broad comparability between the HML paleo-proxies, Chinese speleothem δ18Orecords, and the northern hemisphere summer insolation throughout the Holocene, suggests that solar insolation exerts a profound influence on ASM [Asian summer monsoon] changes. These findings reinforce a model of combined insolation and glacial forcing of the ASM.
34. Huo and Xiao, 2016 The impact of solar activity on the 2015/16 El Niño event … Recent SST and atmospheric circulation anomaly data suggest that the 2015/16 El Niño event is quickly decaying. Some researchers have predicted a forthcoming La Niña event in late summer or early fall 2016. From the perspective of the modulation of tropical SST by solar activity, the authors studied the evolution of the 2015/16 El Niño event, which occurred right after the 2014 solar peak year. Based on statistical and composite analysis, a significant positive correlation was found between sunspot number index and El Niño Modoki index, with a lag of two years. A clear evolution of El Niño Modoki events was found within 1–3 years following each solar peak year during the past 126 years, suggesting that anomalously strong solar activity during solar peak periods favors the triggering of an El Niño Modoki event. The patterns of seasonal mean SST and wind anomalies since 2014 are more like a mixture of two types of El Niño (i.e., eastern Pacific El Niño and El Niño Modoki), which is similar to the pattern modulated by solar activity during the years following a solar peak. Therefore, the El Niño Modoki component in the 2015/16 El Niño event may be a consequence of solar activity, which probably will not decay as quickly as the eastern Pacific El Niño component. The positive SST anomaly will probably sustain in the central equatorial Pacific (around the dateline) and the northeastern Pacific along the coast of North America, with a low-intensity level, during the second half of 2016.
35. Wahab et al., 2016 Understanding the influence of solar variability on the Earth’s climate requires knowledge of solar variability, solar interactions, and the mechanisms explain the response of the Earth’s climate system. The NAO (North Atlantic oscillation) is one of the most dominant modes of global climate variability. Like El Niño, La Niña, and the Southern Oscillation, it is considered as free internal oscillation of the climate system not subjected to external forcing. It is shown, to be linked to energetic solar eruptions. Surprisingly, it turns out that features of solar activity have been related to El Niño and La Niña, also have an significant impact on the NAO. The climate of the Atlantic sector exhibits considerable variability on a wide range of time scales. A substantial portion is associated with the North Atlantic Oscillation (NAO), a hemispheric meridional oscillation as atmospheric mass with centers of action near Iceland and over the subtropical Atlantic. NAO- has a related impacts on winter climate extend from Florida to Greenland and from northwestern Africa over Europe far into northern Asian region. In the present work solar cycle 22 was implemented via sun spots number and area and there interrelationship with NAO index and discussed their dependency which consequently that could be used to predict the behavior of NAO index in the next solar cycle as an indicator to climatic variability.
36. Veretenenko and Ogurtsov, 2016 In this work we study links between low cloud anomalies (LCA) at middle latitudes of the Northern and Southern hemispheres and galactic cosmic ray (GCR) variations used as a proxy of solar variability on the decadal time scale. It was shown that these links are not direct, but realized through GCR/solar activity phenomena influence on the development of extratropical baric systems (cyclones and troughs) which form cloud field.
37. Scafetta et al., 2016 Indeed, many other stable orbital resonance frequencies (e.g. at periods of 20 years, 45 years, 60 years, 85 years, 159–171–185 years) are found in radionucleotide, solar, aurora and climate records, as determined in the scientific literature. Thus, the result supports a planetary theory of solar and/or climate variation that has recently received a renewed attention. In our particular case, the rhythmic contraction and expansion of the solar system driven by a major resonance involving the movements of the four Jovian planets appear to work as a gravitational/electromagnetic pump that increases and decreases the cosmic ray and dust densities inside the inner region of the solar system, which then modulate both the radionucleotide production and climate change by means of a cloud/albedo modulation.
38. Turney et al., 2016 Southern Hemisphere westerly airflow has a significant influence on the ocean–atmosphere system [“precipitation, sea ice extent, sea surface temperatures and the carbon cycle”] of the mid- to high latitudes with potentially global climate implications. … Spectral analysis of the charcoal record identifies a pervasive ca. 250-year periodicity that is coherent with radiocarbon production rates, suggesting that solar variability has a modulating influence on Southern Hemisphere westerly airflow.
39. Baker, 2016 For solar measurements, the first four rows of the matrix predict at least 98% of the top hundred significant periodicities determined from multi-taper spectral analysis of solar data sets (the satellite ACRIM composite irradiance; the terrestrial 10.7cm Penticton Adjusted Daily Radio Flux, Series D; and the historical mean monthly International Sunspot Number). At centennial and millennial time scales, the same matrix predicts ‘average’ significant periodicities (greater than 95%) reported in 23 published climate data sets. This discovery suggests there is strong empirical evidence for a d-cyclic fractional ‘solar clock’, where the corresponding spectrum of cycles and switching events are embedded into the historical, climatic and geological records of the Earth.
40. Liu et al., 2016 Significant relationships were found between our PDSI [Palmer Drought Severity Index] reconstruction and the solar radiation cycle and the sun spot cycle, North Atlantic Oscillation, the El Niño-Southern Oscillation, as well as the Pacific Decadal Oscillation.
41. Engels et al., 2016 Increasing precipitation amounts around 2800 cal. yr BP resulted in a lake-level rise of about 3.5–4 m to levels that were 1–1.5 m higher than at present, in line with increased precipitation levels as inferred for the 2.8-kyr event from nearby raised bog areas as well as with reconstructions of higher lake levels in the French Alps, all of which have been previously attributed to a phase of decreased solar activity.
42. Chen et al., 2016 This reconstruction successfully captured the wetting trend that occurred from the 1980s to the 2000s and generally agreed with dry periods previously estimated from tree-ring records obtained from the surrounding areas. Moreover, a wavelet coherence analysis shows that significant common oscillations (11.5 and 60 yr) have occurred and suggests that precipitation variations across the Urumqi region were related to different climatic forcing mechanisms (i.e. solar activities and the NAO).
43. Luoto and Nevalainen, 2016 Solar and atmospheric forcing on mountain lakes … The influence of NAO and solar forcing on aquatic invertebrates was also significant in the lakes except in the less transparent lake known to have remained uniformly cold during the past centuries due to summertime snowmelt input. The results suggest that external forcing plays an important role in these pristine ecosystems through their impacts on limnology of the lakes. Not only does the air temperature variability influence the communities but also larger-scale external factors related to atmospheric circulation patterns and solar activity cause long-term changes in high-altitude aquatic ecosystems, through their connections to hydroclimatic conditions and light environment. These findings are important in the assessment of climate change impacts on aquatic ecosystems and in greater understanding of the consequences of external forcing on lake ontogeny.
44. Jin et al., 2016 Our record provides further evidence for the complex relationship of insolation [surface solar radiation]–induced temperature, evaporation, and precipitation affecting the regional climate changes on the Tibetan Plateau.
45. Roy, 2016 This work studies the role of natural factors mainly solar eleven-year cycle variability, and volcanic eruptions on two major modes of climate variability the North Atlantic Oscillation (NAO) and El Niño Southern Oscillation (ENSO) for around last 150 years period. The NAO is the primary factor to regulate Central England Temperature (CET) during winter throughout the period, though NAO is impacted differently by other factors in different time periods. Solar variability has a positive influence on NAO during 1978-1997, which is opposite before that period. Solar NAO lag relationship is also sensitive to the chosen times of reference. Such analyses raise a question about previously proposed mechanism and relationship related to the sun and NAO. The ENSO is seen to be influenced strongly by solar variability and volcanic eruptions in certain periods.
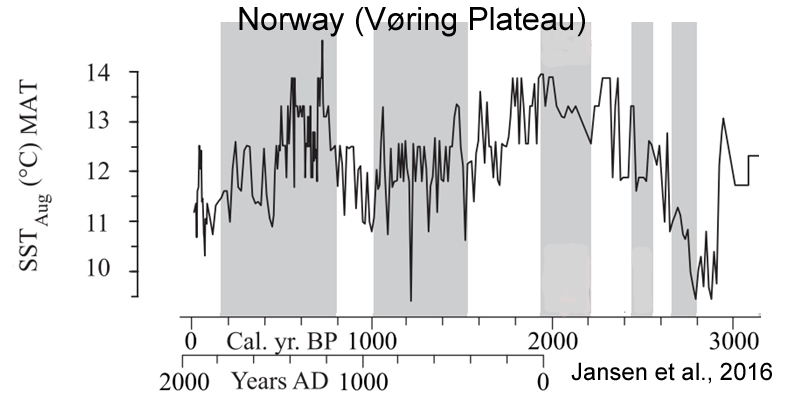
46. Jansen et al., 2016 [W]e suggest that deviations in ELA [equilibrium line altitude] fluctuations between Scandinavian maritime and continental glaciers around 7150, 6560, 6000, 5150, 3200 and 2200 cal. yr BP reflect the different response of continental and maritime glaciers to drops in total solar irradiance (TSI).
47. Czymzik et al., 2016 Calcite layer thickness oscillations of about 88 and 208 years resemble the solar Gleissberg and Suess cycles suggesting that the recorded hydroclimate changes in north-eastern Germany are modified by solar influences on synoptic-scale atmospheric circulation.
48. Nagai et al., 2016 The multi-millennial variability recorded in both cores suggests the occurrence of Holocene in-phase climatic changes both in Southern Hemisphere at the latitudes of the SW coast of Brazil (Cabo Frio region) and in the Northern Hemisphere, at the latitude of Galicia (NW Iberian Margin). These coupled climatic alterations were probably related to changes in the oceanic-atmospheric climatic systems, coupled with and amplified by solar forcing effects.
49. Zhang et al., 2016 Our results reveal a persistent wetting trend in northwestern China in winter throughout the Holocene, which is in response to winter insolation [surface solar radiation] at mid-northern latitudes. Winter insolation [surface solar radiation] can influence the rainfall via three ways. First, increasing latitudinal gradient of the incoming solar insolation at mid-latitudes strengthens the westerly intensity. Second, the evaporation is enhanced because of insolation-induced winter temperature rising, resulting in an increase in the air humidity. Intensified westerly winds and the increased water vapour together are conductive to enhance moisture transport towards northwestern China and thus increase winter precipitation in this area. Third, the increasing trend of winter insolation [surface solar radiation] weakens the East Asian winter monsoon, which is favourable for the formation of rainfall via crippling the Siberian High that is beneficial for atmospheric lifting motion.
50. Kuroda, 2016 Climate is known to be affected by various factors, including oceanic changes and volcanic eruptions. 11-year solar cycle change is one of such important factors. Observational analysis shows that the winter-mean North Atlantic Oscillation (NAO) and late-winter/spring Southern Annular Mode (SAM) show structural modulation associated with 11-year solar cycle. In fact, these signals tend to extend from surface to upper stratosphere and persistent longer period only in the High Solar (HS) years.
51. Schulte et al., 2016 Comparing the sedimentary flood proxies from the basins analysed and the Summer NAO index from 1670 to 2000, severe floods occurred mostly during positive SNAO modes. This result is supported by our findings regarding the influence of low-frequency atmospheric circulation pattern on summer floods in Switzerland (1800-2008). Thus, the mechanisms of flood processes from the different catchments are strongly influenced by North Atlantic dynamics and solar forcing.
52. Sánchez et al., 2016 Peatland dynamics seems to have been coupled to changes in solar irradiance and hydrological conditions. Our results point to wetter conditions after the mid-16th century, although with high intra-annual fluctuations. At the late 18th century, when solar activity was systematically higher than before, peat carbon accumulation rates (PCAR) showed a continuous increase and the humification indices suggest a change towards more humified peat.
53. Kodera et al., 2016 The solar signal in the annual mean surface temperature is characterized by (i) mid-latitude warming and (ii) no overall tropical warming. The mid-latitude warming during solar maxima in both hemispheres is associated with a downward penetration of zonal mean zonal wind anomalies from the upper stratosphere during late winter. During the Northern Hemisphere winter this is manifested by a modulation of the polar-night jet, whereas in the Southern Hemisphere, the upper stratospheric subtropical jet plays the major role. Warming signals are particularly apparent over the Eurasian continent and ocean frontal zones, including a previously reported lagged response over the North Atlantic. In the tropics, local warming occurs over the Indian and central Pacific oceans during high solar activity. …. These experiments support earlier evidence of an indirect solar influence [on surface temperatures] from the stratosphere.
54. Berger et al., 2016 This multi-proxy study of a small floodplain in the Rhone catchment area, at the northern edge of the Mediterranean morphoclimatic system, provides valuable information concerning the impact of mid-Holocene climate variability (8.5–7.0 ka) and the effects of two rapid climatic changes (8.2 and 7.7/7.1 ka) on an alluvial plain, its basin and the first farming societies of the Rhone valley. Around 7.7/7.1 ka [7,700/7,100 years ago], the combined effects of (1) a strong rate of change in insolation and (2) variations in solar activity amplified marine and atmospheric circulation in the north-west Atlantic (Bond event 5b), which imply continental hydrological, soil and vegetation changes in the small catchment area.
55. Zhang and Jin, 2016 This paper provides another look at the response of the Asian summer monsoon (ASM) to insolation forcing and oceanic feedback during the Holocene, using a fully coupled general circulation ocean–atmosphere model forced by Earth’s orbital variations. The model results revealed a recurrent circumglobal teleconnection (CGT) pattern in the summertime (June–July–August) mid-latitude circulation of the Northern Hemisphere during the Holocene. The CGT [circumglobal teleconnection] index showed a decreasing trend before ~5 ka BP and a slight increasing trend afterwards, affected by the combined effects of summer insolation, Indian summer monsoon (ISM), North Atlantic and Indian Ocean–western Pacific Ocean sea surface temperature (SST). The CGT showed a close relationship with ASM precipitation and surface air temperature during the Holocene and, therefore, could act as a bridge linking the ASM to insolation, high-latitude forcing (North Atlantic SST), and low-latitude forcing (tropical Ocean SST).
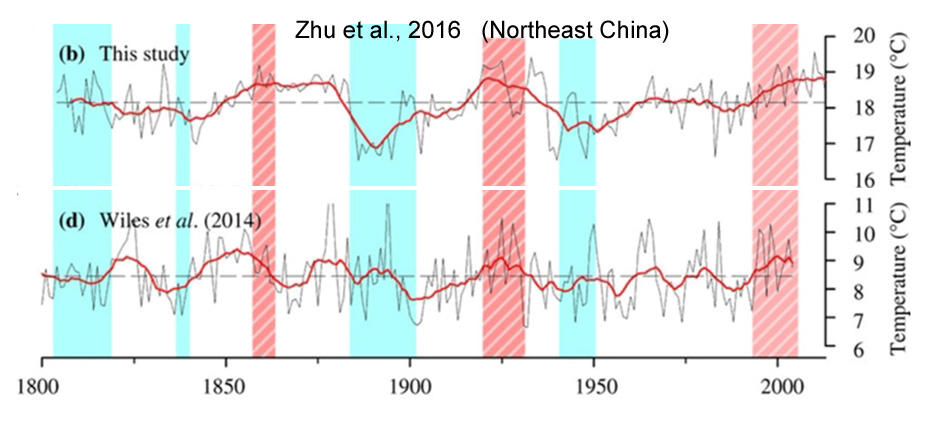
56. Zhu et al., 2016 We identified four major cold periods (1839–1846, 1884–1901, 1906–1908 and 1941–1958) and three major warm periods (1855–1880, 1918–1932 and 1998–2013) in the past 211 years. The multi-taper method spectral analysis revealed significant cycles at 48.8, 11.5, 8.9, 3.9, 3.5 and 2–3 years, which might be associated with global climate oscillations and land-sea thermal contrasts, such as the sea surface temperatures, El Niño-Southern Oscillation, Atlantic Multidecadal Oscillation and solar activity.
57. Wang et al., 2016 Tree-ring-based reconstruction of temperature variability (1445–2011) for the upper reaches of the Heihe River Basin, Northwest China … Spectral analyses suggested that the reconstructed annual mean temperature variation may be related to large-scale atmospheric–oceanic variability such as the solar activity, Pacific Decadal Oscillation (PDO) and El Niño–Southern Oscillation (ENSO).
58. Al-Tameemi and Chukin, 2016 Highlights: Strong correlation between solar activity and the global evaporation rate is detected. …The water cycle is the most active and most important component in the circulation of global mass and energy in the Earth system. Furthermore, water cycle parameters such as evaporation, precipitation, and precipitable water vapour play a major role in global climate change. In this work, we attempt to determine the impact of solar activity on the global water cycle by analyzing the global monthly values of precipitable water vapour, precipitation, and the Solar Modulation Potential in 1983–2008. … The results showed that there is a relationship between the solar modulation potential and evaporation values for the period of study. Therefore, we can assume that the solar activity has an impact on the global water cycle.
59. Ogurtsov et al., 2016 Five proxy temperature time series based on tree-rings and varves from the middle and high latitudes (φ > 50°) of North America were analyzed. They cover the last 3–5 centuries. It was shown that the reconstructions from Canadian Rockies (52.15° N, 117.15° W) and northeast Alaska (68.8° N, 142.3° W) correlate appreciably with Wolf [sunspot] number and 10Be concentration in Greenland ice over long (T > 13 years) time scales.
60. Xiao et al., 2016 The impact of solar activity on tropical Pacific convection during the boreal summer (June-July-August, JJA) has been examined using reanalysis data, revealing a significant lagged (1–2 years) correlation between outgoing long-wave radiation (OLR) over the tropical western Pacific and the F10.7 index. The OLR anomaly over the tropical western Pacific and the maritime continent shows a dipole pattern during the 1–2 years following high solar (HS) years. … By modulating vertical air temperature, the solar signal in the tropical sea surface temperature (SST) may contribute to the triggering of a lagged convection dipole pattern.
61. Bernal et al., 2016 [A]tmospheric circulation over South America and monsoon intensity have been tightly correlated throughout most of the Holocene, both directly responding to solar precession. … We also detect periods where rainfall amount in northeastern and southeastern Brazil are markedly anti-phased, suggesting a north-south migration of SACZ, which it appears to be mediated by solar irradiance.
62. Pedersen et al., 2016 The last interglacial, the Eemian, was characterized by higher than present temperatures in the Arctic region driven by increased summertime insolation [surface solar radiation] at high northern latitudes (CAPE-Last Interglacial Project Members, 2006; MassonDelmotte et al., 2013). The recent NEEM ice core from northwestern Greenland covers the last interglacial period and indicates substantial warming from 129 to 114 thousand years before present (ka) peaking at 8 ± 4 K above the mean of the last millennium. … During the Eemian, the global sea level was increased 6–9 m above present (Dutton and Lambeck, 2012; Dutton et al., 2015; Kopp et al., 2009), indicating a substantial reduction in the continental ice sheets. … [T]he insolation appears to be the dominant cause of the expected ice sheet reduction.
63. Bügelmayer-Blaschek et al., 2016 We performed 19 experiments that differ in the applied forcings (TSI [total solar irradiance], volcanic) and the initial atmospheric conditions. … The fact that also model runs that are not forced with TSI [total solar irradiance] variations display an 80 year time lag indicates that the relationship between TSI [total solar irradiance] and IMF [iceberg melt flux] is due to internal dynamics of the coupled system. From our experiments we conclude that internal ice sheet variability seems to be the source of the multi-century and millennial-scale iceberg events during the Holocene.
64. Cullens et al., 2016 Simulations under both time-varying and fixed-solar inputs show statistically significant responses in temperatures and winds in the Southern Hemisphere (SH) during austral winter and spring. At solar maximum, the monthly-mean, zonal-mean temperature in the SH from July to October is cooler (~1 – 3 K) in the stratosphere and warmer (~1 – 4 K) in the mesosphere and the lower thermosphere (MLT). In solar maximum years, the SH polar vortex is more stable and its eastward speed is about 5 – 8 m s-1 greater than during solar minimum. The increase in the eastward wind propagates downward and poleward from July to October in the SH. Because of increase in the eastward wind, the propagation of eastward gravity waves to the MLT is reduced. This results in a net westward response in gravity wave drag, peaking at ~10 m s-1 day-1 in the SH high-latitude MLT. These changes in gravity wave drag modify the wave-induced residual circulation, and this contributes to the warming of ~1 – 4 K in the MLT [mesosphere and the lower thermosphere].
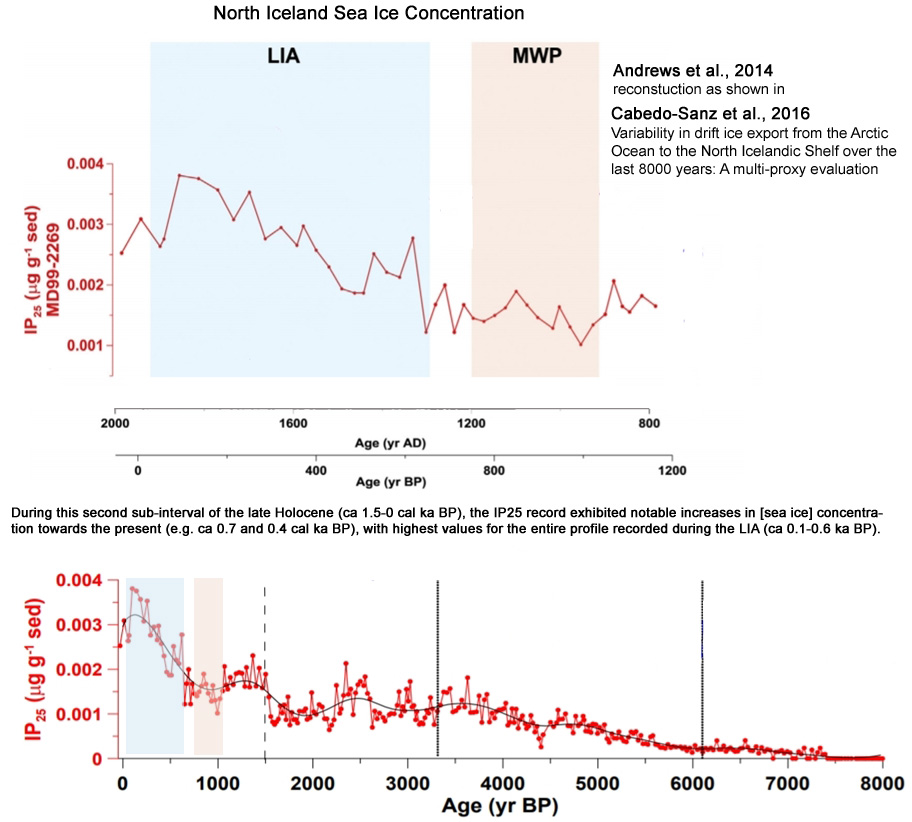
65. Cabedo-Sanz et al., 2016 Highlights: Periodicities in drift ice potentially associated with volcanic and solar forcing … The early mid Holocene (ca 8–6.2 cal ka BP) was characterized by relatively low or absent drift ice, low primary productivity and relatively high SSTs.
66. Kawahata et al., 2016 A long-term trend of declining SSTs can be attributed mainly to changes in solar radiation and sea level and, to a lesser extent, changes in the Asian monsoon. … During the last three millennia, the SSTs (ATs) fluctuated by 2.1 °C, with a maximum in 820 AD (24.3 °C [25.9 °C]) and two minima in 760 BC (22.2 °C [23.8 °C]) and 990 AD (22.4 °C [24.0 °C]). … These temperature fluctuations cannot be explained by a single cause but rather by more than one external and internal driver of climate variability (e.g., volcanic forcing, ocean-atmosphere interactions, and solar forcing).
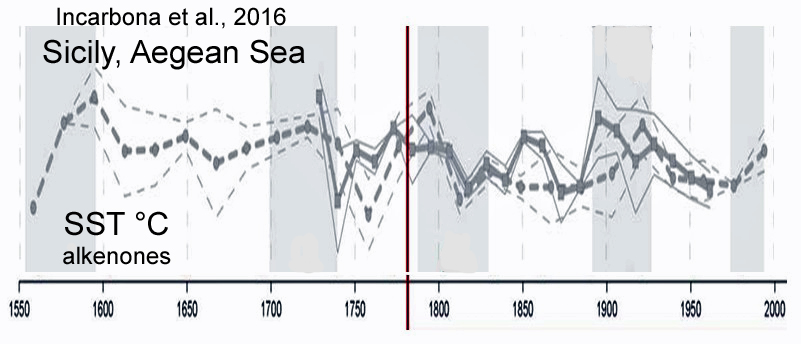
67. Incarbona et al., 2016 Comparison between the records and multi-decadal atmospheric circulation patterns and climatic external forcings indicates that Mediterranean circulation destabilisation occurs during positive North Atlantic Oscillation (NAO) and negative Atlantic Multidecadal Oscillation (AMO) phases, reduced solar activity and strong tropical volcanic eruptions. They may have recurrently produced favourable deep-water formation conditions, both increasing salinity and reducing temperature on multi-decadal time scales. … [B]oth NAO and AMO are of importance for the Mediterranean climate variability. In particular, at multidedacal scales, positive NAO phases lead to decreased precipitation (i.e. higher salinity) while negative AMO leads to reduced SSTs. Both processes may have favoured deep-water formation events on relatively long time scales. … Thermohaline circulation destabilisations in the Mediterranean circulation also seem to be linked to reduced solar activity (ref. 40; Fig. 4D) and to frequent volcanic eruptions (ref. 41; Fig. 4E). Solar activity modulates patterns in surface temperature and pressure that resemble NAO phases, through dynamical coupling processes between the stratosphere and the troposphere that transmit the solar signal to the Earth’s surface. The increase in sulphur aerosols from tropical volcanic emissions produces stratospheric and surface conditions that resemble the positive NAO phase and cause decrease in oceanic heat content, with long-lived temperature anomalies extending to the mid-depth and deep ocean, an increase in sea ice volume and enhancement in the overturning circulation of the North Atlantic Ocean following these eruptions. These phenomena may have shaped the North Atlantic atmospheric pattern, which in turn may have led to Aegean SSTs cooling and thus surface buoyancy loss and enhanced Eastern Mediterranean deep-water formation during EMT-like events.
68. Tang et al., 2016 The thermal structure and energy balance of upper atmosphere are dominated by solar activity. … [T]he results show that the global T-CPM [Temperature of Cold-Point-Mesopause] is significantly correlated to solar activity at the 0.05 level of significance with correlation coefficient of 0.90. … The co-relationship analysis shows that the T-CPM is significantly correlated to solar activity at the 0.05 level of significance for each latitude zone. The correlation coefficients at middle latitude regions are higher than those of equator and high latitude regions, and the global distribution takes on M-shape.
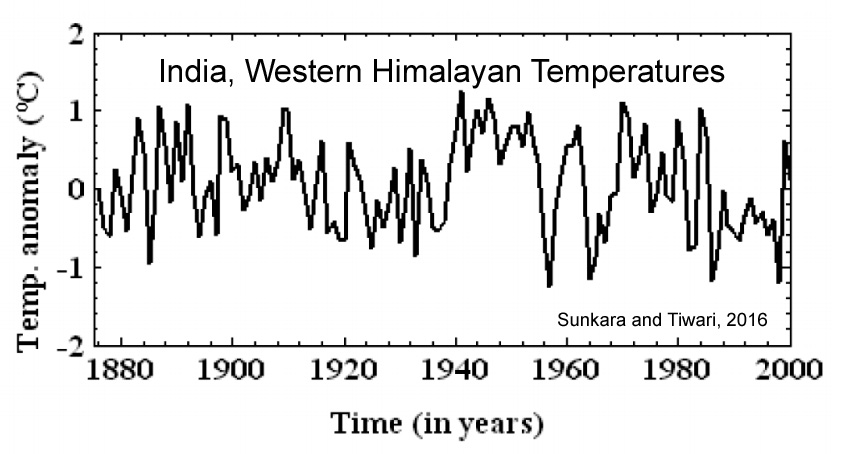
69. Sunkara and Tiwari, 2016 To study the imprints of the solar–ENSO–geomagnetic activity on the Indian subcontinent, we have applied singular spectral analysis (SSA) and wavelet analysis to the tree-ring temperature variability record from the Western Himalayas. Other data used in the present study are the solar sunspot number (SSN), geomagnetic indices (aa index), and the Southern Oscillation Index (SOI) for the common time period of 1876–2000. Both SSA and wavelet spectral analyses reveal the presence of 5–7-year short-term ENSO variations and the 11-year solar cycle, indicating the possible combined influences of solar–geomagnetic activities and ENSO on the Indian temperature. Another prominent signal corresponding to 33-year periodicity in the tree-ring record suggests the Sun-temperature variability link probably induced by changes in the basic state of the Earth’s atmosphere. In order to complement the above findings, we performed a wavelet analysis of SSA reconstructed time series, which agrees well with our earlier results and increases the signal-to-noise ratio, thereby showing the strong influence of solar–geomagnetic activity and ENSO throughout the entire period. … The present analyses suggest that the influence of solar activities on the Indian temperature variability operates in part indirectly through coupling of ENSO on multilateral timescales.
70. Usoskin et al., 2016 The corrected series is provided as supplementary material in electronic form and displays secular minima around 1800 (Dalton Minimum) and 1900 (Gleissberg Minimum), as well as the Modern Grand Maximum of activity in the second half of the twentieth century. The uniqueness of the grand maximum is confirmed for the last 250 years.
71. Sha et al., 2016 Solar forcing as an important trigger for West Greenland sea-ice variability over the last millennium … Here, we use diatom assemblages from a marine sediment core collected from the West Greenland shelf to reconstruct changes in sea-ice cover over the last millennium. The proxy-based reconstruction demonstrates a generally strong link between changes in sea-ice cover and solar variability during the last millennium. Weaker (or stronger) solar forcing may result in the increase (or decrease) in sea-ice cover west of Greenland. In addition, model simulations show that variations in solar activity not only affect local sea-ice formation, but also control the sea-ice transport from the Arctic Ocean through a sea-ice–ocean–atmosphere feedback mechanism.
72. Muthers et al., 2016 The influence of reduced solar forcing (grand solar minimum or geoengineering scenarios like solar radiation management) on the Atlantic meridional overturning circulation (AMOC) is assessed in an ensemble of atmosphere-oceanchemistry-climate model simulations. Ensemble sensitivity simulations are performed with and without interactive chemistry. Without chemistry-climate interaction the AMOC is intensified in the course of the solar radiation reduction (SRR), which is attributed to the thermal effect of the solar forcing: reduced sea surface temperatures and enhanced sea ice formation increase the density of the upper ocean in the North Atlantic and intensify the deepwater formation. In simulations with chemistry-climate interactions a second, dynamical effect on the AMOC is identified which counteracts the thermal effect. This dynamical mechanism is driven by the stratospheric cooling in response to the reduced solar forcing, which is strongest in the tropics and leads to a weakening of the Northern polar vortex.
73. Roy et al., 2016 Observational studies have suggested a significant solar related impact on sea surface temperatures in the tropical Pacific (van Loon et al., 2007, Meehl et al., 2008), tropical circulations (Haigh et al., 2005, Meehl et al., 2008), climatological precipitation maxima in the tropics (van Loon et al., 2004), Northern Hemisphere winter blocking (Barriopedro et al., 2008; Lockwood et al., 2010), North Atlantic Oscillation (NAO) (Lockwood et al., 2010, Maliniemi et al., 2013, 2014), Northern Annular Mode (NAM) (Ogi et al., 2004) and Antarctic polar vortex (Haigh and Roscoe, 2009).
74. Agnihotri, 2016 Summary and Recommendations: With increasing evidences from both continental (such as aforementioned examples of climate manifestations) as well as oceanic repositories [Agnihotri et al., 2002 & 2008; Kurian et al., 2009] from both hemispheres (i.e. northern as well as southern hemispheres), it is becoming clear that variations in Sun’s energy output despite being quantitatively very minute, appears to be capable of influencing terrestrial climate on decadal to centennial timescales, most likely due to involvement of certain key ocean-atmospheric feedback processes [Agnihotri & Dutta, 2003; Kodera, 2004; Ruzmaikin, 2007]. Exact causal mechanism(s) involved and necessary amplifying agents are still to be identified and understood in order to quantify role of this external forcing of climate.
75. Eicher, 2016 Climatic and insolation control on the high-resolution total air content in the NGRIP ice core … Here we present a highresolution TAC record over the whole North Greenland Ice Core Project ice core, covering the last 120 000 years, which independently supports an insolation signature in Greenland. Wavelet analysis reveals a clear precession and obliquity signal similar to previous findings on Antarctic TAC, with a different insolation history.
76. Sen and Ogrin, 2016 This paper investigates the monthly, winter, and annual temperature time series obtained from the instrumental records in Zagreb, Croatia, for the period 1864–2010. Using wavelet analysis, the dominant modes of variability in these temperature series are identified, and the time intervals over which these modes may persist are delineated. The results reveal that all three temperature records exhibit low frequency variability with a dominant periodicity at around 7.7 years. The 7.7-year cycle has also been observed in the temperature data recorded at several other stations in Europe, especially in Northern and Western Europe, and may be linked to the North Atlantic Oscillation (NAO) and/or solar/geomagnetic activity.
77. Maruyama, 2016 The interest in the relation between the solar activity and climate change is increasing. As for the solar activity, a fractal property of the sunspot series was studied by many works. In general, a fractal property was observed in the time series of dynamics of complex systems. The purposes of this study were to investigate the relationship between the sunspot number, solar radio flux at 10.7 cm (F10.7 cm) and total ozone from a view of multifractality. … The influence of the solar activity on the total ozone was shown by the wavelet coherence, phase and the similarity of the change of fractality. These findings will contribute to the research of the relationship between the solar activity and climate.
78. Poulos, 2016 The physical mechanism proposed is that planetary gravitational forces drive solar activity that in turn drives temperature variations in earth. The sun is in a boundary balance state at one hand collapsing due to gravity and at the other hand expanding due to fusion, and as such it should be heavily influenced by minimal external forcings such as planetary gravity. Sound waves in the solar mass, created from the planetary movement, are responsible for the formation of solar corona and sun spots. The Earth-Venus 251 year resonance is resonant to a near surface solar layer’s thermal natural frequency that “explodes” to form solar wind. The calculated solar wind properties match the observed.
79. Maliniemi, 2016 Observations of solar wind related climate effects in the Northern Hemisphere winter … Recent results, both observational and from chemistry climate models, have indicated significant effects in the Earth’s middle atmosphere due to the energetic electrons precipitating from the magnetosphere. These effects include the formation of reactive hydrogen and nitrogen oxides in the high latitude mesosphere and the depletion of ozone caused by them. Ozone is a radiatively active and important gas, which affects the thermal structure and dynamics of the middle atmosphere. Accordingly, the depletion of ozone can intensify the large scale stratospheric circulation pattern called the polar vortex. Winter weather conditions on the surface have been shown to be dependent on the polar vortex strength. … A comprehensive knowledge of the Earth’s climate system and all its drivers is crucial for the future projection of climate. Solar variability effects have been estimated to produce only a small factor to the global climate change. However, there is increasing evidence, including the results presented in this thesis, that the different forms of solar variability can have a substantial effect to regional and seasonal climate variability. With this new evidence, the solar wind related particle effects in the atmosphere are now gaining increasing attention. These effects will soon be included in the next coupled model inter comparison project (CMIP6) as an additional solar related climate effect.
80. Muthers et al., 2016 The influence of reduced solar forcing (grand solar minimum or geoengineering scenarios like solar radiation management) on the Atlantic Meridional Overturning Circulation (AMOC) is assessed in an ensemble of atmosphere–ocean–chemistry–climate model simulations. Ensemble sensitivity simulations are performed with and without interactive chemistry. In both experiments the AMOC is intensified in the course of the solar radiation reduction, which is attributed to the thermal effect of the solar forcing: reduced sea surface temperatures and enhanced sea ice formation increase the density of the upper ocean in the North Atlantic and intensify the deepwater formation. Furthermore, a second, dynamical effect on the AMOC is identified driven by the stratospheric cooling in response to the reduced solar forcing.
81. D’Aleo, 2016 The Sun may play a role in the Earth’s climate in many different ways. However, the Intergovernmental Panel on Climate Change (IPCC) has dismissed the Sun as the primary driver of climate based on the small observed changes of solar irradiance or solar brightness in the 11-year solar cycle. They admitted that indirect solar forcing through variations in ultraviolet, geomagnetic, solar wind, and solar-induced modulation of galactic cosmic rays remains plausible. Recent major changes in solar behavior, if they progress as many solar scientists suggest, to levels similar to the Dalton or even Maunder Minimum, will provide a test as to whether the Sun, not greenhouse gases, is indeed the dominant climate driver through a combination of direct and indirect factors.
82. Munz et al., 2016 We tested a possible solar component on the decadal-scale forcing of our SST records by evaluating the coherence of both time series with the record of reconstructed sunspot numbers (Solanki et al., 2004). The coherence pattern reveals, that both SST records and sunspot numbers are coherent on a wide range of periodicities (630, 190–230, 160, 110–130, 80–90, ~70, ~50 and ~40- years per cycle, Fig. 6d and e). This observation further strengthens the hypothesis that ISM [Indian Summer Monsoon] variability is not only controlled by orbital-scale insolation forcing, indicated by the long-term trend of warming temperatures and decreasing ISM intensity, but also by solar forcing. … [A]mplitude modulation of upwelling SST in the ~85- and ~120-year bandwidth are in-phase with amplitude modulation of solar irradiance.
83. Evans, 2016 Four manifestations of unconventional climate influences are identified, each with at least as much effect on surface temperature as the direct heating effect of changes in total solar irradiance (TSI): external-driven albedo; countervailing cooling during TSI peaks, implied by the absence of corresponding peaks in the surface temperature record (the “notch”); the long-term sensitivity of surface warming to TSI increases; and the delay of ∼11 years between changes in underlying or smoothed TSI and the corresponding changes in surface temperature. We hypothesize these are all manifestations of a single force whose exact mechanism is unknown but whose crucial properties can be deduced: “Force X” modulates the Earth’s albedo, and lags TSI by one sunspot cycle or half the ∼22-year cycle of the Sun’s hydromagnetic dynamo. A second, alternative hypothesis is of “force N” for the notch and “force D” for the delayed force causing the other three manifestations. The notch-delay solar model can explain the global warming of the last few decades and centuries in terms of force X/D. Several solar indicators including TSI peaked ∼1986, but surface warming continued until ∼1998, which is explained by the delay. The notch-delay hypothesis predicts sustained and significant global cooling starting sometime in the period 2017 to 2022, of ∼0.3°C but perhaps milder (TSI estimates vary), as force X/D falls off in response to the marked decline in underlying TSI from around 2004—one of the three biggest and fastest falls in TSI since sunspot records began in 1610.
84. Saarni et al., 2016 A late Holocene record of solar-forced atmospheric blocking variability over Northern Europe … Hence, the record allows reconstructing local climate and environmental conditions on interannual to the multi-centennial timescales. We find that minerogenic accumulation reflected in the detrital lamina exhibits a high multi-decadal to centennial-scale spectral coherency with proxies for solar activity, such as D14C, and Total Solar Irradiance, suggesting a strong link between solar variability and sediment transport to the lake basin. Increased catchment erosion is observed during periods of low solar activity, which we ascribe to the development of more frequent atmospheric winter blocking circulation induced by solar-forced changes in the stratosphere.
85. Damé et al., 2016 Solar Spectral Irradiance (SSI) in the UV, and its variability, are of prime importance to quantify the solar forcing on the climate through radiation and their interactions with the local stratosphere, noticeably through the “top-down” mechanism amplifying UV solar forcing on the climate (UV affects stratospheric dynamics and temperatures, altering interplanetary waves and weather patterns both poleward and downward to the lower stratosphere and tropopause regions).
86. Salas et al., 2016 Water reservoirs in the main aquifer (Section III) and in the Santa Juana dam are highly sensitive to ENSO oscillation climatic patterns. The main climatic events that control this record are the El Niño and La Niña events. In addition, the climatic influence of the westerlies and the SE extratropical moisture were also identified. Spectral analysis identified the presence of a 22.9-year cycle in piezometric levels of the alluvial aquifer of the Huasco River. This cycle is consistent with the 22-year Hale solar cycle, suggesting the existence of a solar forcing controlling the ENSO oscillations.
87. Fleitmann et al., 2016 The M6 δ18O record unveils temperature variations of up to 2°C during the last two millennia, with the temperature difference between the warmest decade of the Medieval Climate Anomaly (950-1250 CE) and the coldest decade of the Little Ice Age (1400-1700 CE) amounting to ~1.7°C. In general, higher cold season temperatures prevailed between 450 and 600 CE and 1000 and1150 CE. Lower temperatures were recorded between 650 and 900 CE and 1350 and1700 CE. Modeled cold season temperatures for the past millennium compare remarkably well with our reconstruction, and confirm the importance of both, solar forcing and internal variability, in driving Central European cold season temperatures.
88. Ogurtsov et al., 2016 A stable and significant positive correlation between summer temperatures in Northern Fennoscandia and sea surface temperature in the North Atlantic is shown to exist during the entire time interval. In addition, a significant correlation between solar activity and (a) summer temperature in Northern Fennoscandia as well as (b) surface temperature in the North Atlantic was found during AD 1715–1986.
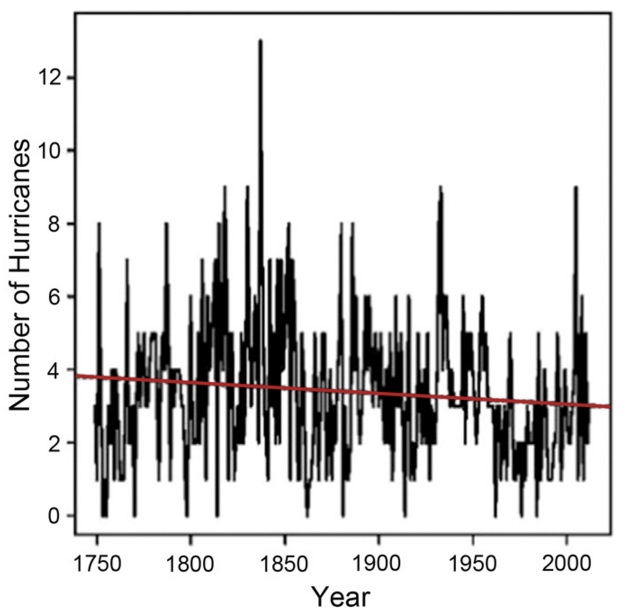
89. Martínez-Asensio et al., 2016 This study investigates the relationship between decadal changes in solar activity and sea level extremes along the European coasts and derived from tide gauge data. Autumn sea level extremes vary with the 11 year solar cycle at Venice as suggested by previous studies, but a similar link is also found at Trieste. In addition, a solar signal in winter sea level extremes is also found at Venice, Trieste, Marseille, Ceuta, Brest, and Newlyn. The influence of the solar cycle is also evident in the sea level extremes derived from a barotropic model with spatial patterns that are consistent with the correlations obtained at the tide gauges. This agreement indicates that the link to the solar cycle is through modulation of the atmospheric forcing. The only atmospheric regional pattern that showed variability at the 11 year period was the East Atlantic pattern.
90. Rojo-Garibaldi et al., 2016 We present the results of a time series analysis of hurricanes and sunspots occurring from 1749 to 2010. Exploratory analysis shows that the total number of hurricanes is declining. This decline is related to an increase in sunspot activity. Spectral analysis shows a relationship between hurricane oscillation periods and sunspot activity. Several sunspot cycles were identified from the time series analysis.
91. Larocca, 2016 Historical earthquakes registered in Chile (from 1900 up to 2015) with epicenters located between 17˚30’S and 56˚0’S latitude and yearly mean total sunspot number have been considered in order to evaluate a significant linkage between them. The occurrence of strong earthquakes along Chile and the sunspots activity are analyzed to inspect possible influence of solar cycles on earthquakes. The cross wavelet transform and wavelet coherence analysis were applied for sequences of sunspots and earthquakes activity. An 8 – 12 years [solar] modulation of earthquakes activity has been identified.
92. Kristoufek, 2016 After controlling for the effect of the CO2 emissions on temperatures, the dependence between sunspot numbers and temperatures increases considerably. Importantly, the connection is now statistically significant even for periods after 1960. The dominant scale overlaps with the one for original series, i.e. around 21-22 years. The correlation between series is positive and the changes in sunspot numbers precede the changes in temperatures, which is represented by phase arrows pointing southeast for the significant periods. In the same manner as for the original series, the relationship is much stronger for the northern hemisphere temperatures with statistically significant connection over the whole analyzed period [1880-2016]. …The relationship for the global temperature (Fig. 5) in a way represents an average between the southern and the northern hemisphere with statistically significant connection between the sunspot numbers and temperatures for almost the whole analyzed period [1880-2016]. For the significant regions, the connection is positive and changes in the solar activity precede changes in the global temperatures.
93. Easterbrook, 2016 Global temperature changes show excellent correlations with sunspots, total solar irradiance, 14C and 10Be production in the upper atmosphere, and cosmic ray incidence. Periods of global cooling coincided with these changes during the Oort, Wolf, Maunder, Dalton, 1880–1915, and 1945–1977 Solar Minimums. Increased14C and 10Be production during times of increased cosmic radiation serves as a proxy for solar activity. Increased cloudiness, produced by ionization of aerosols in the atmosphere by cosmic rays, causes increased reflection of incoming solar irradiance and results in cooling of the atmosphere. The amount of cosmic radiation is greatly affected by the sun’s magnetic field, so during times of weak solar magnetic field, more cosmic radiation reaches the Earth, creating more cloudiness and cooling the atmosphere. This mechanism accounts for the global synchronicity of climate changes, abrupt climate reversals, and climate changes on all time scales. Thus, cloud-generating cosmic rays provide a satisfactory explanation for both long-term and short-term climate changes.
94. Archibald and Fix, 2016 [T]he simulation model indicates that the effect of Uranus and Neptune lowered the peak amplitude of Solar Cycle 20 by a sunspot number of approximately 50, in turn causing the period of colder climate which became termed “the 1970s cooling period.”
95. Kodera and Thiéblemont, 2016 Inspired by the work of Labitzke and van Loon on solar/QBO modulation in the stratosphere, Barnett (1989) conducted an investigation on the relationship between the biannual component of the sea surface temperature (SST) in the equatorial eastern Pacific and the solar activity. He found that the amplitude of biannual component of the SST (BO) is modulated by the 11-year solar cycle: the amplitude of the BO is large during a period of low solar activity, but small during high solar activity. More than 25-years or two solar cycle has passed since his finding, but the relationship still holds. In order to get an insight into the mechanism of the solar modulation of the El Niño Southern Oscillation (ENSO), here we have revisited this problem. Solar cycle modulation of the BO in the tropical SST is discernible since the end of the 19th century, but the amplitude modulation is particularly clear after 1960’s. … [M]odulation of the ENSO variability by the solar cycle originates through a modulation of the El Niño Modoki rather than the canonical El Niño.
96. Midya et al., 2016 The influence of solar activity on climate has been a matter of debate for a long time. That solar activity affects the North Atlantic Oscillations (NAO) was also shown by Kodera and Kuroda (2002). They showed that during solar maximum phases, the NAO covers the northern hemisphere and extends to the stratosphere by contrast to the minima phases when it remains confined to the Atlantic sector and the troposphere. That solar activity plays an important role in influencing the precipitation on land and annual precipitation in Beijing is closely related to the variation of sunspot number has been observed by Zhao et al., (2004). It has been found that Indian rainfall is strongly correlated with the sunspot activity and overall trend is that during the period of low sunspot activity occurrence of rainfall is high compared to the period of high sunspot activity. (Hiremath, 2006). … It is quite expected that variable component of 10.7 cm solar flux plays a significant role for the production of water molecules in the vapour state and hence rainfall rate will be affected with variation of variable component of 10.7 cm solar flux. Our result shows that rainfall trend (both monsoon and total) decreases with the decrease of variable component of 10.7 cm solar flux.
97. Sánchez-Sesma, 2016 [W]e found that, on one side, the recent CO2 increase can be considered as a lagged response to solar activity, and, on the other side, the continental tropical climate signal during late Holocene can be considered as a sum of three lagged responses to solar activity, through direct, and indirect (volcanic and CO2), influences with different lags of around 40, 800 and 1600 years.
98. Jansen et al., 2016 The reconstructions show a large glacier readvance corresponding with the 8.2-ka cold event and a sequence of eight distinct glacier advances and retreats during the Neoglacial time period bracket between 4300 ± 40 cal. yr BP and AD 1900. … Based on a detailed comparison of our results with similar studies of both continental and maritime glaciers, as well as independent temperature proxy records across Scandinavia, we argue that significant and consistent deviations in ELA fluctuations between continental and maritime glaciers in the region are caused by a north–south migration of the arctic polar front. Additionally, we suggest that deviations in ELA fluctuations between Scandinavian maritime and continental glaciers around 7150, 6560, 6000, 5150, 3200 and 2200 cal. yr BP reflect the different response of continental and maritime glaciers to drops in total solar irradiance (TSI).
99. Cyzmzik et al., 2016 Calcite layer thickness oscillations of about 88 and 208 years resemble the solar Gleissberg and Suess cycles suggesting that the recorded hydroclimate changes in north-eastern Germany are modified by solar influences on synoptic-scale atmospheric circulation.
100. Lüdecke et al., 2016 Fourier analyses of worldwide temperature proxy data show a multitude of spectral lines, indicating multi-periodic dynamics of the climate system. The proxy data investigated in this study all show an approximately 200 year period, which has been related to the solar De Vries/Suess cycle. This cycle is consistent with temperature measurements from about 1750 to present, suggesting that the solar De Vries/Suess cycle is of importance for the recent and near future climate variations. … [A] 65 year cycle, indicative for the Atlantic Multidecadal Oscillation (AMO) or the Pacific Decadal Oscillation (PDO). The latter, together with the approximately 200 year [solar] cycle, appears to dominate the recent temperatures.
101. Wang et al., 2016 Decadal variability of tropical tropopause temperature and its relationship to the Pacific Decadal Oscillation … These model simulations suggest that both variable SSTs due to the interactive ocean and the 11-year solar cycle are important drivers of decadal variations in tropical TPTs [tropical tropopause temperatures]. … A negative PDO phase is accompanied by cold SST anomalies in the tropical eastern and central Pacific and warm SST anomalies in the North Pacific. This pattern of SST anomalies associated with the PDO is similar to that associated with the ENSO except that the PDO-related pattern has more pronounced signals in the North Pacific. These PDO associated SST anomalies have significant effects on TPTs [tropical tropopause temperatures] , shown as warm anomalies over the tropical and subtropical east and central Pacific, and cold anomalies in the midlatitudes of both hemispheres. … The PDO, therefore, has important effects on the decadal variability of the tropical TPTs. … The PDO index from the Natural and the NOQBO experiments reproduce the observed decadal peak, although at the 90% significance level in the Natural experiment. The decadal peak in the FixSolar experiment disappears and suggests a potential synchronization of decadal SST variability with the 11-year solar cycle, similar to what has recently found in the North Atlantic
102. Pérez-Rodríguez et al., 2016 Solar Output Controls Periodicity in Lake Productivity and Wetness at Southernmost South America … Intra-lake productivity variations show a periodicity of ~200–240 years coherent with the time series of TSI [total solar irradiance]-controlled cosmogenic nuclide 10Be production. In addition TSI dependent periodicity of Bond events (~1500 years) appear to control wetness at the LH site indicated by mineral matter erosion from the catchment to the lake assumingly through shifts of the position of the southern westerly wind belt. Thus, both intra-lake productivity and wetness at the southernmost South America are directly or indirectly controlled by TSI. … During the Holocene, one of the strongest effects on the Northern Hemisphere (NH) climate is attributed to the 1500 yrs cycle in solar output, known as Bond Cycles. Bond Cycles lead to periodic cooling and variations in the production of North Atlantic deep water and have also affected biogenic productivity in terrestrial aquatic systems.
103. Wang and Liu, 2016 The significant correlations between the reconstructed P36 and the El Niño-Southern Oscillation (ENSO), Pacific Decadal Oscillation (PDO) and sunspot numbers indicate that precipitation variability in the Qianshan Mountain region is probably driven by extensive atmosphere-sea interactions and solar activities.
Warming Trend Since 1980s Explained By Surface Solar Radiation (Cloud Cover Reduction)
104. Sanchez-Lorenzo et al., 2016 The linear trend in the mean annual series of global solar radiation shows a significant increase since the 1980s of around 10 Wm-2 over the whole 32-year study period. Similar significant increases are observed in the mean seasonal series, with the highest rate of absolute (relative) change during summer (autumn). These results are in line with the widespread increase of global solar radiation, also known as the brightening period, reported at many worldwide observation sites (e.g. Wild, 2009; Sanchez-Lorenzo et al., 2013b). … Summarizing, all these results point towards a diminution of clouds and/or aerosols in Spain since the 1980s.
105. Kambezidis et al., 2016 [T]his work investigates the evolution and trends in the surface net short-wave radiation (NSWR, surface solar radiation – reflected) over the Mediterranean Basin during the period 1979 − 2012 using monthly re-analysis datasets from the Modern Era Retrospective-Analysis for Research and Applications (MERRA) and aims to shed light on the specific role of clouds on the NSWR trends. The solar dimming/brightening phenomenon is temporally and spatially analyzed over the Mediterranean Basin. The spatially-averaged NSWR [surface solar radiation – reflected] over the whole Mediterranean Basin was found to increase in MERRA by +0.36 Wm−2 per decade, with higher rates over the western Mediterranean (+0.82 Wm−2 per decade), and especially during spring (March-April-May; +1.3 Wm−2 per decade). … The increasing trends in NSWR are mostly associated with decreasing ones in cloud optical depth (COD), especially for the low (<700 hPa) clouds. The decreasing COD trends (less opaque clouds and/or decrease in absolute cloudiness) are more pronounced during spring, thus controlling the increasing tendency in NSWR.
106. Calbó et al., 2016 The present paper describes how the entire series of global solar radiation (1987–2014) and diffuse radiation (1994–2014) were built, including the quality control process. Appropriate corrections to the diffuse component were made when a shadowband was employed to make measurements. Analysis of the series reveals that annual mean global irradiance presents a statistically significant increase of 2.5 W m−2 (1.4 %) decade−1 (1988–2014 period), mainly due to what occurs in summer (5.6 W m−2 decade−1). These results constitute the first assessment of solar radiation trends for the northeastern region of the Iberian Peninsula and are consistent with trends observed in the regional surroundings and also by satellite platforms, in agreement with the global brightening phenomenon. Diffuse radiation has decreased at −1.3 W m−2 (−2 %) decade−1 (1994–2014 period), which is a further indication of the reduced cloudiness and/or aerosol load causing the changes.
107. Du et al., 2016 Although the global warming has been successfully attributed to the elevated atmospheric greenhouses gases, the reasons for spatiotemporal patterns the warming rates are still under debate. In this paper, we report surface and air warming based on observations collected at 1,977 stations in China from 1960 to 2003. Our results show that the warming of daily maximum surface (Ts-max) and air (Ta-max) temperatures showed a significant spatial pattern, stronger in the northwest China and weaker in South China and the North China Plain. These warming spatial patterns are attributed to surface shortwave solar radiation (SSR) and precipitation, the key parameters of surface energy budget.
Periods With Low Solar Activity (Little Ice Age) Correlate With Cooling; Periods With High Solar Activity (Modern Maximum, Medieval Maximum) Correlate With Warming
108. Andres, 2016 Reconstructions of historical climate changes indicate that surface air temperatures decreased over the preindustrial last millennium. Conflicting explanations have been proposed for the cause of the transition from the Medieval Climate Anomaly (MCA) in the early part of the last millennium to the Little Ice Age (LIA) near its end. The possible causes include volcanic emissions, total solar irradiance (TSI) variations, greenhouse gas concentration fluctuations and orbital forcing variations. In the present paper, we demonstrate that all of these climate forcings contribute significantly to simulated surface air temperature and sea ice concentration changes over this period. On the other hand, simulated ocean heat content appears to respond significantly only to volcanic and TSI [total solar irradiance] variations. In simulations at T85 resolution, TSI [total solar irradiance] reductions and volcanic emissions together generate significant increases in sea ice extent in the Barents Sea, which we find to be responsible for most of the temperature reductions over north-western Europe.
109. Xing et al., 2016 The comparison between MDVM reconstructed temperature and the variation of external forcing (solar activity and volcanic activity) is shown in Fig. 5. The smoothed MDVM reconstruction exhibited a general agreement with the variation of the reconstructed total solar irradiance (TSI), and the correlation between the two series during the common period 849–2000 AD was significant (r = 0.498, edf = 34, p<0.01). Specially, the records shared high correlation coefficients in the epochs of the solar maximum (i.e. during the Medieval and Modern age), but poor correlation around 1500–1700 AD when the Spörer Minimum and Maunder Minimum occurred. It was similar to some other dendrochronological researches concerning the relation with solar activity. The relatively cold conditions between the two warm peaks around AD 1000 and 1100 seemed to be related to the Oort Minimum. …. Therefore, the temperature reconstructions based on the MDVM method agreed well in general with the characteristic variations of the solar and volcanic forcings. … It was also reported that the abrupt onset of the LIA was likely triggered by a succession of strong volcanic eruptions and sustained by sea-ice/ocean feedbacks. According to mainstream opinions, the LIA type events were probably attributed to a combination of solar minima and volcanic eruptions.
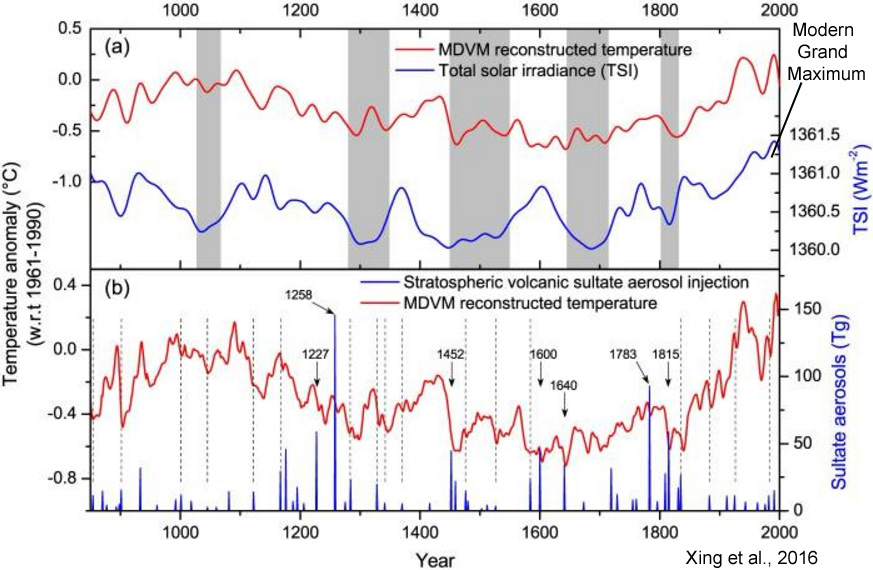
110. Voarintsoa et al., 2016 Multiple proxies … from Dante Cave [southwestern Africa] indicate a linkage between changes in hydroclimate in northeastern Namibia and changes in solar activity and changes in global temperatures. The record suggests that during solar minima and globally cooler conditions (ca. 1660–1710 and ca. 1790–1830 [Little Ice Age]), wetter periods (reflecting longer summer seasons) in northeastern Namibia were linked to advances of the Inter-Tropical Convergence Zone (ITCZ) and the Inter-Ocean Convergence Zone (IOCZ) southwestward.
111. Chambers, 2016 The so-called ‘Little Ice Age’ (LIA) of the 15th–19th centuries [1400-1900 AD] is a fascinating period of time, for many reasons. Extensive reading of the literature on the topic can reveal the following: (1) in many (but not all) proxy-climate reconstructions, it is shown as having a fast and strong onset (O’Brien et al., 1995), exceeded in the Holocene perhaps only by the 8.2ka event (Mayewski et al., 2004); (2) it includes evidence for glacier re-advance – in northern Europe, particularly, to positions not otherwise (or seldom) reached within the mid–late Holocene (McCarroll, 1991; Matthews and Shakesby, 1984; Nesje, 2009); (3) it follows the Medieval Climate Anomaly (MCA) and precedes the period of recent ‘Global Warming’, and therefore, it post-dates the Medieval Solar Maximum, encompasses up to three solar minima (Spörer, Maunder and Dalton) (Grove, 1988), and precedes the ‘Contemporary’ (namely, late 20th century) Solar Maximum (Hoyt and Schatten, 1997; Pan and Yau, 2002); (4) there are multiple hypotheses as to the cause of its onset (cf. Miller et al., 2012), although it is widely considered that reduced solar activity is the cause of at least its most intense phases (cf. Mauquoy et al., 2002) …. (12) recent work implies an in-phase relationship between the Southern and Northern Hemispheres [the Little Ice Age was a global event] (Chambers et al., 2014; Simms et al., 2012).
112. Sanchez-Lopez et al., 2016 The dominant warm and arid conditions during the MCA [Medieval Climate Anomaly, 900-1300 CE], and the cold and wet conditions during the LIA [Little Ice Age, 1300-1850 CE] indicate the interplay of the NAO+, EA+ and NAO- , EA- [positive/negative North Atlantic Oscillation, East Atlantic phases], respectively. Furthermore, the higher solar irradiance during the [“warm conditions”] RP [Roman Period, 200 BCE – 500 CE] and MCA [Medieval Climate Anomaly, 900-1300 CE] may support the predominance of the EA+ [positive East Atlantic] phase, whereas the opposite scenario [“colder temperatures”] during the EMA [Early Middle Age, 500-900 CE] and LIA [Little Ice Age, 1300-1850 CE] may support the predominance of the EA- [negative East Atlantic] phase, which would favour the occurrence of frequent and persistent blocking events in the Atlantic region during these periods.
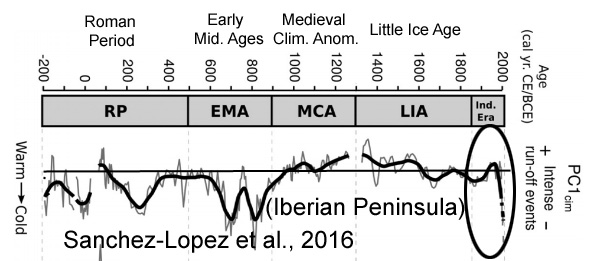
113. Bauchi Danladi and Akçer-Ön, 2016 Due to the variability of the Little Ice Age (LIA) and Medieval Climatic Anomaly (MCA), several climatic forcing mechanisms have been invoked to enlighten the issue. The focus of this study is on the influence of the solar activity proxy (Total Solar Irradiance) during the LIA and MCA in a high altitude Lake Salda in south-western Anatolia. … [T]he sediment records cover the last millennium. We have observed the effect of the solar activity throughout the LIA and MCA in Lake Salda, with wet and dry spells corresponding to high and low TSI [total solar irradiance] respectively.In addition, the Dalton Minimum, Maunder Minimum, Spörer Minimum, Wolf Minimum, the Medieval Maximum and the Oort Minimum have been observed.
114. Li et al., 2016 Our results support the view that over the past millennium, on a multi-centennial timescale, the moisture variations in ACA [arid Central Asia] were generally out-of-phase with those in the region affected by the Asian summer monsoon. The humid, unstable LIA [Little Ice Age] climate in ACA [arid Central Asia] may have been associated with changes in the North Atlantic Oscillation (NAO) index and/or with variations in solar irradiance.
115. Guo et al., 2016 A regional synthesis of the palaeoflood chronology over the last 3000 years was compiled along the middle Yangtze River. Extraordinary flood events generally seem to be correlated with late Holocene climatic variability (i.e. Neoglacial cooling, Roman Warm Period, Dark Ages Cold Period, Medieval Climate Anomaly, and Little Ice Age). The high-resolution climatic proxies from stalagmites of the Dongge cave and Heshang cave, ice-cores of the GRIP, the total solar irradiance variations and sunspot number, and ENSO activities suggest that these hydroclimatic events are possibly related to the weaker Asia summer monsoon and the cooling climatic events, as well as the stronger ENSO activities during the late Holocene in the Yangtze River valley. These results provide insights into the response of hydroclimatic system to global change in the large rivers of Asia.
116. Miettinen et al., 2016 The results demonstrate both abrupt changes and a clear centennial-bicentennial variability for the last millennium. The Medieval Climate Anomaly (MCA) between 1000 and 1200 CE represents the warmest ocean surface conditions of the SE Greenland shelf over the late Holocene (880 BCE-1910 CE). MCA [Medieval Climate Anomaly] in the current record is characterized by abrupt, decadal to multidecadal changes, such as an abrupt warming of ~2.4 °C in 55 years around 1000 CE. Temperature changes of these magnitudes are rarely observed in other proxy records from the North Atlantic. … A cool phase, from 1200-1890 CE, associated with the Little Ice Age (LIA), ends with the rapid warming of aSST and diminished aSIC in the early 20th century. The phases of warm aSST and aSIC minima on the SE Greenland shelf and solar minima of the last millennium are antiphased, suggesting that solar forcing possibly amplified by atmospheric forcing has been behind the aSST variability on the SE Greenland over the last millennium.
117. Zhu et al., 2016 During the period 1875–1955, late summer temperature fluctuated less strongly than before or thereafter. In general, the average length of cold periods was shorter than that of warm periods. The cold period of 1869–1877 was the longest and coldest cool period had a mean of 17.63°C. The longest warm period extended from 1655 to 1668, and the warmest period in AD 1719–1730 had a mean of 20.37°C. However, we should point out that the rapid warming during the 20th century was not especially obvious in our reconstructed RLST. … [S]even cold periods and three warm periods were identified during the past 368 years. All the cold periods were during the Maunder (1708–1711) or Dalton (1818– 1821, 1824–1828, 1832–1836, and 1839–1842) solar minima periods, except for the cold periods of 1765–1769 and 1869–1877 (Eddy, 1976; Shindell et al., 1999), which indicated that RLST [mean maximum temperature] variations in the NWSP [northwestern Sichuan Plateau, China ] might be driven by solar activity. On the other hand, volcanic eruptions in the corresponding periods might also be a cooling factor (Fig. 7b). A longer cold period (e.g., 1820s–1840s) was interrupted by transient warming, thus forming a plurality of discontinuous short cold periods. Warm periods of 1719–1730 and 1858–1859 both had more sunspots (Eddy, 1976; Shindell et al., 1999) and lower volcanic forcing. The cold (1765–1769 or 1869–1877) and warm (1655–1668) periods were highly consistent with other studies (Fig. 7). … Accompanied by significant peaks at 60.2 and 73 years, the continuously periodicities around 49–114 years in our regional temperature reconstruction might tentatively be related to PDO, Atlantic Multidecadal Oscillation (AMO; En- field et al., 2001) as well as solar activity (Eddy, 1976; Shindell et al., 1999; Peristykh and Damon, 2003; Raspopov et al., 2004; Braun et al., 2005). … [S]ignificant multidecadal- and centennial-scale cycles of our temperature reconstruction might include the signs of solar activity, such as the Gleissberg cycles (Peristykh and Damon, 2003), Suess cycles (Braun et al., 2005), Bruckner cycles (Raspopov et al., 2004), and Schwabe cycles (Braun et al., 2005). The Maunder (ca. AD 1645–1715) and Dalton (ca. AD 1790–1840) solar minima periods were generally associated with temperature depressions (Eddy, 1976), and the Damon (ca. AD 1890– 1920) solar maximum period occurred in a relatively warm period, which further confirmed that late summer temperature variation in the NWSP [northwestern Sichuan Plateau, China ] might be driven by solar activity. … Conclusion: Overall, the RLST [mean maximum temperature] variability in the NWSP [northwestern Sichuan Plateau, China] might be associated with global land–sea atmospheric circulation (e.g., ENSO, PDO, or AMO) as well as solar and volcanic forcing.
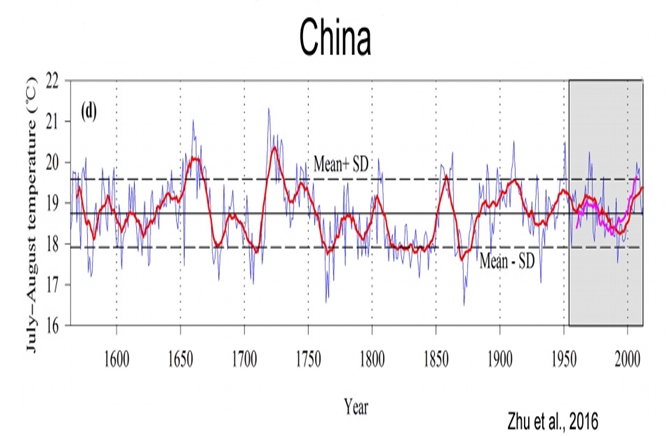
118. Lyu et al., 2016 The reconstructed April–July MMT series exhibited six cold and seven warm periods. The longest cold period lasted from AD 1645 to 1677 (33 years), with an average temperature of 0.5°C below the mean value. The longest warm period, however, lasted from AD 1767 to 1785 (19 years), and the average temperature was 0.69°C above the mean value (Table 4). Four cold (1605–1616, 1645–1677, 1911–1924, and 1951–1969) and warm (1795–1807, 1838– 1848, 1856–1873, and 1991–2008) periods were consistent with other results of tree-ring reconstructions in northeast China (Shao and Wu, 1997; Yin et al., 2009; Wang et al., 2012; Zhu et al., 2015). In addition, two cold periods (1645– 1677 and 1684–1691) were consistent with the Maunder Minimum (1645–1715), an interval of decreased solar irradiance (Bard et al., 2000). … The three temperature series exhibited significantly low temperature periods during the 1950s–1970s, which coincided with a slight decrease in solar activity from AD 1940 to 1970 (Beer et al., 2000; Fig. 7). … [P]revious studies suggest that climate change in northeast China was also linked to the solar activities and global land–sea atmospheric circulation during certain pre-instrumental periods (Chen et al., 2006; Wang et al., 2011; Liu et al., 2013). It is generally accepted that the climate warms during periods of strong solar activity (e.g., the Medieval Warm Period) and cools during periods of low solar activity (e.g., the Little Ice Age; Lean and Rind, 1999; Bond et al., 2001).

119. Hanna, 2016 Temperature reconshttps://notrickszone.com/wp-content/uploads/2016/12/Holocene-Cooling-China-Lyu16.jpgtructions from Simpson Lagoon also show similarities with regional and pan-Arctic climate records over the last few millennia, with evidence of temperature departures correlative with noted climate events (i.e., Little Ice Age, Medieval Climate Anomaly). … This paleoclimate variability may be driven by variations in solar output and/or shifts in the regional ocean-atmosphere circulation patterns (e.g., the Aleutian Low).
120. Luoto and Nevalainen, 2016 The 700-year long temperature reconstructions from three sites at multi-decadal temporal resolution showed similar trends, although they had differences in timing of the cold Little Ice Age (LIA) and the initiation of recent warming. The 2000-year multi-centennial reconstructions from three different sites showed resemblance with each other having clear signals of the Medieval Climate Anomaly (MCA) and LIA, but with differences in their timing. The influence of external forcing on climate of the southern and central sites appeared to be complex at the decadal scale, but the North Atlantic Oscillation (NAO) was closely linked to the temperature development of the northern site. Solar activity appears to be synchronous with the temperature fluctuations at the multi-centennial scale in all the sites. The present study provides new insights into centennial and decadal variability in air temperature dynamics in Northern Europe and on the external forcing behind these trends.
Projected 21st Century Cooler Temperatures Due To Lower Solar Activity
121. Abdussamatov, 2016 The quasi-centennial epoch of the new Little Ice Age has started at the end 2015 after the maximum phase of solar cycle 24. The start of a solar grand minimum is anticipated in solar cycle 27 ± 1 in 2043 ± 11 and the beginning of phase of deep cooling in the new Little Ice Age in 2060 ± 11. The gradual weakening of the Gulf Stream leads to stronger cooling in the zone of its action in western Europe and the eastern parts of the United States and Canada. Quasi-bicentennial cyclic variations of TSI together with successive very important influences of the causal feedback effects are the main fundamental causes of corresponding alternations in climate variation from warming to the Little Ice Age.
122. Yndestad and Solheim, 2016 In 1890’s G. Spörer and E. W. Maunder (1890) reported that the solar activity stopped in a period of 70 years from 1645 to 1715. Later a reconstruction of the solar activity confirms the grand minima Maunder (1640-1720), Spörer (1390-1550), Wolf (1270-1340), and the minima Oort (1010-1070) and Dalton (1785-1810) since the year 1000 A.D. (Usoskin et al. 2007). These minimum periods have been associated with less irradiation from the Sun and cold climate periods on Earth. An identification of a three grand Maunder type periods and two Dalton type periods in a period thousand years, indicates that sooner or later there will be a colder climate on Earth from a new Maunder- or Dalton- type period. …. The result shows that the TSI variability and the sunspots variability have deterministic oscillations, controlled by the large planets Jupiter, Uranus and Neptune, as the first cause. A deterministic model of TSI [total solar irradiance] variability and sunspot variability confirms the known minimum and grand minimum periods since 1000. From this deterministic model we may expect a new Maunder type sunspot minimum period from about 2018 to 2055. The deterministic model of a TSI ACRIM data series from 1700 computes a new Maunder type grand minimum period from 2015 to 2071. A model of the longer TSI ACRIM data series from 1000 computes a new Dalton to Maunder type minimum irradiation period from 2047 to 2068.
123. Torres and Guzmán, 2016 Based on our results, we propose the use of the Wolf’s Number Oscillation Index (WNOI) – as a more uniform alternative to the ONI – in the range over 30 and below -30. The analysis of the material presented and the arguments discussed allows us to define a possible relationship between phenomena related to Solar Cycle, the ENSO, climatic conditions, as well as some criteria for the establishment of public policies for preservation and remediation of the environment in the long run. We can conclude that solar activity oscillations impact the earth climatic conditions to such a extent that they become measurable only in the long run. The magnitude of the Solar Cycle – from 7 to 17 and a mean of 11.2 years – seems to support this statement. Based on the similarities of the Solar Cycles 5 and 24 we can expect a longer period of cold weather for the years 2022 y/o 2034, corresponding to the Solar Cycles 24 and 25.
124. Chiodo et al., 2016 Solar variability represents a source of uncertainty in the future forcings used in climate model simulations. Current knowledge indicates that a descent of solar activity into an extended minimum state is a possible scenario. With aid of experiments from a state-of-the-art Earth system model, we investigate the impact of a future solar minimum on Northern Hemisphere climate change projections. This scenario is constructed from recent 11 year solar-cycle minima of the solar spectral irradiance, and is therefore more conservative than the ‘grand’ minima employed in some previous modeling studies. Despite the small reduction in total solar irradiance (0.36 W m−2), relatively large responses emerge in the winter Northern Hemisphere, with a reduction in regional-scale projected warming by up to 40%. To identify the origin of the enhanced regional signals, we assess the role of the different mechanisms by performing additional experiments forced only by irradiance changes at different wavelengths of the solar spectrum. We find that a reduction in visible irradiance drives changes in the stationary wave pattern of the North Pacific and sea–ice cover. A decrease in UV irradiance leads to smaller surface signals, although its regional effects are not negligible. These results point to a distinct but additive role of UV and visible irradiance in the Earth’s climate, and stress the need to account for solar forcing as a source of uncertainty in regional scale projections.
125. Sanchez-Sesma, 2016 This empirical modeling of solar recurrent patterns has also provided a consequent multi-millennial-scale experimental forecast, suggesting a solar decreasing trend toward grand (super) minimum conditions for the upcoming period, AD 2050–2250 (AD 3750–4450). … Solar activity (SA) has non-linear characteristics that influence multiple scales in solar processes (Vlahos and Georgoulis, 2004). For instance, millennia-scale solar oscillations have been recently detected, like those of about 6000 and 2400 years, by Xapsos and Burke (2009) and Charvátová (2000), respectively, with important and interesting influences in the near, past and future climate. These millennialscale patterns of reconstructed SA variability could justify epochs of low activity, such as the Maunder minimum, as well as epochs of enhanced activity, such as the current Modern Maximum, and the Medieval maximum in the 12th century. …We can conclude that the evidence provided is sufficient to justify a complete updating and reviewing of present climate models to better consider these detected natural recurrences and lags in solar processes.
Past Periods of Low Solar Activity Led to Cooling, More Droughts, Floods, and Hurricanes, Famines, Plagues, and Agricultural/Socioeconomic Collapse
126. Camenisch et al., 2016 Climate reconstructions from a multitude of natural and human archives indicate that, during winter, the period of the early Spörer Minimum (1431–1440 CE) was the coldest decade in Central Europe in the 15th century. The particularly cold winters and normal but wet summers resulted in a strong seasonal cycle that challenged food production and led to increasing food prices, a subsistence crisis, and a famine in parts of Europe. As a consequence, authorities implemented adaptation measures, such as the installation of grain storage capacities, in order to be prepared for future events. The 15th century is characterised by a grand solar minimum and enhanced volcanic activity, which both imply a reduction of seasonality.
127. Chae and Park, 2016 We present a multi-proxy record (pollen, microscopic charcoal, carbon-isotopic composition [δ13C], organic content, and particle size) of the late-Holocene climate change and human impact from central-eastern South Korea. The Medieval Climate Anomaly (MCA) and Little Ice Age (LIA), the most recent major climate events, have not been accurately investigated by paleolimnological studies in Korea, mainly due to a lack of undisturbed sediments and indifference to the past climate change. Our pollen records show late- Holocene centennial climate variations characterized by the successive solar minimums of the Oort, Wolf, Spörer, Maunder, and Dalton.We find paleoenvironmental evidence for shifting cultivation associated with serious droughts and consequent famines during the early 19th-century Dalton minimum. Our interpretation of human activities is well supported by Korean historical documents describing socioeconomic suffering induced by LIA climate deteriorations.
128. Büntgen et al., 2016 Climatic changes during the first half of the Common Era have been suggested to play a role in societal reorganizations in Europe and Asia. In particular, the sixth century coincides with rising and falling civilizations, pandemics, human migration and political turmoil. Our understanding of the magnitude and spatial extent as well as the possible causes and concurrences of climate change during this period is, however, still limited. Here we use tree-ring chronologies from the Russian Altai and European Alps to reconstruct summer temperatures over the past two millennia. We find an unprecedented, long-lasting and spatially synchronized cooling following a cluster of large volcanic eruptions in 536, 540 and 547 AD, which was probably sustained by ocean and sea-ice feedbacks, as well as a solar minimum. We thus identify the interval from 536 to about 660 AD as the Late Antique Little Ice Age. Spanning most of the Northern Hemisphere, we suggest that this cold phase be considered as an additional environmental factor contributing to the establishment of the Justinian plague, transformation of the eastern Roman Empire and collapse of the Sasanian Empire, movements out of the Asian steppe and Arabian Peninsula, spread of Slavic-speaking peoples and political upheavals in China.
129. Katsuki et al., 2016 [W]e reconstructed the history of typhoon and storm-rain activity only for the interval AD 1400–1900. The record indicates that typhoon frequency throughout the Korean Peninsula varied in response to the state of the El Niño/Southern Oscillation. Typhoon variability was likely modulated further by the state of the East Asia summer monsoon (EASM) pattern, associated with variation in the magnitude of solar irradiance. During periods of minimum solar activity, such as the early Maunder Minimum (AD 1650–1675), typhoons struck the east China coast and Korean Peninsula more frequently because of a strengthened EASM.
130. Gogou et al., 2016 We provide new evidence on sea surface temperature (SST) variations and paleoceanographic/paleoenvironmental changes over the past 1500 years for the north Aegean Sea (NE Mediterranean). The reconstructions are based on multiproxy analyses, obtained from the high resolution (decadal to multi-decadal) marine record M2 retrieved from the Athos basin. Reconstructed SSTs show an increase from ca. 850 to 950 AD and from ca. 1100 to 1300 AD. A cooling phase of almost 1.5°C is observed from ca. 1600 AD to 1700 AD. This seems to have been the starting point of a continuous SST warming trend until the end of the reconstructed period, interrupted by two prominent cooling events at 1832 ± 15 AD and 1995 ± 1 AD. … Internal variability in atmospheric/oceanic circulations systems as well as external forcing as solar radiation and volcanic activity could have affected temperature variations in the north Aegean Sea over the past 1500 years. …The paleoclimatic evidence derived from the M2 record is combined with a socio-environmental study of the history of the north Aegean region. We show that the cultivation of temperature-sensitive crops, i.e. walnut, vine and olive, co-occurred with stable and warmer temperatures, while its end coincided with a significant episode of cooler temperatures. Periods of agricultural growth in Macedonia coincide with periods of warmer and more stable SSTs, but further exploration is required in order to identify the causal links behind the observed phenomena. The Black Death likely caused major changes in agricultural activity in the north Aegean region, as reflected in the pollen data from land sites of Macedonia and the M2 proxy-reconstructions. Finally, we conclude that the early modern peaks in mountain vegetation in the Rhodope and Macedonia highlands, visible also in the M2 record, were very likely climate-driven.
131. Stockhecke et al., 2016 Millennial to orbital-scale rainfall changes in the Mediterranean region and corresponding variations in vegetation patterns were the result of large-scale atmospheric reorganizations. In spite of recent efforts to reconstruct this variability using a range of proxy archives, the underlying physical mechanisms have remained elusive. Through the analysis of a new high-resolution sedimentary section from Lake Van (Turkey) along with climate modeling experiments, we identify massive droughts in the Eastern Mediterranean for the past four glacial cycles, which have a pervasive link with known intervals of enhanced North Atlantic glacial iceberg calving, weaker Atlantic Meridional Overturning Circulation and Dansgaard-Oeschger cold conditions. On orbital timescales, the topographic effect of large Northern Hemisphere ice sheets and periods with minimum insolation [low solar activity] seasonality further exacerbated drought intensities by suppressing both summer and winter precipitation.
132. Kaniewski et al., 2016 Solar pacing of storm surges, coastal flooding and agricultural losses in the Central Mediterranean … Storm surges, leading to catastrophic coastal flooding, are amongst the most feared natural hazards due to the high population densities and economic importance of littoral areas. Using the Central Mediterranean Sea as a model system, we provide strong evidence for enhanced periods of storminess leading to coastal flooding during the last 4500 years. We show that long-term correlations can be drawn between storminess and solar activity, acting on cycles of around 2200-yr and 230-yr. We also find that phases of increased storms and coastal flooding have impacted upon mid- to late Holocene agricultural activity on the Adriatic coast. Based on the general trend observed during the second half of the 20th century, climate models are predicting a weakening of Mediterranean storminess. By contrast, our new data suggest that a decrease in solar activity will increase and intensify the risk of frequent flooding in coastal areas.
II. Natural Oceanic/Atmospheric Oscillation (ENSO, NAO, AMO, PDO, AMOC) Influence On Climate (45)
Griffiths et al., 2016 Interdecadal modes of tropical Pacific ocean-atmosphere circulation have a strong influence on global temperature, yet the extent to which these phenomena influence global climate on multicentury timescales is still poorly known. … Our findings, together with climate model simulations, highlight the likelihood that century-scale variations in tropical Pacific climate modes can significantly modulate radiatively forced shifts in global temperature.
[press release] El Niño oscillations in Pacific Ocean may have amplified global climate fluctuations for hundreds of years at a time … Scientists have found past El Niño oscillations in the Pacific Ocean may have amplified global climate fluctuations for hundreds of years at a time. The team uncovered century-scale patterns in Pacific rainfall and temperature, and linked them with global climate changes in the past 2000 years. For example, northern hemisphere warming and droughts between the years 950 and 1250 [Medieval Warm Period] corresponded to an El Niño-like state in the Pacific, which switched to a La Niña-like pattern during a cold period between 1350 and 1900 [Little Ice Age].
Yamoah et al., 2016 Highlights: (a) δD of precipitation in Thailand is dominated by the amount effect and ENSO dynamics on annual timescales. (b) Mainland SE Asia becomes wetter and drier during El Niño and La Niña-like climate, respectively, on centennial timescales (c) Our study provides empirical support for observed composite ENSO pattern extracted from instrumental data.
Faust et al., 2016 A recent study of instrumental time series revealed NAO as main factor for a strong relation between winter temperature, precipitation and river discharge in central Norway over the past 50 years. … Conditioned on a stationary relation between our climate proxy and the NAO we establish a first high resolution NAO proxy record from marine sediments covering the past 2800 years. The [NAO proxy record] shows distinct co-variability with climate changes over Greenland, solar activity and Northern Hemisphere glacier dynamics as well as climatically associated paleo-demographic trends. The here presented climate record shows that fjord sediments provide crucial information for an improved understanding of the linkages between atmospheric circulation, solar and oceanic forcing factors.
Orme et al., 2016 Northern Europe can be strongly influenced by winter storms driven by the North Atlantic Oscillation (NAO), with a positive NAO index associated with greater storminess in northern Europe. The results suggest storminess increased after 1000 cal yrs BP, with higher storminess during the Medieval Climate Anomaly (MCA) than the LIA, supporting the hypothesis that the NAO-storminess relationship was consistent with the [modern] instrumental period. However the shift from a predominantly negative to positive NAO at c.2000 cal yrs BP preceded the increased storminess by 1000 years. We suggest that the long-term trends in storminess were caused by insolation [solar radiation] changes, while oceanic forcing may have influenced millennial variability.
Shi et al., 2016 Our reconstructed December–February mean temperature shows a close association with the Atlantic Multidecadal Oscillation (AMO) over the past three centuries, with warm (cold) periods coinciding with the positive (negative) phases of the AMO. This persistent relationship suggests that the AMO may have been a key driver of multidecadal winter temperature variations on the southeastern TP [Tibetan Plateau].
Jalali et al., 2016 Several proxy records have documented surface water variability of the Mediterranean Sea during the Holocene (Kallel et al., 1997a, b, 2004; Cacho et al., 2001; Guinta et al., 2001; Rohling et al., 2002; Emeis et al., 2003; Essalami et al., 2007; Frigola et al., 2007; Castañeda et al., 2010; Boussetta et al., 2012; Martrat et al., 2014). Most of them reveal that Mediterranean Sea surface temperatures (SSTs) have undergone a long-term cooling punctuated by several cold relapses (CRs; Cacho et al., 2001; Frigola et al., 2007). While orbital forcing likely explains this long-term tendency, solar activity and volcanism contribute to forced variability (Mayewski et al., 2004; Wanner et al., 2011) together with internal variability (i.e. Atlantic multi-decadal variability (AMV), North Atlantic Oscillation; NAO) all together embedded in the multi-decadal scale variability seen in paleorecords.
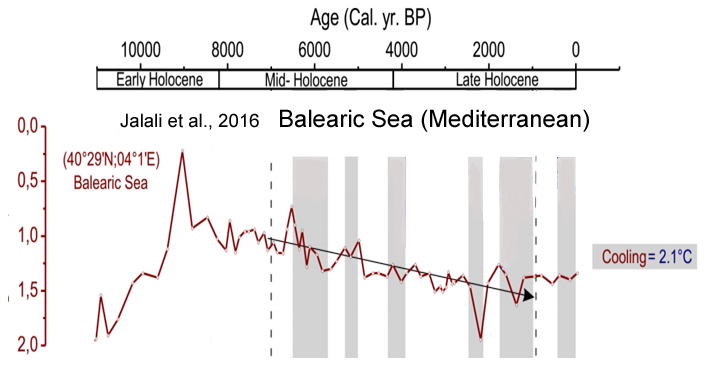
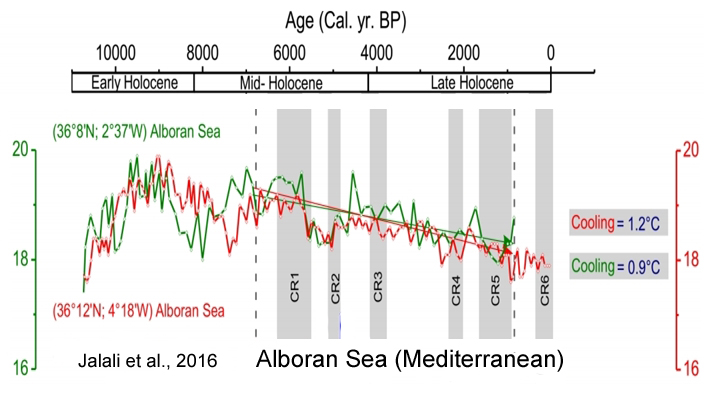
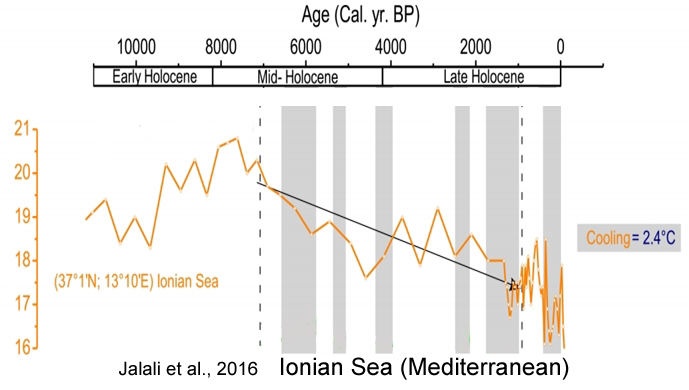
Chen et al., 2016 Multiscale evolution of surface air temperature in the arid region of Northwest China and its linkages to ocean oscillations … The global climate has experienced unprecedented warming in the past century. The multiscale evolution of the warming is studied to better understand the spatial and temporal variation patterns of temperature. In this study, based on the yearly surface air temperature from the gridded CRU TS 3.22 dataset and the ensemble empirical mode decomposition method (EEMD), we investigated the multiscale evolution of temperature variability in the arid region of Northwest China (ARNC) from 1901 to 2013. Furthermore, the possible influences on the ARNC temperature change from the Atlantic Multidecadal Oscillation (AMO), Pacific Decadal Oscillation (PDO), and dipole mode index (DMI) were also discussed. The results indicated that in the past century, the overall temperature in the ARNC has showed a significant non-linear upward trend, and its changes have clearly exhibited an interannual scale (quasi-2–3 and quasi-6–7-year) and an interdecadal scale (quasi-14, quasi-24, and quasi-70-year). Compared with the reconstructed interannual variation, the reconstructed interdecadal variability plays a decisive role in the ARNC warming and reveals the climatic pattern transformation from the cold period to the warm period before and after 1987. Additionally, there were also regional differences in the spatial patterns of change trend in the ARNC temperature at a given time. We also found that the AMO and PDO had significant impacts on the ARNC temperature fluctuation at an interdecadal scale, whereas the DMI had a more important role in warming at the annual scale, which suggests that the importance of oceans cannot be ignored when considering climate change.
Ogi et al, 2016 The surface air temperature in Greenland, especially the temperature in west Greenland, is known to be influenced by the North Atlantic Oscillation (NAO) (Box, 2002; Hanna and Cappelen, 2003; Noël et al., 2014). During summer, the negative phase of a persistent NAO between positive pressure anomalies over Greenland and negative pressure anomalies over the North Atlantic Ocean is correlated with warm temperature anomalies. In particular, anomalous atmospheric circulation since 2007 attributed to the persistent negative summer NAO has favoured warmer summer temperatures over the ice sheet and enhanced surface ice melt (Fettweis et al., 2013; Hanna et al., 2015). … The SICs [sea ice concentrations] surrounding Greenland are greatly affected by surface air temperatures and large-scale atmospheric circulation. The dominant pattern associated with winter sea ice variability resembles the winter NAO (Wang et al., 1994; Mysak et al., 1996; Deser et al., 2000; Strong, 2012).
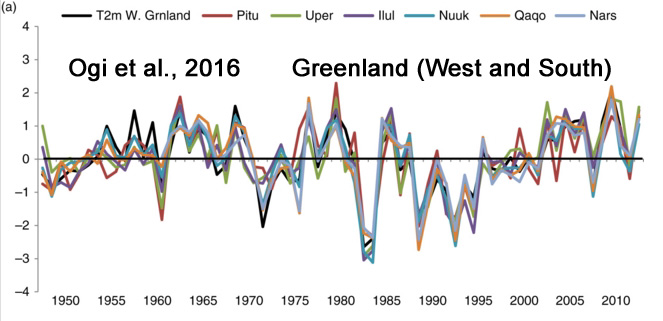
Zinke et al., 2016 We calibrate individual robust Sr / Ca records with in situ SST and various gridded SST products. The results show that the SST record from Cabri provides the first Indian Ocean coral proxy time series that records the SST signature of the PDO in the south-central Indian Ocean since 1945. … Marked negative Sr /Ca anomalies (warmer) are observed during the first half of the 20th century centred at 1918/19, 1936–1941 and in the period 1948–1951 that exceed anomalies in the 1961 to 1990 reference period.
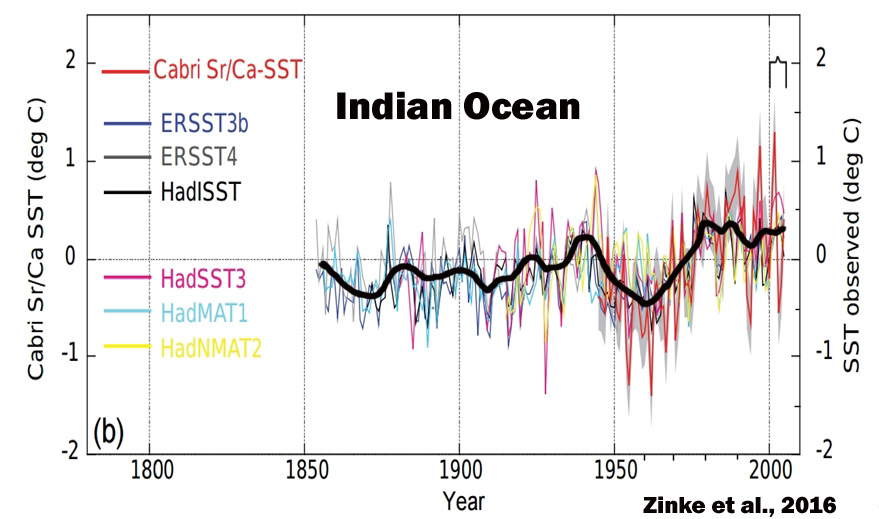
Yuan et al., 2016 The Atlantic Multidecadal Oscillation (AMO) is characterized by a horseshoe pattern of sea surface temperature (SST) anomalies and has a wide range of climatic impacts. While the tropical arm of AMO is responsible for many of these impacts, it is either too weak or completely absent in many climate model simulations. Here we show, using both observational and model evidence, that the radiative effect of positive low cloud and dust feedbacks is strong enough to generate the tropical arm of AMO, with the low cloud feedback more dominant. The feedbacks can be understood in a consistent dynamical framework: weakened tropical trade wind speed in response to a warm middle latitude SST anomaly reduces dust loading and low cloud fraction over the tropical Atlantic, which warms the tropical North Atlantic SST. Together they contribute to appearance of the tropical arm of AMO. Most current climate models miss both the critical wind speed response and two positive feedbacks though realistic simulations of them may be essential for many climatic studies related to the AMO.
Laken and Stordal, 2016 We have used these data to examine changes in the frequency (days/month) of given weather systems direction (WSD) during peak phases in the North Atlantic Oscillation (NAO), El Niño Southern Oscillation (ENSO), solar cycle (SC) and peaks in stratospheric aerosol optical depth (AOD) with superposed epoch analysis and Monte Carlo significance testing. We found highly significant responses to the NAO consistent with expectations: this signal confirmed the utility of the HBGWL data for this type of analysis and provided a benchmark of a clear response. WSD changes associated with ENSO, SC and AOD were generally within the ranges expected from random samples. When seasonal restrictions were added the results were similar, however, we found one clearly significant result: an increase in southerly flow of 2.6±0.8 days/month (p=1.9×10⁻⁴) during boreal summertime in association with El Niño. This result supports the existence of a robust teleconnection between the ENSO and European weather.
Wells, 2016 Introduction: The surface climate of the UK and northern Europe is up to 9 degC warmer than it would be if the North Atlantic Ocean did not transport a large quantity of heat northwards to our shores. This unusual warming has been known since sea temperature records were established in the late nineteenth century and was probably well known to the early seafarers in the last two millennia. … Summary: This article has indicated that the North Atlantic Ocean is showing changes in its circulation as represented by the MOC at 26°N in the last 10 years. The changes in the MOC are associated with heat transport which has a direct effect on the upper ocean heat storage northwards of the RAPID array. The event in 2009 caused a cooling of the subtropical ocean between 20 and 40°N but did not appear to influence the region poleward of 50°N. The role of the atmosphere in the changes in the MOC in this region, in particular on interannual and decadal timescales, is still not well understood.
Sankaran, 2016 Global surface temperature is significantly influenced by different climate forcings operating at specific time scales. This study investigates the association between global surface temperature and the Pacific Decadal Oscillation (PDO) in a multiscaling framework in terms of both time scale of variability and non-stationarity. First, the ensemble empirical mode decomposition (EEMD) is used for multiscale disintegration of the Global Surface Temperature Anomaly (GSTA) and PDO datasets. A close matching of the periodicity of different modes of PDO and GSTA [Global Surface Temperature Anomaly] is noticed, and the subsequent cross-correlation analysis of the modes showed that their linear association is the most perceptible at the slowly varying trend component. The correlation between the different modes is further analyzed using a multiscale dynamic correlation method namely, time-dependent intrinsic correlation (TDIC). This study found a strong long-range positive correlation between the time series pairs in decadal and inter-decadal modes exceeding 20-year periodicity. Further it is found that, the multiscale teleconnection between PDO and GSTA is not always of unique character but associated with localized reversals in the nature of correlation in the time domain. The study further observed a similar pattern of correlation for both cold phases of the 20th century (1901–1924 and 1947–1976); whereas the pattern of correlation is different for the warm phases of PDO (1925–1946 and 1977–1995) in different process scales.
Lou et al., 2016 A decadal variance decomposition method is applied to the Northern Hemisphere (NH) 500-hPa geopotential height (GPH) and the sea level pressure (SLP) taken from the last millennium (850–1850 AD) experiment with the coupled climate model CCSM4, to estimate the contribution of the intra-decadal variability to the inter-decadal variability. … At both pressure levels, the leading intra-decadal modes each have features related to the El Niño–southern oscillation, the intra-decadal variability of the Pacific decadal oscillation (PDO) and the Arctic oscillation (AO); while the leading slow-decadal modes are associated with external radiative forcing (mostly with volcanic aerosol loadings), the Atlantic multi-decadal oscillation and the slow-decadal variability of AO and PDO. Moreover, the radiative forcing has much weaker effect to the SLP than that to the 500-hPa GPH.
Li et al., 2016 The twentieth century Northern Hemisphere mean surface temperature (NHT) is characterized by a multidecadal warming-cooling-warming pattern followed by a flat trend since about 2000 (recent warming hiatus). Here we demonstrate that the multidcadal variability in NHT including the recent warming hiatus is tied to the NAT-NAO-AMO-AMOC coupled mode and the NAO is implicated as a useful predictor of NHT multidecadal variability. An NAO-based linear model is therefore established to predict the NHT, which gives an excellent hindcast for NHT in 1971-2011 with the recent flat trend well predicted.
Salau et al., 2016 Conclusions: The temperatures observed from the different locations within Nigeria between 1980 and 2010 (1983–2010 for Abuja) are compared with the SST from the Niño 3 and Niño 4 regions of the Tropical Pacific while a further comparison of the temperature with the rainfall in Nigeria is also done. This is necessary so as to establish the connections between an ENSO event and the climate patterns in Nigeria. The outcome shows good link between the ENSO events and the Nigerian climate with the strongest agreement coming from the Niño 3 region of the Tropical Pacific. The finding indicates that the primary driver of climate like the south-westerlies that brings monsoon into the country from South Atlantic Ocean, the north-easterlies that lead to Tropical dry climate in the North and the ITCZ, which is sandwiched between the air masses, could be affected by changes in ENSO events. According to the results, the major link between an ENSO event and changes in the temperature and rainfall in Nigeria is associated with shifts in the ITCZ position. An El Niño (La Niña) induced southward (northward) shift in the ITCZ mean position is accompanying by reduction (increase) in the intensity of the mean rainfall in the country while the corresponding mean temperature after an El Niño (La Niña) event will rise (reduce). This is similar to other studies where El Niño induced drought have been reported in Nigeria.
Narayanan et al., 2016 The spatial and temporal variability of rainfall patterns in the northwestern belt of India has been monitored over a period of 60 years (1949–2009). … The preliminary principle component analysis of rainfall data with respect to climatic indices indicates that Niño 3.4 and Pacific Decadal Oscillation (PDO) are the dominant climatic indices that have caused a shift in the rainfall pattern of western India, along with land use/land cover changes.
Nagy et al., 2016 Results from a multiregression analysis of the global and sea surface temperature anomalies for the period 1950–2011 are presented where among the independent variables multidecade oscillation signals over various oceanic areas are included. These indices are defined in analogy with the Atlantic Multidecadal Oscillation (AMO) index. Unexpectedly we find that a strong multidecade oscillation signal echoing the AMO is also present in the Western and Northwestern Pacific region. The results indicate that naturally induced climate variations seem to be dominated by two internal variability modes of the ocean–atmosphere system: AMO and El Niño Southern Oscillation, with a marked geographical dichotomy in their respective areas of dominance. As the AMO index is directly derived from SST data the finding that the AMO signal is present on a large fraction of the global oceanic surface casts doubt on its use as an independent explanatory variable in regression analyses of the global surface temperature anomalies.
Kumar et al., 2016 The climate variability on Earth is strongly influenced by the changes in the Sea Surface Temperature (SST) anomalies in the tropical oceans. More specifically, the inter-annual climate variability in the tropics as well as extra-tropical areas has large impact due to the anomalous SSTs in the tropical Pacific coupled with the El Niño Southern Oscillation (ENSO) through atmospheric teleconnections. … It is observed that during El Niño years the peninsular region receives more rainfall through enhanced moisture transport associated with anomalous westerly winds from adjoining Seas. The Rossby wave energy propagation in the atmosphere underlies important teleconnections involving ENSO. It is also noticed that there exist a distinct change in the phase of the Rossby wave pattern during El Niño and La Niña years which further causes the shift in the position of the jet stream over the Middle East.
Johannessen et al., 2016 It is demonstrated that the temperature amplification in the Arctic is characteristic not only for the recent warming but also the early 20th century warming (ETCW) and subsequent cooling. The amplification appears to be weaker during the recent warming than in the ETCW, simply because the index values reflect the more pervasive nature of the recent warming that reflects the background of anthropogenic global warming. We also produced a new Arctic regionalisation created from hierarchical cluster analysis, which identifies six major natural regions in the Arctic that reflect SAT variability. Statistical comparison with several climate indices shows that the Atlantic Multidecadal Oscillation (AMO) is the mode of variability that is most significantly associated with the amplified warming–cooling in the Arctic, with a stronger correlation during the ETCW and recent warming than during the intermediate period. Regionally, differences are identified in terms of annual and seasonal rates of change and in their correlations with modes of variability.
Dieppois et al., 2016 Furthermore, since the end of the 19th century, we find an increasing variance in multidecadal hydroclimatic winter and spring, and this coincides with an increase in the multidecadal North Atlantic Oscillation (NAO) variability, suggesting a significant influence of large-scale atmospheric circulation patterns. However, multidecadal NAO variability has decreased in summer. Using Empirical Orthogonal Function analysis, we detect multidecadal North Atlantic sea-level pressure anomalies, which are significantly linked to the NAO during the Modern period. In particular, a south-eastward (south-westward) shift of the Icelandic Low (Azores High) drives substantial multidecadal changes in spring. Wetter springs are likely to be driven by potential changes in moisture advection from the Atlantic, in response to northward shifts of North Atlantic storm tracks over European regions, linked to periods of positive NAO. Similar, but smaller, changes in rainfall are observed in winter.
Krishnamurthy et al., 2016 Tropical cyclone (TC) activity in the North Pacific and North Atlantic Oceans is known to be affected by the El Niño Southern Oscillation (ENSO). This study uses GFDL FLOR model, which has relatively high-resolution in the atmosphere, as a tool to investigate the sensitivity of TC activity to the strength of ENSO events. We show that TCs exhibit a non-linear response to the strength of ENSO in the tropical eastern North Pacific (ENP) but a quasi-linear response in the tropical western North Pacific (WNP) and tropical North Atlantic. Specifically, stronger El Niño results in disproportionate inhibition of TCs in the ENP and North Atlantic, and leads to an eastward shift in the location of TCs in the southeast of the WNP. However, the character of the response of TCs in the Pacific is insensitive to the amplitude of La Niña events. The eastward shift of TCs in the southeast of the WNP in response to a strong El Niño is due to an eastward shift of the convection and of the associated environmental conditions favorable for TCs. The inhibition of TC activity in the ENP and Atlantic during El Niño is attributed to the increase in the number of days with strong vertical wind shear during stronger El Niño events. These results are further substantiated with coupled model experiments. Understanding of the impact of strong ENSO on TC activity is important for present and future climate as the frequency of occurrence of extreme ENSO events is projected to increase in future.
Saarni et al., 2016 The minerogenic influx is related to variations in snow accumulation and follows the different phases of the North Atlantic Oscillation (NAO). Decreased snow accumulation is related to a weakened NAO phase. Thus, the minerogenic influx record provides additional information about NAO variation. The Fe/Mn ratio is related to changes in redox conditions at the lake floor. The oxygen availability in the lake floor depends on the duration of the ice cover during winter. Strengthened Siberian High (SH) causes colder autumn and winter temperatures and therefore leads to extended duration of ice cover. Fe/Mn can be considered as a proxy for SH.
Zhou and Wu, 2016 Identifying predictability sources of heat wave variations is a scientific challenge and of practical importance. This study investigates the summertime heat wave frequency (HWF) over Eurasia for 1950–2014. … Further analysis suggests that mega-ENSO variations can incite a Gill-type response spreading to Eurasia, while the AMO changes cause eastward-propagating Rossby wave trains toward Eurasia. These two teleconnection patterns together contribute to the large-scale circulation anomalies of the ID mode, and those related to the IA mode arise from the teleconnection pattern excited by mega-ENSO. A strong mega-ENSO triggers subsidence with high pressure anomalies, warms the surface and increases the HWF significantly over northeastern Asia particularly. Likewise, the warm AMO-induced circulation anomalies engender surface radiative heating and HWF growth in most of Eurasian continent except some localized Siberian and Asian regions. The situation is opposite for a weak mega-ENSO and AMO. Those models from phase 5 of the Coupled Model Intercomparison Project (CMIP5) which realistically capture the features of the ID mode can reproduce the AMO-like sea surface temperature anomalies (SSTAs), while signals resembling mega-ENSO are found in those with favorable capability of simulating the IA mode. On the contrary, these relevant SSTAs linked to the respective modes vanish in the models with little skills. Thus, mega-ENSO and the AMO might provide two critical predictability sources for heat waves over Eurasia.
Rahaman et al., 2016 High-resolution study of deuterium excess (d-excess), sea salt sodium (ss-Na+), and methane sulfonic acid (MSA) in an ice core from coastal Dronning Maud Land (cDML), East Antarctica, revealed the history of moisture transport and sea ice extent (SIE) during the last century. Backward wind trajectories show that air parcels were mainly derived from the Weddell Sea region. The d-excess profile shows a dramatic shift from an average value of 8‰ during 1905–1920 to −1‰ during ~1940 and thereafter positive excursion during 1940–1980. This study highlights the role of SAM and its teleconnection to El Niño Southern Oscillations (ENSO) in controlling sea ice and moisture source variability in annual to decadal scale in the coastal regions of Antarctica.
Zampieri et al., 2016 In spring and summer, results show significant changes in the frequencies of certain weather regimes associated with the phase shifts of the AMO. These changes are consistent with the seasonal surface pressure, precipitation, and temperature anomalies associated with the AMO shifts in Europe.
Veettil et al., 2016 This study discusses the formation and variations of supraglacial lakes on the Baltoro glacier system in the central Karakoram Himalaya during the last four decades. We mapped supraglacial lakes on the Baltoro Glacier from 1978 to 2014 using Landsat MSS, TM, ETM + and LCDM images. Most of the glacial lakes were formed or expanded during the late 1970s–2008. After 2008, the total number and the area of glacial lakes were found to be lesser compared to previous years. We tried to find any teleconnections exists between the glacial lake changes in this region and the pacific decadal oscillation (PDO), which entered its prolonged warm regime in the late 1970s and again to its cold regime in 2008, based on observational investigation. The decrease in the number and area of the supraglacial lakes after 2008 is hypothesised to be linked with the recent cold phase of PDO.
Muñoz et al., 2016 As rainfall in South-Central Chile has decreased in recent decades, local communities and industries have developed an understandable concern about their threatened water supply. Reconstructing streamflows from tree-ring data has been recognized as a useful paleoclimatic tool in providing long-term perspectives on the temporal characteristics of hydroclimate systems. Multi-century long streamflow reconstructions can be compared to relatively short instrumental observations in order to analyze the frequency of low and high water availability through time. … The analyzed rivers are affected by climate forcings on interannual and interdecadal time-scales, Tropical (El Niño Southern Oscillation) and Antarctic (Southern Annular Mode; SAM). Longer cycles found, around 80-years, are well correlated only with SAM variation, which explains most of the variance in the Biobío and Puelo rivers. This cycle also has been attributed to orbital forcing by other authors. All three rivers showed an increase in the frequency of extreme high and low flow events in the twentieth century. The most extreme dry and wet years in the instrumental record (1943–2000) were not the most extreme of the past 400-years reconstructed for the three rivers (1600–2000), yet both instrumental record years did rank in the five most extreme of the streamflow reconstructions as a whole. These findings suggest a high level of natural variability in the hydro-climatic conditions of the region, where extremes characterized the twentieth century.
Yu et al., 2016 The interannual relationship between North American (NA) winter temperature and large-scale atmospheric circulation anomalies and its decadal variation are analyzed. NA temperature anomalies are dominated by two leading maximum covariance analysis (MCA) modes of NA surface temperature and Northern Hemisphere 500 hPa geopotential anomalies. A new teleconnection index, termed the Asian-Bering-North American (ABNA) pattern, is constructed from the normalized geopotential field after linearly removing the contribution of the Pacific-North American (PNA) pattern. The ABNA pattern is sustained by synoptic eddy forcing. The first MCA mode of NA surface temperature is highly correlated with the PNA and ABNA teleconnections, and the second mode with the North Atlantic Oscillation (NAO). This indicates that NA [North American] temperature is largely controlled by these three large-scale atmospheric patterns, i.e., the PNA [Pacific-North American pattern], ABNA [Asian-Bering-North Americanpattern] and NAO [North Atlantic Oscillation] . These temperature-circulation relationships appear stationary in the 20th century.
Screen and Francis, 2016 Through analyses of both observations and model simulations, we show that the contribution of sea-ice loss to wintertime Arctic amplification seems to be dependent on the phase of the Pacific Decadal Oscillation (PDO). Our results suggest that, for the same pattern and amount of sea-ice loss, consequent Arctic warming is larger during the negative PDO phase relative to the positive phase, leading to larger reductions in the poleward gradient of tropospheric thickness and to more pronounced reductions in the upper-level westerlies. Given the oscillatory nature of the PDO, this relationship has the potential to increase skill in decadal-scale predictability of the Arctic and sub-Arctic climate. Our results indicate that Arctic warming in response to the ongoing long-term sea-ice decline is greater (reduced) during periods of the negative (positive) PDO phase. We speculate that the observed recent shift to the positive PDO phase, if maintained and all other factors being equal, could act to temporarily reduce the pace of wintertime Arctic warming in the near future.
Krishnamurthy and Krishnamurthy, 2016 Abstract: The analysis suggests that the warm (cold) phase of pure decadal variability of PDO is associated with deficit (excess) rainfall over the west central part of India. In contrast, the conventional warm (cold) PDO index is associated with deficit (excess) rainfall over most of India. … Introduction: On interannual timescale, El Niño-Southern Oscillation (ENSO) is known to have a major impact on the Indian monsoon (Sikka, 1980; Rasmusson and Carpenter, 1983). The ENSO is also shown to play a role in the Indian monsoon variability on interdecadal timescale (Krishnamurthy and Goswami, 2000; Krishnan and Sugi, 2003). On decadal to multidecadal timescales, the Pacific Decadal Oscillation (PDO), the Atlantic Multidecadal Oscillation, and the Atlantic tripole mode determine the variability of rainfall over India (Sen Roy et al., 2003; Lu et al., 2006; Zhang and Delworth, 2006; Li et al., 2008; Sen Roy, 2011; Krishnamurthy and Krishnamurthy, 2014a, 2014b, 2016b).
Diaz et al., 2016 Hawaiian Islands rainfall exhibits strong modulation by El Niño–Southern Oscillation (ENSO), as well as in relation to Pacific decadal oscillation (PDO)-like variability. For significant periods of time, the reconstructed large-scale changes in the North Pacific SLP field described here and by construction the long-term decline in Hawaiian winter rainfall are broadly consistent with long-term changes in tropical Pacific sea surface temperature (SST) based on ENSO reconstructions documented in several other studies, particularly over the last two centuries.
Meehl et al., 2016 Contribution of the Interdecadal Pacific Oscillation to twentieth-century global surface temperature trends … Longer-term externally forced trends in global mean surface temperatures (GMSTs) are embedded in the background noise of internally generated multidecadal variability1. A key mode of internal variability is the Interdecadal Pacific Oscillation (IPO), which contributed to a reduced GMST trend during the early 2000s. We use a novel, physical phenomenon-based approach to quantify the contribution from a source of internally generated multidecadal variability—the IPO—to multidecadal GMST trends. Here we show that the largest IPO contributions occurred in its positive phase during the rapid warming periods from 1910–1941 and 1971–1995, with the IPO contributing 71% and 75%, respectively, to the difference between the median values of the externally forced trends and observed trends.
Livsey et al., 2016 In 2012 the most severe United States drought since the 1930’s occurred, highlighting the need for a better understanding of the climate factors driving droughts. Spatial-temporal analysis of United States precipitation data from 1900 to 1999 indicates that the Atlantic Multidecadal Oscillation (AMO) primarily modulates drought frequency. Tree rings provide the highest resolution and most spatially distributed drought records beyond secular time-series; however, as most tree-ring records only extend to ca. 1000 years before present (BP), a new broadly distributed, quantitative, multi-millennial, proxy of past drought is needed to determine if the AMO modulated drought across North America through the late Holocene. … Changes in the extended drought record correspond with timing of the Roman Climate Optimum, Medieval Warm Period, Little Ice Age, and changes in the AMO as recorded in a proxy record derived from North Atlantic ice-rafted debris. These results indicate that lacustrine-derived XRF element data can be used as a quantitative tool to reconstruct past drought records, and suggest that AMO modulated drought in southern Texas for the last 3000 years.
Valdés-Manzanilla, 2016 Most of flood periods coincided with the warm phase of the Atlantic Multidecadal Oscillation (AMO). The flood period of 1940–1944 was as long as the most recent one (2007–2011). Wavelet analysis found flood periodicities of 2.5, 52 and 83 years, but only the last one was statistical significant and their occurrence was in phase with the AMO. Logistic regression showed that AMO index was the most correlated index with flood events. In fact, the odds ratio showed that floods were 1.90 times more likely to occur when AMO index was positive. This regression model predicted correctly 64.70 % of flood occurrences during twentieth century using its flood information only as validation data.
Kam and Sheffield, 2016 The influence of oceanic conditions [“positive and negative phases of ENSO, PDO, and AMO”] on pluvial risk has also been significant, especially during the warm phase of the Pacific Ocean, but increases over the last century are small compared to drought. Results from the idealized climate model experiments show that natural variability likely played a major role in the observed changes in [drought] risk, with the global SST increasing trend possibly tempering the increases regionally but not significantly over California. Despite evolving preferential oceanic conditions for a pluvial event during the 2015/16 winter (positive phase of ENSO and PDO), California received an 11% winter precipitation surplus, which was not sufficient for drought recovery. The seasonal and longer-term outlook for negative phases of the ENSO and PDO implies that drought risk will be elevated in southern California for the next decade.
Liu et al., 2016 Severe drought intervals since the late 1970s in our study area consisted with the weakening East Asian summer monsoon, which modulating regional moisture conditions in semi-arid zone over northern China. Drought variations in the study area significantly correlated with sea surface temperatures (SSTs) in North Pacific Ocean, suggesting a possible connection of regional hydroclimatic variations to the Pacific Decadal Oscillation (PDO). The potential influence associated with El Niño-Southern Oscillation (ENSO) was primarily analyzed.
Qiaohong et al., 2016 Century-scale causal relationships between global drought conditions and the state of the Pacific and Atlantic Oceans … Drought is one of the costliest and least understood natural hazards. The El Niño Southern Oscillation (ENSO), Pacific Decadal Oscillation (PDO), and North Atlantic Oscillation (NAO) are atmosphere-ocean coupled modes of climate variability that occur in the Pacific and Atlantic Oceans. In this study, the Granger causality test is used to examine the effects of ENSO, PDO, and NAO on global drought conditions. The results show robust relationships between drought conditions and the ocean states, as assessed through a multi-index (SPEI and SPI) and multiscalar (3-month and 12-month) evaluation. The influence of ENSO events is widespread, dominating about 40% of the global land droughts. Southern and western North America, northern South America, and eastern Russia are more influenced by PDO. Results show that NAO influence on drought is not restricted to Europe and includes northern Africa. The role of NAO is most evident at 3-month time scale. Moreover, the results provide evidence that drought conditions can be affected by multiple factors. ENSO and PDO may reinforce each other to dominate climate variability over North America and northern South America. Climate variability in southern Europe and northern Africa may be forced by the concurrence of ENSO and NAO. The spatial patterns of the influence of ocean states on global droughts provide valuable information for improving drought forecasting.
Akers et al., 2016 A series of major dry events (MDEs) evident in stable isotopes, ultraviolet-stimulated luminescence, and petrography began ~ 3100 cal yr BP, and the initiation of these events coincides with an increase in El Niño dominance and southern shift in the Intertropical Convergence Zone. Three MDEs, centered at 1750 cal yr BP (200 CE), 1100 cal yr BP (850 CE), and 850 cal yr BP (1100 CE) and found in other regional climate records, coincide with Maya sociopolitical changes.
Coats et al., 2016 Internal ocean-atmosphere variability drives megadroughts in Western North America … Here we use a novel combination of spatiotemporal tree-ring reconstructions of Northern Hemisphere hydroclimate to infer the atmosphere-ocean dynamics that coincide with megadroughts over the American West, and find that these features are consistently associated with ten-to-thirty year periods of frequent cold El Niño Southern Oscillation conditions and not a centuries-long shift in the mean of the tropical Pacific Ocean. These results suggest an important role for internal variability in driving past megadroughts. State-of-the art climate models from the Coupled Model Intercomparison Project phase 5, however, do not simulate a consistent association between megadroughts and internal variability of the tropical Pacific Ocean, with implications for our confidence in megadrought risk projections.
Toonen et al., 2016 Multi-decadal and centennial variability in flood activity is recorded in extended series of discharge data, historical information and sedimentary records. Over the last six centuries that variability correlates with components of the Atlantic climate system such as the North Atlantic Oscillation (NAO) and Atlantic Multi-decadal Oscillation (AMO). These climatic non-stationarities importantly influence flood activity and the outcomes of flood risk assessments based on relatively short measurement series.
Zanardo et al., 2016 Investigating the relationship between North Atlantic Oscillation and flood losses at the European scale … The North Atlantic Oscillation (NAO) is Europe’s dominant mode of climate variability. As a consequence, the interconnections between NAO and hydrologic extremes in the European continent have long been observed and analysed. … The correlation between rainfall fields and NAO signal is based on the last 50 years of data and discretized at the monthly level. We found significant correlations between the NAO signal and both the average annual loss (AAL) and the average seasonal loss (ASL), for all the countries analysed. Noticeably, ASL-NAO trends were always negative for summer, spring and fall seasons, while could be either positive or negative for winter seasons, depending on the country.
Penalba and Rivera, 2016 The ENSO phenomenon is one of the key factors that influence the interannual variability of precipitation over Southern South America. The aim of this study is to identify the regional response of precipitation to El Niño/La Niña events, with emphasis in drought conditions. The standardized precipitation index (SPI) was used to characterize precipitation variabilities through the 1961–2008 period for time scales of 3 (SPI3) and 12 (SPI12) months. A regionalization based on rotated principal component analysis allowed to identify seven coherent regions for each of the time scales considered. In order to identify the regional influence of El Niño and La Niña events on the SPI time series, we calculated the mean SPI [standardized precipitation index] values for the El Niño and La Niña years and assessed its significance through bootstrap analysis. We found coherent and significant SPI [standardized precipitation index] responses to ENSO phases in most of the seven regions considered, mainly for the SPI12 time series.
Räsänen et al., 2016 The variability of the hydroclimate over mainland Southeast Asia is strongly influenced by the El Niño– Southern Oscillation (ENSO), which has been linked to severe droughts and floods that profoundly influence human societies and ecosystems alike. … A well-known source of droughts and floods on a global scale is the ocean–atmosphere coupled phenomena El Niño–Southern Oscillation (ENSO) (Cane, 2005; Ward et al., 2014). ENSO is an evolving phenomenon (Trenberth and Shea, 1987), and it has become increasingly variable over recent decades (McGregor et al., 2013; Cai et al., 2014). Over mainland Southeast Asia, henceforth MSEA, ENSO explains a large part of the inter-annual hydrological variability (Juneng and Tangang, 2005), and many of the recent severe droughts and floods occurred during ENSO events (see e.g. Räsänen and Kummu, 2013). Changes in hydroclimate variability is of great concern to the largely agrarian population of MSEA, as their livelihoods, economy, and food security are strongly dependent upon hydroclimatic conditions (MRC, 2010; Keskinen et al., 2010; ADB, 2016; Pech and Sunada, 2008).
Serykh, 2016 A dipole structure of inter-decadal variations in the heat content of the ocean and heat fluxes from the ocean to the atmosphere has been detected in the North Atlantic. The following fact deserves special attention: the cyclonic and anti-cyclonic atmospheric circulation anomalies, as well as the decrease and increase in the ocean heat content, take place concurrently and quasi-synchronously in the Iceland minimum and Azores maximum regions. Owing to this, the western heat transport anomalies along the 50th parallel increase or decrease the transport of heat from the Atlantic Ocean to the Euro-Asian continent, and the climate in Europe and Siberia becomes more marine or more continental. The very fast climate warming of the Euro-Asian continent that began in the 1970s may be associated with the enhanced heat transport from the North Atlantic in this period. This is evident from the fields and time series obtained in the present paper. The hiatus of this warming after 1999 may be due to the decreased heat transfer from the North Atlantic Ocean to the Eurasian territory.
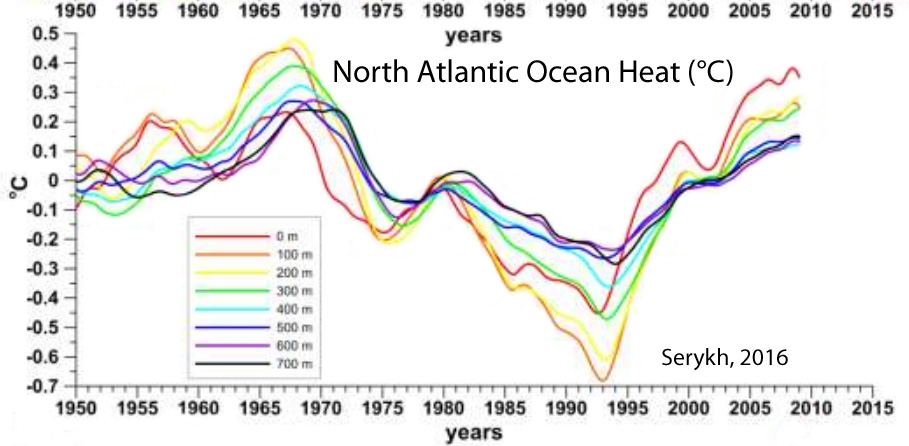
Rossby Waves Climate Modulation
Kumar et al., 2016 Modulation of surface meteorological parameters by extratropical planetary-scale Rossby waves The amplification of the Rossby wave packets over the site leads to persistent subtropical jet stream (STJ) patterns, which further affects the surface weather conditions. The propagating Rossby waves in the upper troposphere along with the undulations in the STJ create convergence and divergence regions in the mid-troposphere. Therefore, the surface meteorological parameters such as the relative humidity, wind speeds, and temperature are synchronized with the phase of the propagating Rossby waves. Moreover, the present study finds important implications for medium-range forecasting through the upper-level Rossby waves over the study region.
Kohyama and Hartmann, 2016 The relationship bet ween climate modes and Antarctic sea ice is explored by separating the variability into intraseasonal, interannual, and decadal time scales. …On the interannual time scale, ENSO and SAM are important, but a large fraction of sea ice variance can also be explained by Rossby wave–like structures in the Drake Passage region. After regressing out the sea ice extent variability associated with ENSO, the observed positive sea ice trends in Ross Sea and Indian Ocean during the satellite era become statistically insignificant. Regressing out SAM makes the sea ice trend in the Indian Ocean insignificant. Thus, the positive trends in sea ice in the Ross Sea and the Indian Ocean sectors may be explained by the variability and decadal trends of known interannual climate modes.
III. Natural Ozone Variability and Climate (3)
Barnes et al., 2016 Trends in trace atmospheric constituents can be driven by trends in their (precursor) emissions but also by trends in meteorology. Here, we use ground-level ozone as an example to highlight the extent to which unforced, low-frequency climate variability can drive multi-decadal trends. … Ozone trends are found to respond mostly to changes in emissions of ozone precursors and unforced climate variability, with a comparatively small impact from anthropogenic climate change. Thus, attempts to attribute observed trends to regional emissions changes require consideration of internal climate variability, particularly for short record lengths and small forced trends.
Bai et al., 2016 Attributing the observed climate changes to relevant forcing factors is critical to predicting future climate change scenarios. Precipitation observations in the Southern Hemisphere (SH) indicate an apparent moistening pattern over the extratropics during the time period 1979 to 2013. To investigate the predominant forcing factor in triggering such an observed wetting climate pattern, precipitation responses to four climatic forcing factors, including Antarctic ozone, water vapour, sea surface temperature (SST), and carbon dioxide, were assessed quantitatively in sequence through an inductive approach. … Quantified differential contribution with respect to those climatic forcing factors may explain why the observed austral extratropical moistening pattern is primarily driven by the Antarctic ozone depletion, while mildly modulated by the cooling effect of equatorial Pacific SST and the increased greenhouse gases, respectively.
MacIntosh et al., 2016 A simple model of the time-varying global-mean precipitation change, including the FPR [fast precipitation response] and SPR [slow precipitation response], indicates that, for the model parameters chosen here, the present-day precipitation response to ozone change may exceed 50% of that due to CO2, even though the RF [radiative forcing] is only about 20%. This is mostly because the compensation between the FPR and SPR is much stronger for CO2 than tropospheric ozone and partly because stratospheric ozone depletion, despite its negative RF, causes precipitation increases. The results also indicate that, in simple model approaches, it is important to treat tropospheric and stratospheric ozone separately; the total ozone FPR depends on the balance of the strength of the individual tropospheric and stratospheric RFs which is very time dependent.
IV. A Questionable To Weak Influence Of Humans, CO2 On Climate (12)
Song, Wang & Tang, 2016 A Hiatus of the Greenhouse Effect … In the last subperiod [2003-2014], the global averaged SULR [surface upwelling longwave radiation/greenhouse effect] anomaly remains trendless (0.02 W m−2 yr−1) because Ts [global temperatures] stop rising. Meanwhile, the long-term change of the global averaged OLR [outgoing longwave radiation] anomaly (−0.01 W m−2 yr−1) is also not statistically significant. Thus, these two phenomena result in a trendless Gaa [atmospheric greenhouse effect]. … [A]remarkably decreasing Gaa trend (−0.27 W m−2 yr−1) exists over the central tropical Pacific, indicating a weakened atmospheric greenhouse effect in this area, which largely offsets the warming effect in the aforementioned surrounding regions. As a result, a trendless global averaged Gaa [atmospheric greenhouse effect] is displayed between 1991 and 2002 (Fig. 2). … Again, no significant trend of the global averaged Gaa [atmospheric greenhouse effect] is found from 2003 to 2014 (Fig. 2) because the enhanced warming effect over the western tropical Pacific is largely counteracted by the weakened warming influence on the central tropical Pacific.
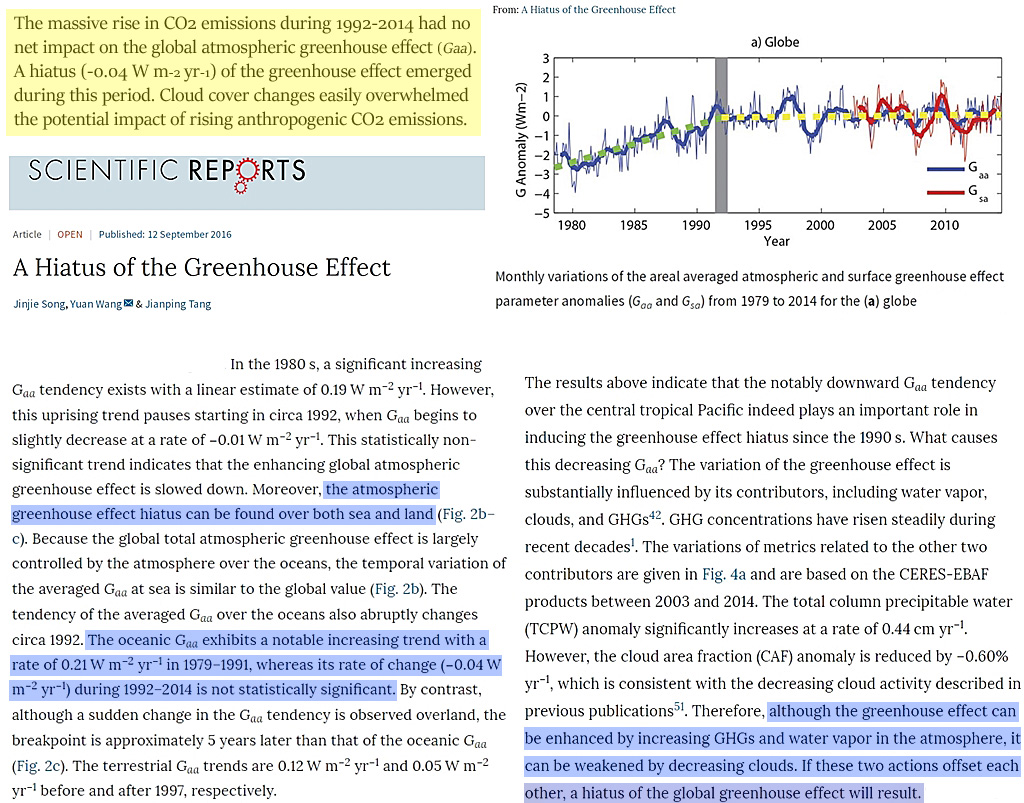
[T]he influences of water vapor and clouds … contribute approximately 75% of the total [greenhouse] effect. … The results above indicate that the notably downward Gaa tendency over the central tropical Pacific indeed plays an important role in inducing the greenhouse effect hiatus since the 1990s. What causes this decreasing Gaa [atmospheric greenhouse effect]? The variation of the greenhouse effect is substantially influenced by its contributors, including water vapor, clouds, and GHGs. GHG concentrations have risen steadily during recent decades. The variations of metrics related to the other two contributors are given in Fig. 4a and are based on the CERES-EBAF products between 2003 and 2014. The total column precipitable water (TCPW) anomaly significantly increases at a rate of 0.44 cm yr−1. However, the cloud area fraction (CAF) anomaly is reduced by −0.60% yr−1, which is consistent with the decreasing cloud activity described in previous publications. Therefore, although the greenhouse effect can be enhanced by increasing GHGs and water vapor in the atmosphere, it can be weakened by decreasing clouds. If these two actions offset each other, a hiatus of the global greenhouse effect will result. … [T]he atmospheric and surface greenhouse effect parameters both become trendless when clouds are considered. … Overall, the downward tendency of clouds is the dominant contributor to the greenhouse effect hiatus.
Marohasy and Abbot, 2016 Surface air temperatures as measured at weather stations around the world are routinely homogenized before they are used to report anthropogenic global warming. The adjustment methodology relies on algorithms that determine homogeneity relative to other locations, and typically results in significant remodeling of individual temperature series. We demonstrate a new technique using temperature trends for southeast Australia from 1887 to 2013, using more traditional quality control methods and based on analysis of statistical variation within and between years. Considering a weighted mean of the five highest-quality maximum temperature time series, trends from 1887 show statistically significant cooling of −1.5°C per century to 1950, followed by rapid warming of 1.9°C per century to 2013. The cooling trend is more pronounced where irrigation development for large-scale rice cultivation has occurred. Neither the cooling nor the magnitude of the recent warming can be explained by anthropogenic global warming theory.
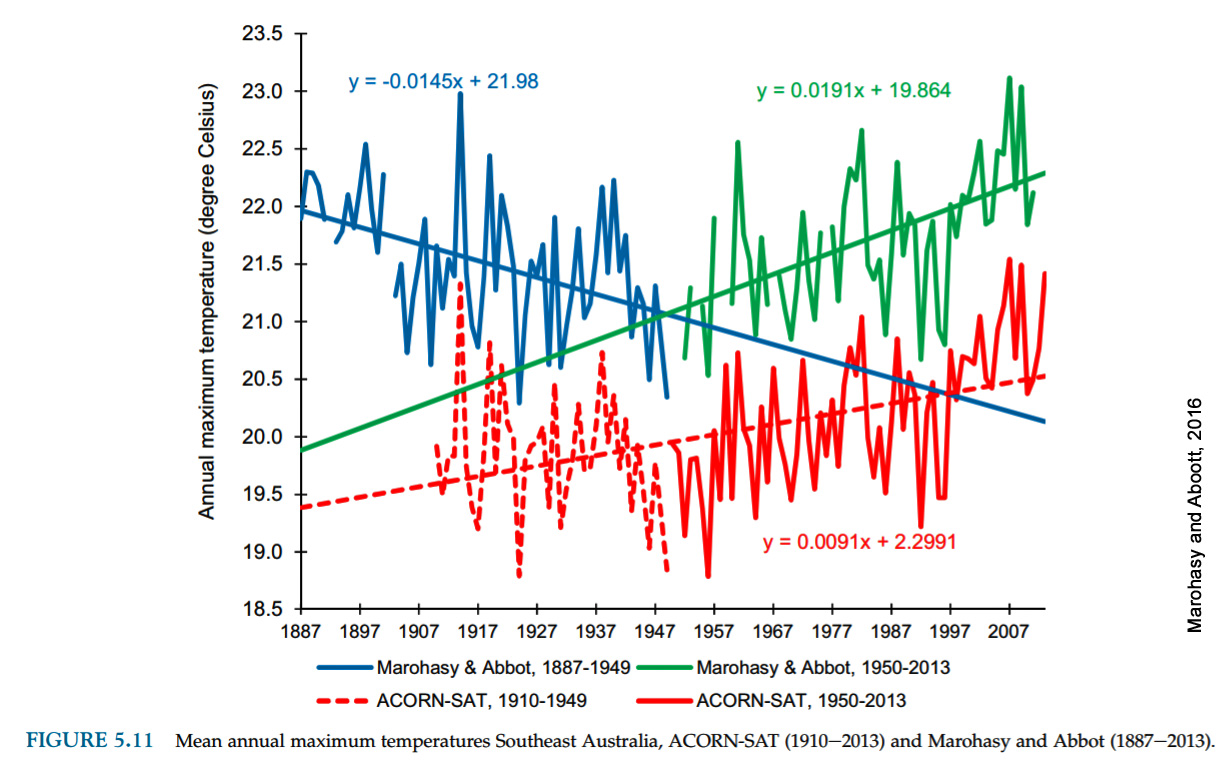
Hertzberg and Schreuder, 2016 The authors evaluate the United Nations Intergovernmental Panel on Climate Change (IPCC) consensus that the increase of carbon dioxide in the Earth’s atmosphere is of anthropogenic origin and is causing dangerous global warming, climate change and climate disruption. The totality of the data available on which that theory is based is evaluated. The data include: (a) Vostok ice-core measurements; (b) accumulation of CO2 in the atmosphere; (c) studies of temperature changes that precede CO2 changes; (d) global temperature trends; (e) current ratio of carbon isotopes in the atmosphere; (f) satellite data for the geographic distribution of atmospheric CO2; (g) effect of solar activity on cosmic rays and cloud cover. Nothing in the data supports the supposition that atmospheric CO2 is a driver of weather or climate, or that human emissions control atmospheric CO2.
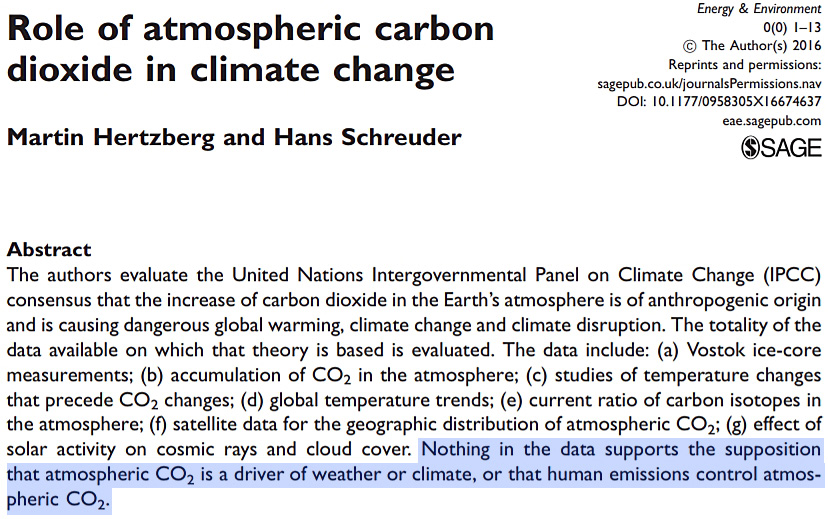
Kelly, 2016 It is widely promulgated and believed that human-caused global warming comes with increases in both the intensity and frequency of extreme weather events. A survey of official weather sites and the scientific literature provides strong evidence that the first half of the 20th century had more extreme weather than the second half, when anthropogenic global warming is claimed to have been mainly responsible for observed climate change. The disconnect between real-world historical data on the 100 years’ time scale and the current predictions provides a real conundrum when any engineer tries to make a professional assessment of the real future value of any infrastructure project which aims to mitigate or adapt to climate change. What is the appropriate basis on which to make judgements when theory and data are in such disagreement?
The compilation of temperature records are a source of problematic methodology of a kind not seen elsewhere in science. Under the umbrella term of “homogenisation”, there now seem to be a growing myriad of post-hoc adjustments to the original raw data that all seem to go in one direction, namely to increase the overall rate of global warming. This happens even on official websites. The total change is often somewhat greater than the 0.8-1ºC rise over the 20th century that is agreed by most people, critics or not. This is exemplified by data in Figure 4. This makes the problem of dispassionate engineering assessment almost impossible to achieve. Hansen (1981) wrote : “A remarkable conclusion from Figure 3 is that the global temperature is almost as high today as it was in 1940.” It is not clear now why this should be remarkable, although at the time, the rise in temperature from about 1975 had cancelled out some of the cooling since 1940 in the then available data. At the time, he [Hansen]showed 1980 temperatures were about 0.15ºC cooler than 1940. Now, NASA shows 1980 temperatures about 0.2ºC warmer than 1940. They have made a relative shift of +0.35ºC, and the adjustment represents ~40% of the century variation. The lesson from this is that the data integrity for claiming extreme events needs to shown to be of the highest order, and that the results claimed do not depend on the data manipulation itself.
Manheimer, 2016 [T]he actual data show that up to now fears of imminent climate catastrophe are not supported by data, or else involve processes occurring since long before excess CO2 in the atmosphere became a concern. Based on actual measurements and reasonable extrapolation of them, there is no reason why the responsible use of fossil fuel cannot continue to support worldwide civilisation. The argument to greatly restrict fossil fuel rests entirely on the theoretical assertion that at some point in the near future there will be a sudden and dramatic change in the very nature of the data presented here. If implemented, these would be sufficient to greatly upset the lifestyle of billions of people, and to further impoverish the already most impoverished parts of the world. … [N]othing in the past suggests that future climate will be significantly different before mid century because of rising levels of CO2.
Mikhailovich et al., 2016 About the Influence of the Giant Planets on Long-Term Evolution of Global Temperature … The observed variability of global temperature is usually explained through the decrease in the coefficient of the grayness of the Earth caused by increased content of greenhouse gases in the atmosphere, such as CO2, i.e. by the anthropogenically caused increase in the greenhouse effect. The validity of such views raises some doubts, as their validity is based either on the results of the climate simulation, or on the results of the regression analysis, in relation to which the fullness of the used set of regression does not seem certain. At the same time, just the results of climate modeling do not seem to be quite reliable … The effects associated with the displacement of the center of gravity of the solar system under the influence of giant planets (Jupiter and Saturn) are discussed. Based on the hypothesis of parametric resonance in the variation of global temperature with disturbances in the photosphere shape and the Earth-to-Sun distance due to the oppositions of said planets, a regression model that explains the observed long-term evolution of global temperature is built. It was shown that residuals of the model are close to white noise, i.e. the [influence of planets] hypothesis almost entirely explains the effect of temperature increase for the period presented in the vernacular crutem3 database [1850-present].
Ellis and Palmer, 2016 Conclusion: [I]nterglacial warming is eccentricity and polar ice regrowth regulated, Great Summer forced, and dust-ice albedo amplified. And the greenhouse-gas attributes of CO2 play little or no part in this complex feedback system. … Hansen determined that between the LGM CO2 concentration of 180 ppm and the pre-industrial concentration of 280 ppm, the extra feedback provided by CO2 was about 2.25 W/m2, which increases to about 3 W/m2 when other factors are included (Hansen et al., 2012, Fig. 5c and p9). The IPCC data gives a similar figure of 2.8 W/m2for all greenhouse gases, but neither of these values include water vapour feedbacks (IPCC AR4 6.4.1.2, AR5 box 8.1 and Table 9.5). But since interglacial warming events average about 5000 years this represents just 0.006 W/m2 per decade of additional feedbacks and warming, which is about a third of the energy required to power a honey bee in flight (Roberts and Elekonich, 2005).
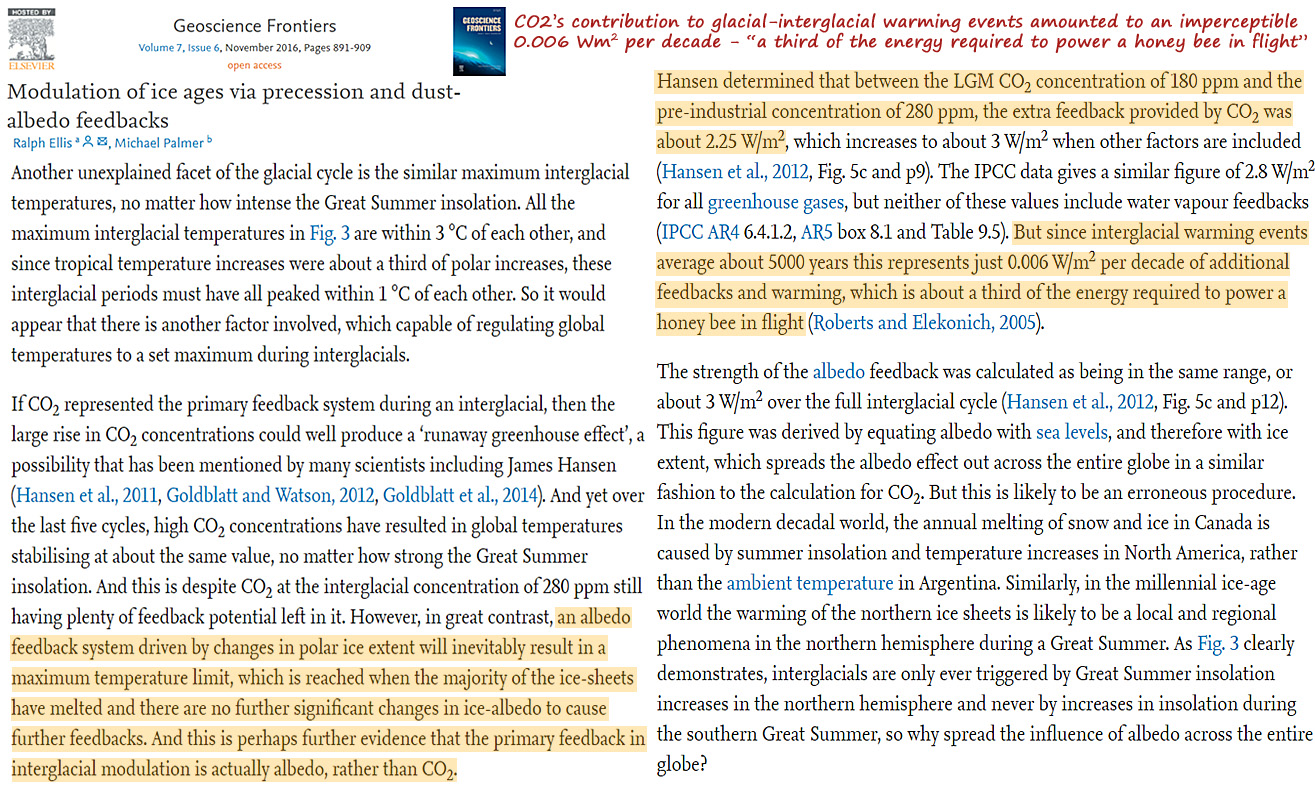
Vares et al., 2016 Quantification of the Diminishing Earth’s Magnetic Dipole Intensity and Geomagnetic Activity as the Causal Source for Global Warming within the Oceans and Atmosphere … Quantitative analyses of actual measurements rather than modeling have shown that “global warming” has been heterogeneous over the surface of the planet and temporally non-linear. Residual regression analyses by Soares (2010) indicated increments of increased temperature precede increments of CO2 increase. The remarkably strong negative correlation (r = -0.99) between the earth’s magnetic dipole moment values and global CO2-temperature indicators over the last ~30 years is sufficient to be considered causal if contributing energies were within the same order of magnitude. Quantitative convergence between the energies lost by the diminishing averaged geomagnetic field strength and energies gained within the ocean-atmosphere interface satisfy the measured values for increased global temperature and CO2 release from sea water. The pivotal variable is the optimal temporal unit employed to estimate the total energies available for physical-chemical reactions. The positive drift in averaged amplitude of geomagnetic activity over the last 100 years augmented this process. Contributions from annual CO2 from volcanism and shifts in averaged geomagnetic activity, lagged years before the measured global temperature-CO2 values, are moderating variables for smaller amplitude perturbations. These results indicated that the increase in CO2 and global temperatures are primarily caused by major geophysical factors, particularly the diminishing total geomagnetic field strength and increased geomagnetic activity, but not by human activities. Strategies for adapting to climate change because of these powerful variables may differ from those that assume exclusive anthropomorphic causes.
Haine, 2016 Notably, the three studies [Jackson et al., 2016; Böning et al., 2016; Robson et al., 2016] report an absence of anthropogenic effects on the AMOC, at least so far: the directly observed AMOC weakening since 2004 is not consistent with the hypothesis that anthropogenic aerosols have affected North Atlantic ocean temperatures. The midlatitude North Atlantic temperature changes since 2005 have greater magnitude and opposite sign (cooling) than those attributed to ocean uptake of anthropogenic heat. The anthropogenic melt from the Greenland ice sheet is still too small to be detected.. And despite large changes in the freshwater budget of the Arctic, some of which are anthropogenic, there is no clear change in the delivery of Arctic freshwater to the North Atlantic due to human climate forcing.
Easterbrook, 2016 CO2 makes up only a tiny portion of the atmosphere (0.040%) and constitutes only 3.6% of the greenhouse effect. The atmospheric content of CO2 has increased only 0.008% since emissions began to soar after 1945. Such a tiny increment of increase in CO2 cannot cause the 10°F increase in temperature predicted by CO2 advocates. Computer climate modelers build into their models a high water vapor component, which they claim is due to increased atmospheric water vapor caused by very small warming from CO2, and since water vapor makes up 90–95% of the greenhouse effect, they claim the result will be warming. The problem is that atmospheric water vapor has actually declined since 1948, not increased as demanded by climate models. If CO2 causes global warming, then CO2 should always precede warming when the Earth’s climate warms up after an ice age. However, in all cases, CO2 lags warming by ∼800 years. Shorter time spans show the same thing—warming always precedes an increase in CO2 and therefore it cannot be the cause of the warming.
Chemke et al., 2016 The thermodynamic effect of atmospheric mass on early Earth’s temperature … Observations suggest that Earth’s early atmospheric mass differed from the present day. The effects of a different atmospheric mass on radiative forcing have been investigated in climate models of variable sophistication, but a mechanistic understanding of the thermodynamic component of the effect of atmospheric mass on early climate is missing. Using a 3D idealized global circulation model (GCM), we systematically examine the thermodynamic effect of atmospheric mass on near-surface temperature. We find that higher atmospheric mass tends to increase the near-surface temperature mostly due an increase in the heat capacity of the atmosphere, which decreases the net radiative cooling effect in the lower layers of the atmosphere. Additionally, the vertical advection of heat by eddies decreases with increasing atmospheric mass, resulting in further near-surface warming. As both net radiative cooling and vertical eddy heat fluxes are extratropical phenomena, higher atmospheric mass tends to flatten the meridional temperature gradient. … An increase in atmospheric mass causes an increase in near-surface temperatures and a decrease of the equator-pole near-surface temperature gradient. Warming is caused mostly by the increase in atmospheric heat capacity, which decrease the net radiative cooling of the atmosphere. [No mention of CO2 as a factor in warming the Earth-Atmosphere system]
Allmendinger, 2016 Surprisingly, and contrary to the expectation of the greenhouse theory, the limiting temperatures of air, pure carbon-dioxide and argon were nearly equal, while the light gases neon, and particularly helium, exhibited significant lower limiting temperatures. Thanks to this empirical evidence, the greenhouse theory has to be questioned. Instead, the warming-up of the lowest layer of the troposphere has to be understood as the result of the warming-up of the Earth’s surface, mainly depending on its albedo (Barrett, 1995).
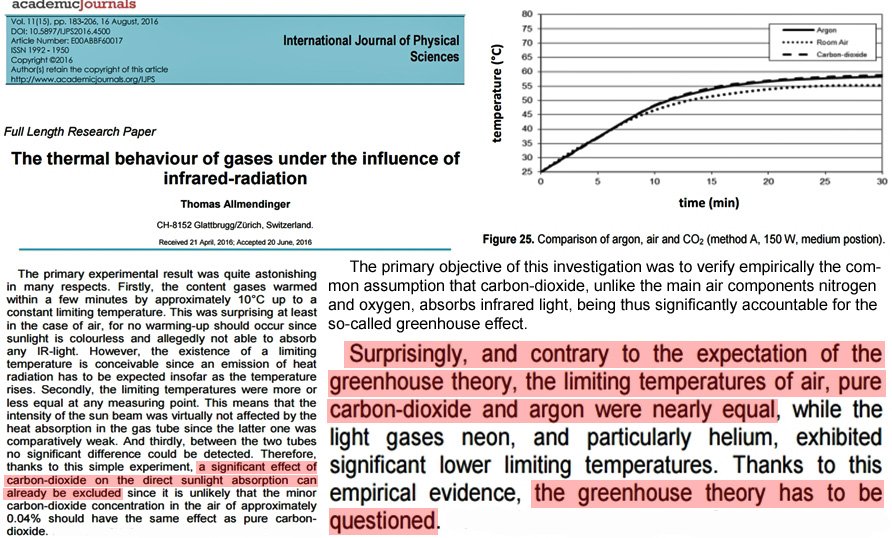
V. Low CO2 Climate Sensitivity (5)
Harde, 2016 Including solar and cloud effects as well as all relevant feedback processes our simulations give an equilibrium climate sensitivity of CS = 0.7 °C (temperature increase at doubled CO2) and a solar sensitivity of SS = 0.17 °C (at 0.1 % increase of the total solar irradiance). Then CO2 contributes 40 % and the Sun 60 % to global warming over the last century.
Bates, 2016 Estimates of 2xCO2 equilibrium climate sensitivity (EqCS) derive from running global climate models (GCMs) to equilibrium. Estimates of effective climate sensitivity (EfCS) are the corresponding quantities obtained using transient GCM output or observations. The EfCS approach uses an accompanying energy balance model (EBM), the zero-dimensional model (ZDM) being standard. GCM values of EqCS and EfCS vary widely [IPCC range: (1.5, 4.5)°C] and have failed to converge over the past 35 years. Recently, attempts have been made to refine the EfCS approach by using two-zone (tropical/extratropical) EBMs. When applied using satellite radiation data, these give low and tightly-constrained EfCS values, in the neighbourhood of 1°C. … The central conclusion of this study is that to disregard the low values of effective climate sensitivity (≈1°C) given by observations on the grounds that they do not agree with the larger values of equilibrium, or effective, climate sensitivity given by GCMs, while the GCMs themselves do not properly represent the observed value of the tropical radiative response coefficient, is a standpoint that needs to be reconsidered.
Evans, 2016 The conventional basic climate model applies “basic physics” to climate, estimating sensitivity to CO2. However, it has two serious architectural errors. It only allows feedbacks in response to surface warming, so it omits the driver-specific feedbacks. It treats extra-absorbed sunlight, which heats the surface and increases outgoing long-wave radiation (OLR), the same as extra CO2, which reduces OLR from carbon dioxide in the upper atmosphere but does not increase the total OLR. The rerouting feedback is proposed. An increasing CO2 concentration warms the upper troposphere, heating the water vapor emissions layer and some cloud tops, which emit more OLR and descend to lower and warmer altitudes. This feedback resolves the nonobservation of the “hotspot.” An alternative model is developed, whose architecture fixes the errors. By summing the (surface) warmings due to climate drivers, rather than their forcings, it allows driver-specific forcings and allows a separate CO2 response (the conventional model applies the same response, the solar response, to all forcings). It also applies a radiation balance, estimating OLR from properties of the emission layers. Fitting the climate data to the alternative model, we find that the equilibrium climate sensitivity is most likely less than 0.5°C, increasing CO2 most likely caused less than 20% of the global warming from the 1970s, and the CO2 response is less than one-third as strong as the solar response. The conventional model overestimates the potency of CO2 because it applies the strong solar response instead of the weak CO2response to the CO2 forcing.
Gervais, 2016 Conclusion: Dangerous anthropogenic warming is questioned (i) upon recognition of the large amplitude of the natural 60–year cyclic component and (ii) upon revision downwards of the transient climate response consistent with latest tendencies shown in Fig. 1, here found to be at most 0.6 °C once the natural component has been removed, consistent with latest infrared studies (Harde, 2014). Anthropogenic warming well below the potentially dangerous range were reported in older and recent studies (Idso, 1998; Miskolczi, 2007; Paltridge et al., 2009; Gerlich and Tscheuschner, 2009; Lindzen and Choi, 2009, 2011; Spencer and Braswell, 2010; Clark, 2010; Kramm and Dlugi, 2011; Lewis and Curry, 2014; Skeie et al., 2014; Lewis, 2015; Volokin and ReLlez, 2015). On inspection of a risk of anthropogenic warming thus toned down, a change of paradigm which highlights a benefit for mankind related to the increase of plant feeding and crops yields by enhanced CO2 photosynthesis is suggested.
Smirnov, 2016 [W]e take into account that CO2 molecules give a small contribution to the heat Earth balance and, therefore, one can use the altitude distribution of the temperature for the standard atmosphere model [1], and a variation of the CO2 concentration does not influence this distribution. … [I]njection of CO2 molecules into the atmosphere leads to a decrease of the outgoing radiation flux that causes a decrease of the average Earth temperature. But this decrease is below 0.1K that is the accuracy of determination of this value. Thus, the presence of carbon dioxide in the atmosphere decreases the outgoing atmospheric radiative flux that leads to a decrease of the Earth temperature by approximately (1.8 ± 0.1) K. The change of the average temperature at the double of the concentration of atmospheric CO2 molecules is determined by the transition at 667cm−1 only and is lower than 0.1K. … In particular, doubling of the concentration of CO2 molecules compared to the contemporary content increases the global Earth temperature by ΔT = 0.4 ± 0.2K. … From this we have that the average temperature variation ΔT = 0.8 ◦C from 1880 up to now according to NASA data may be attained by the variation of the water concentration by 200ppm or Δu/u ≈ 0.07, Δu = 0.2. Note that according to formula (2) the variation of an accumulated concentration of CO2 molecules from 1959 (from 316ppm up to 402ppm) leads to the temperature variation ΔT = 0.15 ◦C. One can see that the absorption of a water molecule in infrared spectrum is stronger than that of the CO2 molecule because of their structures, and the injection of water molecules in the atmosphere in- fluences its heat balance more strongly than the injection of CO2 molecules.
VI. Modern Climate In Phase With Natural Variability (17)
Smith and Polvani, 2016 The recent annually averaged warming of the Antarctic Peninsula, and of West Antarctica, stands in stark contrast to very small trends over East Antarctica. This asymmetry arises primarily from a highly significant warming of West Antarctica in austral spring and a cooling of East Antarctica in austral autumn. Here we examine whether this East–West asymmetry is a response to anthropogenic climate forcings or a manifestation of natural climate variability. We compare the observed Antarctic surface air temperature trends over two distinct time periods (1960–2005 and 1979–2005), and with those simulated by 40 models participating in Phase 5 of the Coupled Model Intercomparison Project (CMIP5). We find that the observed East–West asymmetry differs substantially between the two periods and, furthermore, that it is completely absent from the forced response seen in the CMIP5 multi-model mean, from which all natural variability is eliminated by the averaging. We also examine the relationship between the Southern Annular mode (SAM) and Antarctic temperature trends, in both models and reanalyses, and again conclude that there is little evidence of anthropogenic SAM-induced driving of the recent temperature trends. These results offer new, compelling evidence pointing to natural climate variability as a key contributor to the recent warming of West Antarctica and of the Peninsula.
Bova et al., 2016 Rapid variations in deep ocean temperature detected in the Holocene … The observational record of deep-ocean variability is short, which makes it difficult to attribute the recent rise in deep ocean temperatures to anthropogenic forcing. Here, we test a new proxy – the oxygen isotopic signature of individual benthic foraminifera – to detect rapid (i.e. monthly to decadal) variations in deep ocean temperature and salinity in the sedimentary record. We apply this technique at 1000 m water depth in the Eastern Equatorial Pacific during seven 200-year Holocene intervals. Variability in foraminifer δ18O over the past 200 years is below the detection limit [a change or variability in ocean heat cannot be detected in the past 200 years], but δ18O signatures from two mid-Holocene intervals indicate [natural, unforced] temperature swings >2 °C within 200 years.
Zhang et al., 2016 Forced atmospheric teleconnections during 1979-2014 are examined using a 50-member ensemble of atmospheric general circulation model (AGCM) simulations subjected to observed variations in sea surface temperatures (SST), sea ice and carbon dioxide. … A trend in the leading forced mode is related to ENSO-like decadal variability and dominates the overall observed 500 hPa height trend since 1979. These model results indicate that the trend in the first mode is due to internal variability rather than external radiative forcings.
Hoerling et al, 2016 Time series of US daily heavy precipitation (95th percentile) are analyzed to determine factors responsible for regionality and seasonality in their 1979-2013 trends. …. Analysis of model ensemble spread reveals that appreciable 35-yr trends in heavy daily precipitation can occur in the absence of forcing, thereby limiting detection of the weak anthropogenic influence at regional scales. … Analysis of the seasonality in heavy daily precipitation trends supports physical arguments that their changes during 1979-2013 have been intimately linked to internal decadal ocean variability, and less to human-induced climate change. Most of the southern US decrease has occurred during the cold season that has been dynamically driven by an atmospheric circulation reminiscent of teleconnections linked to cold tropical east Pacific SSTs. Most of the northeast US increase has been a warm season phenomenon; the immediate cause for which remains unresolved.
Deser et al., 2016 This study elucidates the physical mechanisms underlying internal and forced components of winter surface air temperature (SAT) trends over North America during the past 50 years (1963-2012) using a combined observational and modeling framework. … Constructed atmospheric circulation analogues are used to estimate the dynamical contribution to forced and internal components of SAT trends: thermodynamic contributions are obtained as a residual. Internal circulation trends are estimated to account for approximately one-third of the observed wintertime warming trend over North America, and more than half locally over parts of Canada and the United States. Removing the effects of internal atmospheric circulation variability narrows the spread of SAT trends within the CESM ensemble, and brings the observed trends closer to the model’s radiatively-forced response. In addition, removing internal dynamics approximately doubles the signal-to-noise ratio of the simulated SAT trends, and substantially advances the “time of emergence” of the forced component of SAT anomalies. The methodological framework proposed here provides a general template for improving physical understanding and interpretation of observed and simulated climate trends worldwide, and may help to reconcile the diversity of SAT trends across the Coupled Model Intercomparison Project version 5 (CMIP5) models.
McKinley et al., 2016 The ocean has absorbed 41 per cent of all anthropogenic carbon emitted as a result of fossil fuel burning and cement manufacture. The magnitude and the large-scale distribution of the ocean carbon sink is well quantified for recent decades. In contrast, temporal changes in the oceanic carbon sink remain poorly understood. It has proved difficult to distinguish between air-to-sea carbon flux trends that are due to anthropogenic climate change and those due to internal climate variability. Here we use a modelling approach that allows for this separation, revealing how the ocean carbon sink may be expected to change throughout this century in different oceanic regions. Our findings suggest that, owing to large internal climate variability, it is unlikely that changes in the rate of anthropogenic carbon uptake can be directly observed in most oceanic regions at present, but that this may become possible between 2020 and 2050 in some regions.
Parker, 2016 A recovery of the Arctic sea ice is consistently shown by data from the National Snow and Ice Data Center (NSIDC) sea ice extension, the University of Alabama at Huntsville (UAH) lower troposphere temperature and now sea ice volume from Cryosat-2 and other monitoring products as the Pan-Arctic Ice Ocean Modelling and Assimilation System (PIOMAS). The Arctic climate pattern is characterised by high and low frequency oscillations, with longer periodicities up to about 60 years. These correspond to a long term trend of moderate warming and shrinking of ice that started in the 1800s. The pattern appears to be mostly, or even entirely natural.
Le et al., 2016 The low agreement between models in simulating the impacts of solar variations on SAT in several regions suggests the different dynamical responses in these models, possibly associated with inaccurate parameterization of the processes related to solar forcing. Our analysis suggests that internal climate variability played a more significant role than external forcings in short-term SAT variability in the regions of the North Atlantic, the North Pacific, the Arctic, the Antarctic Peninsula, and its surrounding oceans. The possibility of long-term impacts of external forcings on SAT and the uncertainties that might be contained due to effects of internal climate modes other than El Niño–Southern Oscillation underscore the necessity for a more detailed understanding of the dynamical response of SAT to external forcings.
Klein et al., 2016 Model results and lake-based hydroclimate reconstructions display very different temporal patterns over the last millennium. Additionally, there is no common signal among the model time series, at least until 1850. This suggests that simulated hydroclimate fluctuations are mostly driven by internal variability rather than by common external forcing. … [A]t the centennial timescale, the effect of (natural) climate forcing can mask the imprint of internal climate variability in large-scale teleconnections. … The inability of the GCMs in simulating the observed recent downward trend of the long rains implies either that it is part of (multi-)decadal natural variability (Lyon and DeWitt, 2012; Yang et al., 2014; Lyon, 2014), or that the GCMs inadequately represent the climate processes occurring in the region and the response to anthropogenic forcing.
Sun et al., 2016 What caused the recent “Warm Arctic, Cold Continents” trend pattern in winter temperatures? … The emergence of rapid Arctic warming in recent decades has coincided with unusually cold winters over Northern Hemisphere continents. It has been speculated that this “Warm Arctic, Cold Continents” trend pattern is due to sea ice loss. Here we use multiple models to examine whether such a pattern is indeed forced by sea ice loss specifically and by anthropogenic forcing in general. While we show much of Arctic amplification in surface warming to result from sea ice loss, we find that neither sea ice loss nor anthropogenic forcing overall yield trends toward colder continental temperatures. An alternate explanation of the cooling is that it represents a strong articulation of internal atmospheric variability, evidence for which is derived from model data, and physical considerations. Sea ice loss impact on weather variability over the high-latitude continents is found, however, to be characterized by reduced daily temperature variability and fewer cold extremes.
Jackson et al., 2016 Here we examine a state-of-the-art global-ocean reanalysis product, GloSea, which covers the years 1989 to 2015 and closely matches observations of the AMOC at 26.5° N, capturing the interannual variability and decadal trend with unprecedented accuracy. The reanalysis data place the ten years of observations—April 2004 to February 2014—into a longer-term context and suggest that the observed decrease in the overturning circulation is consistent with a recovery following a previous increase. We find that density anomalies that propagate southwards from the Labrador Sea are the most likely cause of these variations. We conclude that decadal variability probably played a key role in the decline of the AMOC observed over the past decade.
Femke de Jong and de Steur, 2016 Deep convection is presumed to be vital for the North Atlantic Meridional Overturning Circulation, even though observational evidence for the link remains inconclusive. Modeling studies have suggested that convection will weaken as a result of enhanced freshwater input. The emergence of anomalously low sea surface temperature in the subpolar North Atlantic has led to speculation that this process is already at work. Here we show that strong atmospheric forcing in the winter of 2014–2015, associated with a high North Atlantic Oscillation (NAO) index, produced record mixed layer depths in the Irminger Sea. Local mixing removed the stratification of the upper 1400 m and ventilated the basin to middepths resembling a state similar to the mid-1990s when a positive NAO also prevailed. We show that the strong local atmospheric forcing is predominantly responsible for the negative sea surface temperature anomalies observed in the subpolar North Atlantic in 2015 and that there is no evidence of permanently weakened deep convection [contradicting climate models].
Chylek et al., 2016 A parsimonious statistical regression model with just three explanatory variables [anthropogenic radiative forcing due to greenhouse gases and aerosols (GHGA), solar variability, and the Atlantic Multi-decadal Oscillation (AMO) index] accounts for over 95 % of the observed 1900–2015 temperature variance. This statistical regression model reproduces very accurately the past warming (0.96°C compared to the observed 0.95°C) and projects the future 2015–2100 warming to be around 0.95°C (with the IPCC 2013 suggested RCP4.5 radiative forcing and an assumed cyclic AMO behavior). The AMO contribution to the 1970–2005 warming was between 0.13 and 0.20°C (depending on which AMO index is used) compared to the GHGA contribution of 0.49–0.58°C. During the twenty-first century AMO cycle the AMO contribution is projected to remain the same (0.13–0.20°C), while the GHGA contribution is expected to decrease to 0.21–0.25°C due to the levelling off of the GHGA radiative forcing that is assumed according to the RCP4.5 scenario. Thus the anthropogenic contribution and natural variability are expected to contribute about equally to the anticipated global warming during the second half of the twenty-first century for the RCP4.5 trajectory.
Dong and Doi, 2016 Recent studies have shown considerable changes in terrestrial evapotranspiration (ET) since the early 1980s, but the causes of these changes remain unclear. In this study, the relative contributions of external climate forcing and internal climate variability to the recent ET [terrestrial evapotranspiration] changes are examined. Variations in Pacific sea surface temperatures (SSTs) are found to be consistently correlated with ET over many land areas among the ET datasets. The results suggest that there are large uncertainties in our current estimates of global terrestrial ET for the recent decades, and the greenhouse gas (GHG) and aerosol external forcings account for a large part of the apparent trend in global-mean terrestrial ET since 1982, but Pacific SST and other internal climate variability dominate recent ET [terrestrial evapotranspiration] variations and changes over most regions.
Koenigk and Brodeau, 2016 Decadal variations of Arctic sea ice extent and ice volume are of the same order of magnitude as the observed ice extent reductions in the last 30 years and are dominated by the variability of the ocean heat transports through the Barents Sea Opening and the Bering Strait. Despite a general warming of mid and high northern latitudes, a substantial cooling is found in the subpolar gyre of the North Atlantic under year-2015 and year-2030 conditions. This cooling is related to a strong reduction in the AMOC, itself due to reduced deep water formation in the Labrador Sea.
Barcikowska et al., 2016 Our analysis shows that simulated internal climate variability in a coupled climate model (CSIRO-Mk3.6.0) reproduces the main spatio-temporal features of the observed component. Model-based multidecadal variability comprises a coupled ocean-atmosphere teleconnection, established through a zonally oriented atmospheric overturning circulation between the tropical North Atlantic and eastern tropical Pacific. During the warm SST phase in the North Atlantic, increasing SSTs over the tropical North Atlantic strengthen locally ascending air motion and intensify subsidence and low-level divergence in the eastern tropical Pacific. This corresponds with a strengthening of trade winds and cooling in the tropical central Pacific. … If the observations-based component of variability originates from internal climate processes, as found in the model, the recently observed (1970s-2000s) North Atlantic warming and eastern tropical Pacific cooling might presage an ongoing transition to a cold North Atlantic phase with possible implications for near-term global temperature evolution.
Bügelmayer-Blaschek et al., 2016 The climate of the Holocene, the current interglacial covering the past 11,700 years, has been relatively stable compared to previous periods. Nevertheless, repeating occurrence of rapid natural climate changes that challenged human society are seen in proxy reconstructions. Ocean sediment cores for example display prominent peaks of enhanced ice rafted debris (IRD) during the Holocene with a multidecadal to millennial scale periodicity. Different mechanisms were proposed that caused these enhanced IRD [ice rafted debris] events, for example variations in the incoming total solar irradiance (TSI), volcanic eruptions and the combination of internal climate variability and external forcings. … In the experimental set-up that was forced with idealized sinusoidal TSI variations (±4 Wm-2 ), we find a significant occurrence of an increased iceberg melt flux about 60 years after the minimum TSI [total solar irradiance] value. … [T]he relationship between TSI and IMF is due to internal dynamics of the coupled system. From our experiments we conclude that internal ice sheet variability seems to be the source of the multi-century and millennial-scale iceberg events during the Holocene.
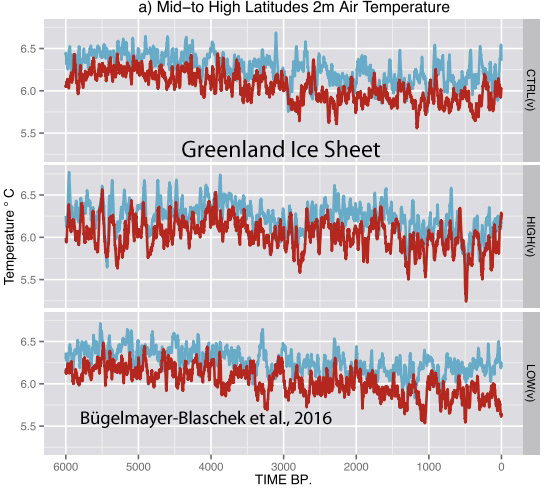


Recent Comments