A Deconstruction Of The
PAGES 2k ‘Hockey Stick’
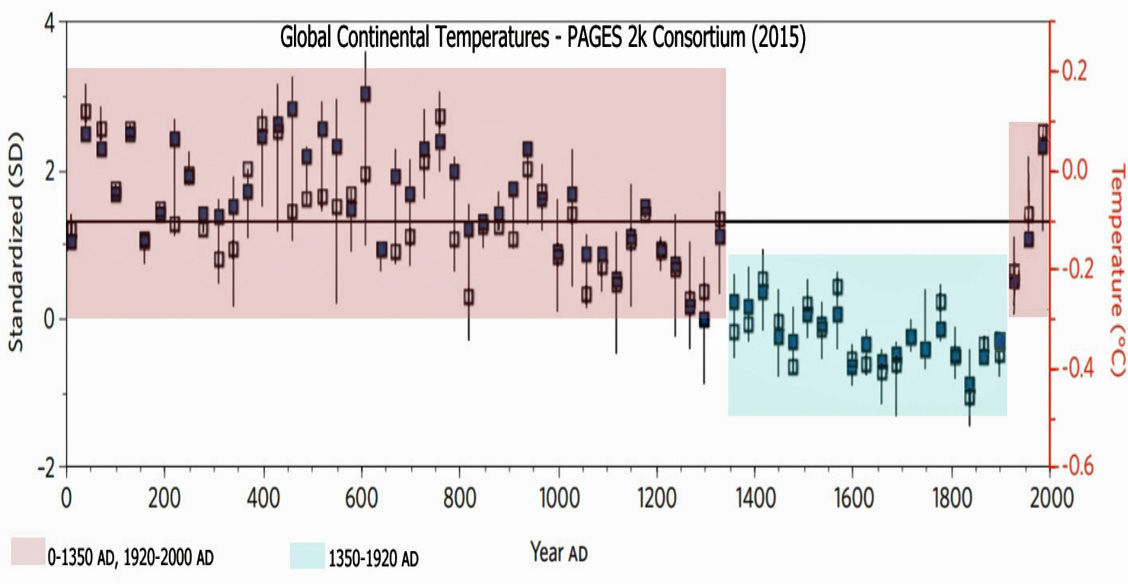
Image adapted from PAGES 2k, 2015
Five years ago, the release of the PAGES 2k Consortium (2013) “global” temperature data set was accompanied by a great deal of fanfare.
Advocates deemed the conglomeration of proxy temperature data from 7 land regions as scientific confirmation of the notorious hockey-stick-shaped temperature reconstruction popularized by Michael Mann and the Intergovernmental Panel on Climate Change (IPCC, TAR) in the early 2000s.
The New York Times featured interviews with the lead authors of the study upon its release. While emphasizing the exceptionality of modern warmth, the authors acknowledged that “temperatures in some regions were higher in the past then they were during the late 20th century.”
“In Europe, slightly higher reconstructed temperatures were registered in A.D. 741–770, and the interval from A.D. 21–80 was substantially warmer than 1971–2000.”
“Antarctica was probably warmer than 1971–2000 for a time period as recent as A.D. 1671–1700, and the entire period from 141–1250 was warmer than 1971–2000.”
After corrections to “several errors” (more on this below) in the Arctic reconstruction, the 1971-2000 decades were only deemed the third warmest in the record, with the 3 decades around 400 AD the warmest.
“Following these corrections, the period from 1941–1970 emerges as the second warmest 30-year period in the Arctic record, and 1971–2000 the third warmest, rather than the first and second warmest as reported in the original version. The ranked order of the best estimate of temperature indicates that the warmest 30-year period is centred on AD 395” (PAGES 2k, 2015).
When viewing the supplemental data and comparing the PAGES 2k reconstructions to other Basic Composites, there doesn’t seem to be a lot of unusual or exceptional characteristics about the 20th century’s temperatures relative to the beginning of the 2nd millennium and earlier (for the few records that extend back that far).
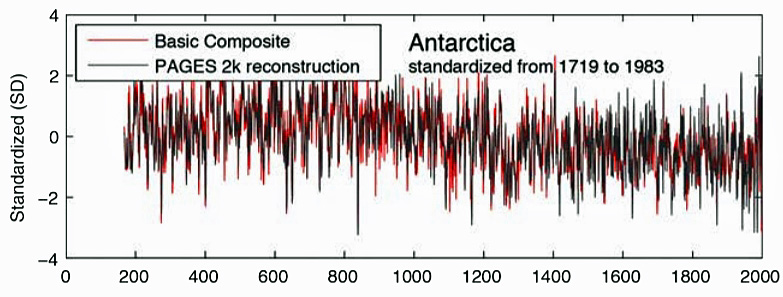
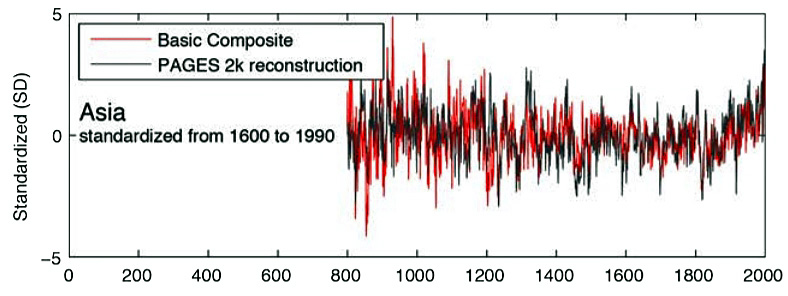
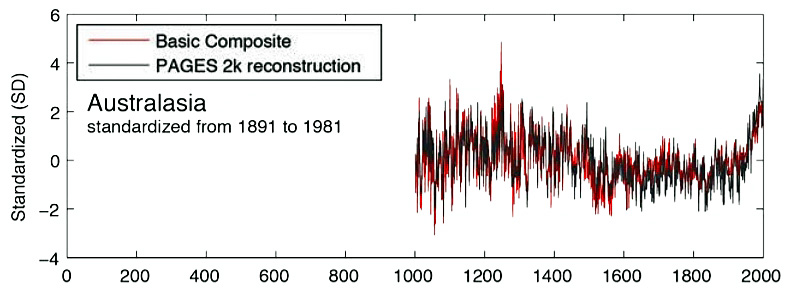
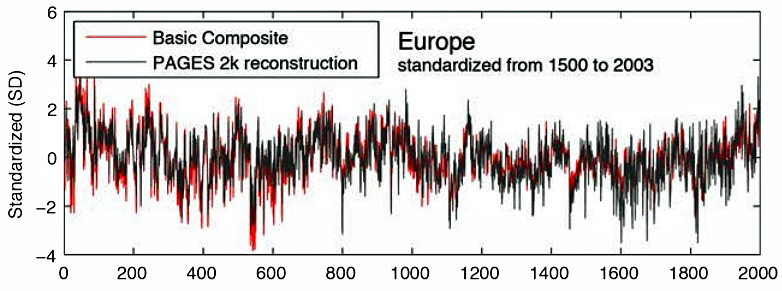
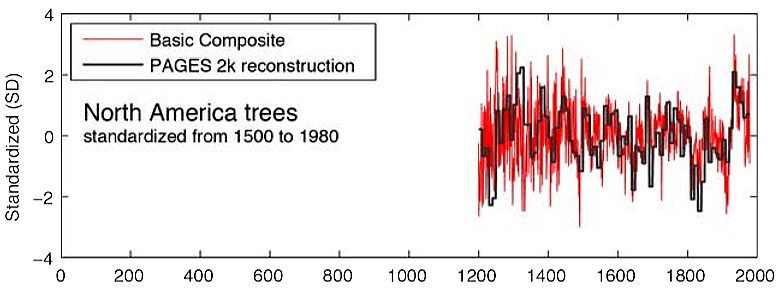

Images: PAGES 2k Consortium, Supplementary
Is This Really A Global, 2,000-Year Reconstruction?
The PAGES 2k temperature reconstruction utilizes proxy data from 7 land regions, but excludes the entire continent of Africa. (Oceans, covering 71% of the Earth’s surface, are also excluded from this “global” record.)
Despite being hailed as a global-scale, 2,000-year reconstruction, just 2 of the 7 regions, the Arctic and Europe, analyzed temperatures from the entire 0 AD to 2000 period.
Antarctica was represented beginning in 167 AD. Asia begins in 800 AD. South America begins in 857 AD. North America proxy data begins in 1204 AD and ends in 1974 (tree rings) and 480 to 1950 (pollen). Australasia begins in 1001 AD.
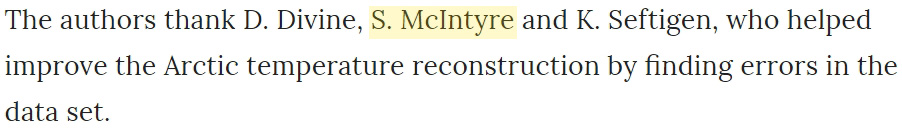
Steve McIntyre Spots ‘Several Errors’ Corrupting Arctic 2k; Some Are Corrected In 2014
Steve McIntyre, known for his evisceration of the questionable data-collection processes in the construction of “hockey stick” graphs, identified several suspicious “errors” corrupting the Arctic data set. He wrote about them on his blog.
“Kaufman’s proxies are fraught with defects. Kaufman has already acknowledged that one of his supersticks (Igaliku) was contaminated by modern agriculture; and that another non-H13 series (Hvitarvatn) was used upside down.
“Several series, thought to be temperature proxies as recently as 2013, were removed in August [2014] as no longer ‘temperature proxies’. For inexplicable reasons, Kaufman failed to remove all the contamination from the Igaliku series and his inversion of the Hvitarvatn points to major inconsistencies with other series.”
The PAGES 2k authors reported that these “several errors” were “discovered” following publication. A list of 5 of these errors were mentioned in a “correction” paper.
“Here we present an Arctic regional temperature reconstruction that revises the one published recently by the PAGES 2k Consortium. The revisions include updating records using more recent published studies from three sites, and correcting several errors discovered following publication of the PAGES 2k Consortium article. … 1. Three records were removed because of insufficient evidence that they are sensitive to temperature. 2. Sections of five records that were interpreted by the authors to violate criterion 5 were removed. 3. The interpreted temperature relation of the series from Hvítárvatn was corrected from positive to negative [warming to cooling]. 4. A 50-year offset in the ages of the record from Lone Spruce Pond was corrected. 5. The coordinates of the Copper River tree-ring reconstruction were corrected” (McKay and Kaufman, 2014).
Curiously, the corrupt and error-ridden data contributing to Arctic 2k dataset seemed to go in one direction and one direction only: they cooled the past and warmed the present.
The odds of a large series of unforced mistakes consistently occurring with one sign (cooling) for one period (the 1st millennium) and the opposite sign (warming) for another period (the 20th century) are extremely low. And yet it happened.
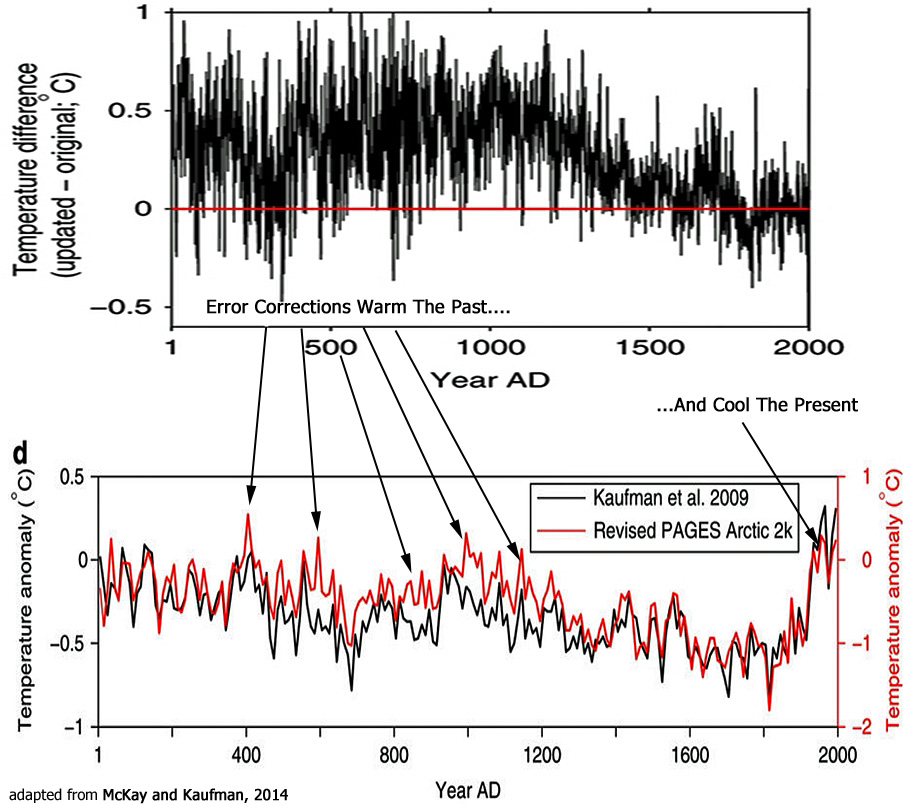
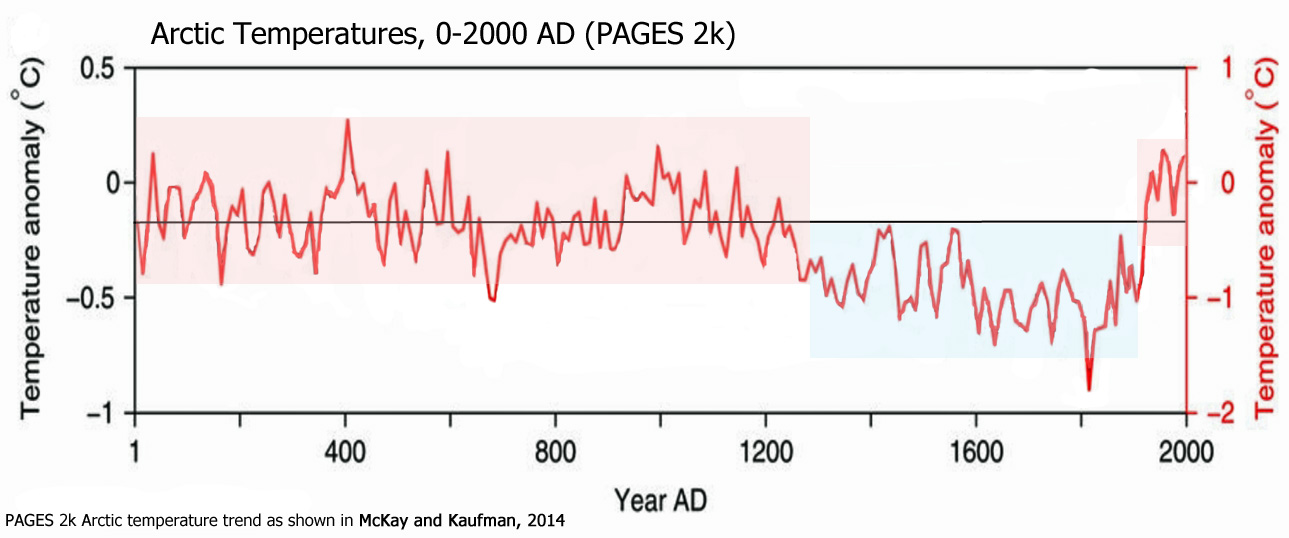
Image adapted from McKay and Kaufman, 2014
After corrections to the originally erroneous and corrupted PAGES 2K reconstruction, much of the entire 0-1,000 AD period turned out to be just as warm (if not warmer in some decades) as the 20th century. Here’s what the corrected (red) Arctic reconstruction looked like as of 2014, with the corrupted (black) data removed.
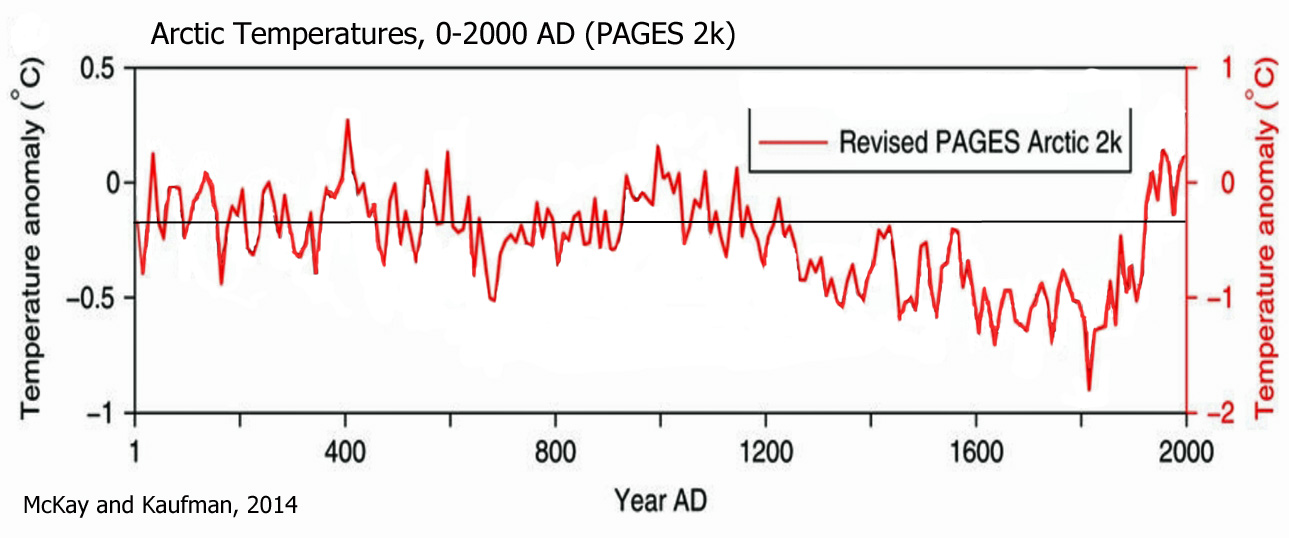
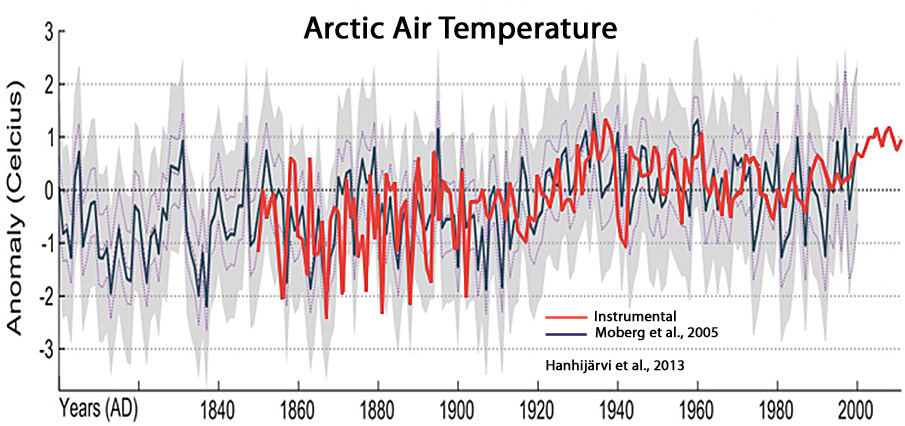
Notice that all or nearly all the Arctic warming occurred from the late 1800s to the 1940s, with no net change (even cooling) from the 1940s through 2000. This is consistent with the instrumental record (Hanhijarvi et al., 2013; HadCRUT4 via Climate4You).
A Corrigendum Is Published, But 2 ½ Years Later
It took until late 2015 for the PAGES 2k authors to finally issue a corrigendum to their error-riddled “global” reconstruction graph released in 2013. Dr. Steve McIntyre was acknowledged for “discovering” their “several errors”.
The blogosphere that favors hockey-stick-shaped graphs uniformly ignored the corrected depiction of “global” temperatures in the corrigendum, preferring the erroneous 2013 graph that shows more warming in recent decades and less warming during the 1st millennium.
As before, the obligatory “hockey stick” blade was tendentiously inserted at the end of the record to make the 20th century appear exceptional.
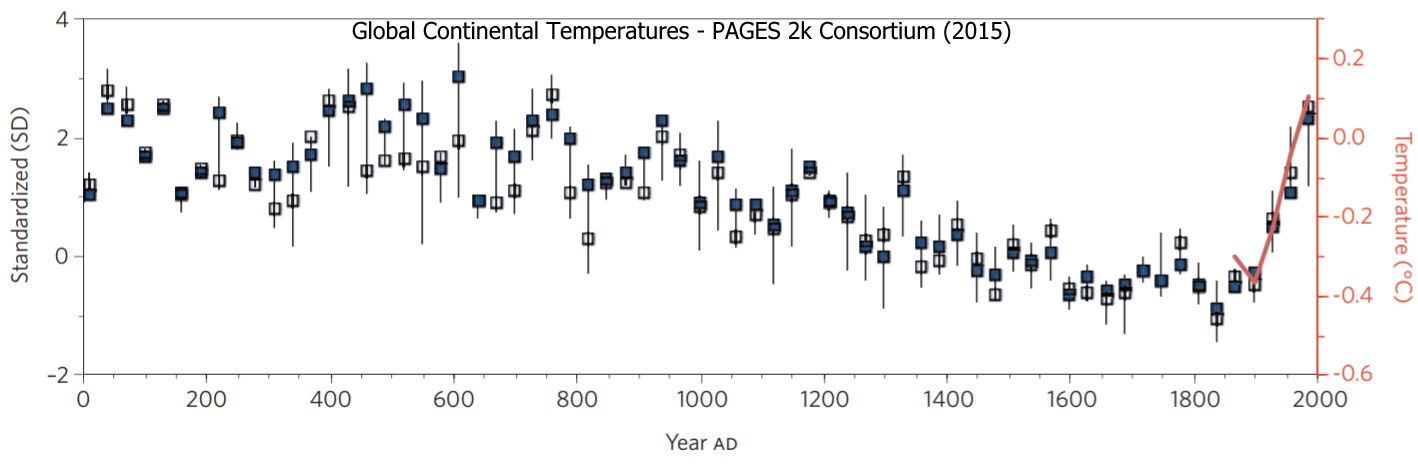
Image: PAGES 2k, 2015
Visual Paradigm Shift: The Cooling Is Anomalous – Modern Warmth A Return To Normal
As suggested, the reason why the “hockey stick” blade was added to the partially corrected “global” PAGES 2k record was to visually persuade readers that the modern period is anomalous and unusual.
But if we look at the presented data from all 7 regions in PAGES 2k from another angle, a distinct pattern emerges that identifies the modern temperatures as the norm, and the mid-1300s to early 1900s cooling period as the exception. The 20th century warmth is merely a return to the normal temperatures that characterized most of the Late Holocene.
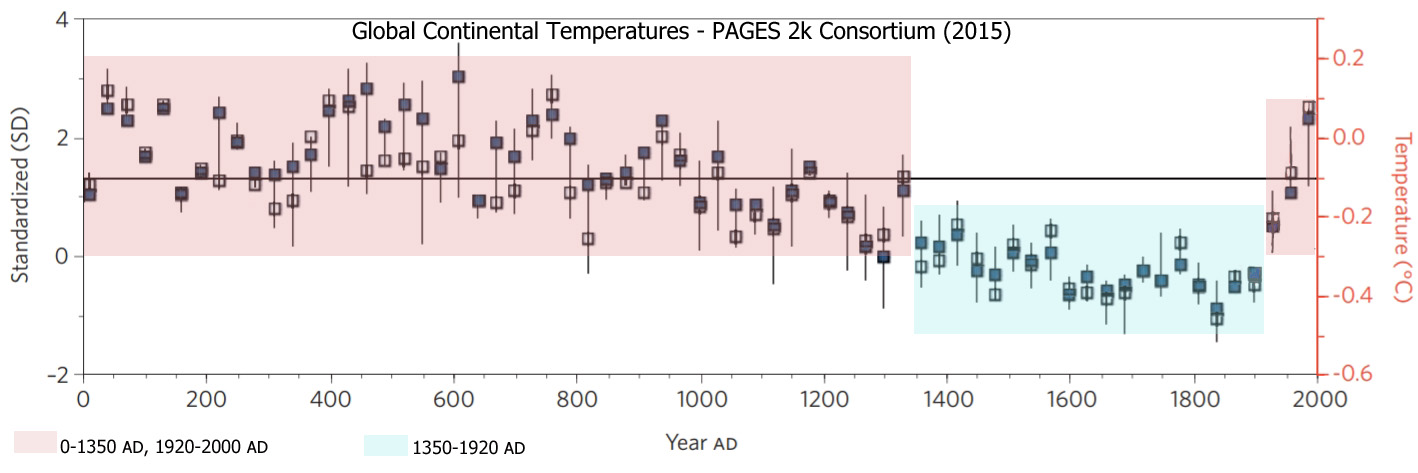
Image adapted from PAGES 2k, 2015
The anomalously cool years can be viewed even more conspicuously when adding simulated temperatures to the post-2000 record.
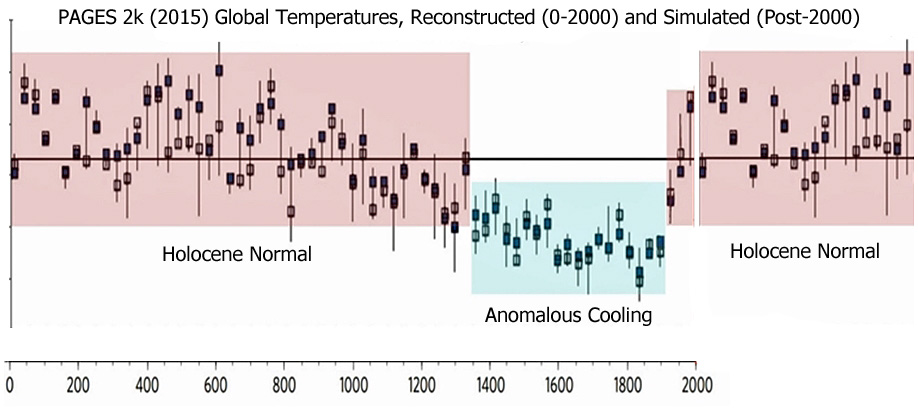
This same pattern can be identified in the regional reconstructions as well. The Arctic’s 1880s to 1940s abrupt warming trend (and subsequent non-warming) reached amplitudes compatible with past Holocene periods.
In sum, nothing climatically unusual has happened in the last 150 years relative to the last two millennia.
The Late Holocene’s normal temperatures have (fortunately) returned.


Recent Comments