PART 2
—–
96. Paterson, 1977
Figure 4a shows 10-yr mean [temperature] values from AD 1200 to present [Arctic Canada]. Prominent features are brief warm periods with peaks at 1240 and 1380, cold peaks at 1430, 1520, and 1560, the ‘Little Ice Age’ continuously cold from 1680 to 1730 and with another temperature minimum at 1760, a pronounced warming at about 1910 with relatively warm temperatures until about 1960 and a marked cooling thereafter … [T]he cooling trend over the past 5,000 yr has probably been more than 1°.
—–
97. Angell and Korshover, 1978
Based on a network of 63 well-spaced radiosonde stations around the world, the global temperature within the surface to 100 mb layer was lower in 1976 than in any year since commencement of the record in 1958, and the 1976 surface temperature equated the global record for the lowest temperature set in 1964; but even so the trend in global temperature since 1965 has been small compared to the 0.5°C decrease during 1960–65. Between 1958 and 1976 the surface to 100 mb temperature in north extratropics decreased by about 1°C, with the decrease twice as great in winter as in summer, and in 1976 this region was 0.2°C lower than in any previous year of record.
One other attribute of the CO2 trend should be emphasized. Between 1958 and 1968 the rate of increase of CO2 at Mauna Loa averaged about 0.7 ppm per year-1, whereas between 1968 and 1973 the increase averaged about 1.4 ppm per year-1, and even between the periods of augmentation 1.2 ppm per year-1. In contrast to this near doubling of the rate of increase of CO2, the [anthropogenic] CO2 input into the atmosphere only increased by about 30% between the periods 1961-67 and 1967-74 (Baes et al., 1976), so that factors other than [anthropogenic] emissions rates appear to be involved in the overall CO2 growth rate.
—–
98. Collis, 1975
Increasing demand is outstripping world food production, despite increased yields due to technological progress. Combined with adverse weather and governmental policies, this has led to a major rundown of reserve grain stocks over the last few years. Without adequate reserves to provide equalization, weather must now he recognized as a critical factor in balancing the supply and demand of world food. Regardless of long term trends, such as the return of an Ice Age, unsettled weather conditions now appear more likely than those of the abnormally favorable period which ended in 1972. This possibility and its implications must be considered in planning and determining national and world food policies. There is an urgent need for better understanding and utilization of information on weather variability and climatic change in this context.
—–
99. Griggs, 1973,1975
http://www.tandfonline.com/doi/pdf/10.1080/00022470.1975.10470118
The scientific community (e.g., SCEP1 and SMIC2 ) has become increasingly aware in recent years of the importance of atmospheric aerosols and their optical properties in possible climate modification. The aerosols in the atmosphere consist of man-made and natural particles, and it is the man-made contribution due to combustion added to the natural (dust, sea spray, forest fires, and volcanic dust) background that is generally considered to be important in determining climatic changes. However, the man-made contribution on a global scale is quite small; estimates range from a negligible amount to about 6% of the natural background. … McCormick and Ludwig presented evidence of a worldwide buildup of atmospheric aerosols which could increase the earth albedo resulting in a cooling of the earth-atmosphere system. This effect would counteract the postulated increase of temperature in the lower atmosphere due to the greenhouse effect of the increased CO2 emissions by human activities. In fact, there has been a decrease in the mean annual air temperature since about 1945 at mid latitudes, suggesting that the aerosol pollution effect is greater than that of the CO2 increase. However, the effects of aerosols and CO2 are more complex than suggested above, so that their effects on climate are not readily predicted. For instance, Robinson points out that the earth may self-regulate its temperature by the variation of cloud amount: the higher temperatures, due to the CO2 greenhouse effect, lead to a higher water content in the lower atmosphere, which may increase the cloud amount; this increases the albedo, thereby decreasing the temperature. Robinson concludes there is no justification for forecasting a final equilibrium temperature due to an increase in CO2 content, until atmospheric models are significantly improved to include the cloud cover as a variable.
—–
100. Mitchell, 1970
The secular increase of global atmospheric particulate loading by human activity is estimated, and compared with a construction of the secular variability of stratospheric dust loading derived from data on volcanic activity since 1850. It is concluded that the total human-derived particulate load is at present comparable to the average stratospheric dust load from volcanic eruptions, but that the variations of human-derived loading are an order of magnitude less than those of volcanic dust loading. For reasonable estimates of the thermal cooling effect of dust load increases, it is inferred that secular cooling due to human-derived particulate loading is currently of the order of 0.05°C per decade. Although changes of total atmospheric dust loading may possibly be sufficient to account for the observed 0.3°C-cooling of the earth since 1940, the human-derived contribution to these loading changes is inferred to have played a very minor role in the temperature decline.
—–
101. Kukla, 1977
“New data on climatic trends”
Indicators of large-scale climate developments show that the oscillatory cooling observed in the past 30 yr in the Northern Hemisphere has not yet reversed. This conclusion was reached by updating our data on the month-to-month, season-to-season, and year-to-year variations of selected zonally averaged meteorological parameters.
—–
The chronology shows effects of the “Little Ice Age,” of the subsequent Northern Hemisphere warming, and of a recent cooling trend.
—–
103. Wendland, 1977
Mean air temperatures are thought to have varied by several degrees Celsius during the Holocene and hence the subtropical ocean temperatures, too, may have significantly changed. Mitchell (1972) suggests Northern Hemisphere warming of ~0.5°C from the 1880’s to 1950. The cooling from about 1950 to 1974 is ~0.3°C (Brinkmann, 1976). Moran (1975) suggests that the recent drought of peninsular Florida is largely due to decreased frequencies of tropical storms, associated with the general atmospheric and oceanic cooling since about 1940 (Wahl and Bryso, 1975).
—–
104. Douglas, 1975
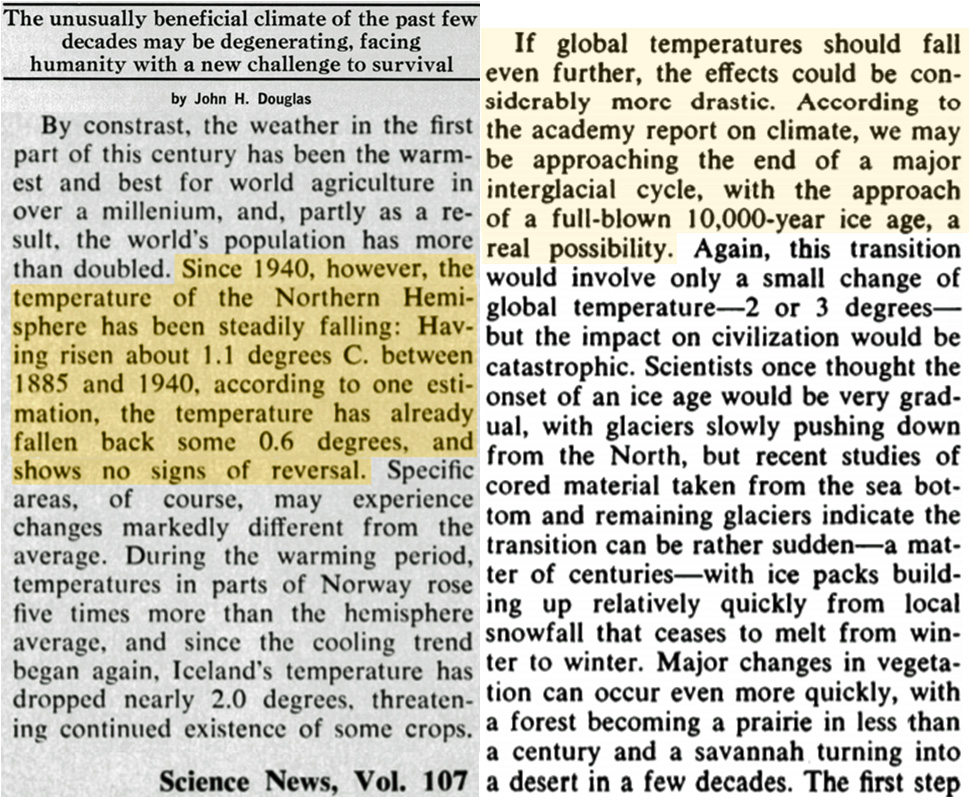
[T]he weather in the first part of this century has been the warmest and best for world agriculture in over a millenium, and, partly as a result, the world’s population has more than doubled. Since 1940, however, the temperature of the Northern Hemisphere has been steadily falling: Having risen about 1.1 degrees C. between 1885 and 1940, according to one estimation, the temperature has already fallen back some 0.6 degrees, and shows no signs of reversal. Specific areas, of course, may experience changes markedly different from the average. During the warming period, temperatures in parts of Norway rose five times more than the hemisphere average, and since the cooling trend began again, Iceland’s temperature has dropped nearly 2.0 degrees, threatening continued existence of some crops.
According to the academy report on climate, we may be approaching the end of a major interglacial cycle, with the approach of a full-blown 10,000-year ice age a real possibility.
—–
105. Emiliani, 1972
Oxygen isotopic analysis and absolute dating of deep-sea cores show that temperatures as high as those of today occurred for only about 10% of the time during the past half million years. The shortness of the high temperature intervals (“hypsithermals”) suggests a precarious environmental balance, a condition which makes man’s interference with the environment during the present hypsithermal extremely critical. This precarious balance must be stabilized if a new glaciation or total deglaciation is to be avoided.
—–
106. Nelson et al., 1975
Concern about climatic change and its effects on man has been increasing. Climatic changes affect the production of food and the allocation of energy resources. Proper interpretation of climatic change and the effect of weather on fuel use and crop production requires a homogeneous data base. A methodology is presented for removing non-climatic variability from monthly mean temperature records caused by changes in time of observation, station location, instrumentation and observer, using as an example climatological records for June, July and August from 1930 to 1976 in Indiana. Divisional and state mean temperature adjustments to the published figures were calculated. Divisional temperature corrections were usually negative, with an extreme correction of −1.5°F applied to the published Central Division temperatures in 1942–44 and 1950. State mean June, July and August corrections were negative every year, with an extreme correction value of −0.8°F in 1949. Even with the temperature corrections included, Indiana June, July and August mean temperatures showed a decrease of approximately 3°F [-1.7°C] from 1930 to 1976.
—–
107. Bradley, 1973
A number of studies in recent years have been concerned with climatic fluctuations on a global or hemispheric basis (Putz 1971; Treshnikov and Borisenkov 1971 ; Mitchell 1961, 1963). A notable feature of these studies is the general conclusion that in the Northern Hemisphere the regions of greatest Warming from the 1880s to the 1930s or later have been in higher latitude zones. Similarly, areas of greatest cooling over the last 30 years have also been in these regions. Treshnikov and Borisenkov (1971), for example, note that the mean increase in annual temperatures 1881-1920 to 1921-60 for stations between 67°30’ and 77°30’N., and 72°30’ and 88°30’N. was 0.88 degrees C. and 1.11 degrees C. respectively. Flohn (1971) using data from Putz (1971) also shows data, 1961-70, for 10° latitude belts as deviations from the 1931-60 normals. These indicate that the largest negative changes occurred in higher latitudes (> 60°N.), suggesting that a return to conditions of the late nineteenth century is under way. Both the early twentieth century warming trend and the subsequent cooling have been most marked in “winter” months (December, January, and February), a fact also noted by Mitchell 1963. The studies indicate that the arctic and subarctic regions are extremely sensitive to climatic fluctuations and may be considered indicators of hemispheric trends
—–
108. Hoyt, 1979
Using the pyrheliometric measurements of the Smithsonian Astrophysical Observatory (APO), the relative atmospheric transmission is calculated at four locations during the period 1923–1957. Decreases in atmospheric transmission caused by three major volcanic eruptions are evident in the Mt. Montezuma, Chile, records. For those volcanic eruptions in the tropics the transmission also decreases at Table Mountain, California. Each volcanic eruption is widely separated from the others in time and easily distinguishable in the radiation records. Both stations appear to suffer from local anthropogenic aerosol pollution near the ends of their records. It is concluded that the post 1940 cooling is not likely to be caused by increased volcanic activity. The annual cycle in atmospheric transmission is caused by variations in total precipitable water, so the climatology of total precipitable water is also investigated. Although an annual cycle in total precipitable water and aerosol loading is clearly evident, no long-term trend in water vapor occurs at the APO sites. The large temporal and spatial variability of water vapor causes adjacent years to differ.
—–
109. Zakharov, 1978
The author utilizes ice data from Arctic stations and from ice reconnaissance flights to investigate the impact of the cooling trend that began in the early 1940’s on sea ice conditions in the Soviet Arctic.
—–
110. Petersen and Larsen, 1978
An attempt is made to identify a stochastic model that makes the best fit to a generalized temperature curve covering the last 700,000 years. A search is made for the model within the family of auto-regressive, integrated, moving average models. All the models presented forecast a decline in temperature during the next 5000 years.
—–
111. Chi-chun and Pen-hsing, 1978
Research on glacier fluctuations shows that the Little Ice Age was also experienced here [Chinghai-Tibet Plateau] with maxima occurring during the 19th century. This was followed by a strong retreat from the 1930s with recent signs of the initiation of a new period of glacier advance. … Our on-the-spot investigations, documental records and information local residents all tell us that, beginning in the thirties, the glaciers in Tibet underwent a period of strong retreating. The air temperature began to fall after the fifties. From meteorological records, we know that the temperature in the sixties was universally 0.7°C or so lower than in the fifties, but the precipitation increased by 5-27 per cent.
—–
112. Richmond, 1972
Consideration of the history of Holocene climate in the Rocky Mountains indicates that the over-all trend during the past 2500 yr has been toward increasing warmth, interrupted by cooler times of minor advances of cirque glaciers. Comparison of Holocene climatic history with the record of past interglacials in the region suggests that the present interglacial is not complete and that the climate may become first warmer and subsequently wetter before it is completed. Correlation of the timing of the regional glacial-interglacial record for the past 140,000 yr with the record of major sea level changes and with the calculated changes in the earth’s insolation suggest that the present interglacial may be completed within a few millenia and that it may be followed by a significant cooling of the climate.
—–
113. Lamb and Mörth, 1978
After many decades in which it was generally assumed – and taught – that climate could for practical purposes be treated as constant, it was Ahlmann who in this journal (Geogrl J. 112 (1949)) drew widespread public attention to the fact that a very significant warming of world climate had been going on more or less throughout the first half of this century, particularly from 1920 to 1940. The reversal of this trend [cooling] that followed, particularly between 1955 and 1965, and the remarkable incidence since 1960 of many kinds of extreme weather in many parts of the world, going beyond the statistical expectations based on the data of the so-called climatic ‘normal’ periods between 1900 and 1960, have created concern amongst planners in agriculture, industry, and trade.
—–
114. Bulatov and Zakharov, 1978
Changes in the amount of multi‐year ice in arctic seas during the current cooling trend
The authors investigate the impact of the cooling trend that has prevailed since the early 1940’s on certain aspects of sea ice conditions in the Soviet Arctic: specifically changes in the average concentration of old ice, i.e., older than one year, between the decades 1946–55 and 1956–65, and changes in the position of the southern boundary of the old ice. Both criteria show differences between the Western Arctic and the Eastern Arctic, with the dividing line at approximately 160°E. West of this meridian, concentrations increased by up to 3 tenths (in a zone north of Severnaya Zemlya and New Siberian Islands), while the southern boundary of old ice was up to 100 miles farther south to the west of the divide, and up to 100 miles farther north to the east. The significance of these changes with regard to navigation conditions is self‐evident.
—–
115. Bray, 1971
Increased atmospheric carbon dioxide content was concluded to have had an ambiguous climatic influence and may be less important than sometimes considered. Several studies have suggested increased turbidity has produced a recent global cooling trend. An examination of some climatic effects of volcanic eruption was made in relation to the prediction that the effect of 500 supersonic transport aircraft would be comparable over the North Atlantic to the amount of stratospheric injection from the 1963 Mount Agung eruption. World glacial advance over the past three centuries was shown to be synchronous with volcanic eruption (p <0.01) and with poor harvests (p <0.001) and lower world temperatures were significantly related to volcanism (p <0.01). These relationships support the results of a previous study and suggest that the effects of 500 supersonic transport aircraft may lead to reduced surface temperatures and possibly an intensification of alpine glaciation.
—–
116. Moran, 1974
The current cooling trend in global mean temperature has amounted only to about 0.1°C per decade since its initiation in the mid-1940s.
—–
117. Lauzier, 1967
Here it is our intention to emphasize the temperature fluctuations during the past 17 years, 1951-1966, in the Subarea 4. This means all overlap from the previous studies (to 1962), but a necessary one to assure continuity and to cover the entire recent cooling period. The cooling period is also given its proper perspective with respect to the previous fluctuations. … The cooling trend experienced in Subarea 4, from the early fifties, is still continuing in the middle sixties. The average rate of cooling during the last 15 or 16 years is of the order of 0.19°C/year. The St. surface temperature variations are representative of bottom temperature variation over a large segment of the Scotian Shelf •
—–
The Coming Ice Age
What of the future? Does the fact that ice ages have occurred many times in the past mean that another one lies ahead? Unless there is some fundamental and unforeseen change in the climate system, most scientists who have examined the evidence agree that the world will experience another age of ice. … An analysis of deep-sea cores (Figure 40) shows that no Pleistocene interglacial has lasted more than about 12,000 years and that most have lifespans of about 10,000 years. Statistically speaking, then, the present interglacial is already on its last legs, tottering along at the advanced age of 10,000, and can be expected to end within the next 2000 years. … [From] readings made at a worldwide network of weather stations, Mitchell was able to show that global climate has been cooling since 1940 (Figure 44).
—–
119. Kamb, 1964
Dynamic Response: The response of glaciers to changing climate has two aspects: (i) manifestation of climatic change in terms of alteration in the balance or imbalance between annual ice accumulation and ablation – the “mass budget” of glaciers – and (ii) response of glaciers to alterations in mass budget, which is seen as advance or retreat and as changes in ice thickness. The first aspect is basically a problem of meteorology, whereas the second is the expression of glacier dynamics. Intensive study of the energy budgets and mass budgets of glaciers in relation to meteorological variables shows that radiation balance (solar and sky radiation) is the dominating energy factor but that no single climatic variable is responsible for the changing mass balance, even though a general correlation has been established between increasing mean summer temperature and glacier retreat. … Detailed application of these ideas has not been made to the well-known general retreat of mountain glaciers throughout the world, which has gone on over the past 50 years or at a rate of 5 to 20 meters per year. Correlation with climatic trends suggest the retreat may be about to reverse itself, and recently there has been standstill or moderate-to-strong glacier advance in places, notably in the Pacific Northwest and on the island of Jan Mayen in the northern Atlantic.
—–
120. Budyko, 1970; Orvig, 1970
The hydrological cycle of Greenland and Antarctica
Recent studies of the Antarctic ice budget seem to indicate that the ice budget is slightly positive at present [1970], with an annual gain of perhaps a little Iess than 600 km3 water. Greenland has, probably a small net annual loss of a little less than 100 km3 water. The net result should be a lowering of the sea level of approximately 1.5 mmlyear. It should be remembered that Antarctic information is very recent-since the I. G. Y. in 1957-58.
Recent times have seen a relatively stable sea level-a rise of about 20 cm for the fifty years ending in 1940 [+4 mm/yr for 1890-1940], but a decrease to about half of this rate of rise since then. Perhaps the various figures would be comparable if data were compared for the last 10 years. It does seem that the great ice caps are now more or less in equilibrium.
—–
121. Reid Jr., 1970
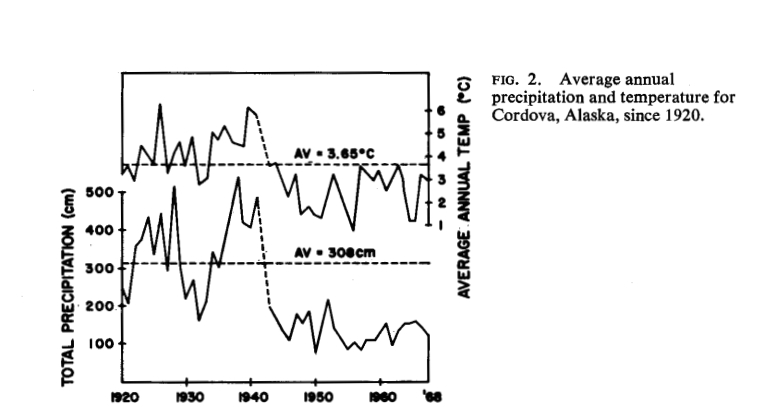
Except for a period of about five years (1928 to 1933), the weather before 1942 was warmer and wetter than since that time
[As the below graph indicates, temperatures in Alaska dropped by -2° to -3°C between the 1940s and 1960s.]
—–
122. Meier and Post, 1962
Introduction: Almost all of the glaciers in western North America were receding in the years from 1935 to 1950.
At about 1945 a climatic change occurred in western Washington, leading to more winter precipitation and cooler summers. The first observed glaciological evidence of this change was a thickening of ice on Nisqually Glacier detected by Johnson in 1946 (Johnson 1949, 1960). By 1955 many of the glaciers in the Northern Cascade Range were advancing in a rather spectacular fashion (Hubley, 1956, p. 671). However, this period of glacial growth in Washington may have come to an end (LaChapelle, 1960).
—–
123. Sagan et al., 1979
Observations show that since 1940 the global mean temperature has declined by ~0.2 K, despite an accelerated increase in the carbon dioxide content of the atmosphere. Extrapolation of present rates of change of land use suggests a further decline of ~1 K in the global temperature by the end of the next century, at least partially compensating for the increase in global temperature through the carbon dioxide greenhouse effect, anticipated from the continued burning of fossil fuels.
—–
124. Hoyt et al., 1979
Conclusions: The trends in [anthropogenic] atmospheric transmission at the three locations examined in this paper are very small, perhaps nonexistent, and generally not statistically significant. If the trends in atmospheric transmission and hence anthropogenic aerosols are small near their presumed sources, then the global increase in aerosols must be very small indeed. Consequently, the effects of anthropogenic aerosols on climate is probably negligible.
There now appear to be two schools of thought concerning anthropogenic aerosols. One school argues that their increase has caused much of the observed cooling of the Northern Hemisphere since 1940. Some proponents of this viewpoint are Bryson and Dittberner (1976) and Budyko (1969). The other school of thought contends that there is no evidence for an increase in anthropogenic aerosols on a global scale and hence they are unlikely to be important climatically. Proponents of this viewpoint include Ellsaesser (1975), Dyer (1974) and Landsberg (1975). The results of this paper support the views of the latter. A recent study by Jones and Jiusto (1980) also indicates the impact of urban areas on climate is undetectable in most cases.
—–
125. Harshvandahn and Cess, 1975
A significant fraction of the aerosol population of the stratosphere is believed to consist of sulfate, presumably in the form of sulfuric acid. An increase in stratospheric aerosols could modify global climate by augmenting reflection of sunlight as well as enhancing the atmospheric greenhouse, two competing mechanisms with regard to changing the global surface temperature. Assuming that the aerosols consist of supercooled 75 % aqueous sulfuric acid, we present a first-order estimate as to the effect of aerosol concentration upon global surface temperature. The model calculations illustrate that the increase in reflected sunlight constitutes the dominant contribution by aerosols; the normal aerosol concentration reduces the global surface temperature by roughly 0.7 K, and a doubling of concentration would provide a further decrease by the same amount. Increased aerosol concentration further results in heating of the stratosphere through absorption of infrared radiation emitted by the earth-atmosphere system. The model indicates that stratospheric temperature at 20 km could be raised by as much as 9 K, consistent with Southern Hemisphere observations following the eruption of Mt. Agung.
Stratospheric aerosols can modify global climate in one of two ways. Reflection of solar radiation enhances the planetary albedo, reducing the global surface temperature, whereas the infrared opacity of the aerosol layer augments the greenhouse effect and increases the surface temperature. There has been considerable debate as to which of these two competing mechanisms dominates, although recently Coakley & Grams (1975) have presented a simple but convincing argument that the albedo modification is most important, so that an increase in aerosol concentration would produce a global cooling trend. … Volcanic activity during the 1960’s could, however, contribute in part to what appears to be a global cooling trend since 1940 (e.g. Budyko, 1969).
—–
126. Post, 1979
Concern over the vulnerability of a heavily populated world to climatic fluctuations affecting harvests and world food supply has emerged only recently. This concern has been stimulated by anomalous weather patterns beginning with the colder winters in Europe and North America in the 1960s, the Indian monsoon failures and droughts in the Soviet and Chinese grainlands in that decade and since, and the drought which continued for many years in Africa and brought chaos to the Sahel and Ethiopia. But, despite the computer revolution in meteorology, no generally accepted theory of climatic change to inform the future exists at this time.
—–
127. Matthews, 1972
Renewed development of the Laurentide and Scandinavian ice sheets would have large effects on global climate. By one model, growth of a new ice sheet would be slow and would begin with systematic and easily measurable changes in remote regions of Northeastern Canada. By another model, growth of a new ice sheet would begin rapidly with the development of thin ice cover over a large area. Clearly, immediate global impact would be much greater with the second model than with the first. Because sea level fluctuations are the reciprocal of change in ice volume, interaction between Pleistocene coral reefs and sea level events provides an estimate of the dynamics of the ocean-cryosphere system. The data suggest rapid growth of continental [ice] sheets.
—–
128. Johnson, 1974
I suspect that we are witnessing the recovery in recent years of Boreal faunas which were reduced in diversity sometime prior to the census of 1940, perhaps by the deleterious environmental effects of the relatively warm-dry period of the 1930s. It is tempting to hypothesize that the recent period of global cooling, which reversed the warm trend of the 1940s (Kukla and Matthews 1972), has gradually improved montane environments in the Southwest for the occupancy of additional Boreal species.
—–
129. Zirin et al., 1976
In the past 100 years, meteorological records indicate that the world underwent a relatively small variation of temperature, of amplitude about 0.5°C, with lowest temperatures in the 1880’s and highest in the 1940’s. A cooling trend has been dominant in many parts of the world, especially in the arctic and sub-arctic, since the 1940’s.
—–
An oxygen-isotope climatic record from the Devon Island Ice Cap Arctic Canada
Figure 4a-shows 10-yr mean [temperature] values from AD 1200 to present. Prominent features are brief warm periods with peaks at 1240 and-1380, cold peaks at 1430, 1520 and 1560, the ‘Little Ice Age’ continuously cold from 1680 to 1730 and with another temperature minimum at 1760, a pronounced warming at about 1910 with relatively warm temperatures until about 1960 and a marked cooling thereafter.
—–
131. Hustich, 1978
The climatic ‘improvement’ of the late 1930’s had, as was expected, given way to a colder trend in the 1950’s and 1960’s … Dunbar (1976, p. 190) writes that he finds it “difficult to believe that either Carbon dioxide in the atmosphere, water vapour, freon, or any other substance produced by man’s efforts is going to compete seriously with Nature in changing our climate”. … Heino’s diagrams illustrate the exceptional nature of the climatic improvement experienced in the 1930’s, but they also show clearly the slow deterioration which set in in the 1950’s. The 1960’s constituted climatically a rather unfavourable decade from man’s point of view
—-
Volcanic Activity and Climate Changes
Since the measured values of direct solar radiation decreased about 5 percent during the 1945 to 1975, the surface mean temperature should have decreased 6 to 10 K during this time if only the solar constant varied. This is clearly much larger than the 0.3 K or so [of cooling] that was observed. … From 1945 to 1970, the annual eruption numbers roughly doubled from 16 to 18 per year to 37 to 40 per year. During the same interval, the aerosol optical depth also roughly doubled. This is in good agreement with the observations of Hammer, who reported a doubling in the amount of nonorganic impurities deposited on the Greenland Ice Sheet between times of low and high volcanic activity based on ice core analysis for the past 300 years.
—–
133. Klige, 1985
The author attempts to quantify the amount of water released (by various means) by the world’s glaciers, and to determine the variations in these figures provoked by the warming trend which was observed for the first half of this century, and the cooling trend observed in the 1960s and 1970s. Unfortunately Antarctica has generally had to be excluded from these calculations since data on a number of components of the water balance of the Antarctic Ice Sheet are simply not available. Perhaps most significant are the author’s predictions that the anticipated future rise in air temperatures will provoke increased precipitation and hence increased accumulation on the major ice sheets. Even despite increased melting in coastal areas of Greenland and Antarctica the net effect will be a positive mass balance and ultimately a lowering of sea level
—–
134. Geist, 1978
Introduction: Denton and Karlén (1973) found a periodicity of about 2500 years for minor glaciations that correlated with a regular variation in the solar corpuscular activity (Bray, 1971); about 900 years coincide with the expansion of glaciers and 1600 with their retreat. In recent years weather patterns have changed as the mean earth temperature has begun to decline, so that there is an increase in snowfall and cold temperatures of the northern hemisphere, and an increase in snowfall and cold temperatures over the old epicenters of glaciation such as the Rocky Mountains, Hudson Bay, Labrador, Scandinavia, and the Alps, as well as an increase in aridity in the major deserts, which may indicate a return to glacial conditions.
—–
135. McIntyre and Ruddiman, 1972
Samples representing the post-Eemian cool interval (approx 110,000 yr BP) were taken from 15 cores on the eastern flank of the mid-Atlantic Ridge from 42°N to 61°N lat. The floral-faunal assemblages in these samples characterize the surface paleooceanography which we consider a possible analog to the cooling expected to follow the present warm interval. The derived paleooceanographic map indicates at least a 16° lat southward displacement of cooled water masses from today. The present position of the Transitional water mass which gives N. Europe its equitable climate was then occupied by Subpolar water while the Polar Front extended south of Iceland. The result was a drop in annual temperature of the NE Atlantic surface water by at least 5°C.
—-
136. Tangborn, 1967
The balance trend for the higher altitude Thunder Creek glaciers shows a major change occurring about 1944, from generally negative balances between 1920-44 to a gain in glacier mass between 1945-65… The glaciers in the Thunder Creek basin lost mass steadily during the period 1920-44 at an average rate of 0.9 m of water per year. During the period 1945-65 a gain in glacier mass occurred at the rate of 0.2 m per year (fig. 4). Several pronounced advances of glaciers in the North Cascades have been observed since the late 1940’s and early 1950’s. Most high elevation glaciers have been unusually active and many have advanced or increased in size (Bengson, 1956; Harrison, 1956; Hubley, 1956; Johnson, 1954). A distinct change in climate, which was conducive to glacier growth, undoubtedly occurred in the Pacific Northwest in the mid-forties. On the basis of this rather approximate hydrologie method of determining glacier mass balances, a significant change from a negative to positive trend in the mass balances of the high elevation Thunder Creek glaciers occurred at the same time. The reliability of the hydrologie method of measuring approximate glacier mass balances is supported, therefore, by this recent evidence of glacier growth.
—–
137. Carrarra and McGimsey, 1981
It was found that both the Agassiz and Jackson glaciers began to retreat from their maximum late -Neoglacial positions about 1860. … Retreat rates, derived from the tree-ring data, appear to have been modest (<7 m yr) until about 1910 when they increased reaching more than 40 m yr for the Agassiz Glacier between 1917 and 1926. … [F]rom various literature descriptions and National Park Service records, both glaciers experienced rapid retreat (>100 m yr) from this time until 1932. In addition, while the Agassiz Glacier was monitored by the National Park Service (1932 to 1942) retreat continued at a rapid rate (>90 m yr). This period of rapid retreat corresponds with a period of above-average summer temperatures and decreased precipitation in the climatic record of the region. Since the mid-1940s the retreat rate of both glaciers has slowed markedly.
—–
138. Williamson, 1975
Between 1000 and 1300 average summer temperatures were about 1°C higher than today, with the mean annual temperature higher by perhaps 4°C in a largely ice-free Arctic. Eric the Red, a renowned world citizen of that time, has been much maligned as the first progressive publicity man for giving Greenland a false image in order to attract settlers; but in truth, the southwest of that vast country was warmer and greener by far than at any time until the Fieldfares Turdus pilaris arrived there in the mid-1930s. The sea-temperature of the Atlantic was higher than it has been since, and there appears to have been none or very little ice to hinder the Vikings’ communications between Iceland, Greenland, Newfoundland and Labrador (Mowat 1965). Indeed Brooks (1926) considers that the polar ice-cap may have disappeared entirely during the summer months, to build anew each winter. … The nineteenth century opened optimistically but cold, wet spells intervened, and one run of wet summers, 1845-48, brought the Potato Famine in Ireland. It was not until the 1890s that any marked amelioration began. The northern hemisphere warmed up slightly, but significantly for many forms of life, between 1900 and 1940, the most striking temperature gains occurring in the Arctic winter. Storminess increased over the North Atlantic, and more equatorial air was fed to Arctic regions in the warm sectors of the depressions. … The combined effect of this greater penetration of warmer air and water explains why Spitsbergen at the terminus of the Gulf Stream benefited to a greater degree than anywhere else, an average rise of more than 8°C keeping her seas ice-free for seven months of the year instead of barely three months less than a century before. Harris (1964) gives winter (NovemberMarch) and spring (April-June) temperature curves for Angmagssalik in southeast Greenland, which illustrate the large degree of warming in high latitudes in the northeast Atlantic Ocean, with a maximum rate of change in the 1920s and a maintenance of the higher temperatures during the 1930s. In the 1940s a definite downturn in winter temperatures was noticed, at first without any discernible change at other seasons, the summers following around 1950. Autumns remained and have largely continued warm and dry, fostering a high productivity among resident birds. According to Manley (1964) the average July-August temperature in central England in the 1950s was half a degree centigrade lower than in the previous 20 years, while the rainfall had risen by 19%. Average winter temperatures fell, and winter snow lay longer, especially in Shetland and northern Scotland. Since about 1958 the reduced heat transport via the warm air sectors of the depressions has permitted an increase in pack-ice off northern and eastern Iceland to a condition comparable with the 1880s, and Polar Bears Thalarctos maritimus have been able to cross from Greenland for the first time for half a century (Marshall 1968). This relapse from warmth continued into the 1970s with one winter, 1962/63, as devastating over the English Midlands and south as anything experienced since 1740 (Manley n.d., Lamb 1966, Booth 1968). People asked, are we on the threshold of another long climatic recession?
—–
139. Lamb, 1975
The history of climatic change since 1970 is also an interesting one. To anyone living in Europe, where there have been four or five notably mild winters in a row, it is probably surprising to learn that the global cooling seems to have continued. The 5-year mean ocean surface temperature averaged for all the North Atlantic weather ships fell by 0°- 5°C from 1951-55 to 1968-72. The North Pacific has also become colder, and Canada and the Canadian Arctic have become colder than before. A northern hemisphere map (Figure 15) (produced by my colleague P. B. Wright of the Climatic Research Unit) of the number of mild winters in the years 1970-74 shows that, besides Europe, only the Gulf of Mexico and southern U.S.A., and a narrow zone across eastern Siberia, have been having mild winters in this decade, though over most of Europe their predominance has been remarkable. The belated cooling of the northern part of North America has so increased the winter temperature gradient between there and the tropical Atlantic Ocean that the atmospheric circulation over the Atlantic has been greatly invigorated, sending mild air far across Europe. The limited penetration of the Arctic by this air, however, suggests that this climatic phase must be far less effective than the regime that prevailed in the first half of this century in melting the Arctic ice. Indeed, from 1961 to date, including 1974, most months of every year have been colder than the previous (1931-60) average over most of the Arctic. And, taking the year as a whole, no year since 1961 in England has had a mean temperature exceeding the previous 30-year average, with one minor exception in 1971 which exceeded the average by 0.1°C. A careful survey of the global extent of snow and ice, measured by G. Kukla of the Lamont Geological Observatory, New York, from satellite photography, several times a month, produced the remarkable result that, on a yearly average, the snow and ice cover had increased by 12% since 1967 up to 1972, most of the increase taking place in 1971, the year when the climatic cooling rather suddenly spread to Canada. In the northern hemisphere most of the increase was in the transition seasons, spring and autumn, and was therefore equivalent to a lengthening of the winter. The increase appeared to be of similar magnitude in both northern and southern hemispheres. … The colder Arctic in the last 15 years or so has been accompanied by an intensified thermal contrast around the perimeter of the region of cooling. This may be the reason for anomalies in the distribution of prevailing atmospheric pressure and winds, which up to mid-1974 produced an anomalous frequency of anticyclones in the zone between 40°N and 70°N—so-called blocking anticyclones, which greatly reduced the frequency of the prevailing westerly winds in middle latitudes and accounted for prolonged spells of drought, and of wetness and flooding, in middle latitudes in different sectors at different times, particularly since 1968.
Extrapolation, however, is no safe guide to the future unless it be based on recognition of the physical process, or processes, causing the trend. The farthest it seems possible to go at present is to say that a continuation of the trend line with recurrence of the approximately 200-year cyclic fluctuation, which is prominent in many long climatic series and proxy data, such as the year-layers in the Greenland ice-sheet, and which is probably related to a solar fluctuation of the same preferred period-length registered in the history of the radioactive carbon isotope in the atmosphere over several thousand years past.
—–
140. Bradley and England, 1978
The post-1963 change in summer climate appears to be related to the massive increase of volcanic dust in the upper atmosphere, primarily due to the eruption of Mt. Agung (March 1963). Subsequent eruptions may have caused the cooler conditions to persist. Volcanic dust affects solar radiation receipts and perhaps also influences the general circulation. If the high volcanic dust levels of the 1960s are responsible for reduced mass losses on High Arctic glaciers and ice caps, it is probable that other periods with high atmospheric dust levels (e.g., 1750 to 1880) had summer temperatures at least as cold as the mid to late 1960s. Conversely, the period of very negative balance on the Devon Island ice cap from 1947 to 1963 was probably typical of the period back to 1920 when the atmosphere was relatively free of volcanic dust.
—–
If the Eemian is taken as the analog of the present interglacial, a point in time 116,000 YBP becomes the historical model for today’s ocean, and the North Atlantic is now approaching a time of severe cooling.
—–
142. Schofield, 1963
It is generally agreed that sea level has been at least 200-300 ft. lower and higher than the present at different times during the Quaternary, and that these large eustatic changes have been due to major advances and retreats of ice sheets. … The main point at issue is whether there was a postglacial period [the last ~10,000 years] when sea Ievel was up to 10 ft. higher than the present. This is still widely accepted, the more active proponents being those who also believe in minor fluctuations of sea level. … The present rise in sea level coincides with the retreat of most of the world’s glaciers, but up to at least 1938 (Thorarinsson 1940) some European glaciers were at the same time advancing and hence the rise in sea level cannot be directly related to purely local climatic changes. More strikingly, Calder (1961) shows that the mean annual temperature during 1940-50 dropped a maximum of 4°F in North Siberia, but elsewhere rose 1°F and more. The latter includes most of Europe and the U.S.A., but over the bulk of the earth’s surface, including most of the ocean space, temperatures fell during this period. Nevertheless, agreement that minor sealevel fluctuations are due to an aggregate effect of changes in climate throughout the world, forms a basis for ultimate determination of local climatic changes.
—–
143. Miller, 1964
- GLACIER BAY DISTRICT At that time this fiord, which is more than 2,000 feet deep, had experienced an unprecedented recession, losing nine miles of ice in the thirty-three years since 1907. Details of such staggering diminution of the whole Glacier Bay ice-sheet in the 1920’s and 1930’s, followed by the rapid encroachment of seed plants on the deglaciated terrain, were first presented in two papers by Cooper (1923; 1931). In a later paper (1937 pp. 47-48), he showed by ecological methods that the great Glacier Bay ice sheet reached its post-Glacial maximum, near the mouth of Glacier Bay, shortly after 1700 and that the major recessional trend set in sometime between 1735 and 1785. There was a marked slowing down in the recession between 1880 and 1899, the rate during this period being only half the average which had been in effect since 1794. The only known readvance was a short-lived one in the 1890’s which was probably related to this “slowing down” period. … My further aerial surveys in 1947, 1948, 1951, 1952 and most recently in 1961, show that over the past decade and a half a general slowing down of the recession rate of some of these glaciers, similar to that reported in the [18]90’s, has again occurred. This conclusion was further verified by ground observations and photography while reoccupying some of our old photogrammetric stations in September, 1962. In several instances there have been some minor readvances.
—–
144. Lamb et al., 1962
Jan Mayen [glaciers] appears as a somewhat localized exception to a general cooling of the Arctic surface temperatures by 1° C. or rather more from the 1940’s to 1950’s
—–
The carbonate curves are interpreted to indicate a pronounced increase in wind stress and probable climatic deterioration after the beginning of the last interglacial (post-Eemian). This is also reflected in the carbonate curves for the previous major climatic cycle. If the Holocene warm period is analogous to the Eemian (Barbados Terrace III) then we may expect a pronounced climatic deterioration [cooling/glaciation] in the next few thousand years.
—–
146. Bach, 1976
It appears that major ice ages seem to occur every 100,000 yr and that after an interglacial interlude we are on the brink of a period of colder climate. It has been estimated that the mean temperature of the planetary atmosphere in its surface layers has decreased by about 0.3°C since the 1940’s despite an 11% increase of CO2 above the nineteenth century preindustrial level of 290 ppm. It appears that the natural climatic cooling trend is roughly 3 times more powerful than the present influence of CO2. However, in the near future, far-reaching adverse climatic and ecological consequences can be expected because the CO2 increase is too rapid for the regulatory mechanisms of the oceans. The impact of an increasing aerosol loading cannot be assessed reliably yet. The net effect will probably be small or one of warming. Presently, the heat release of the order of 15–20 TW from global energy production is still relatively small. But with the continuation of the present energy growth rate, within one generation, waste heat production may reach 100–300 TW, an amount found sufficient in natural processes to cause climatic changes. Some problems related to land use changes are also discussed, especially overgrazing, which may lead to desertification, and tropical deforestation, which may alter the atmospheric circulation.
—–
147. Ratcliffe, 1977
A steady increase in mean temperature in the British Isles during the first part of the century was reversed around 1940-50 and the last three decades have been marked by a steady fall in mean temperature.
—–
148. Hays et al., 1976
[T]he longterm trend over the next 20,000 years is toward extensive Northern Hemisphere glaciation and cooler climate.
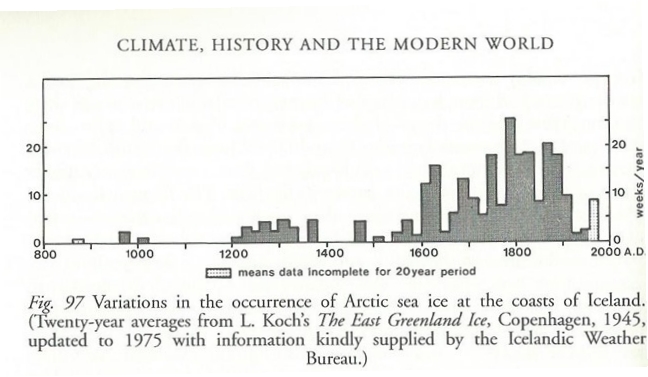
149. H.H. Lamb Climate, History, and the Modern World (1982) pgs. 260, 261
Cooling in the Arctic
The cooling of the Arctic since 1950-60 has been most marked in the very same regions which experienced the strongest warming in the earlier decades of the present century, namely the central Arctic and northernmost parts of the two great continents remote from the world’s oceans but also in the Norweigan-East Greenland Sea. (In some places, e.g. the Franz Josef Land archipelago near 80 °N 50-60 °E, the long-term average temperature fell by 3 – 4°C and the ten-year average winter temperatures became 6 -10°C colder in the 1960s as compared to the preceding decades.)
It is clear from Icelandic oceanographic surveys that changes in the ocean currents have been involved. Indeed a greatly (in the extreme case, ten times) increased flow the cold East Greenland Current, bringing polar water southwards, has in several years (especially 1968 and 1969, but also 1965, 1975, and 1979) brought more Arctic sea ice to the coasts of Iceland than for fifty years: in April – May 1968 and 1969 the island was half surrounded by the ice, as had not occurred since 1888.
Such years have always been dreaded in Iceland’s history because of the depression of summer temperaturesand the effects on farm production. In the 1950s the mean temperature of the summer half year in Iceland had been 7.7°C and the average yields were 4.3 tonnes/hectare (with the use of 2.8 nitrogen fertilizer); in the late 1960s with the mean temperature 6.8°C the average hay yield was only 3.0 tonnes/hectare (despite the use of 4.8 kg of fertilizer). The temperature level was dangerously close to the point at which the grass virtually ceases to grow. The country’s crop of potatoes was similarly reduced. The 1960s also saw the abandonment of attempts at grain growing in Iceland which had been resumed in the warmer decades of this century after a lapse of some hundreds of years.
At the same time the changes in the ocean have produced changes in the spawning grounds and seasonal range of migration of fish stocks – a not much publicized aspect of the international wrangles and ‘cod wars’ of recent times. With the fall by over 1°C in the mean surface temperatures off west Greenland from the peak years in the 1920s and 1950s, the cod fishery there declined by the early 1970s to a tiny fraction of what it had been in those times. The Greenland cod migrated to Iceland waters, and for a few years (1967 – 71) offset the declining stocks there; but since 1974 the spawning stocks in Iceland waters have been only a tenth of what they were in the late 1950s and the total stocks have fallen almost a half, the decline being probably due to combined effects of the change in water climate and over-fishing. Similarly, herring stocks have moved from Iceland waters to the wider reaches of the Norweigan Sea farther east, south, and north to the North Sea, while a southward shift of the southern limit of cod seems to have led to increased catches in the North Sea since about 1963.
https://s19.postimg.org/fj69ahgoj/Iceland_Sea_Ice.jpg
Surging/Advancing Glaciers in the 1950s,1960s
Muldrow Glacier in Alaska advanced extremely rapidly during the winter of 1956–1957, with surface movements of ice amounting to over 6.6 km. This flow was accompanied by a pronounced lowering of the surface of the upper portion of the glacier by 170 m, or more, with a corresponding rise in surface ice levels in the terminal portion; the net exchange of ice is roughly computed to be equal. No other glacier in the region showed evidence of a similar movement during the same period. However, the Black Rapids Glacier in 1937, the Yanert in 1942, and the Susitna in 1953 did make advances of a similar nature. … Evidence does indicate that these advances result from critical dynamic conditions met with in certain glacier systems favoring long periods of stagnation followed by sudden displacements of ice.
—–
151. Thorarinsson, 1969
The glacier surges that have occurred in Iceland since 1890 are listed, and the largest ones, those of Brúarjökull in 1890 and 1963–64, are described. The glacier area affected by the surges of Brúarjökull is about 1400 km2 , the volume of ice and firn affected is about 700 km3, and the total advance of the glacier front 8-10 km. The maximum rate of advance of the glacier front in 1963 was at least 5 m/hour. Brúarjökull’s surges seem to occur with an interval of 70-100 years.
—–
152. Stanley, 1969
For part of 1966, Steele Glacier in the Icefield Ranges, Yukon Territory, Canada, made a spectacular advance at a rate exceeding 500 m per month. The main part of the surge continued for two years, but by early 1968 the advance had slowed to less than one tenth of the maximum rate.
—–
153. Meier and Post, 1969
A total of 204 surging glaciers has been identified in western North America. These glaciers surge repeatedly and probably with uniform periods (from about 15 to greater than 100 years). Ice flow rates during the active phase may range from about 150 m/year to >6 km/year, and horizontal displacements may range from <1 to >11 km. Ice reservoir and ice receiving areas can be defined for surging glaciers, and the reservoir area does not necessarily coincide with the accumulation area. Glaciers of all shapes, sizes, and longitudinal profiles can surge, and no unusual “ice dams” or bedrock constrictions are evident. Surges occur in many different climatic, tectonic, and geologic environments, but only in certain limited areas (mainly in the Alaska, eastern Wrangell, and St. Elias mountains). Three types of surging glaciers are defined: (I) large to moderate-sized glaciers with large displacements and very fast flow, (II) large to moderate glaciers with moderate displacements and flow rates, and (III) small glaciers with small displacements and moderate to fast flow rates. All three types involve an inherent instability which is self-triggered at regular intervals, but with Type I surges an additional (unknown) mechanism produces the very high flow rates.
—–
154. Liestøl, 1969
Surges constitute a common form of glacier advance in Spitsbergen. The fastest movement observed is that of the Negri Glacier, with an advance of ~12 km in less than a year. Observations on the Finster-walder Glacier indicate that the ice flow is too small to maintain a steady-state slope. At intervals, of the order of 100 years, the glacier will balance this build-up by surging. A small surging glacier in the Dickson Valley has a sheet of refrozen meltwater in the front. This refrozen meltwater is possibly generated by the surge.
—–
156. Dolgoushin and Osipova, 1971
About 70 surging glaciers have been registered in the glaciated regions of the Soviet Union (in the Pamirs, the Tien-Shan, the Caucasus, and the Kamchatka peninsula). The Medvezhy Glacier in the Pamirs has a surge period of 12-14 years. The last advance of this glacier occurred in spring of 1963 and was selected as a representative surge.
—–
157. Hollin, 1965
‘Surges’ and ‘catastrophic advances’ in glaciers have received increasing attention recently. More than forty such events have been reported from Alaska and northwest Canada alone.
Dubious Human Influence on Climate, Low CO2 Climate Sensitivity (44)
158. Willett, 1974
DO RECENT CLIMATIC FLUCTUATIONS PORTEND AN IMMINENT ICE AGE?
The recent climatic fluctuations are examined as to amplitude and pattern, as a necessary prerequisite to explanation and predictive extrapolation. Two quite distinct hypothesis, that of atmospheric pollution and that of cyclical solar-climatic interaction, are considered as possible causes of the recent fluctuations and accordingly as predictors of the climatic changes to come, notably with respect to the imminence of an Ice Age. The solar-climatic hypothesis gains the strong preference of the author.
159. W.J. Humphreys, (1940, pp. 585-6), and outstanding meteorological physicist, after careful consideration of CO2 absorption and the water vapor absorption spectrum, concludes that “either doubling or halving the present amount of carbon dioxide could alter but little the total amount of radiation actually absorbed by the atmosphere, and, therefore, seemingly, could not appreciably change the average temperature of the earth, or be at all effective in the production of marked climatic changes.”
In view of the mere 7% observed increase of CO2, of the conclusion of Humphreys quoted above and of the work of the numerous authorities quoted by him, the author is convinced that recent increases of atmospheric carbon dioxide have contributed much less than 5% of the recent changes of atmospheric temperature, and will contribute no more than that in the foreseeable future. Furthermore, the carbon dioxide hypothesis for the upward trend of northern hemispheric temperature from 1920-50 does not at all account for the fact that this trend terminated in higher middle latitudes before it even started in subtropical latitudes, where it peaked long after it terminated in high latitudes.
—–
[W]e find a serious discrepancy between theory and observation. … A decline in the global temperature of Earth is likely to increase rather than decrease the albedo, but in any case the albedo decline required to explain the discrepancy appears to be out of the question. Indeed, detailed global climate models suggest that a relative increase in [albedo] of only 2 percent is enough to induce extensive glaciation on Earth, which implies that the present climate is extremely sensitive to albedo. This leaves changes in atmospheric composition as a possible explanation [for climate changes]. Major variations in the CO2 abundance will have only minor greenhouse effects because the strongest bands are nearly saturated. A change the present CO2 abundance by a factor of 2 will produce directly a 2° variation in surface temperature. The CO2 abundance is highly controlled by silicate-carbonate equilibria; by buffering with seawater, which contains about 100 times the atmospheric CO2; and by the respiration and photosynthesis feedback loop. The negative exponential dependence of the vapor pressure of water on reciprocal temperature implies that for a lower global temperature there is no likelihood of gaining more water vapor than the contemporary global average, about 1 g cm-2. The only surviving alternative appears to be that the atmosphere of Earth 1 or 2 aeons ago contained some constituent or constituents, not now present, with significant absorption in the middle infrared, in the vicinity of the Wien peak of Earth’s thermal emission.
—–
170. Bryant, 1987
Conclusions: The scenario of a CO2-warming globe contains many uncertainties. The warming of the atmosphere is not an established fact, and even if it was there may be no need to invoke increased atmospheric CO2 or other ‘greenhouse’ gases as the cause when such warmings have been a part of our temperature time series historically. If temperatures are increasing, sea-levels may not be rising globally because of melting near-polar ice or thermal expansion of oceans. Evidence now coming to light indicates that it is extremely difficult, if not impossible, to delineate an eustatic signature above tectonically or climatically induced ones. In this regard, sea-level rise may not be a hazard of the future except in local areas where isostatic factors are causing the land to sink (areas of subsidence) or the ocean to rise (for instance, areas affected by more frequent El Nino-Southern Oscillation events). … A common factor underpinning our uncertainties about a CO2-warming atmospheric scenario is that the Earth is not covered adequately with enough data points to evaluate the scenario conclusively. Even where geophysical time series are available, they are clouded by the inherent fluctuations of their variances.
—–
Water vapour and cloud are the dominant regulators of the radiative heating of the planet. ..The greenhouse effect of clouds may be larger than that resulting from a hundredfold increase in the CO2 concentration of the atmosphere. … The size of the observed net cloud forcing is about four times as large as the expected value of radiative forcing from a doubling of CO2. The shortwave and longwave components of cloud forcing are about ten times as large as those for a CO2 doubling.
—–
172. Kaplan, 1960
Although PLASS (1956 b) realized that the existence of clouds would decrease the effect of changing CO2, concentration on temperature, his clear sky estimate of 3.8° C for a halving of the CO2, content was used in his discussions of the influence of CO2, changes on climatic change (PLASS, 1956 b, 1956 c, 1959). It now appears that this number is too high by more than a factor of two, and perhaps by as much as a factor of three. It would seem, therefore, that CO2, variations could not play a major role in the ice-age cycle unless the CO2 changes were by an order of magnitude. It is also found from Table 4, with the same reasoning, that a change of 10 % in CO2 content should result in a change of not more than one-fourth of a degree in the surface temperature. The magnitude of this change does not seem to be large enough to account for the secular increase in European temperatures that was observed in the beginning of this century.
—–
173. Dunbar, 1976
[T]he past history of the present interglacial has been much the same as in the sea, predictably. The trend since the climatic maximum of 5000 years B.P. has been downward, involving a retreat southward of the treeline by some 500 km, a global drop in mid-latitude air temperatures of some 2.5°C, and increasing aridity in the tropics (Fairbridge 1972). And there has been the same recent upswing to 1940 and same subsequent cooling to about 1970, followed by the suggestion of a reversal of the cooling trend in the past five years, possibly or probably a temporary reversal only.
I find it difficult to believe that either carbon dioxide in the atmosphere, water vapour, freon, or any other substance, produced by man’s efforts, is going to compete seriously with Nature in changing our climate. The literature on these matters is conflicting, each new paper claiming to contradict the one before it. Has any explosion so far rivalled, or surpassed in violence or in climatic effect, the Krakatoa volcanic eruption of 1883? On the subject of carbon dioxide production by the combustion of fossil fuels, there is a paper by Hutchinson (1948), which seems to have escaped the attention of the climatologists. It is established that the carbon dioxide content of the atmosphere has risen, perhaps from 290 to 320 parts per million within the past hundred years, an increase which is not enough, however – by a factor of two or three – to account for all the fossil fuel burned during that time; and it is clear that there are natural reservoirs for carbon dioxide, in changes in vegetation and probably also in the sea, which are capable of absorbing surpluses of it. Hutchinson (1948) puts the matter as follows:
The true interpretation . . . would appear to be a slight change in the distribution of stationary concentrations of CO2 passing through the system, rather than a static accumulation of the gas . . . There must be sinks as well as sources in the atmospheric circulation of the gas. If, as seems probable, the sinks are local areas of ocean surface, they have not yet been discovered on a scale commensurate with what is required. Meanwhile, it seems far more likely that the observed increment in the carbon dioxide of the air at low levels in both Europe and eastern North America is due to changes in the biological mechanisms of the cycle rather than to any increase in industrial output.
Moreover, the measured increase in carbon dioxide in the atmosphere, according to the most recent computations, would not be enough to have any measurable climatic effect. Rasool and Schneider (1971) conclude that an increase in the carbon dioxide content of eight times the present level would produce an increase in surface temperature of less than 2°C, and that if the concentration were to increase from the present level of 320 parts per million to about 400 by the year 2000, the predicted increase in surface global temperature would be about 0.1°C. … Johnsen et al. (1969), on the basis of ice-cap measurements in Greenland, expect the present cooling trend to continue for one or two decades with subsequent warming reaching a maximum in about 40 or 50 years. Winstanley (1973) does not expect a change in the cooling trend for another 60 years.
—-
174. Kondratiev and Niilisk, 1960
On the question of carbon dioxide heat radiation in the atmosphere
The dependence of atmospheric heat radiation on CO2 and H2O contents and also on temperature vertical distribution is investigated with the help of the radiation chart. It is shown that the heat radiation of the atmosphere almost doesn’t depend on variations of carbon dioxide content in the atmosphere.
—–
175. Möller, 1963
The numerical value of a temperature change under the influence of a CO2 change as calculated by Plass is valid only for a dry atmosphere. Overlapping of the absorption bands of CO2 and H2O in the range around 15 μ essentially diminishes the temperature changes. New calculations give ΔT [temperature] = + 1.5° when the CO2 content increases from 300 to 600 ppm. Cloudiness diminishes the radiation effects but not the temperature changes because under cloudy skies larger temperature changes are needed in order to compensate for an equal change in the downward long-wave radiation. The increase in the water vapor content of the atmosphere with rising temperature causes a self-amplification effect which results in almost arbitrary temperature changes, e.g. for constant relative humidity ΔT = +10° in the above mentioned case. It is shown, however, that the changed radiation conditions are not necessarily compensated for by a temperature change. The effect of an increase in CO2 from 300 to 330 ppm can be compensated for completely by a change in the water vapor content of 3 per cent or by a change in the cloudiness of 1 per cent of its value without the occurrence of temperature changes at all. Thus the theory that climatic variations are affected by variations in the CO2 content becomes very questionable.
—–
It is found that doubling the carbon dioxide concentration increases the temperature near the ground by approximately one-half of one degree [0.5°C] if clouds are absent. A sevenfold [700%] increase of the present normal carbon dioxide concentration increases the temperature near the ground by approximately one degree. Temperature profiles resulting from presently observed carbon dioxide concentration and convective cloudiness of 50% or less are compared with those resulting from doubled carbon dioxide concentrations and the same amounts of cloud cover. Again, it is found that a doubling [100% increase] of carbon dioxide increases the temperature in the lower boundary layer by about one-half of one degree.
—–
180. Oliver, 1976
A period of several decades existed (~1915-1945) in which volcanic activity was unusually light and, as mentioned earlier, the temperatures were higher than the preceding [1880s to 1910s] or, in fact, the subsequent (current) [1960s-1970s] period. … Numerous possible causes of climate change have been discussed in the literature, including both anthropogenic and natural factors. Two principal anthropogenic sources are often considered: changes in atmospheric carbon dioxide and changes in tropospheric dust. … The possible effects due to changes in CO2 are perhaps most readily subject to analysis, for good data do exist on atmospheric CO2 and its increase over recent decades. Thus, according to Reitan (1971), based on calculations by Manabe and Wetherald (1967), the increase in CO2 between the 1880’s and the 1960’s could have caused a mean temperature increase of 0.3°C. Unfortunately, however, such computations are based on assumptions of constant cloudiness, and possible changes in cloud cover are exceedingly important. Manabe and Wetherland (1967) show, for example, that a 1% increase in low cloudiness would cause an 0.8°C decrease in mean temperature; thus, a 0.3° warming could be compensated by a change of about 0.4% in low cloudiness. A change of 0.4% in low cloudiness would obviously be exceedingly difficult to detect. … Mitchell (1975) concluded that neither tropospheric particulates [anthropogenic pollution] nor atmospheric CO2, in concert or separately, could have accounted for the major part of the observed temperature changes of the past century.
—–
181. Idso, 1980
The mean global increase in thermal radiation received at the surface of the earth as a consequence of a doubling of the atmospheric carbon dioxide content is calculated to be 2.28 watts per square meter. Multiplying this forcing function by the atmosphere’s surface air temperature response function, which has recently been determined by three independent experimental analyses to have a mean global value of 0.113 K per watt per square meter, yields a value of ≤ 0.26 K for the resultant change in the mean global surface air temperature. This result is about one order of magnitude less than those obtained from most theoretical numerical models, but it is virtually identical to the result of a fourth experimental approach to the problem described by Newell and Dopplick. There thus appears to be a major discrepancy between current theory and experiment relative to the effects of carbon dioxide on climate. Until this discrepancy is resolved, we should not be too quick to limit our options in the selection of future energy alternatives.
—–
182. Lorenz, 1970
Climatic Change as a Mathematical Problem
If, instead, we look into the 21st century, and make an optimistic forecast concerning the type of computer which will be available, we find that yet another approach to climatic change may become feasible. We may construct a super-model, including as variables every feature of the atmosphere and its environment which can conceivably have varied over the ice ages. Included will be such features as the detailed composition of the atmosphere and the oceans, the extent of continental glaciation, and the distribution of vegetation. We can probably omit human activity on the grounds that human tampering was not responsible for past climate changes. When we integrate the equations, if they are correct, we shall necessarily obtain changes in climate, including the great ice ages.
—–
183. Lindzen, 1989
Judging from much of what one sees in the media, there is little doubt about the coming global warming. The question is simply whether it will be unprecendentedly bad (1.5° warming) or worse (5°C warming). To quote from Stephen Schneider at a recent conference hosted by Robert Redford at Sundance, Utah, ‘there will be no winners.’ The Democratic National Committee has made dealing with the warming an issue on a par with dealing with the drug problem. Still, if one visits the Center for Meteorology and Physical Meteorology at M.I.T. (where I happen to teach) one encounters a general attitude of skepticism. There is a common feeling at M.I.T. and elsewhere, that this question has become enmeshed in hysteria. Such environmental scares are not unheard of. In recent years we have confronted the destruction of the ozone layer by supersonic transports, the coming ice age (popular in the early 70s, and the subject of Stephen Schneider’s book, The Genesis Strategy), and nuclear winter. All these scares have withered for good reason. It is only fair to add that none of these earlier scares has been put forth with the vehemence associated with ‘global warming.’ In this paper, I propose to go over the scientific bases for our present concerns. I hope to show that both the data and our scientific understanding do not support the present level of concern.
—–
184. Gates et al., 1981
Preliminary analysis of experiments on the climatic effects of increased CO2 with an atmospheric general circulation model and a climatological ocean
Preliminary results from numerical experiments designed to show the seasonal and geographical distribution of the climatic changes resulting from increased atmospheric CO2 concentration are presented. These simulations were made for both doubled and quadrupled CO2 levels with an improved version of the two-level OSU atmospheric GCM. In these experiments and in a control run with normal CO2, the solar radiation incident at the top of the model atmosphere and the sea-surface temperature and sea ice were given prescribed seasonal climatological variations. In January the globally averaged tropospheric temperature is increased with respect to the control mean by 0.30°C (0.48°C) for doubled (quadrupled) CO2, which may be compared with an interannual January temperature variability of 0.15°C in the control (as measured by the root-mean-square of January monthly averages in a 3-year control integration). In July, the globally averaged tropospheric temperature rises by 0.33°C (0.60°C) for doubled (quadrupled) CO2, with an average warming over land surfaces of 0.71°C (1.04°C); these values may be compared with a root-mean-square interannual July temperature variability of only 0.03°C in the control. These results are clearly due to the model’s differing thermal response over ocean and continent in the summer and winter seasons.
—–
185. Libby, 1970
FIFTY ENVIRONMENTAL PROBLEMS OF TIMELY IMPORTANCE
WEATHER MODIFICATION BY CHANGING CO2 CONTENT OF ATMOSPHERE [p. 48]
Item: American Scientist, January-February 1970, p. 18, “Though dire effects on climate of an increase in CO2 have been predicted, they are far from being established. The cycle is not really understood; carbon dioxide may well prove to be the least objectionable or the only beneficial addition to the atmosphere from industrial sources … Atmospheric CO2 is the source of almost all the carbon of organic compounds in our bodies. It is likely that CO2 from industrial sources has actually increased the productivity of terrestrial vegetation since 1900, and that as fossil fuels are exhausted and industry goes to atomic power there will be a decrease, possibly ten percent, in agricultural yields….”
—–
186. Schuurmans, 1983
For detection purposes we need to know the so-called transient response of climate to a given increase of the atmospheric CO2 concentration (observed or predicted). Transient response patterns, however, are generally much less well known than equilibrium responses. The problems encountered in specifying the transient CO2-induced climate signal are discussed in detail by Michael et al. in his book. From his review we may conclude that there is some general agreement amongst different modellers that the transient response of global mean temperature to increased CO2 concentration of the atmosphere at present amounts to less than 0.5 K (estimates of [temperature response] now varying between 0.2 and 0.4 K).
—–
187. Rasool and Schneider, 1971
It is found that, although the addition of carbon dioxide in the atmosphere does increase the surface temperature, the rate of temperature increase diminishes with increasing carbon dioxide in the atmosphere.
It is found that even an increase by a factor of 8 in the amount of CO2, which is highly unlikely in the next several thousand years, will produce an increase in the surface temperature of less than 2°K. However, the effect on surface temperature of an increase in the aerosol content of the atmosphere is found to be quite significant. An increase by a factor of 4 in the equilibrium dust concentration in the global atmosphere, which cannot be ruled out as a possibility within the next century, could decrease the mean surface temperature by as much as 3.5°K. If sustained over a period of several years, such a temperature decrease could be sufficient to trigger an ice age!
—–
188. Landsberg, 1970
Therefore it appears that on the local scale man-made influences on climate are substantial but that on the global scale natural forces still prevail. Obviously this should not lead to complacency. The potential for anthropogenic changes of climate on a larger and even a global scale is real. At this stage activation of an adequate worldwide monitoring system to permit early assessment of these changes is urgent. This statement applies particularly to the surveillance of atmospheric composition and radiation balance at sites remote from concentrations of population, which is now entirely inadequate. In my opinion, man-made aerosols, because of their optical properties and possible influences on cloud and precipitation processes, constitute a more acute problem than CO2. Many of their effects are promptly reversible; hence, one should strive for elimination at the source. Over longer intervals, energy added to the atmosphere by heat rejection and CO2 absorption remain matters of concern.
—–
Introduction: There has been in recent years a growing concern over possible inadvertent climate alteration by man’s activity (SMI, 1971; Matthews et al., 1971). As a result, there has been considerable effort devoted to developing predictive global climatic models (Budyko, 1969, 1972; Sellers, 1969, 1973), or to otherwise assessing the climatic effect of atmospheric pollutants (see, e.g., Manabe, 1971; Lamb, 1970; Rasool and Schneider, 1971; Bryson, 1972; Mitchell, 1970). This effort has been useful in providing tentative predictions and has certainly stimulated more interest and even controversy. However, the climatic models have relied heavily on simplified empirical parameterizations and, in general, none of the assessments have been very inclusive of many of the earth-atmosphere dynamic feedback mechanisms. For instance, one of the most important factors potentially affecting the radiation balance of the earth-atmosphere system is clouds because of their high reflectivity in the visible spectrum and absorption-emission in the infrared.
In Fig. 6 we present the results of altering atmospheric aerosol from the assumed present day-day value of about 0.1 optical depth units. … A doubling produces a 1K decrease in mean annual global surface temperature, whereas a fourfold increase produces somewhat more than a 3K decrease. … As may be seen in Fig. 7, a doubling of CO2 increase the mean annual global surface temperature according to our dynamical model by about 0.7K, but a sixfold increase only increases the temerature 1.7K. The nonlinearity is due to saturation of the 15 µm band.
—–
190. Washington, 1972
Conclusions: Our basic conclusion is that with the expected levels of man’s thermal energy production, there is a relatively small modification of the model earth-atmosphere heat balance. The differences in numerical experiments with and without thermal energy input produce changes of the same order as the natural fluctuations of the model. These experiments have the serious shortcoming of assuming fixed ocean surface temperatures and thus should be repeated with a coupled atmosphere-ocean model.
We have not precluded by this study other possible mechanisms by which man may be changing the climate. For example, Rasool and Schneider (1971) have recently suggested that an increase in atmospheric aerosol content by a factor of 4 may lead to a 3.5C decrease in the surface temperature. They attribute this effect to increased backscattering of solar radiation caused by aerosols. Because the solar flux is such a large part of the surface energy budget, this sort of effect could easily mask the small effect of thermal energy. Furthermore, we know from geological records that natural fluctuations in climate occur, causing temperatures over large areas of the globe to vary by several degrees. Before we can predict the small effect of man’s activities on climate, we must be able to understand these natural fluctuations.
—–
191. Ludwig et al., 1973
There have been a number of theoretical models developed in which the effect of the CO2 increase is linked with a mean global temperature increase. In general, these models have not been too successful because the end results were unreasonably sensitive to minor changes in some critical assumptions. For example, Manabe and Wetherald (ref. 7) calculate that the estimated increase in CO2 concentration by the year 2000 would raise the average atmospheric temperature by 0.5° C. Whether this temperature increase would really occur is open to question, since it could be counterbalanced by a 1% change in total average cloudiness (ref. 8). In addition, the apparent increase of global aerosol concentration (ref. 9) could have a similar counterbalancing effect.
—–
192. Singer, 1976
The distribution of the radiating gases is largely responsible for the layering of the Earth’s atmosphere. The troposphere extends from sea level up to approximately 12 km at which point the temperature has dropped to approximately -60°C. Water vapor is about 10 times more important than carbon dioxide, both for radiative heating by absorbing solar radiation and for radiative cooling. In the stratosphere, however, radiative heating by the absorption of solar radiation by ozone is dominant.
—–
INTERACTIONS OF ATMOSPHERIC CARBON DIOXIDE, DIFFUSE LIGHT, PLANT PRODUCTIVITY AND CLIMATE PROCESSES MODEL PREDICTIONS
Increased CO2 levels cause an increase in tropospheric and surface temperature due to absorption of long-wave radiation in bands centered around 4 µm and 15 µm . Assuming fixed relative humidity, the temperature effect of a 10% increase in CO2 concentration would cause a warming of about 0.3°C. However, normal variations in the present cloud and synoptic weather patterns could easily override the quantitative effects of CO2 on the radiation budget. … [N]one of the present models simulates the interaction of clouds and aerosol layers and almost none considers thermal radiation; thus at best they can only be considered quite speculative. The climatic effect of increased aerosol concentration is obviously still controversial, and the data on aerosols very limited.
—–
194. Gebhart, 1967
Hitherto absorption of solar radiation has completely been disregarded when investigating how a CO2 increase of the atmosphere modifies the earth’s climate. It can be shown that shortwave and longwave influence of a higher CO2 concentration counteract each other. The temperature change at the earth’s surface is ΔT=+1.2°C when the present concentration is doubled.
—–
195. Newell and Dopplick, 1970
The Effect of Changing CO2 Concentration on Radiative Heating Rates
The greenhouse theory as usually discussed puts such a “heating” interpretation on the CO2 changes even though the actual effect of a CO2 increase is to diminish the cooling rate. It is well to stress that the conditions here are such that all other items are unchanged. The term greenhouse is of dubious applicability because the greenhouse glass leads to higher temperatures by reducing turbulent eddy heat losses, rather than by a radiative influence (Kondratyev, 1965). To place the CO2 contribution to temperature change in perspective it is compared with other radiative components at two levels in Table 2. Clear skies are assumed. Carbon dioxide is secondary to water vapor in the troposphere as noted by others (e.g., Rodgers and Walshaw, 1966) and dominant in the lower stratosphere under the conditions assumed here. When looking for a potential influence of global pollution on the tropospheric temperature it would be therefore wise to pay careful attention to the water cycle and its possible modification, particularly as it enters also through the effect of latent heat.
—–
196. Schell, 1971
Classic meteorology can also serve well for testing other theories of climate change, such as that involving CO2, which calls for an essentially equal rise or fall in temperature everywhere, as opposed to the actual small rise or fall observed in low latitudes, and the much larger rise or fall in higher latitudes. … We may also call attention to the limitations imposed by mathematical models as expressed by Lorenz: “Such a solution may give us little insight as to why the changes took place”; and: “As to what features did produce climate changes we still have this privilege of arguing.”
—–
The heating due to the absorption of solar radiation by carbon dioxide is still small compared with the effects of other processes. However around the tropopause, where the contributions of various radiative processes are at a minimum, it is not always negligible.
Conclusions: (6) According to our computation of radiative heat budget, in the stratosphere, net heating effects include the absorption of solar radiation by water vapor, carbon dioxide (not negligible around the tropopause), and ozone and the atmospheric radiation due to the 9.6 μ band of ozone; net cooling effects include the long wave radiation by water vapor and carbon dioxide. Summing all these contributions we obtain a very weak heating in low latitudes and a rather strong cooling in the lower stratosphere at high latitudes. This cooling is too large to be considered as the product of uncertainties involved in the computation and must be compensated for by heat processes other than radiation. (7) [T]he study of various processes contributing to the heat of the layer around the 18-krn. level, where the observed temperature sharply increases with latitude, was performed. The long wave radiation by water vapor has a tendency to maintain the existing latitudinal gradient. The effects of ozone have the same tendency in low latitudes but not in high latitudes. The long wave radiation by carbon dioxide has a strong tendency to destroy the existing latitudinal increase of the temperature. The net effect of these radiative processes could barely maintain the stratospheric temperature approximately constant with latitude and hardly explains the sharp latitudinal temperature increase observed in the stratosphere.
—–
198. Webster, 1984
The pervasive opinion on the relationship between the state of the climate and the increasing concentration of CO2 is that a general global warming will occur with social, economical and environmental corollaries that may be adverse. However, there exist a number of dissenting arguments that call for a much smaller increase in global temperature or even an induced global cooling. Furthermore, the positive biological effects of a greater atmospheric CO2 loading are emphasized.
—–
199. Jones et al., 1981
There is evidence that the long-term cooling that characterized the 1940’s, 1950’s and 1960’s has ended. Warming began in the mid to late 1960’s in winter and spring, in the mid 1970’s in autumn and later in summer. Year-to-year variability has been particularly pronounced during the 1970’s. For example, 1972 was the coldest winter since 1918, yet 1980 and 1981 were among the five warmest winters during the last 100 years. There is, as yet, no statistical reason to associate the recent warming with atmospheric CO2 increases.
—–
200. Paltridge, 1978
A recent report of the US National Academy of Sciences (1979) tends to discount the possibility that cloud-radiation feedback might reduce to negligible proportions the rise in global surface temperature with increasing atmospheric CO2. The opinion is legitimate enough in light of the caveats spelled out in the Academy report. It may even turn out to be correct in the end. However, opinions of this sort have a habit of becoming accepted wisdom, and it is worth while emphasizing again that the supporting evidence is (as yet) very thin. It derives from one or two experiments with numerical models in which ‘clouds’ are generated by the model itself (Schneider et al., 1978, Manabe and Wetherland 1980). These experiments do not show much change in the amount of cloud with increasing CO2.
—–
201. Robock, 1979
Carbon dioxide produced by fossil fuel burning does not seem to have had a significant effect on climatic change as yet. With it the results are slightly better for the entire record and slightly worse for the most recent portion. This conclusion should be qualified because there may be compensating anthropogenic influences such as aerosols, and the model tends to underemphasize the CO2 effect as compared to more sophisticated radiation models which treat the stratosphere explicitly
—–
202. Lamb, 1961
The carbon dioxide changes obviously cannot account for various decades and longer periods of climatic cooling in historical and recent times
—–
203. Schneider, 1974
A doubling of world population by 2015 could have consequences for the global climate. Expected increases in atmospheric pollutants, thermal pollution and modifications to the earth’s surface are human activities that have potential to influence climate inadvertently. In addition, purposeful climate modification schemes (such as creating artificial lakes or melting the Arctic Sea ice) may be proposed with increasing seriousness as world food shortages (induced by projected population growth and/or climatic fluctuation) become commonplace. Already there is drought induced hunger and starvation in parts of central Africa, and the prospect for a more widespread food crisis in the 1970s is ominous. Unfortunately, knowledge of climate theory is still too primitive to trace reliably climatic cause and effect links, and therefore it is argued that large-scale climate modification schemes appear irresponsible. In any case, international authorities must eventually be established to deal with potential world conflicts arising from future problems of food production and climate change-whether purposeful or inadvertent.
[A purposeful “climate modification scheme” to melt Arctic sea ice implies contemporary concern that global cooling was contributing to climate-induced world food shortages.]
—–
204. Flohn, 1963
The large retreat of the Arctic sea-ice during the first 40-50 years of this century—which recently has been stopped—suggests the possibility of an atmospheric circulation with one ice-free pole. In this case —which has been realized in iriterglacial epochs, perhaps also in the post-glacial warm period—the present asymmetry between northern and southern hemisphere ought to be even stronger.
According to recent systematic investigations, the CO2 content of the atmosphere has increased from about 290 ppm (= 106 volume units) at the end of last century to about 330 ppm in the last decade. From G-14 investigations from living wood H. E. Suess has concluded that the dilution of atmospheric carbon dioxide by C-14-free CO2 produced by the burning of fossil fuels amounts only to 2-4 per cent, much smaller than the above-mentioned 12 per cent (Revelle and Suess, 1957). It can only partially explain the recent increase. … [T]here are serious objections against any over-emphasis of the CO2 theory. First: it deals only with one single term of the global beat balance. The observed constancy of temperature south of 50° S. cannot be explained on this basis, since the CO2 content of Antarctic air is not significantly lower than in other zones, as has been suggested. The occurrence of apparently world-wide temperature variations before the start of the industrial area and the rapid increase of population—e.g., cooling from the sixteenth Century to the Little Ice Age (1680-1740) and warming during the period 1770-1810 (Flohn, 1957)—is followed recently by a small but general tendency to cooling in the last decade, accompanied by the most rapid increase in industrial combustion. Such examples seem to demonstrate that the CO2 effect—-even as supported by a similar effect of artificial air pollution-—cannot be considered as the single (nor even as the main) cause of climatic variations, but certainly as an essential contributing factor.
—-
205. Sawyer, 1972
The output of human industry is still very much less than the total mass of the atmosphere and man-made energy is still small compared with the energy of meteorological systems. The total industrial output of heat each day is, for example, considerably less than 0.1% of the total kinetic energy of the atmosphere, which itself is destroyed by friction and replaced naturally within a few days. Another useful comparison is that of the total man-made heat output in Britain with natural processes over the same area. Even over this area of relatively intense human activity man’s efforts are relatively quite small – man-made heat is less than 1% of the energy received from the Sun. It also must be remembered that the mass of the atmosphere is enormous compared with the products of human activity. The total mass of the atmosphere is more than 500 times the mass of the known coal reserves, for example, and human activities will not change its chief constituents.
An atmosphere at a higher temperature can hold more water vapour, and the additional water vapour produces a similar blanketing effect to that produced by carbon dioxide. Manabe and Wetherald calculate that an increase of 100% in the content of carbon dioxide would increase the world temperature by 1.3°C if the water content of the atmosphere remained constant, but by 2.4°C if the water vapour increased to maintain the same relative humidity. … The increased water vapour would probably lead to the formation of more clouds because evaporation increases much faster than temperature, and substantially more condensed water would be available. The additional cloud would reflect incoming solar radiation and tend to produce a lowering of temperature – a negative feedback arising from water vapor. Other calculations show that world temperature is likely to be remarkably sensitive to the average global cloudiness. A change of only 1% in the average cloudiness would produce a change of temperature of almost 1°C.
Even global mean temperatures have varied by 0.6°C from a minimum around 1880 to the last maximum around 1940. Against this background a change of 0.6°C by the end of the century [2000] will be not be easy to distinguish from natural fluctuations and certainly is not a cause for alarm. Even a doubling of the amount of carbon dioxide in the atmosphere, which would probably require the burning of a large part of the known fuel reserves, would appear to result in a rise of temperature little above that experienced in the climatic optimum which followed the last ice age.
CONTINUE TO PART 3 HERE


Recent Comments