Solar Influence On Climate
This result implies that the CMIP5 models are missing important climatic mechanisms responsible for a large millennial oscillation that has been found throughout the Holocene and has been linked to a millennial solar oscillation [2,4,17,72,90,105]. The argument can be, therefore, extended to other decadal, multidecadal, and secular solar oscillations [41,72]. Essentially, the CMIP5 models predict a nearly undetectable solar effect on the climate. This claim, however, is severely contradicted by paleoclimatic evidences of a strong solar climatic influence at multiple time scales [2,3,72,87,90]. By empirically modeling a millennial oscillation, whose maxima in 1077 and 2060 have been determined from astronomical considerations [72], it was found that about half of the warming observed since 1850 had to be naturally induced by it together with other identified oscillations. The most plausible conclusion is that the real climate sensitivity to radiative forcing is about half— that is about 1.5 ◦C for CO2 doubling (between 1 and 2.3 ◦C)—than what predicted by the CMIP5 GCMs [5,14,35,61,63,108], and that additional climatic mechanisms responsible for large natural oscillations at multiple time scales are missing in the models.
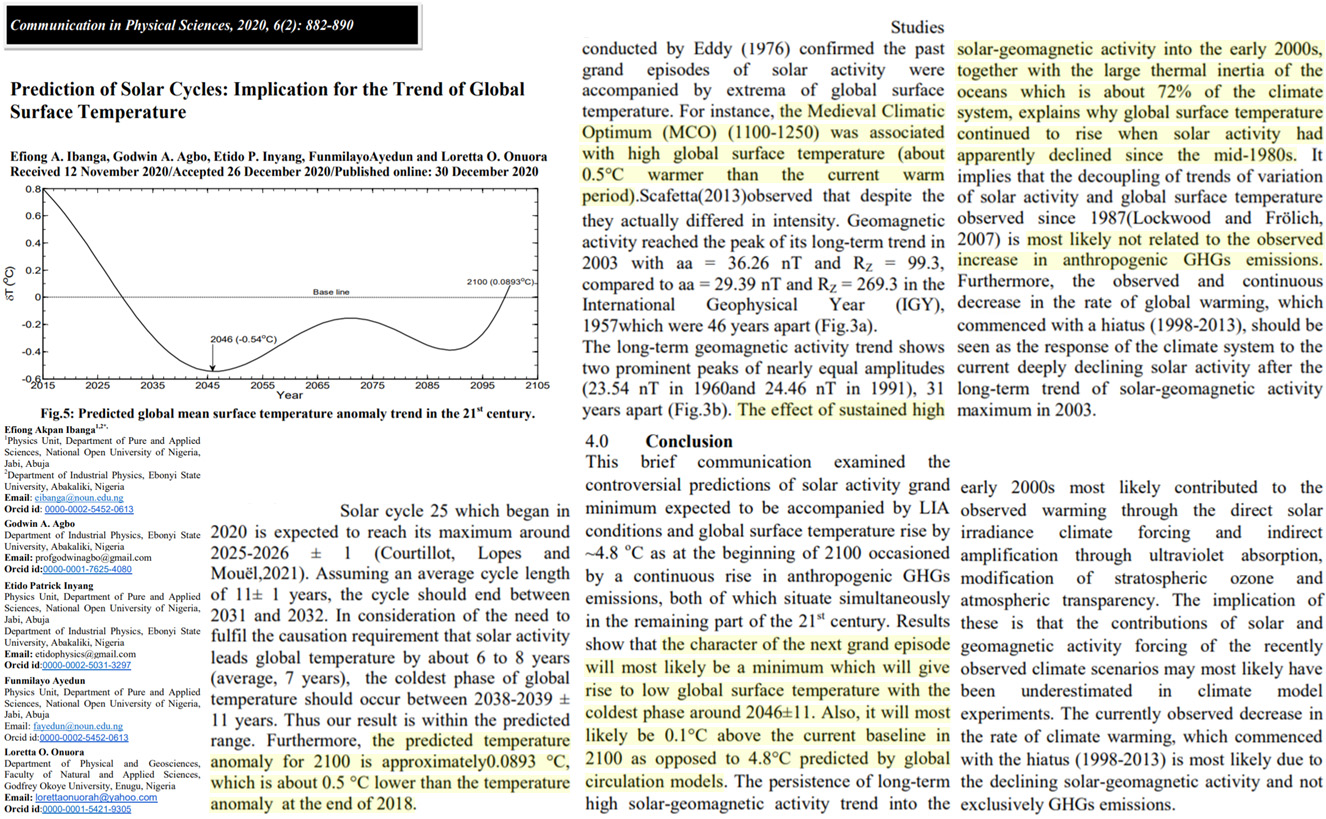
For instance, the Medieval Climatic Optimum (MCO) (1100-1250) was with high global surface temperature (about 0.5°C warmer than the current warm period). … The effect of sustained high solar-geomagnetic activity into the early 2000s, together with the large thermal inertia of the oceans which is about 72% of the climate system, explains why global surface temperature continued to rise when solar activity had apparently declined since the mid-1980s. It implies that the decoupling of trends of variation of solar activity and global surface temperature observed since 1987(Lockwood and Frölich, 2007) is most likely not related to the observed increase in anthropogenic GHGs emissions. Furthermore, the observed and continuous decrease in the rate of global warming, which commenced with a hiatus (1998-2013), should be seen as the response of the climate system to current deeply declining solar activity after the long-term trend of solar-geomagnetic activity maximum in 2003. … Solar cycle 25 which began in 2020 is expected to reach its maximum around 2025-2026 ± 1 (Courtillot, Lopes and Mouël,2021). Assuming an average cycle length of 11± 1 years, the cycle should end between 2031 and 2032. In consideration of the need to fulfil the causation requirement that solar activity leads global temperature by about 6 to 8 years (average, 7 years), the coldest phase of global temperature should occur between 2038-2039 ±11 years. Thus our result is within the predicted range. Furthermore, the predicted temperature anomaly for 2100 is approximately0.0893 °C, which is about 0.5 °C lower than the temperature anomaly at the end of 2018.
Effects of upcoming grand solar minimum (2020–2053) … Although in the next 33 years the Sun is entering a period of the reduced solar activity, the modern grand solar minimum, which can be called a ‘mini ice age’, similar to Maunder Minimum. The GSMs are caused by significantly reduced solar magnetic field imposed by the disruptive interference of two magnetic waves generated by the double dynamo in the solar interior [10]. The first modern GSM1 occurs in 2020–2053 [10, 60] and the second modern GSM2 will happen in 2370–2415 [10, 60]. Because the solar irradiance and terrestrial temperature already increased since the MM owing to the SIM effects discussed in section 5.1, the terrestrial temperature during the first modern GSM1 is expected to drop by about 1.0°C to become just (1.5–1.0=) 0.5∘ C higher than that in 1700. The temperature decrease during the second modern GSM (2375–2415) can be estimated calculated as follows. The current temperature increase in 2020 is by 1.5∘C, which should increase by 2375 by another 1.5∘ C (=3 x 0.5C [35]) giving the total increase since 1700 by 3.0∘ C. The temperature decrease caused by a reduction of solar magnetic field and solar activity during the GSM2 would lead to a reduction of temperature by about 1.0∘ C. This will produce the total temperature during the GSM2 of (3.0–1.0=) 2.0∘C higher than in 1700. After each of the modern GSMs, solar activity is expected to return to normal 11 year cycles as shown in Figure 1 [10].
We demonstrate that our pollen concentration record, the oxygen isotope δ18O record from the Greenland ice core project NGRIP (NorthGRIP), the dust-fall contributions in Lake Qinghai, China, grain size in the Gulang and Jingyuan loess deposits, China, and the composite oxygen isotope δ18O record from the Alpine cave system 7H reveal cooler to warmer climate fluctuations between ∼ 20.6 and 26 ka. Such fluctuations correspond to the ∼1000-yr, 500-600-yr and 210-250-yr cycles possibly linked to the solar activity variations and recognized in high resolution Holocene proxies all over the world. We further show that climate fluctuations in the LGM and Holocene are spectrally similar suggesting that linkages between climate proxies and solar activity at the centennial time scale in the Holocene can be extended to the LGM.
Solar activity (SA) has been hypothesized to be a trigger of earthquakes, although it is not as intuitively associated as other potential triggers such as tidal stress, rainfall, and the building of artificial water reservoirs. Here, we investigate the relation between SA and global earthquake numbers (GEN) by using a deep learning method to test the hypothesis. We use the daily data of GEN and SA (1996/01/01-2019/12/31) to construct a temporal convolution network (TCN). From the computational results, we confirm that the TCN captures the relation between SA and earthquakes with magnitudes from 4.0 to 4.9. We also find that the TCN achieves better fitting and prediction performance compared with previous work. … The 11-year solar cycle contributes to events such as sunspots, coronal mass ejection, and solar wind. The mechanism of the sun-earth magnetosphere connection is a mystery in relation to earthquakes [1]. Several studies have proposed that solar activity (SA) might be linked to earthquakes [2] [3] [4]. Statistical methods are usually used to prove this hypothesis. Reference [5] suggests a correlation between SA and large earthquakes worldwide, and [6] investigates the correlation between long-range clustering of global seismicity and SA. Sunspot number is also considered to be an SA variable for predicting earthquakes [7]. Meanwhile, some mechanisms have been considered to improve the correlation between the SA and the earthquakes. For example, induced current causes an increase in fault stress through piezoelectricity [8], and the eddy electric currents in faults reduce the shear strength [9].
It is widely accepted to believe that humanity is mainly responsible for the worldwide temperature growth during the period of instrumental meteorological observations. This paper aims to demonstrate that it is not so simple. Using a wavelet analysis on the example of the time series of the global mean near-surface air temperature created at the American National Climate Data Center (NCDC), some complex structures of inter-annual to multidecadal global mean temperature variations were discovered. The origin of which seems to be better attributable to the Chandler wobble in the Earth’s Pole motion, the Luni-Solar nutation, and the solar activity cycles. … It has been confirmed that the Chandler wobble in the Earth’s Pole motion, the Luni-Solar nutation, and the solar activity cycles affect the global climate system in the timescales of years and decades. It has been found for the first time that responses of the climate system to these external forces are internally ordered, and so they can be seen in the real meteorological observations as a whole structure such as a musical polyphony. It has been found that the mechanism of the influence of the solar activity cycle consists of frequency modulation. It explains why this influence is difficult to recognize in real meteorological observations. … Finally, the authors believe that the present-day comprehensive climatic models are incapable of reproducing structures of the decadal-centennial variations of the real global temperature.
High-resolution marine data and transient simulations support orbital forcing of ENSO amplitude since the mid-Holocene … Current knowledge of Holocene ENSO variability derived from paleoclimate reconstructions does not separate the role of insolation forcing from internal climate variability. Using an updated synthesis of coral and bivalve monthly resolved records, we build composite records of seasonality and interannual variability in four regions of the tropical Pacific: Eastern Pacific (EP), Central Pacific (CP), Western Pacific (WP) and South West Pacific (SWP). An analysis of the uncertainties due to the sampling of chaotic multidecadal to centennial variability by short records allows for an objective comparison with transient simulations (mid-Holocene to present) performed using four different Earth System models. Sea surface temperature and pseudo-δ18O are used in model-data comparisons to assess the potential influence of hydroclimate change on records. We confirm the significance of the Holocene ENSO minimum (HEM) 3-6ka compared to low frequency unforced modulation of ENSO, with a reduction of ENSO variance of ∼50 % in EP and ∼80 % in CP. The approach suggests that the increasing trend of ENSO since 6ka can be attributed to insolation, while models underestimate ENSO sensitivity to orbital forcing by a factor of 4.7 compared to data, even when accounting for the large multidecadal variability. Precession-induced change in seasonal temperature range is positively linked to ENSO variance in EP and to a lesser extent in other regions, in both models and observations. Our regional approach yields insights into the past spatial expression of ENSO across the tropical Pacific. In the SWP, today under the influence of the South Pacific Convergence Zone (SPCZ), interannual variability was increased by ∼200 % during the HEM, indicating that SPCZ variability is independent from ENSO on millennial time scales.
Cooper et al., 2021 (supplemental)
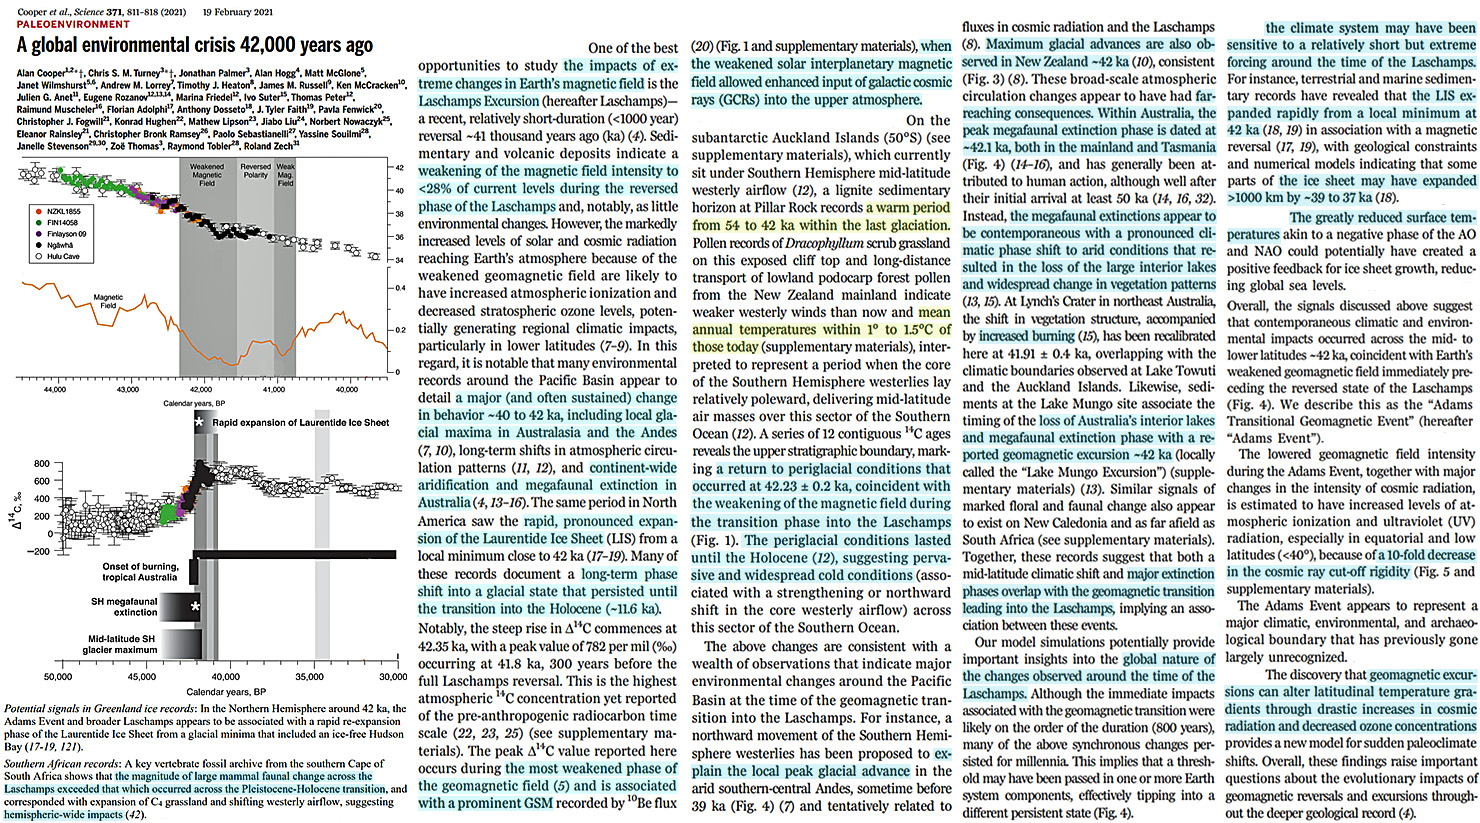
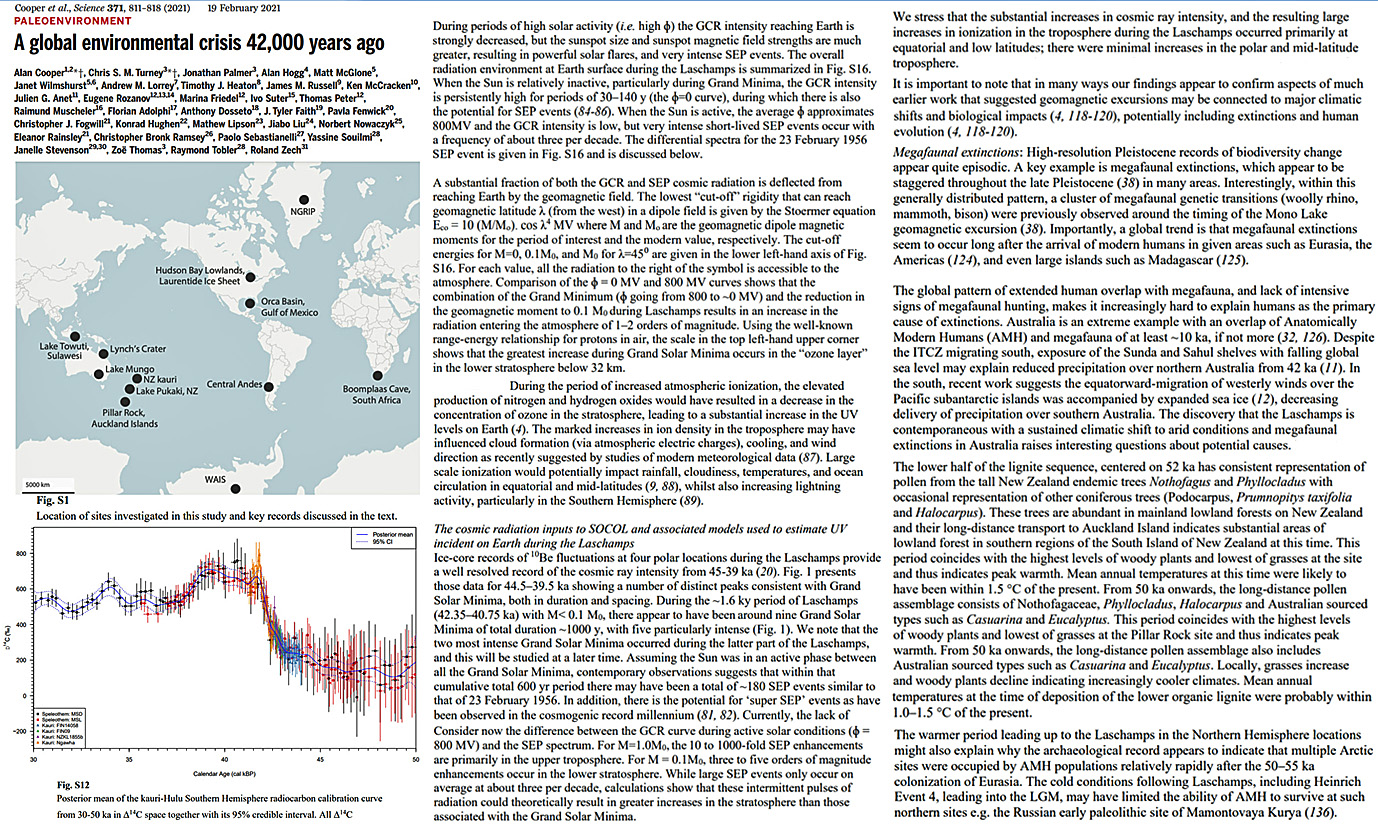
Geomagnetic field minima ~42 ka, in combination with Grand Solar Minima, caused substantial changes in atmospheric ozone concentration and circulation, driving synchronous global climate shifts that caused major environmental changes, extinction events, and transformations in the archaeological record … Geomagnetic excursions can alter latitudinal temperature gradients through drastic increases in cosmic radiation and decreased ozone concentrations … [A] warm period from 54 to 42 ka within the last glaciation [with] annual temperatures within 1°C to 1.5°C of those today … [A] weakening of the magnetic field intensity to <28% of current levels during the reversed phase of the Laschamps [led to] a return to periglacial conditions that occurred at 42.23 ±0.2 ka … 10-fold decrease in the cosmic ray cut-off rigidity … pervasive and widespread cold conditions … greatly reduced surface temperatures … the LIS [Laurentide Ice Sheet] expanded rapidly from a local minimum at 42 ka…the ice sheet may have expanded >1000 km by ~39 to ~37 ka … [T]he magnitude of large mammal faunal change across the Laschamps exceeded that which occurred across the Pleistocene-Holocene transition. … During periods of high solar activity (i.e. high ɸ) the GCR intensity reaching Earth is strongly decreased, but the sunspot size and sunspot magnetic field strengths are much greater, resulting in powerful solar flares, and very intense SEP events. The overall radiation environment at Earth surface during the Laschamps is summarized in Fig. S16. When the Sun is relatively inactive, particularly during Grand Minima, the GCR intensity is persistently high for periods of 30–140 y (the ɸ=0 curve), during which there is also the potential for SEP events (84-86). When the Sun is active, the average ɸ approximates 800MV and the GCR intensity is low, but very intense short-lived SEP events occur with a frequency of about three per decade.
High-resolution proxy-based paleoenvironmental records derived from peatlands provide important insights into climate changes over centennial to millennial timescales. … Cross-wavelet coherency analysis between the decomposed CCI components and past solar activity reconstructions suggests that variations of solar irradiation are most likely responsible for the cyclic characteristics at 500-year frequency. We propose a conceptual model to interpret how the sun regulates the monsoon climate via coupling with oceanic and atmospheric circulations. It seems that slight solar irradiation changes can be amplified by coupling with ENSO events, which result in a significant impact on the regional climate in the East Asian monsoon area.
The abrupt cooling event from 7460 to 7230 cal a BP may have been a global event, closely related to the decrease in solar activity and rapid SLR before 7460 cal a BP.
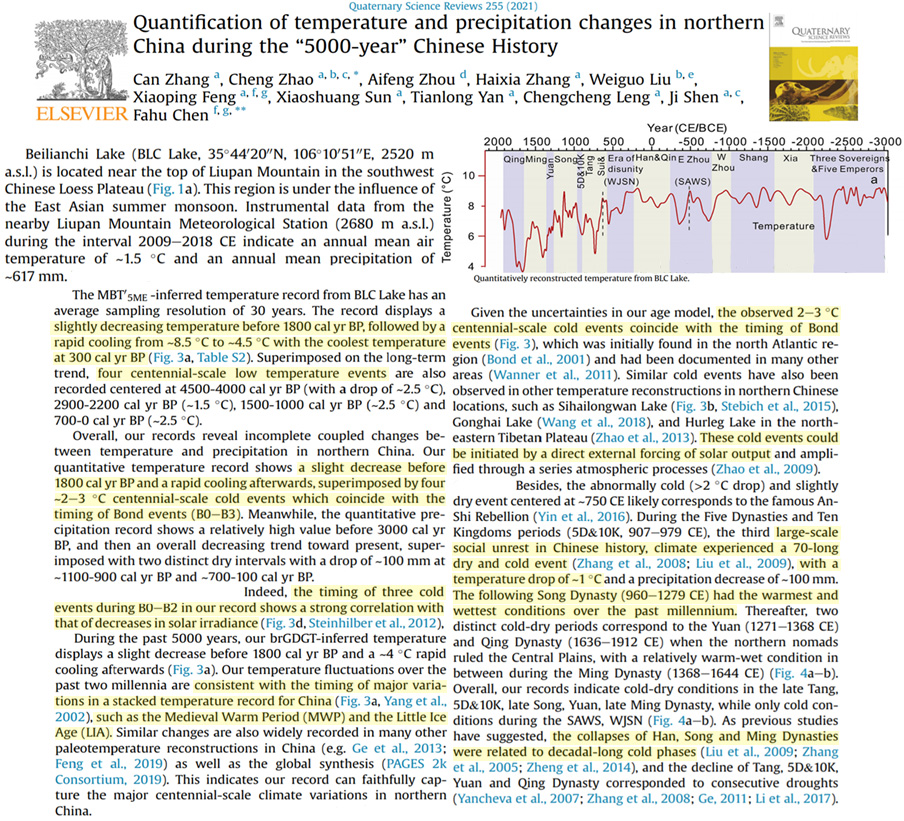
The record displays a slightly decreasing temperature before 1800 cal yr BP, followed by a rapid cooling from ~8.5°C to ~4.5°C with the coolest temperature at 300 cal yr BP … super imposed by four ~2-3°C centennial-scale cold events which coincide with the timing of Bond events … Indeed, the timing of three cold events during BO-B2 in our record shows a strong correlation with that of decreases in solar irradiance. … The following Song Dynasty (960-1279 CE) had the warmest and wettest conditions over the past millennium.
The 442-year BIE-position data set covers the coldest part of the LIA and the recovery from it after 1900. The LIA may be due to a combination of less solar irradiance because of decreasing obliquity of the Earth and a series of deep solar minima. The recovery from LIA in the Arctic after 1900, is partly due to increased solar activity and the precession of the Earth’s orbit providing an Early Spring Effect and increased spring LIG at BIE-latitudes. … [W]e have found increasing support for an even more direct forcing on the Arctic Climate by the solar wind, in particular CME-events which deposit large amounts of energy in the circumpolar atmospheres [97]. This is in particular evident during periods of low solar activity [93]. We suggest that the reduced magnetic shielding of the Earth during solar minima, leads to increased warming by coronal mass events. This can explain local Arctic warming even in cold periods as during the LIA and the present solar minimum. … SC24 which ended in December 2019 was the weakest cycle in 200 years. If cycle 25 also is weak, a new deep solar minimum may evolve in phase with the 210-year cycle with minimum in 2035 [38]. If solar activity is the only driving agent, the decreasing activity should make the Arctic cool, and BIE move south. However, the LOD and SN11 projections (Figure 26) indicate a deceleration and cooling start about 10 years later. … The transition of solar activities to a possibly deep and long minimum in the present century and the observation of cooling in the North Atlantic Ocean in the last decade, are signs of an approaching Arctic cooling and the BIE moving south in the middle of the century, with consequences for the ocean bio-production and climate in the North Atlantic region. However, due to a gradual early spring effect we don’t expect a strong cooling or LIA until late in this century or in the next.
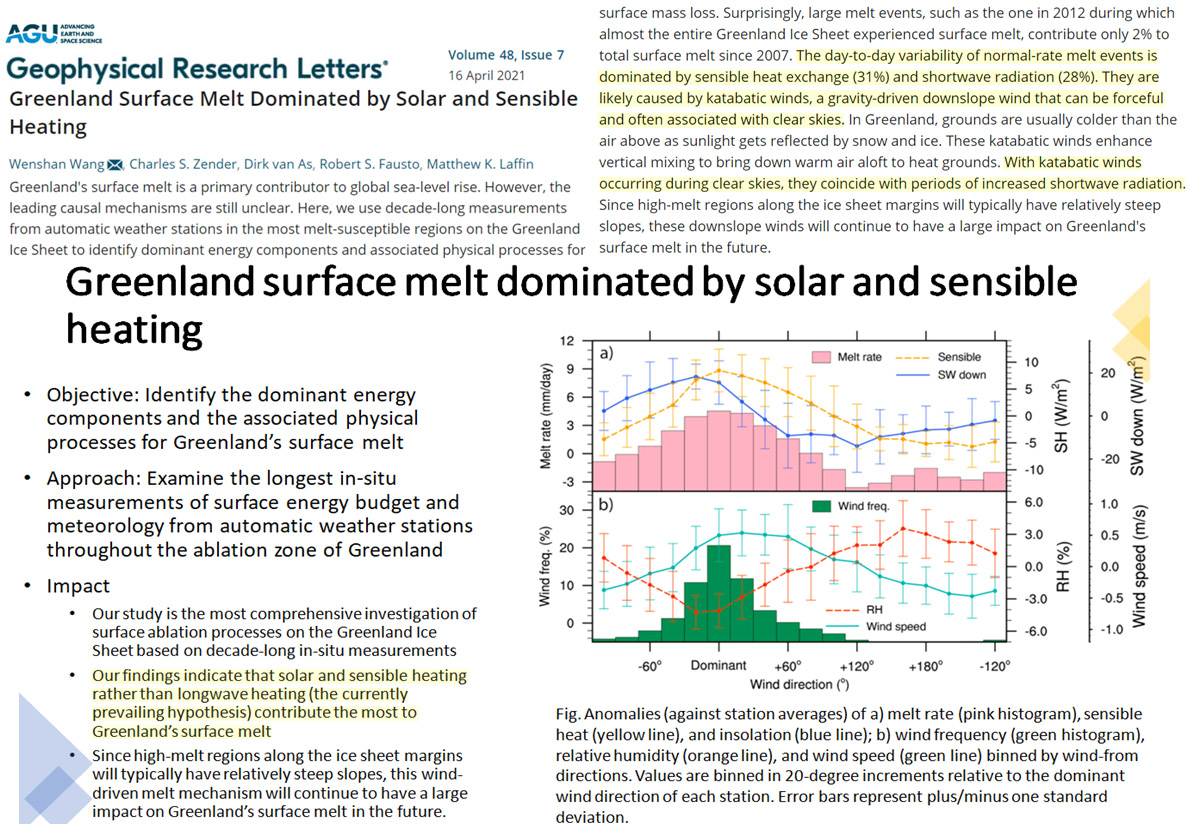
Greenland Surface Melt Dominated by Solar and Sensible Heating … Greenland’s surface melt is a primary contributor to global sea-level rise. However, the leading causal mechanisms are still unclear. Here, we use decade-long measurements from automatic weather stations in the most melt-susceptible regions on the Greenland Ice Sheet to identify dominant energy components and associated physical processes for surface mass loss. Surprisingly, large melt events, such as the one in 2012 during which almost the entire Greenland Ice Sheet experienced surface melt, contribute only 2% to total surface melt since 2007. The day-to-day variability of normal-rate melt events is dominated by sensible heat exchange (31%) and shortwave radiation (28%). They are likely caused by katabatic winds, a gravity-driven downslope wind that can be forceful and often associated with clear skies. In Greenland, grounds are usually colder than the air above as sunlight gets reflected by snow and ice. These katabatic winds enhance vertical mixing to bring down warm air aloft to heat grounds. With katabatic winds occurring during clear skies, they coincide with periods of increased shortwave radiation.
Applying statistical analyses to reanalysis products during the period 1900‐2018, this study finds the 11‐year solar cycle to have a significant correlation with sea surface temperature (SST) variations in the Northeastern Pacific. The solar influence is first manifested and amplified in the lower stratosphere, which then alters the strength of Hadley circulation in the troposphere. Lastly, the changes in the sinking branch of the Hadley circulation modulate surface heat fluxes to give rise to the SST footprint. The footprint has a structure similar to that of the Pacific meridional mode (PMM) that is known to be an important trigger of the central Pacific (CP) type of the El Niño‐Southern Oscillation (ENSO). The 11‐year solar cycle is thus shown to contribute to the slow modulation of the CP ENSO and, in particular, to be associated with more CP El Niño (La Niña) events during the active (inactive) phase of the cycle. … Sun spot activity is known to exhibit increase and decrease in a regular cycle that lasts about eleven years. This 11‐year solar cycle modulates the amount of solar radiation emitted by the Sun and received by the earth’s climate system. In this study, we show that this solar cycle can induce a ∼0.2°C sea surface temperature (SST) variation in the Northeastern Pacific. Statistical analyses are performed to show that the influence of the solar cycle is first amplified in the lower stratosphere and then descends to influence the strength of the Hadley circulation in the troposphere. The change in the Hadley circulation then results in the SST footprint in the Northeastern Pacific via surface heat fluxes. The SST variations can then extend into the tropical Pacific to modulate the occurrence frequencies of a particular type of El Niño and La Niña event in the central Pacific (CP). It is found that more CP El Niño events occur during the active phase of the solar cycle, while more CP La Niña events occur during the inactive phase.
The results indicate that the solar cycle was significantly involved in radial growth on all research plots. With regard to the evaluated precipitation totals, seasonal temperatures and the sunspot number, the latter was the most significant. Temperatures had a positive effect and precipitation had a negative effect on the radial increment of beech in central Europe, while in southern Italy, the effect of temperature and precipitation on the increment is reversed. In general, the limiting factor for beech growth is the lack of precipitation during the vegetation season. The number of negative pointer years (NPY) with an extremely low increment rose in relation to the decreasing southward latitude and the increasing influence of climate change over time, while a higher number of NPY was found in nutrient-richer habitats compared to nutrient-poorer ones. Precipitation and temperature were also reflected in the cyclical radial growth of European beech. The relationship between solar cycles and the tree ring increment was reversed in southern Italy and central Europe in the second and third (1970–2019) time periods. In the first time period (1900–1969), there was a positive relationship of the increment to solar cycles on all research plots. In the tree rings of European beech from southern Italy and central Europe, a relationship to the 11-year solar cycle has been documented.
The Sun provides the energy required to sustain life on Earth and drive our planet’s atmospheric circulation. However, establishing a solid physical connection between solar and tropospheric variability has posed a considerable challenge. The canon of solar variability is derived from the 400 years of observations that demonstrates the waxing and waning number of sunspots over an 11(-ish) year period. Recent research has demonstrated the significance of the underlying 22 years magnetic polarity cycle in establishing the shorter sunspot cycle. Integral to the manifestation of the latter is the spatiotemporal overlapping and migration of oppositely polarized magnetic bands. We demonstrate the impact of “terminators”—the end of Hale magnetic cycles—on the Sun’s radiative output and particulate shielding of our atmosphere through the rapid global reconfiguration of solar magnetism. Using direct observation and proxies of solar activity going back some six decades we can, with high statistical significance, demonstrate a correlation between the occurrence of terminators and the largest swings of Earth’s oceanic indices: the transition from El Niño to La Niña states of the central Pacific. This empirical relationship is a potential source of increased predictive skill for the understanding of El Niño climate variations, a high-stakes societal imperative given that El Niño impacts lives, property, and economic activity around the globe. … [I]t is entirely plausible that since changes in the (upper) atmosphere brought on by a strengthened Brewer-Dobson circulation, weakened Pacific Walker circulation, and less cloudy Western Pacific, enables the relatively constant terminator-driven changes to have sufficient “impact” to flip the system from El Niño to La Niña, independent of the actual mechanism that couples solar changes to clouds and ENSO.
[T]he Earth’s planetary temperature experienced some periods in recent history that were probably as warm as the present, such as the Medieval Warm Period (AD 800–AD 1300), and other periods colder than present, such as the Little Ice Age (AD 1300–AD 1850). This proves that natural forces can drive climate change of large amplitude even without a powerful human influence. Solar forcing is one important ingredient of these natural driving factors [4,5,6]. Early in 1801, Sir William Herschel found that the rainfall reduced when there were few sunspots on the Sun, and pointed out that solar variability might play a role in the change of Earth’s climate [7,8]. The Maunder Minimum of anomalously low and weak sunspot activity (AD 1645–AD 1715) coincided in time with the coldest period of the Little Ice Age in many places of the world [9,10], as well as with that of the historical Ming-Qing Little Ice Age in China [11,12]. … The mechanisms to explain the results obtained here involved two aspects: the solar impact mechanism and the response mechanism of the Earth’s climate. For the former, the atmospheric general circulation models (GCMs) showed that when solar variability was low the changes in stratospheric ozone would trigger downward-propagating effects, which led to cooling in the high northern latitude atmosphere, a southward shift of the northern subtropical jet, and a decrease in the Northern Hadley circulation [4,49].
ENSO, NAO, AMO, PDO Climate Influence
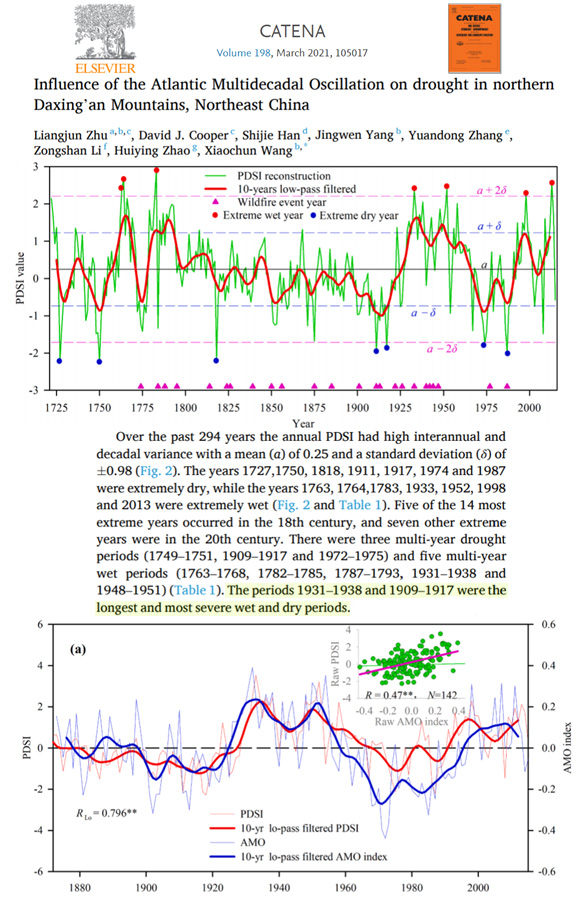
Our results provide new evidence for understanding the multiple spatial patterns of drought caused by the AMO. More studies in other territories with similar climate conditions are needed to test the linkage between drought and AMO. In addition, the AMO was significantly correlated with temperature rather than drought in many regions of China (Wang et al., 2013b; Li et al., 2015b), such as the Qinghai-Tibet Plateau in southwest China (Fang et al., 2019; Shi et al., 2017) and the Xiaoxing’an (Zhu et al., 2015) and Changbai mountain (Zhu et al., 2017) of northeast China. Climate dynamics analysis on a global scale will help reveal AMO’s driving mechanism on the local climate and outline the spatial boundaries of AMO’s impact on temperature and drought. … We found a significant El Nino-Southern Oscillation or weak Pacific decadal oscillation signal in our drought reconstruction. Spectral analysis, for significant high-frequency El Nino-Southern Oscillation cycles or weak 16-year Pacific decadal oscillation signal, and spatial correlations such as a strong correlation with the Pacific SSTs, revealed a possible linkage between the Pacific-related Oscillations and drought in the northern DM. Previous studies in central DM and east MP have confirmed that the Pacific oscillation is an important driving force of drought in northeast China (Lv, 2012; Zhu et al., 2018), just as it is in North America (Oglesby et al., 2012).
[W]e find that the downstream propagation of the freshwater anomaly across the SPNA is potentially induced by the persistent negative NAO forcing in the 1960s through an adjustment of thermohaline circulation, with the extreme FSSIE-induced low-salinity anomaly mostly remaining in the boundary currents in the western SPNA. Our results suggest a prominent driving role of the NAO-related heat flux forcing for key aspects of the observed GSA [Great Salinity Anomaly], including the shutdown of LS convection and trans-basin propagation of low-salinity waters.
The stratospheric QBO modulates Antarctic sea ice in June and July. We found a statistically significant relationship between the stratospheric quasi-biennial oscillation (QBO) and Antarctic sea ice concentration (SIC) in austral winter. SIC differences between the easterly phase of the QBO (EQBO) and westerly phase of the QBO (WQBO) show positive anomalies of SIC in the following regions: over the Ross Sea, Weddell Sea, and around 90°E.
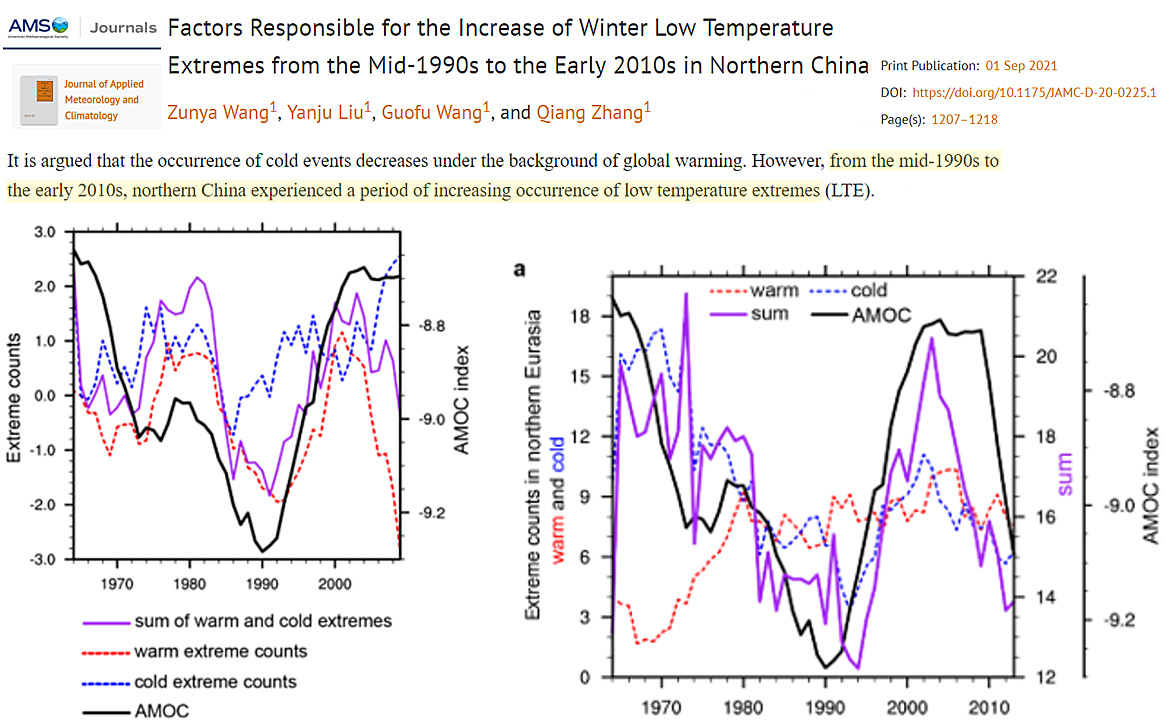
It is argued that the occurrence of cold events decreases under the background of global warming. However, from the mid-1990s to the early 2010s northern China experienced a period of increasing occurrence of low temperature extremes (LTE). Factors responsible for this increase of LTE are investigated in this analysis. The results show that the interdecadal variation of the winter mean temperature over the middle and high latitude Eurasia acts as an important thermal background. It is characterized by such two dominant modes as the “consistent cooling” pattern and the “Warm high latitude Eurasia and cold middle latitude Eurasia” pattern from the mid-1990s to the early 2010s. And the two patterns jointly provide a cooling background for the increase of LTE in northern China. Meanwhile, though the interdecadal variation of Arctic oscillation (AO), Ural blocking (UB) and Siberian high (SH) are all highly correlated to the occurrence of LTE in northern China, the AO is found to play a dominant role. … Widespread observed and projected increases in warm extremes, along with decreases in cold extremes, have been confirmed to be consistent with global and regional warming. However, in our study, decadal variations in surface air temperature (SAT) extremes over northern Eurasia in winter are primarily dominated by the Atlantic Meridional Overturning Circulation (AMOC), rather than an anthropogenically forcing. … [T]he inapparent increasing and decreasing trends with the changing frequencies of less than one time per decade (Supplementary Fig. S7a, b and Supplementary Fig. S8a, b) suggest the inconsequential effect of global warming on winter SAT extremes over northern Eurasia.
The large ensembles of the IPSL-CM6A-LR model output for the historical forcing experiment were employed to investigate the role of internal variability in the formation of the recent “warm Arctic–cold Eurasia” trend pattern in winter surface air temperature (SAT). In the simulations, the winter SAT trends during 1991–2014 display remarkable inter-member diversity over the Barents–Kara Seas region and central Eurasia, suggesting an important role played by internal variability. It is indicated that internally generated SAT trends over the Barents–Kara Seas are induced mainly by the change in local sea surface temperature (SST) trends. Furthermore, we find that the warming trend over the Barents–Kara Seas can induce an anomalous anticyclone over northern Eurasia, which in turn can contribute positively to the warming anomalies over the Barents–Kara Seas, but cannot account for the cooling trend over central Eurasia. The cooling trend over central Eurasia can be attributed to the negative Arctic Oscillation (AO)- like atmospheric circulation pattern, which is independent of the climate change over the Arctic. Therefore, the observed opposite winter SAT trends over the Barents–Kara Seas and central Eurasia arise partly from the linear combination of high SST trends over the Barents–Kara Seas and decline in the winter AO index.
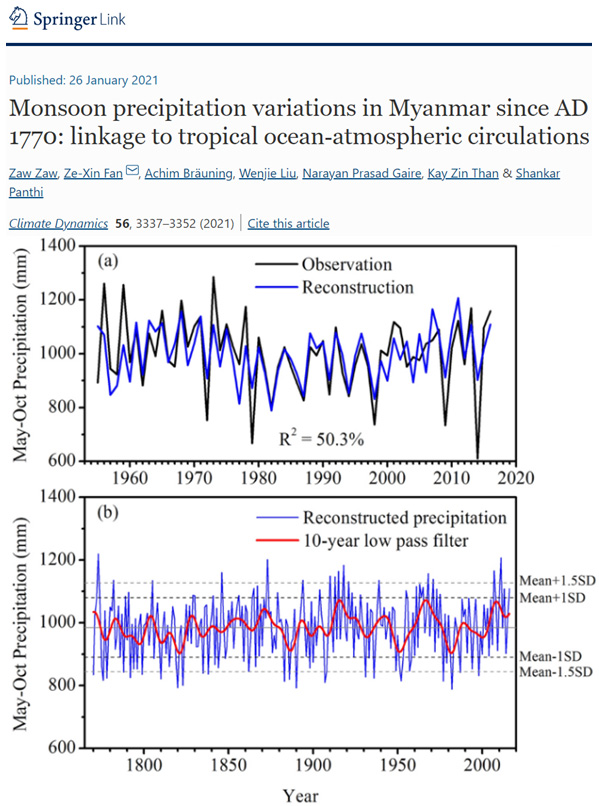
Our reconstruction revealed 22 (16) extremely dry (wet) years over the past 247 years. Several dry and wet episodes recorded in our reconstruction are consistent with other precipitation proxies from tropical Asia, such as the East Indian drought in 1790–1796 and the Victorian Holocaust drought in 1888–1890. The 2.0–4.0-year high-frequency periodicities revealed from spectral peaks and dominant regions of high spatial correlations indicated the summer precipitation in Myanmar is linked with broader-scale ocean-atmospheric circulations, mainly associated with the El Niño-Southern Oscillation (ENSO) activities due to sea surface temperature variations in the tropical Pacific Ocean. Coherent relationships of our reconstructed series with ENSO-related climate indices further support the dynamics of monsoon precipitation variability in Myanmar is inter-linked with global climate systems.
African rainfall shows significant year-to-year natural fluctuations that in part are linked to teleconnections associated with modes of variability in the Atlantic, Pacific and Indian oceans. Several of these relations have already been documented in the literature, e.g. the link between the AMO and Sahel rains, the connection between the NAO and Moroccan precipitation, as well as the influence of the IOD on the short rain season in East Africa. The present paper provides the first continent-wide analysis of the influence of six potential climatic drivers of natural variability, namely AMO, NAO, IOD, PDO, ENSO, and solar activity changes on African rainfall. … We showed further that solar activity influences rainfall in a linear way in smaller-scale regions during certain seasons with extraordinary strength. An explorative wavelet analysis revealed that the solar Schwabe cycle left its imprint in the spectra of all five ocean cycles. This points to second-order relationships that require further research.
Climate/Precipitation Natural Variability
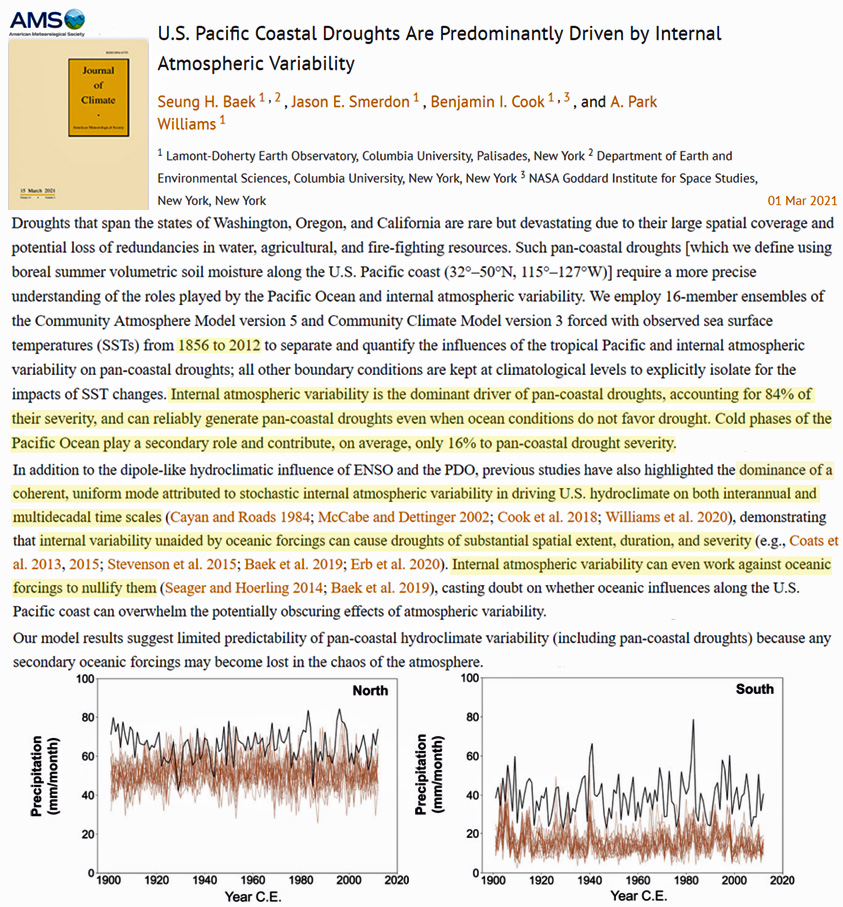
Internal atmospheric variability is the dominant driver of pan-coastal droughts, accounting for 84% of their severity, and can reliably generate pan-coastal droughts even when ocean conditions do not favor drought. Cold phases of the Pacific Ocean play a secondary role and contribute, on average, only 16% to pan-coastal drought severity. … In addition to the dipole-like hydroclimatic influence of ENSO and the PDO, previous studies have also highlighted the dominance of a coherent, uniform mode attributed to stochastic internal atmospheric variability in driving U.S. hydroclimate on both interannual and multidecadal time scales (Cayan and Roads 1984; McCabe and Dettinger 2002; Cook et al. 2018; Williams et al. 2020), demonstrating that internal variability unaided by oceanic forcings can cause droughts of substantial spatial extent, duration, and severity (e.g., Coats et al. 2013, 2015; Stevenson et al. 2015; Baek et al. 2019; Erb et al. 2020). Internal atmospheric variability can even work against oceanic forcings to nullify them (Seager and Hoerling 2014; Baek et al. 2019), casting doubt on whether oceanic influences along the U.S. Pacific coast can overwhelm the potentially obscuring effects of atmospheric variability.
According to the presented results, the contributions of the key modes of natural variability to the surface air temperature trends on relatively short time intervals within three decades reaches and can exceed (in absolute value) ± 0.2 K/decade, while they are not considerable as compared to the contribution of the GHGs atmospheric content rise on time intervals about half a century and longer. The GHGs contribution always increases, reaching 0.2 K/decade in the last two decades and even somewhat exceeding this value. The GHGs contribution dominates on time intervals of about half a century and longer, and sometimes even on shorter intervals.
The severest decade-scale droughts (≤0.75 SD from mean) occurred in the 1560s, 1600s/10s, 1630s, 1770s/80s, 1840s, and 1910s/20s, the severest pluvials (≥0.75 SD) in the 1610s/20s, 1660s/70s, and the 1970s/80s.
This study focuses on the analysis of 11 extreme precipitation indices (EPIs) in the period 1971–2013. In this context, commonly used statistical trend and break analyses were applied and a false discovery procedure was used in order to reduce the number of artificial significant tests. Additionally, the relative dominance of precipitation frequency and intensity in interannual precipitation datasets was determined. Finally, the correlation between EPIs and six oceanic-atmospheric indices were analysed. The results indicate that there is no significant global trend towards wet or dry conditions in the PA, although a signal of a more slightly decrease of precipitation is presented in the Southern PA.
Internal climate variability will play a major role in determining change on regional scales under global warming. In the extratropics, large-scale atmospheric circulation is responsible for much of observed regional climate variability, from seasonal to multidecadal timescales. However, the extratropical circulation variability on multidecadal timescales is systematically weaker in coupled climate models. Here we show that projections of future extratropical climate from coupled model simulations significantly underestimate the projected uncertainty range originating from large-scale atmospheric circulation variability. Using observational datasets and large ensembles of coupled climate models, we produce synthetic ensemble projections constrained to have variability consistent with the large-scale atmospheric circulation in observations. Compared to the raw model projections, the synthetic observationally-constrained projections exhibit an increased uncertainty in projected 21st century temperature and precipitation changes across much of the Northern extratropics. This increased uncertainty is also associated with an increase of the projected occurrence of future extreme seasons.
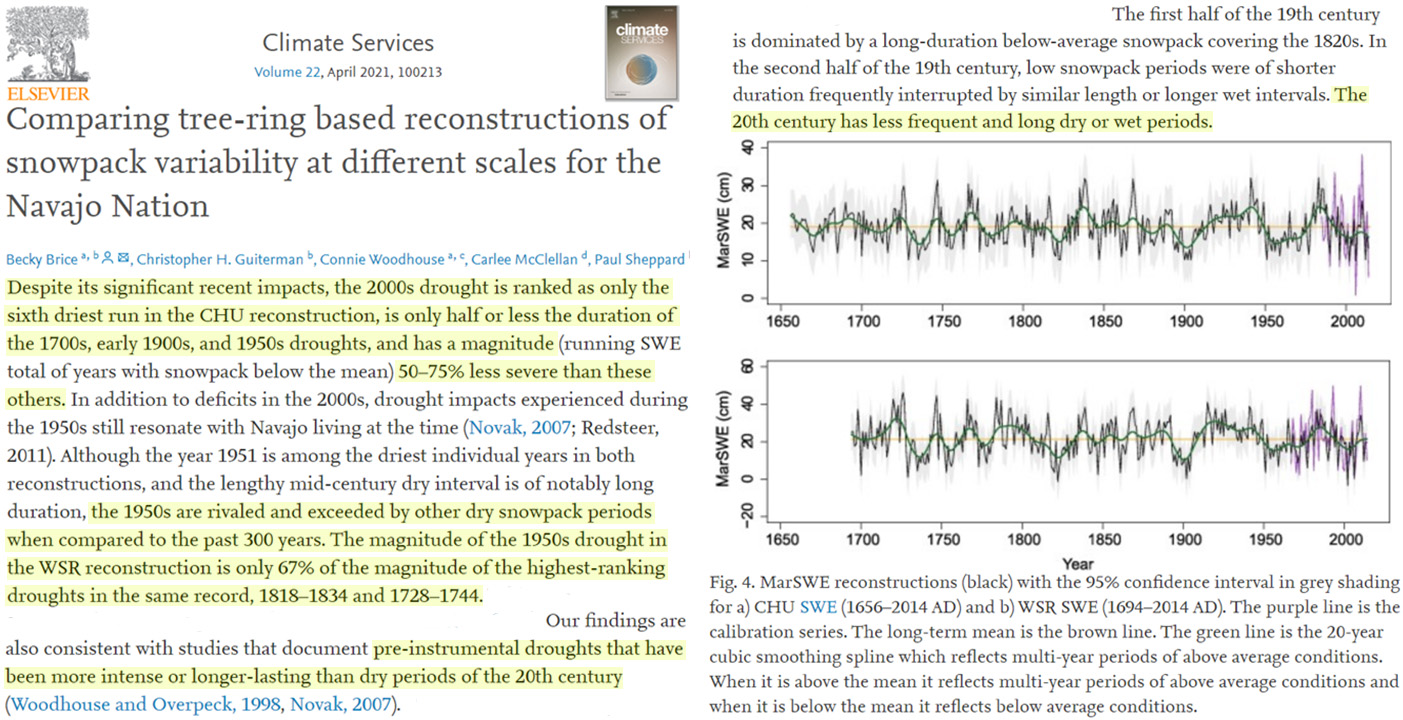
Despite its significant recent impacts, the 2000s drought is ranked as only the sixth driest run in the CHU reconstruction, is only half or less the duration of the 1700s, early 1900s, and 1950s droughts, and has a magnitude (running SWE total of years with snowpack below the mean) 50–75% less severe than these others. In addition to deficits in the 2000s, drought impacts experienced during the 1950s still resonate with Navajo living at the time (Novak, 2007; Redsteer, 2011). Although the year 1951 is among the driest individual years in both reconstructions, and the lengthy mid-century dry interval is of notably long duration, the 1950s are rivaled and exceeded by other dry snowpack periods when compared to the past 300 years. The magnitude of the 1950s drought in the WSR reconstruction is only 67% of the magnitude of the highest-ranking droughts in the same record, 1818–1834 and 1728–1744. … The 20th century has less frequent and long dry or wet periods. … Our findings are also consistent with studies that document pre-instrumental droughts that have been more intense or longer-lasting than dry periods of the 20th century (Woodhouse and Overpeck, 1998, Novak, 2007). … Extremely dry periods present in the paleo record, often more severe than what has been experienced in the instrumental record, coincided with impacts to human civilization (Cook et al., 2007). These impacts include societal disruptions in the Navajo region during periods of coinciding cool- and warm-season drought (Faulstich et al., 2013).
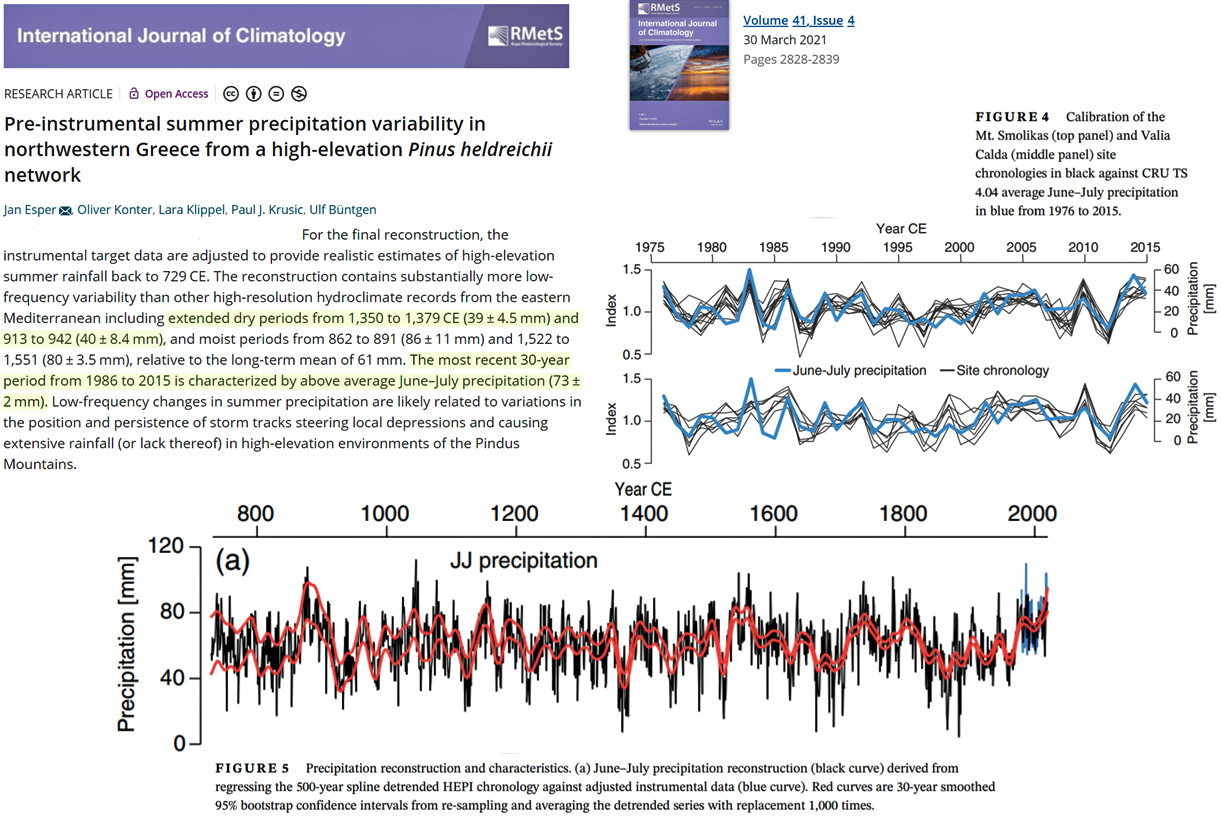
For the final reconstruction, the instrumental target data are adjusted to provide realistic estimates of high-elevation summer rainfall back to 729 CE. The reconstruction contains substantially more low-frequency variability than other high-resolution hydroclimate records from the eastern Mediterranean including extended dry periods from 1,350 to 1,379 CE (39 ± 4.5 mm) and 913 to 942 (40 ± 8.4 mm), and moist periods from 862 to 891 (86 ± 11 mm) and 1,522 to 1,551 (80 ± 3.5 mm), relative to the long-term mean of 61 mm. The most recent 30-year period from 1986 to 2015 is characterized by above average June–July precipitation (73 ± 2 mm).
Cloud Climate Influence
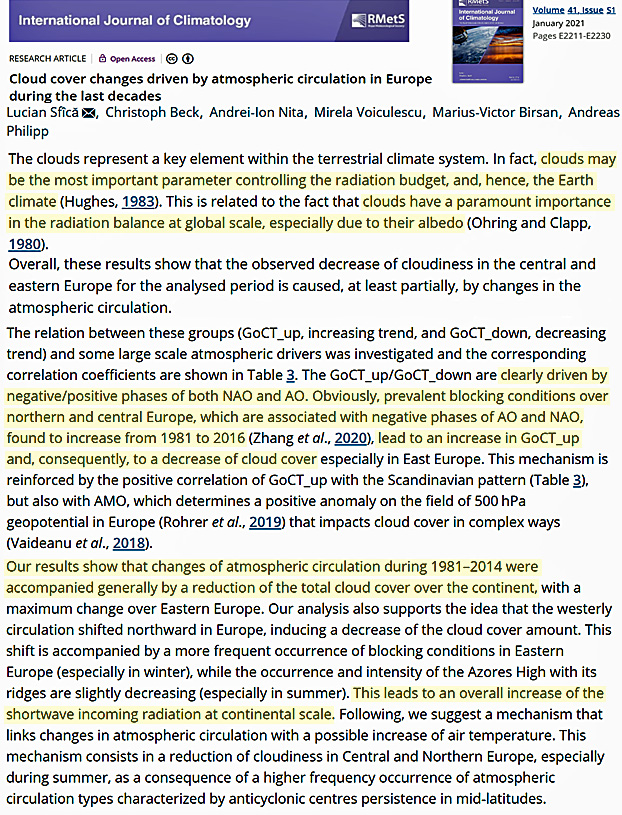
The clouds represent a key element within the terrestrial climate system. In fact, clouds may be the most important parameter controlling the radiation budget, and, hence, the Earth climate (Hughes, 1983). This is related to the fact that clouds have a paramount importance in the radiation balance at global scale, especially due to their albedo (Ohring and Clapp, 1980). … Chiacchio and Wild (2010) have shown that more positive NAO during 1985–2000 is linked with the increase of solar radiation in Europe due to lower amounts of cloud cover which are characteristic for the southern part of the continent during positive NAO. They showed that NAO, generally anticorrelated with cloud cover at continental scale, represents one of the most important drivers of changes in solar radiation in Europe. Sfîcă et al. (2017) found that higher values of sunshine duration during winter in Romania are linked with an intense westerly circulation at continental scale. This supports the idea that there is an important link between atmospheric circulation and cloud cover. The effect on surface radiation of the decrease in cloud cover adds to the observed decrease of the optical thickness of aerosols leading to the so‐called brightening period during the last decennia (Russak, 2009; Pfeifroth et al., 2018a).
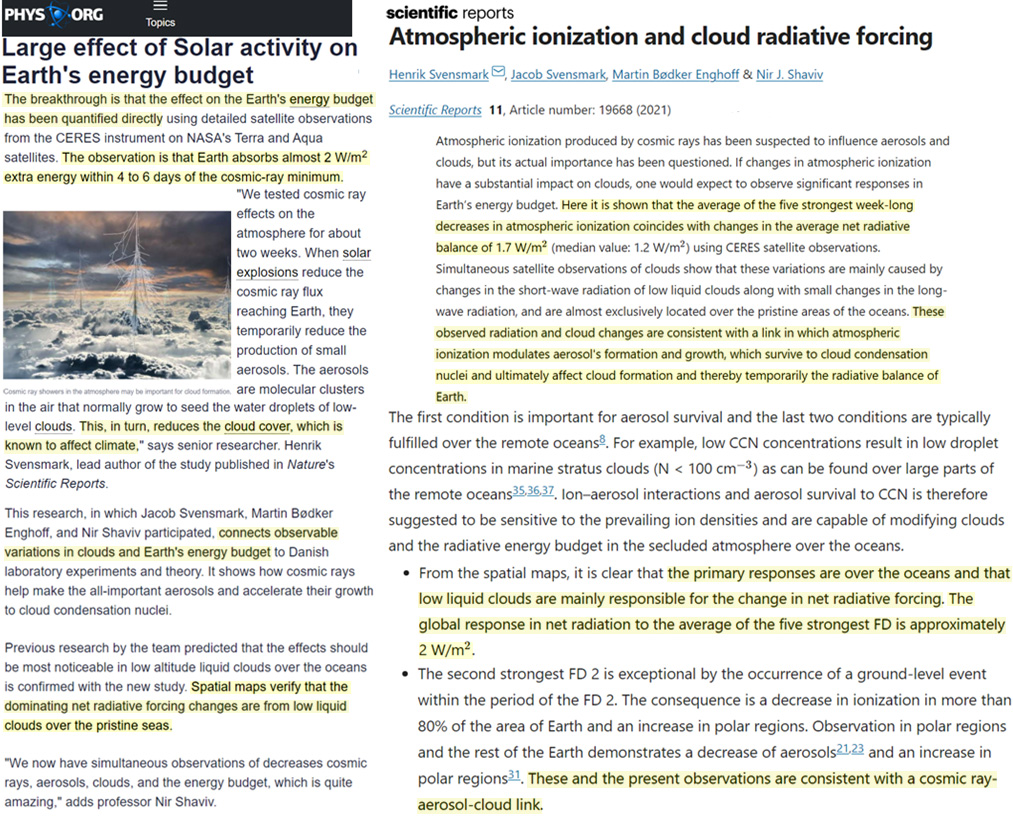
The consequence is a decrease in ionization in more than 80% of the area of Earth and an increase in polar regions. Observation in polar regions and the rest of the Earth demonstrates a decrease of aerosols21,23 and an increase in polar regions31. These and the present observations are consistent with a cosmic ray-aerosol-cloud link. … From the spatial maps, it is clear that the primary responses are over the oceans and that low liquid clouds are mainly responsible for the change in net radiative forcing. The global response in net radiation to the average of the five strongest FD is approximately 2 W/m2. … A consistent picture is emerging, suggesting that variations in ionization are connected to aerosols and clouds, and now also the energy budget.
The breakthrough is that the effect on the Earth’s energy budget has been quantified directly using detailed satellite observations from the CERES instrument on NASA’s Terra and Aqua satellites. The observation is that Earth absorbs almost 2 W/m2 extra energy within 4 to 6 days of the cosmic-ray minimum.
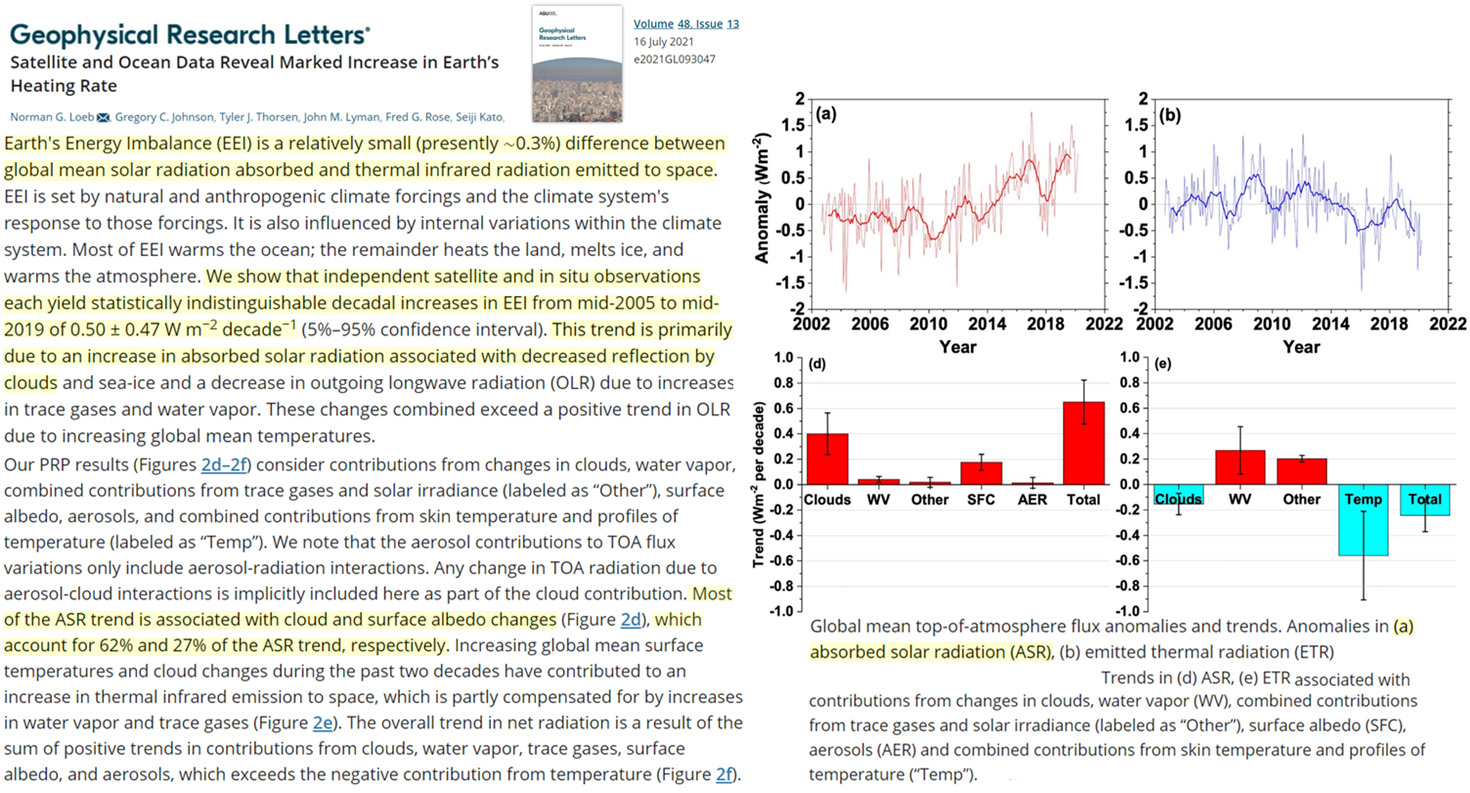
Earth’s Energy Imbalance (EEI) is a relatively small (presently ∼0.3%) difference between global mean solar radiation absorbed and thermal infrared radiation emitted to space. EEI is set by natural and anthropogenic climate forcings and the climate system’s response to those forcings. It is also influenced by internal variations within the climate system. Most of EEI warms the ocean; the remainder heats the land, melts ice, and warms the atmosphere. We show that independent satellite and in situ observations each yield statistically indistinguishable decadal increases in EEI from mid-2005 to mid-2019 of 0.50 ± 0.47 W/m² decade¯1 (5%–95% confidence interval). This trend is primarily due to an increase in absorbed solar radiation associated with decreased reflection by clouds and sea-ice and a decrease in outgoing longwave radiation (OLR) due to increases in trace gases and water vapor. These changes combined exceed a positive trend in OLR due to increasing global mean temperatures.
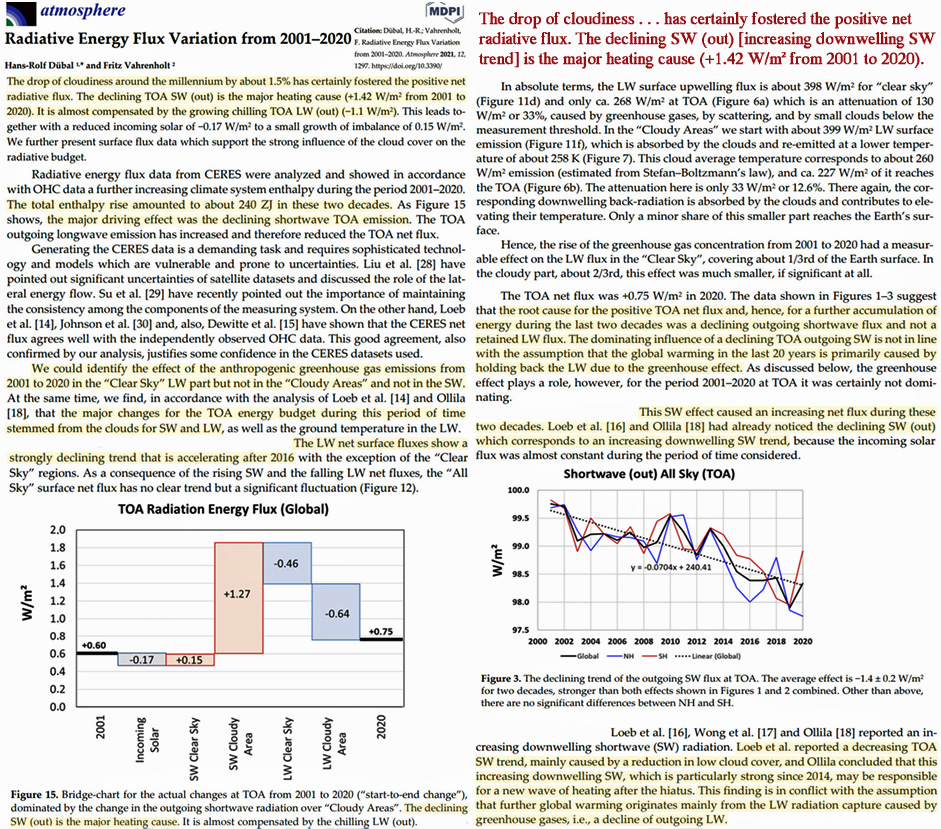
The drop of cloudiness around the millennium by about 1.5% has certainly fostered the positive net radiative flux. The declining TOA SW (out) is the major heating cause (+1.42 W/m² from 2001 to 2020). It is almost compensated by the growing chilling TOA LW (out) (−1.1 W/m²). This leads together with a reduced incoming solar of −0.17 W/m² to a small growth of imbalance of 0.15 W/m². We further present surface flux data which support the strong influence of the cloud cover on the radiative budget.
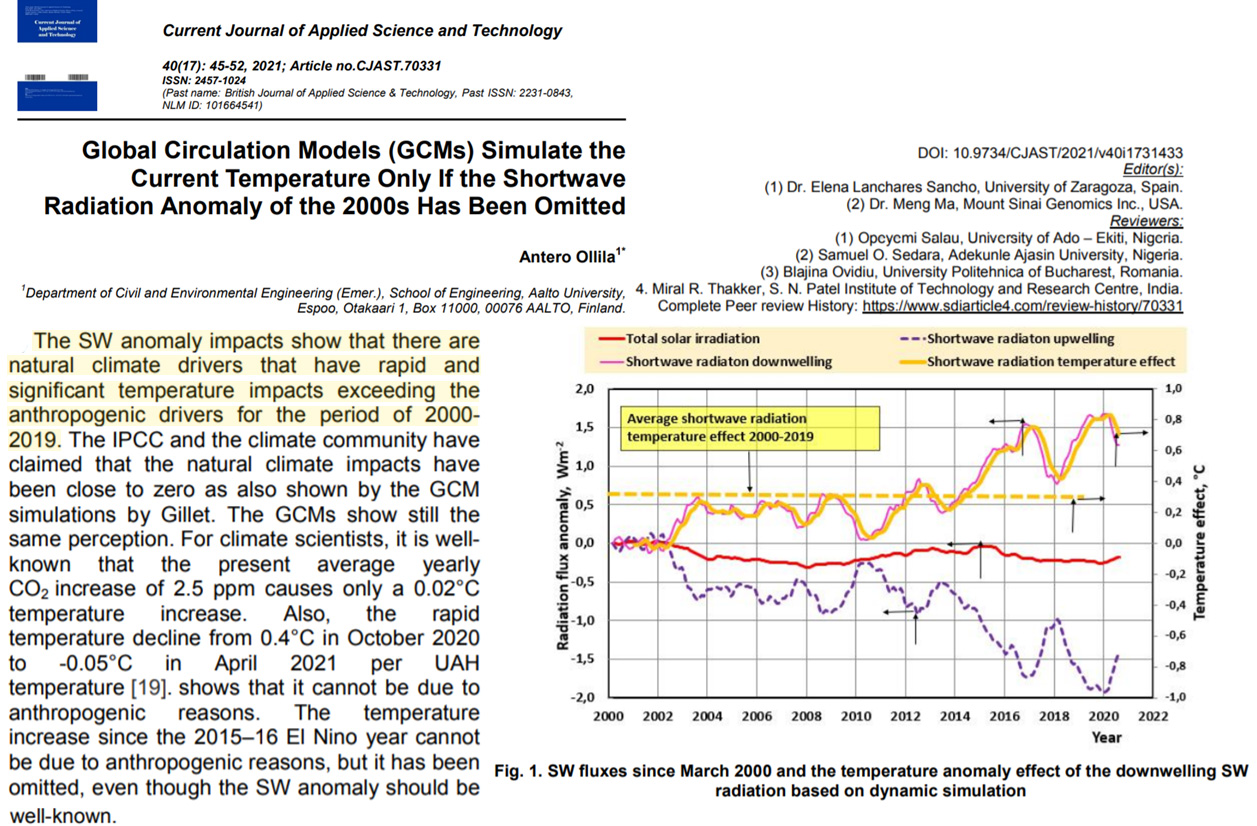
The SW anomaly impacts show that there are natural climate drivers that have rapid and significant temperature impacts exceeding the anthropogenic drivers for the period of 2000- 2019. The IPCC and the climate community have claimed that the natural climate impacts have been close to zero as also shown by the GCM simulations by Gillet. The GCMs show still the same perception. For climate scientists, it is well-known that the present average yearly CO2 increase of 2.5 ppm causes only a 0.02°C temperature increase. Also, the rapid temperature decline from 0.4°C in October 2020 to -0.05°C in April 2021 per UAH temperature [19]. shows that it cannot be due to anthropogenic reasons. The temperature increase since the 2015–16 El Nino year cannot be due to anthropogenic reasons, but it has been omitted, even though the SW anomaly should be well-known.
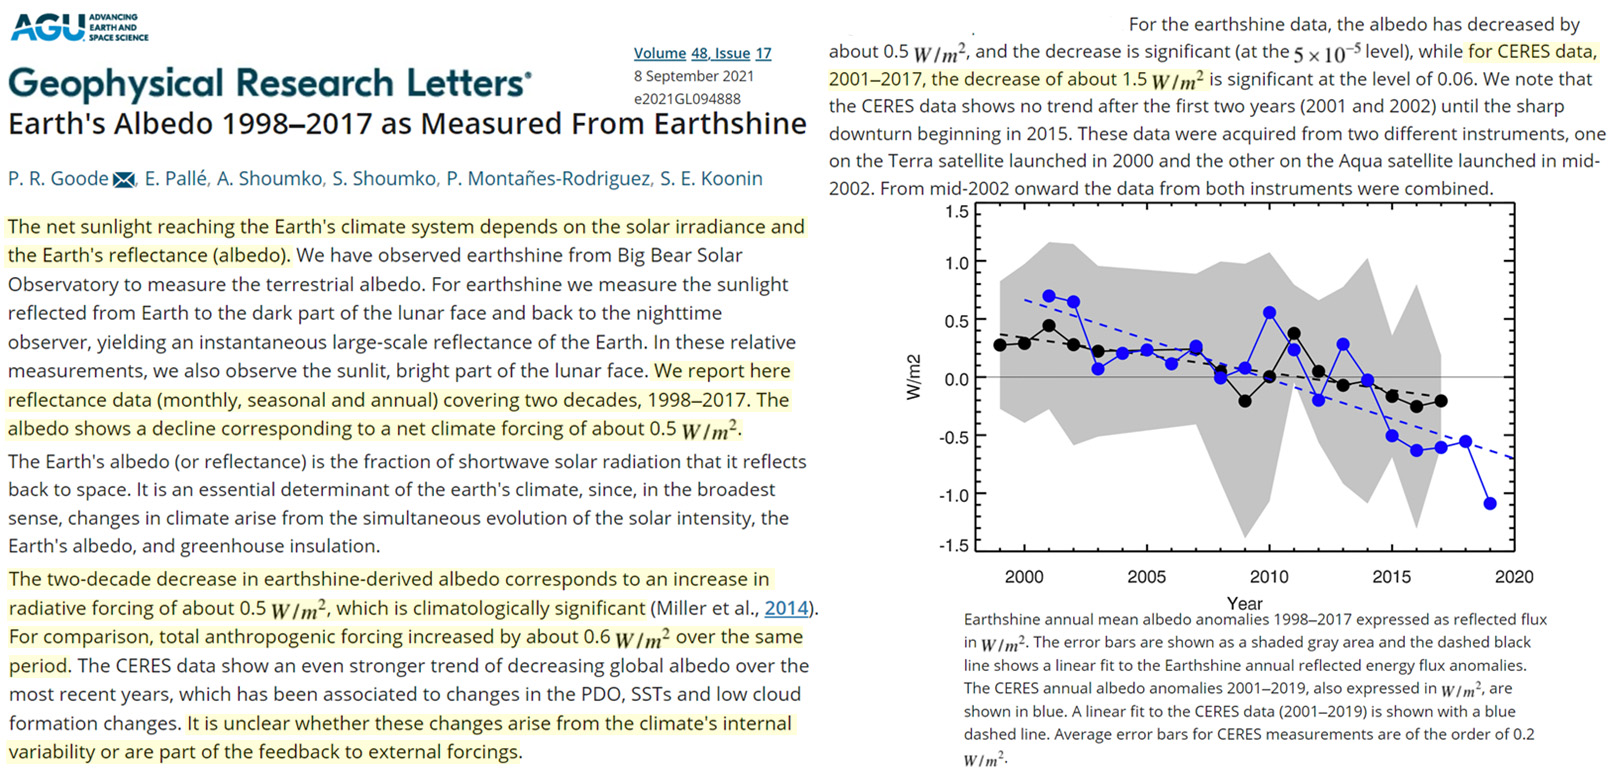
The reflectance of the Earth is a fundamental climate parameter that we measured from Big Bear Solar Observatory between 1998 and 2017 by observing the earthshine using modern photometric techniques to precisely determine daily, monthly, seasonal, yearly and decadal changes in terrestrial albedo from earthshine. We find the inter-annual fluctuations in albedo to be global, while the large variations in albedo within individual nights and seasonal wanderings tend to average out over each year. We measure a gradual, but climatologically significant 0.5 W/m² decline in the global albedo over the two decades of data. … For comparison, total anthropogenic forcing increased by about 0.6 W/m² over the same period.
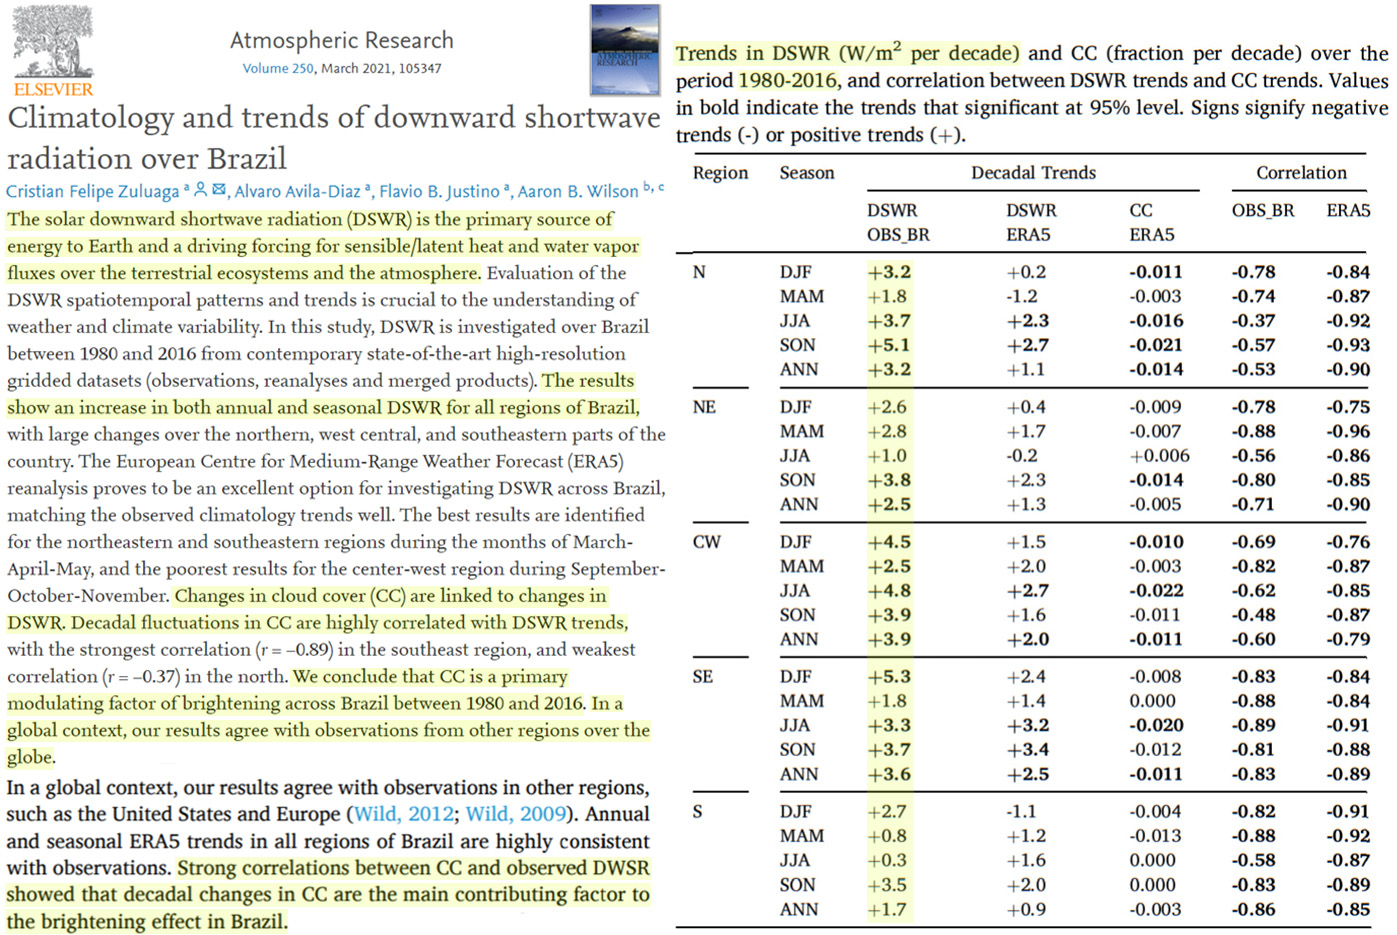
The solar downward shortwave radiation (DSWR) is the primary source of energy to Earth and a driving forcing for sensible/latent heat and water vapor fluxes over the terrestrial ecosystems and the atmosphere. Evaluation of the DSWR spatiotemporal patterns and trends is crucial to the understanding of weather and climate variability. In this study, DSWR is investigated over Brazil between 1980 and 2016 from contemporary state-of-the-art high-resolution gridded datasets (observations, reanalyses and merged products). The results show an increase in both annual and seasonal DSWR for all regions of Brazil, with large changes over the northern, west central, and southeastern parts of the country. The European Centre for Medium-Range Weather Forecast (ERA5) reanalysis proves to be an excellent option for investigating DSWR across Brazil, matching the observed climatology trends well. … Changes in cloud cover (CC) are linked to changes in DSWR. Decadal fluctuations in CC are highly correlated with DSWR trends, with the strongest correlation (r = −0.89) in the southeast region, and weakest correlation (r = −0.37) in the north. We conclude that CC is a primary modulating factor of brightening across Brazil between 1980 and 2016. In a global context, our results agree with observations from other regions over the globe.
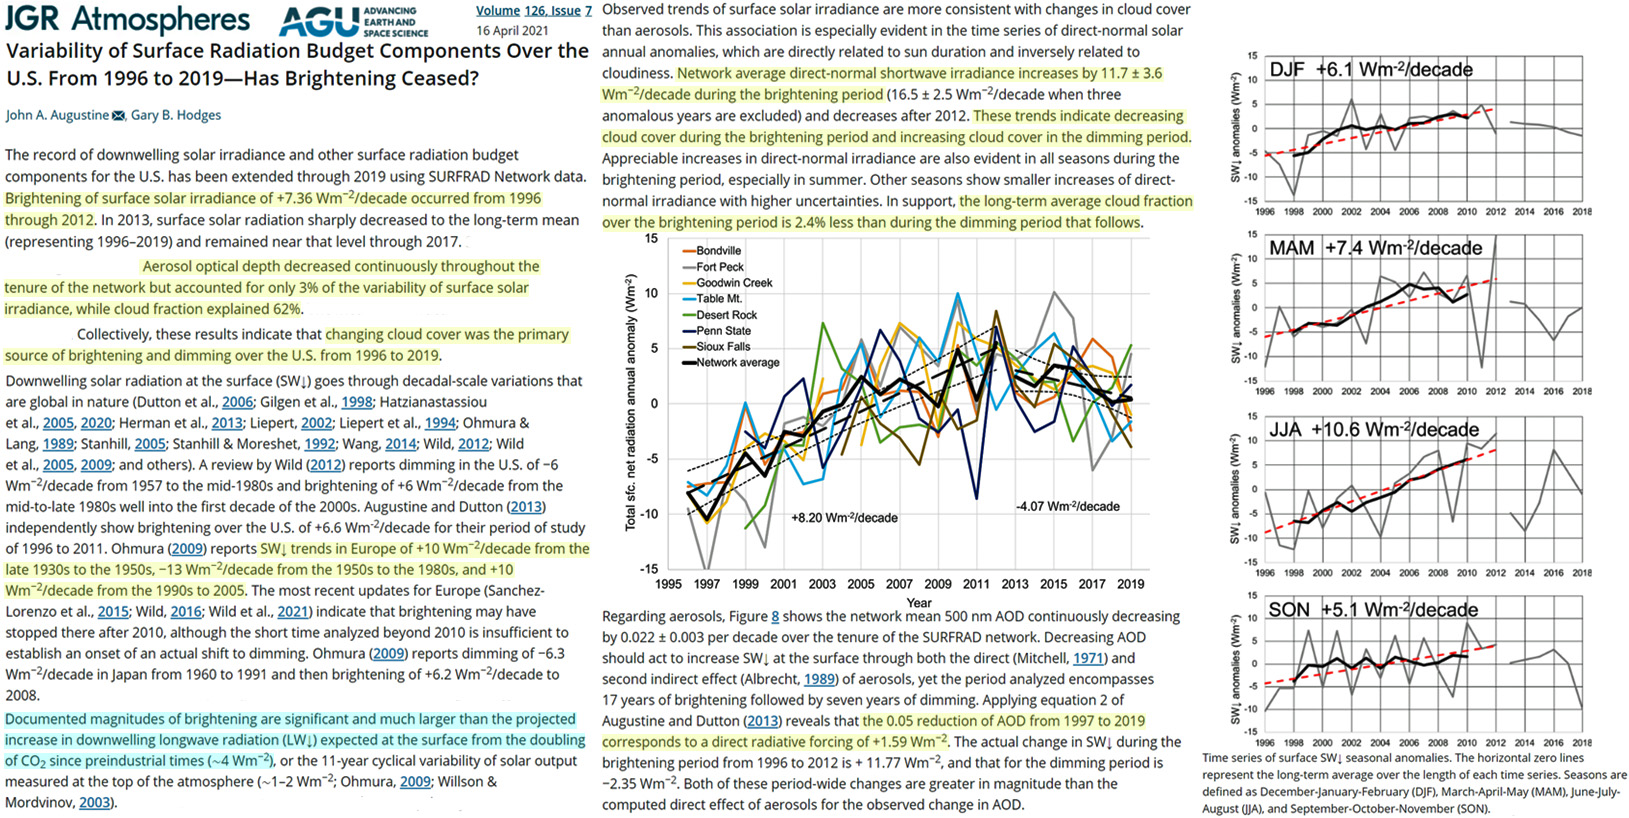
The record of downwelling solar irradiance and other surface radiation budget components for the U.S. has been extended through 2019 using SURFRAD Network data. Brightening of surface solar irradiance of +7.36 W/m²/decade occurred from 1996 through 2012. In 2013, surface solar radiation sharply decreased to the long-term mean (representing 1996–2019) and remained near that level through 2017. … Aerosol optical depth decreased continuously throughout the tenure of the network but accounted for only 3% of the variability of surface solar irradiance, while cloud fraction explained 62%. … Collectively, these results indicate that changing cloud cover was the primary source of brightening and dimming over the U.S. from 1996 to 2019. … Downwelling solar radiation at the surface (SW↓) goes through decadal-scale variations that are global in nature (Dutton et al., 2006; Gilgen et al., 1998; Hatzianastassiou et al., 2005, 2020; Herman et al., 2013; Liepert, 2002; Liepert et al., 1994; Ohmura & Lang, 1989; Stanhill, 2005; Stanhill & Moreshet, 1992; Wang, 2014; Wild, 2012; Wild et al., 2005, 2009; and others). A review by Wild (2012) reports dimming in the U.S. of −6 W/m²/decade from 1957 to the mid-1980s and brightening of +6 W/m²/decade from the mid-to-late 1980s well into the first decade of the 2000s. Augustine and Dutton (2013) independently show brightening over the U.S. of +6.6 W/m²/decade for their period of study of 1996 to 2011. Ohmura (2009) reports SW↓ trends in Europe of +10 W/m²/decade from the late 1930s to the 1950s, −13 W/m²/decade from the 1950s to the 1980s, and +10 W/m²/decade from the 1990s to 2005. The most recent updates for Europe (Sanchez-Lorenzo et al., 2015; Wild, 2016; Wild et al., 2021) indicate that brightening may have stopped there after 2010, although the short time analyzed beyond 2010 is insufficient to establish an onset of an actual shift to dimming. Ohmura (2009) reports dimming of −6.3 W/m²/decade in Japan from 1960 to 1991 and then brightening of +6.2 W/m²/decade to 2008.
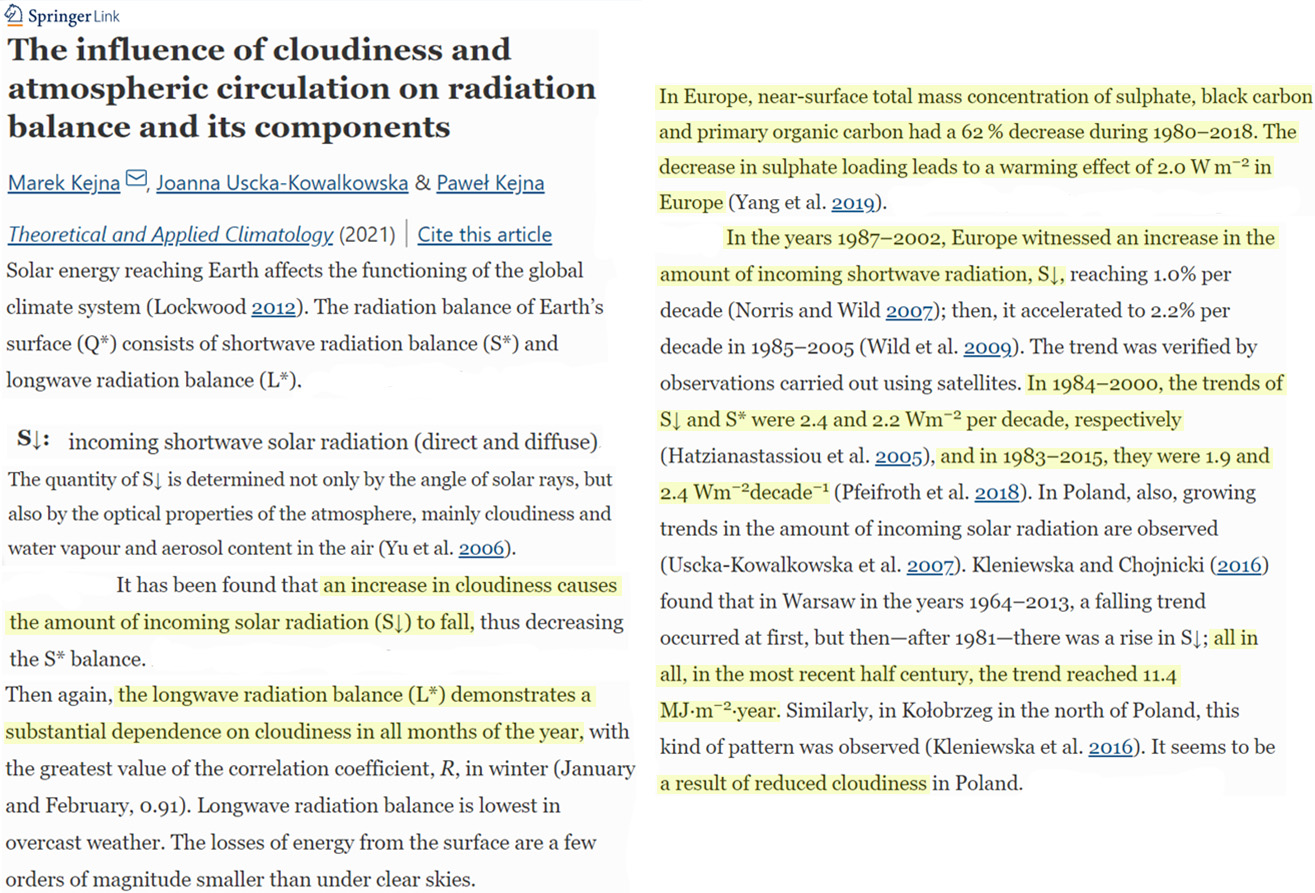
In the 1980s, the trend reversed and “global brightening” began (Wild 2009). In the years 1987–2002, Europe witnessed an increase in the amount of incoming shortwave radiation, S↓, reaching 1.0% per decade (Norris and Wild 2007); then, it accelerated to 2.2% per decade in 1985–2005 (Wild et al. 2009). The trend was verified by observations carried out using satellites. In 1984–2000, the trends of S↓ and S* were 2.4 and 2.2 W/m² per decade, respectively (Hatzianastassiou et al. 2005), and in 1983–2015, they were 1.9 and 2.4 W/m² decade−1 (Pfeifroth et al. 2018). In Poland, also, growing trends in the amount of incoming solar radiation are observed (Uscka-Kowalkowska et al. 2007). … In Europe, near-surface total mass concentration of sulphate, black carbon and primary organic carbon had a 62 % decrease during 1980–2018. The decrease in sulphate loading leads to a warming effect of 2.0 W/m² in Europe (Yang et al. 2019).
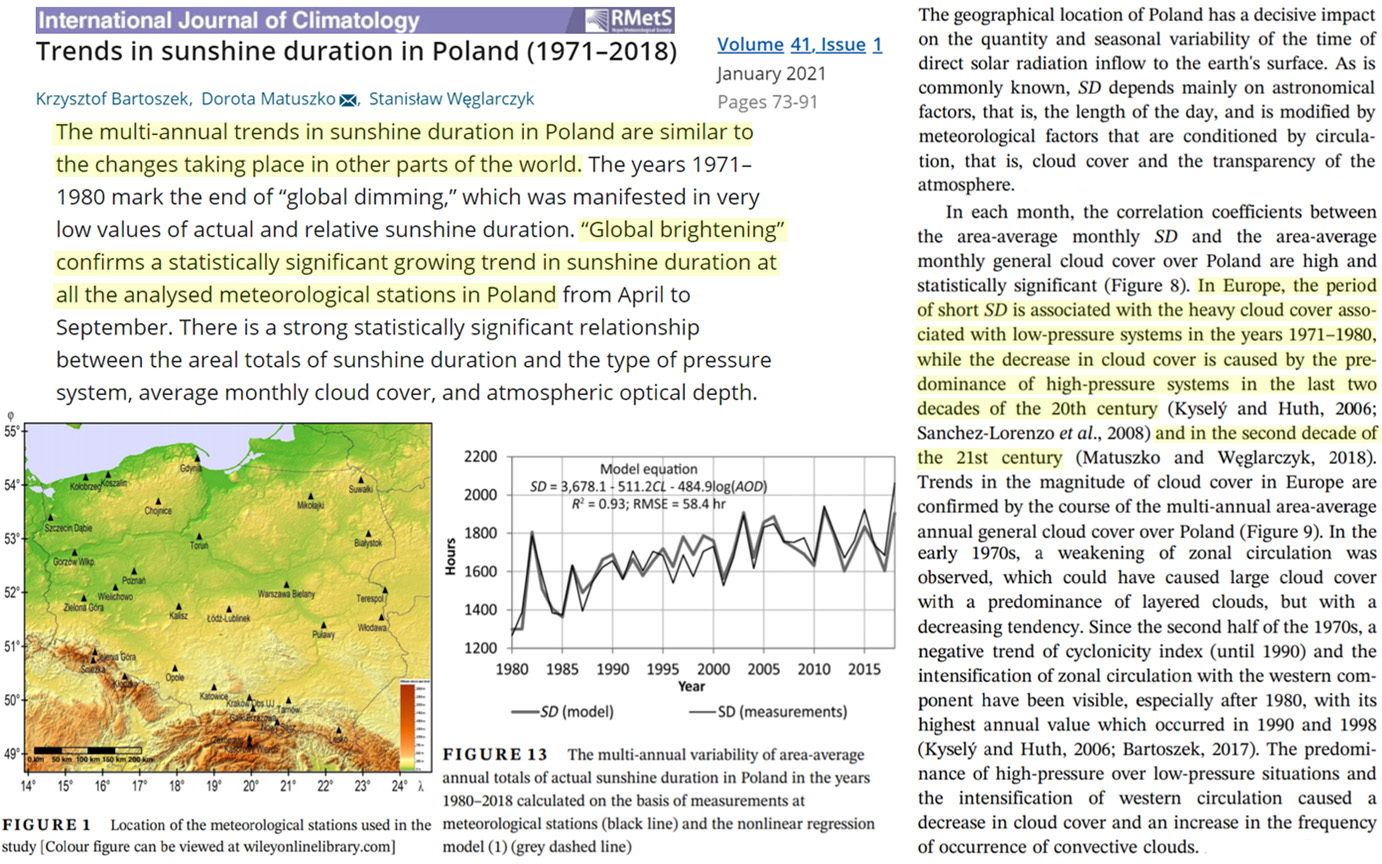
SD [sunshine duration] is an important indicator of the amount of solar energy reaching the Earth’s surface. In the current discussion on the causes of global warming, the analysis of the spatial and temporal variability of SD over a relatively large area of Poland’s land surface (311,895 km2) is of particular importance. … The multi‐annual trends in sunshine duration in Poland are similar to the changes taking place in other parts of the world. The years 1971–1980 mark the end of “global dimming,” which was manifested in very low values of actual and relative sunshine duration. “Global brightening” confirms a statistically significant growing trend in sunshine duration at all the analysed meteorological stations in Poland from April to September. There is a strong statistically significant relationship between the areal totals of sunshine duration and the type of pressure system, average monthly cloud cover, and atmospheric optical depth. … In each month, the correlation coefficients between the area-average monthly SD and the area-average monthly general cloud cover over Poland are high and statistically significant (Figure 8). In Europe, the period of short SD is associated with the heavy cloud cover associated with low-pressure systems in the years 1971–1980, while the decrease in cloud cover is caused by the predominance of high-pressure systems in the last two decades of the 20th century (Kyselý and Huth, 2006; Sanchez-Lorenzo et al., 2008) and in the second decade of the 21st century (Matuszko and Węglarczyk, 2018). Trends in the magnitude of cloud cover in Europe are confirmed by the course of the multi-annual area-average annual general cloud cover over Poland (Figure 9).
The Arctic is rapidly changing, with increasingly dramatic sea ice loss and surface warming in recent decades. Shortwave radiation plays a key role in Arctic warming during summer months, and absorbed shortwave radiation has been increasing largely because of greater sea ice loss. Clouds can influence this ice–albedo feedback by modulating the amount of shortwave radiation incident on the Arctic Ocean. In turn, clouds impact the amount of time that must elapse before forced trends in Arctic shortwave absorption emerge from internal variability. This study determines whether the forced climate response of absorbed shortwave radiation in the Arctic has emerged in the modern satellite record and global climate models. From 18 years of satellite observations from CERES-EBAF, we find that recent declines in sea ice are large enough to produce a statistically significant trend (1.7 × 10⁶ PJ or 3.9% per decade) in observed clear-sky absorbed shortwave radiation. However, clouds preclude any forced trends in all-sky absorption from emerging within the existing satellite record.
Clouds play a critical role in the ice sheet surface mass balance, both by providing mass input in the form of precipitation and by modulating the net radiation at the surface, thus influencing surface melt and run-off (Bennartz et al., 2013; Van Tricht et al., 2016; Hofer et al., 2017; Miller et al., 2017). … Mixed-phase clouds in particular, which contribute significantly to surface warming over the GrIS (Miller et al., 2015; Van Tricht et al., 2016), are sensitive to the number concentration of cloud condensation nuclei and ice-nucleating particles (e.g. Norgren et al., 2018; Solomon et al., 2018), where cloud condensation nuclei (CCN) are a subset of aerosol particles on which liquid droplets can form, and ice-nucleating particles (INPs) are a subset of aerosols that can catalyse the formation of ice crystals.
Clouds are an important component in climate, because of their complex interactions with other components of the climatic system. The main one is the influence on the radiative transfer in the solar or shortwave radiation (spectral interval: 0.2 µm to 4 µm) and in the terrestrial or longwave radiation (spectral interval higher than 4 µm). Those interactions occur via the scattering and absorption in the solar spectrum and mainly by absorption and emission in the terrestrial spectrum. The main effect of clouds on the solar radiation is the large backward scattering produced by the cloud droplets and ice crystals (Liou, 1986; Stephens, 2005; Mitchell and Finnegan, 2009). Because of that, the earth–atmosphere system albedo basically depends on the clouds and their properties. At the earth’s surface the clouds effect on the solar radiation basically depends on the microphysical (i.e. particle size) and macrophysical (i.e. cloud base and cloud top) properties of clouds and the sun disk location respect with the measurement point.
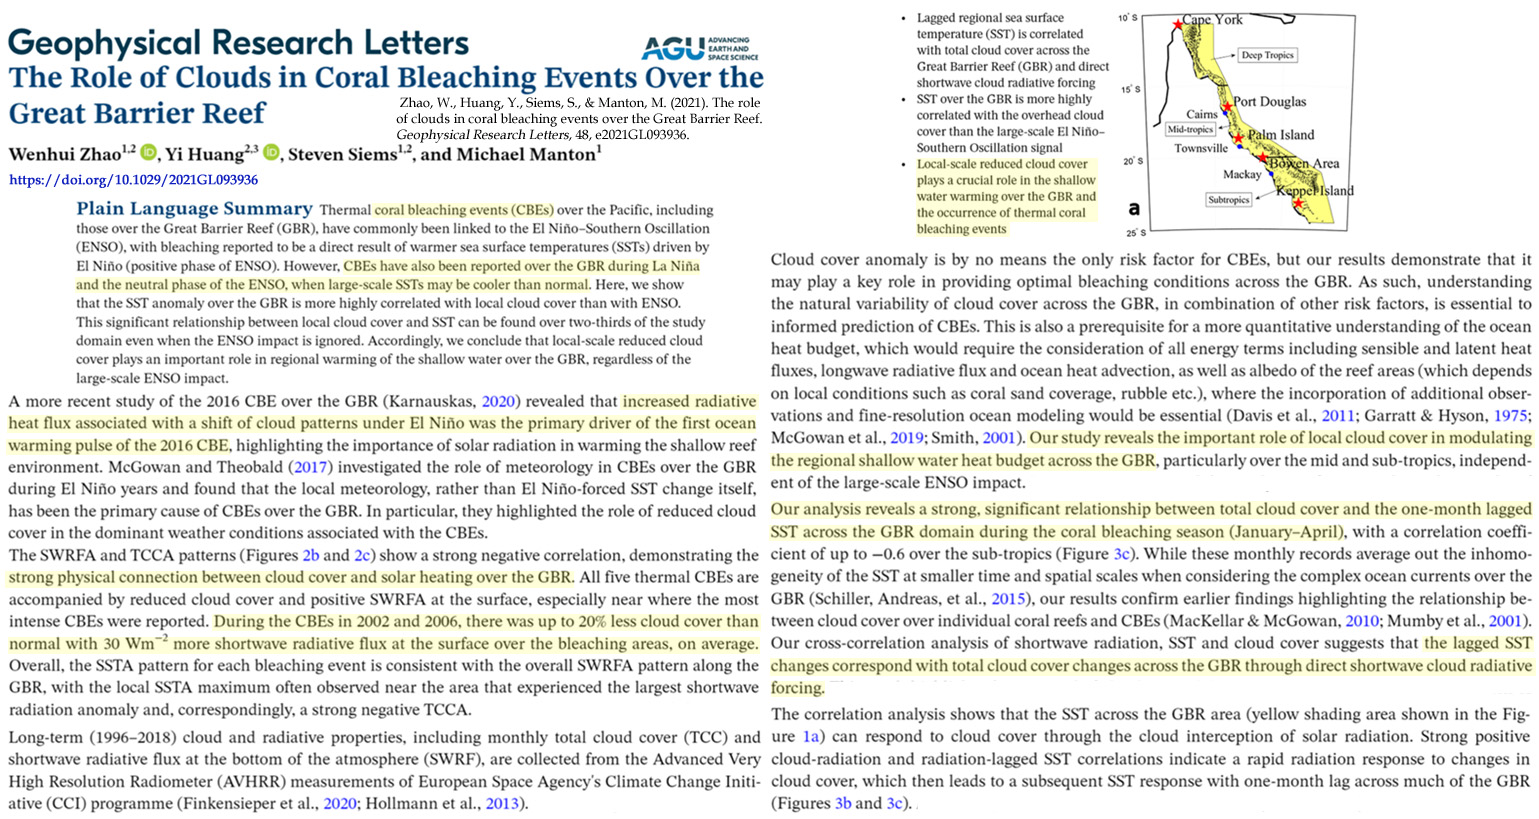
Zhao et al., 2021 (full paper)
Here, we show that the SST anomaly over the GBR is more highly correlated with local cloud cover than with ENSO. This significant relationship between local cloud cover and SST can be found over two-thirds of the study domain even when the ENSO impact is ignored. Accordingly, we conclude that local-scale reduced cloud cover plays an important role in regional warming of the shallow water over the GBR, regardless of the large-scale ENSO impact. … Lagged regional sea surface temperature (SST) is correlated with total cloud cover across the Great Barrier Reef (GBR) and direct shortwave cloud radiative forcing. … Local-scale reduced cloud cover plays a crucial role in the shallow water warming over the GBR and the occurrence of thermal coral bleaching events … Lagged regional sea surface temperature (SST) is correlated with total cloud cover across the Great Barrier Reef (GBR) and direct shortwave cloud radiative forcing. … Local-scale reduced cloud cover plays a crucial role in the shallow water warming over the GBR and the occurrence of thermal coral bleaching events.
Cosmic rays affect cloud cover variation. Clouds reflect both the incoming solar radiation flux upward and the earth’s thermal radiation back to it. Thus clouds control thermal energy input to the lower atmosphere and establishes a link between cosmic rays and the terrestrial temperature. … Clouds play an important role in modulating the heat budget of the lower atmosphere. We know that clouds acting as an opaque medium control thermal energy input to the lower atmosphere. So, one can expect a link between cosmic rays and cloud cover over the earth.
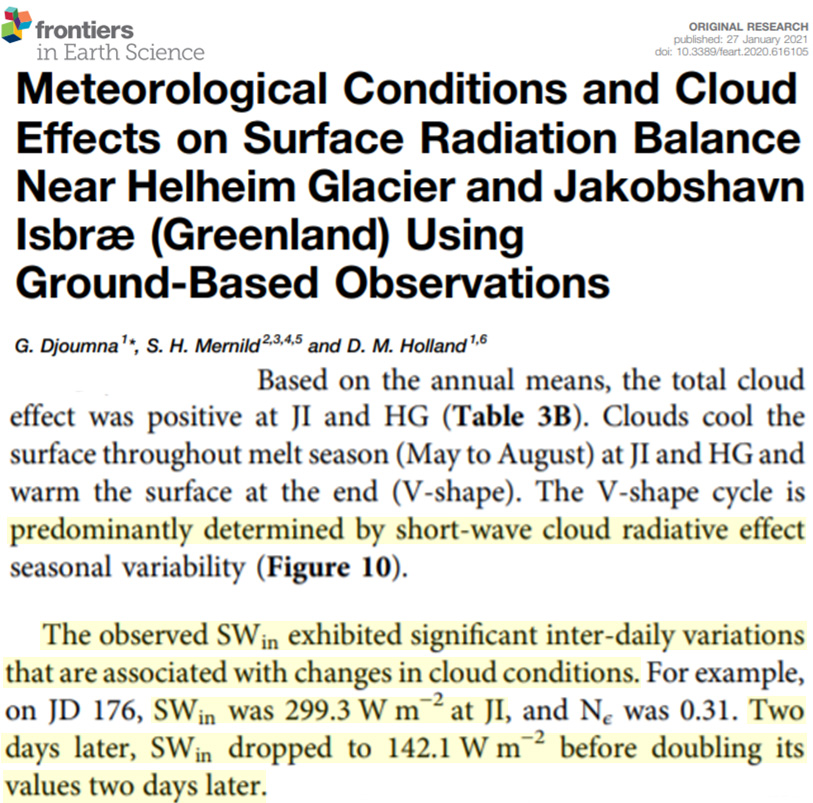
The observed SWin exhibited significant inter-daily variations that are associated with changes in cloud conditions. For example, on JD 176, SWin was 299.3 W/m² at JI. Two days later, SWin dropped to 142.1 W/m² before doubling its values two days later.
COD [cloud optical depth] variations therefore have a non-negligible impact on the surface radiative balance. For θ=60∘, for example, there is an approximately 200 W/m² difference in SWd [downwelling shortwave] between the optically thinnest and thickest clouds. This translates into a total shortwave cloud forcing that ranges between −20 and −60 W/m², assuming an albedo of 0.8 (typical of the N-ICE campaign April–June period). This range is significant when it is contrasted to the typical longwave forcing of ≈60 W/m²: even for θ=60∘, only the optically thickest clouds could contribute to cool the surface during the April–June N-ICE2015 campaign period. … The surface impact of Arctic clouds is also seasonally variable. In October and November, clouds warm the surface: 2 m temperatures associated with cloudless profiles are up to 8 K colder than those associated with profiles containing at least one low cloud.
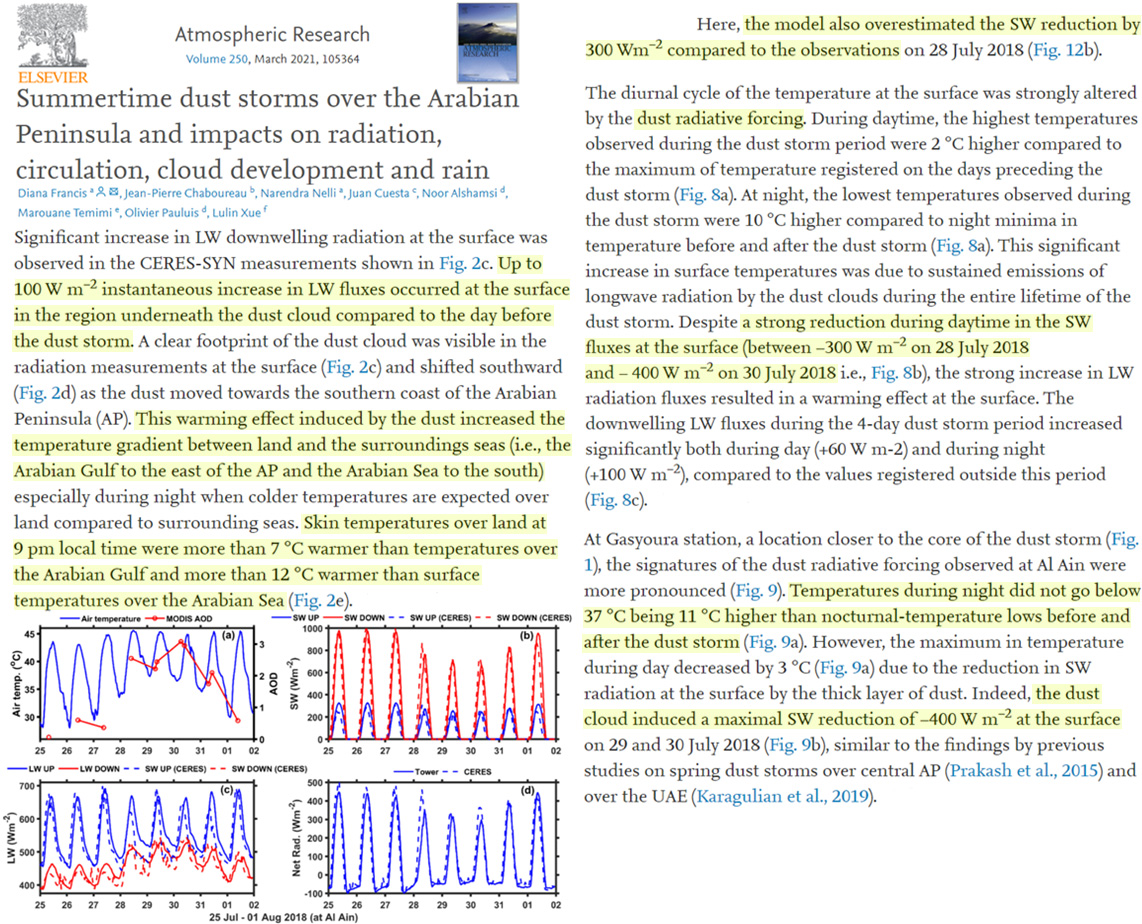
At Gasyoura station, a location closer to the core of the dust storm (Fig. 1), the signatures of the dust radiative forcing observed at Al Ain were more pronounced (Fig. 9). Temperatures during night did not go below 37 °C being 11 °C higher than nocturnal-temperature lows before and after the dust storm (Fig. 9a). However, the maximum in temperature during day decreased by 3 °C (Fig. 9a) due to the reduction in SW radiation at the surface by the thick layer of dust. Indeed, the dust cloud induced a maximal SW reduction of ~400 W/m² at the surface on 29 and 30 July 2018 (Fig. 9b), similar to the findings by previous studies on spring dust storms over central AP (Prakash et al., 2015) and over the UAE (Karagulian et al., 2019). … Here, the model also overestimated the SW reduction by 300 W/m² compared to the observations on 28 July 2018
Model runs corresponding to past climate show a substantial decrease in low clouds and hence planetary albedo compared with present, which contributes 40% of the required forcing to offset the faint Sun. Through time, the climatically important stratocumulus decks have grown in response to a brightening Sun and decreasing greenhouse effect, driven by stronger cloud-top radiative cooling (which drives low cloud formation) and a stronger inversion (which sustains clouds against dry air entrainment from above). We find that systematic changes to low clouds have had a major role in stabilizing climate through Earth’s history, which demonstrates the importance of physical feedbacks on long-term climate stabilization, and a smaller role for geochemical feedbacks.
[T]he presence of cloud-radiative effects shapes the circulation in the present-day climate in many important ways, including the width of the tropical rain belts and the position of the extratropical storm tracks. Cloud locking, in contrast, identified how clouds affect internal variability and the circulation response to global warming. This includes strong, but model-dependent, shortwave and longwave cloud impacts on the El-Nino Southern Oscillation, and the finding that most of the poleward circulation expansion in response to global warming can be attributed to radiative changes in clouds. We highlight the circulation impact of shortwave changes from low-level clouds and longwave changes from rising high-level clouds, and the contribution of these cloud changes to model differences in the circulation response to global warming. The review in particular draws attention to the role of cloud-radiative heating within the atmosphere.
Cloud acts as an important and uncertain factor in climate change prediction and simulation (Duan and Wu, 2006). It plays crucial roles in the Earth–atmosphere energy and radiation budgets. Warren et al. (2007) reported significant negative correlations between the summer total cloud amount and surface temperature in the North Hemisphere. The decreased total cloud amount contributes to warming over Tibet (Duan and Wu, 2006; Guo and Wang, 2012). Tang and Leng (2012) emphasized that clouds are an important local factor that adjusts the temperature variation in Eurasia. … Clouds are an important factor that influence summer temperature via the energy budget and global hydrological cycle (Tang and Leng, 2013; Yang et al., 2020). … The correlations between summer skin temperature and cloud amount reveal that the summer skin temperature has an evident dependence on the cloud amount and varies in different clouds. … [S]ummer cloud amount is an important indicator for temperature variations, especially the MHCC. The decreased precipitation matches the reduced TCC. The summer precipitation in Tibet is primarily influenced by the cloud amount, especially HCC and MHCC. … Warming and decreased precipitation in the past two decades are primarily related to cloud amount changes. … Clouds, via their interactions with radiation, shape the atmospheric circulation and, consequently, regional climate.
The CO2 Greenhouse Effect – Climate Driver?
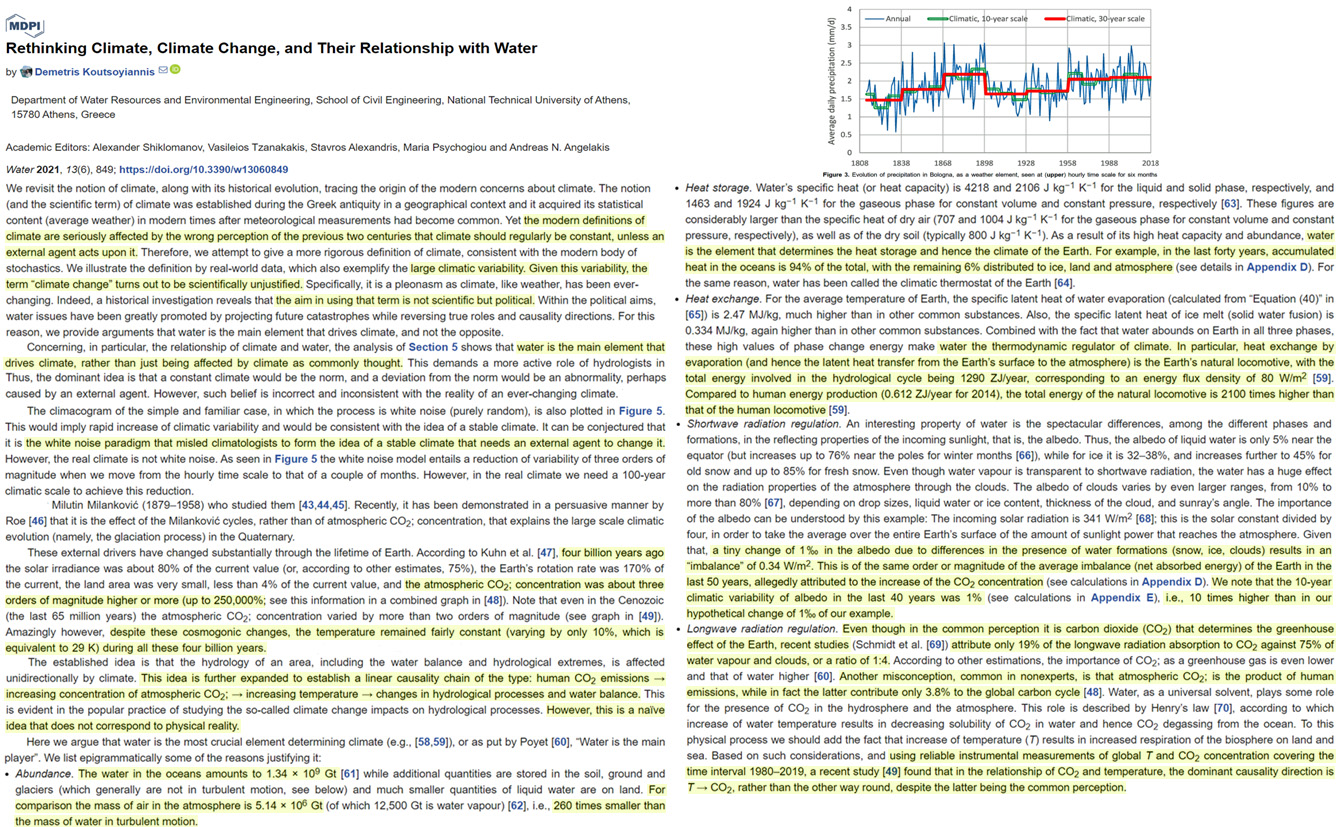
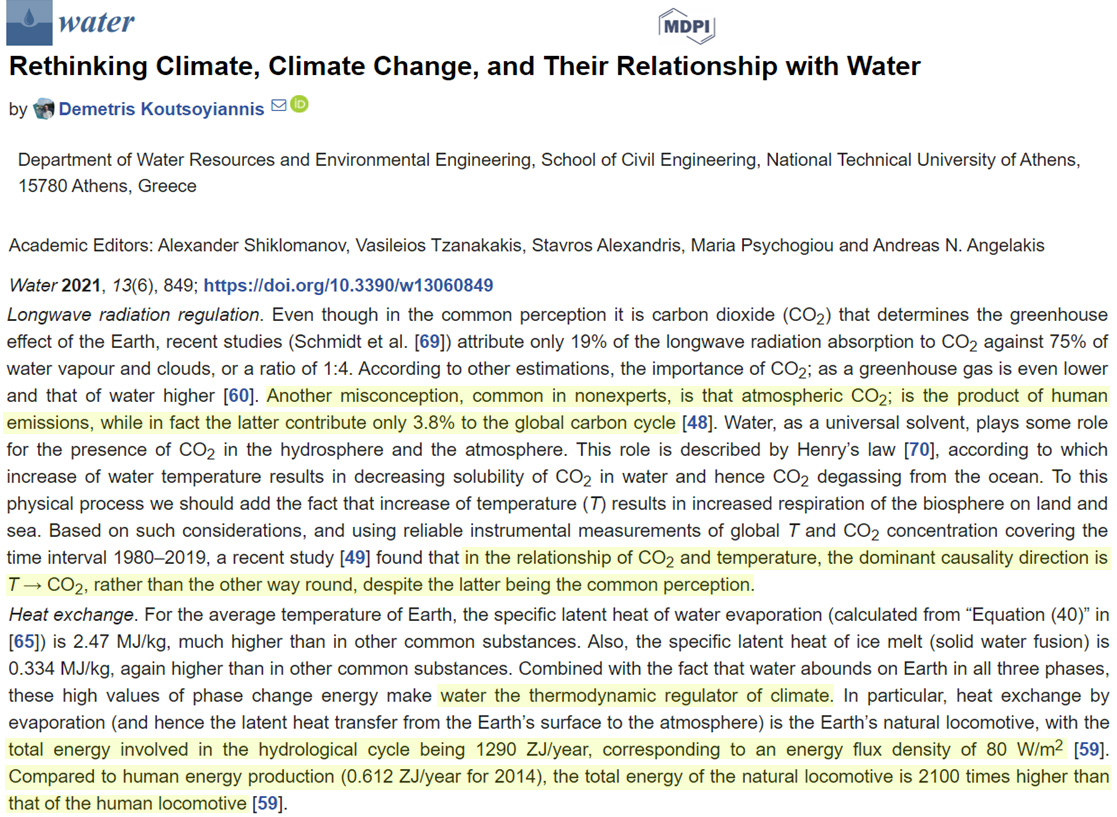
[T]he modern definitions of climate are seriously affected by the wrong perception of the previous two centuries that climate should regularly be constant, unless an external agent acts upon it. … [H]eat exchange by evaporation (and hence the latent heat transfer from the Earth’s surface to the atmosphere) is the Earth’s natural locomotive, with the total energy involved in the hydrological cycle being 1290 ZJ/year, corresponding to an energy flux density of 80 W/m2. Compared to human energy production (0.612 ZJ/year for 2014), the total energy of the natural locomotive is 2100 times higher than that of the human locomotive … Even though in the common perception it is carbon dioxide (CO2) that determines the greenhouse effect of the Earth, recent studies (Schmidt et al. [69]) attribute only 19% of the longwave radiation absorption to CO2 against 75% of water vapour and clouds, or a ratio of 1:4. … Another misconception, common in nonexperts, is that atmospheric CO2; is the product of human emissions, while in fact the latter contribute only 3.8% to the global carbon cycle. … [U]sing reliable instrumental measurements of global T and CO2 concentration covering the time interval 1980–2019, a recent study found that in the relationship of CO2 and temperature, the dominant causality direction is T → CO2, rather than the other way round, despite the latter being the common perception.
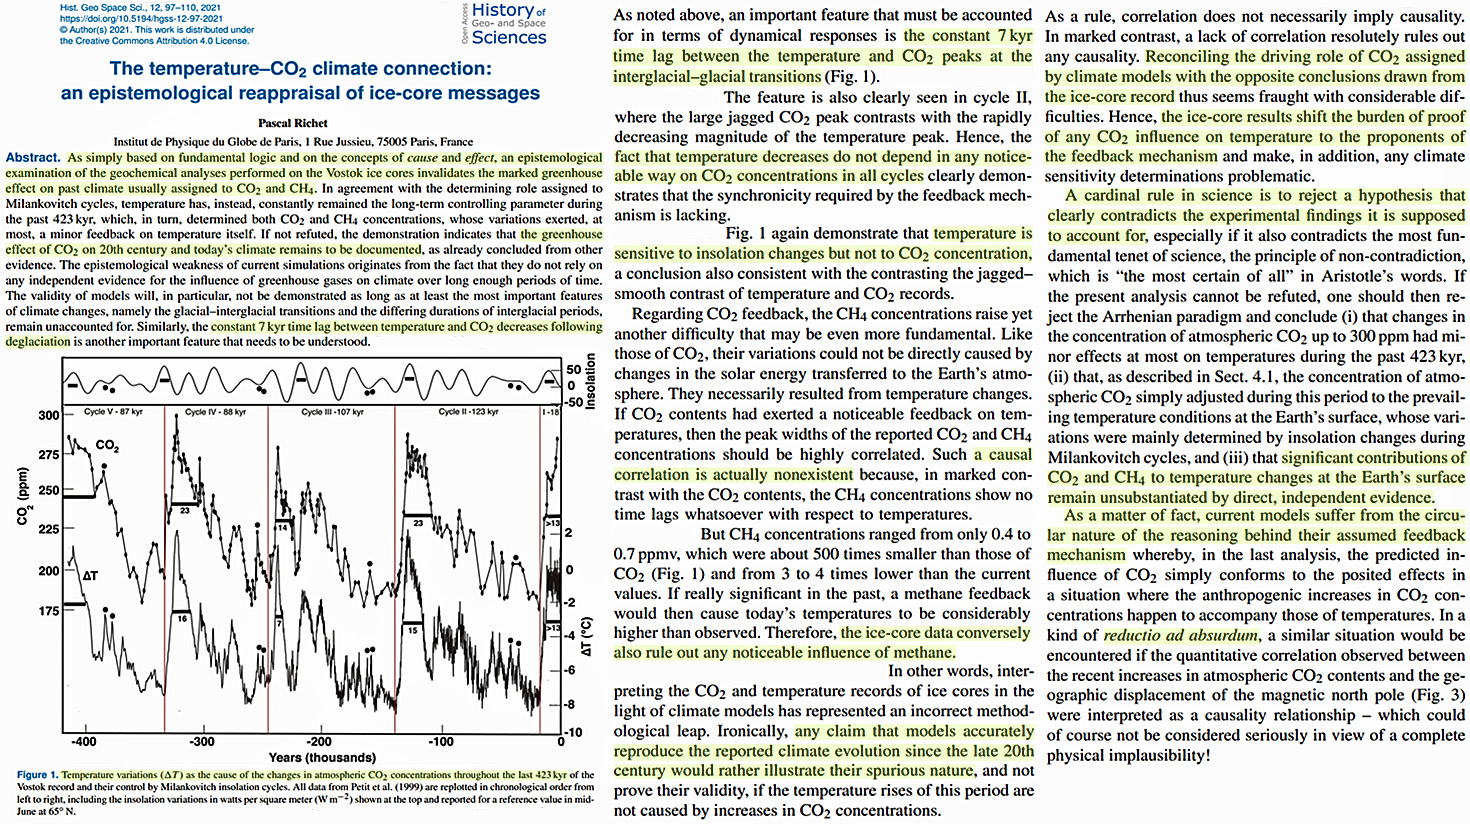
A cardinal rule in science is to reject a hypothesis that clearly contradicts the experimental findings it is supposed to account for, especially if it also contradicts the most fundamental tenet of science, the principle of non-contradiction, which is “the most certain of all” in Aristotle’s words. If the present analysis cannot be refuted, one should then reject the Arrhenian paradigm and conclude (i) that changes in the concentration of atmospheric CO2 up to 300 ppm had minor effects at most on temperatures during the past 423 kyr, (ii) that, as described in Sect. 4.1, the concentration of atmospheric CO2 simply adjusted during this period to the prevailing temperature conditions at the Earth’s surface, whose variations were mainly determined by insolation changes during Milankovitch cycles, and (iii) that significant contributions of CO2 and CH4 to temperature changes at the Earth’s surface remain unsubstantiated by direct, independent evidence.
A nonlinear mechanism for the formation of a time lag between changes in the global surface temperature T and the carbon dioxide content in the atmosphere q is described. It is shown that the changes in T can either lag behind the changes in q or lead them, depending on the type of external forcing, its time scale, the amplitude, and the direction of the change in the state of the system. In particular, when the amplitudes of T and q are sufficiently large, the response of one variable to changes in the other is markedly different from the linear one: the dependence of T on changes in q is logarithmic, and the dependence of q on changes in T is close to exponential. In the case of variations on a time scale of several centuries, this results in T being ahead of q at the growth stage, and q ahead of T at the decreasing stage, regardless of the type of external forcing.
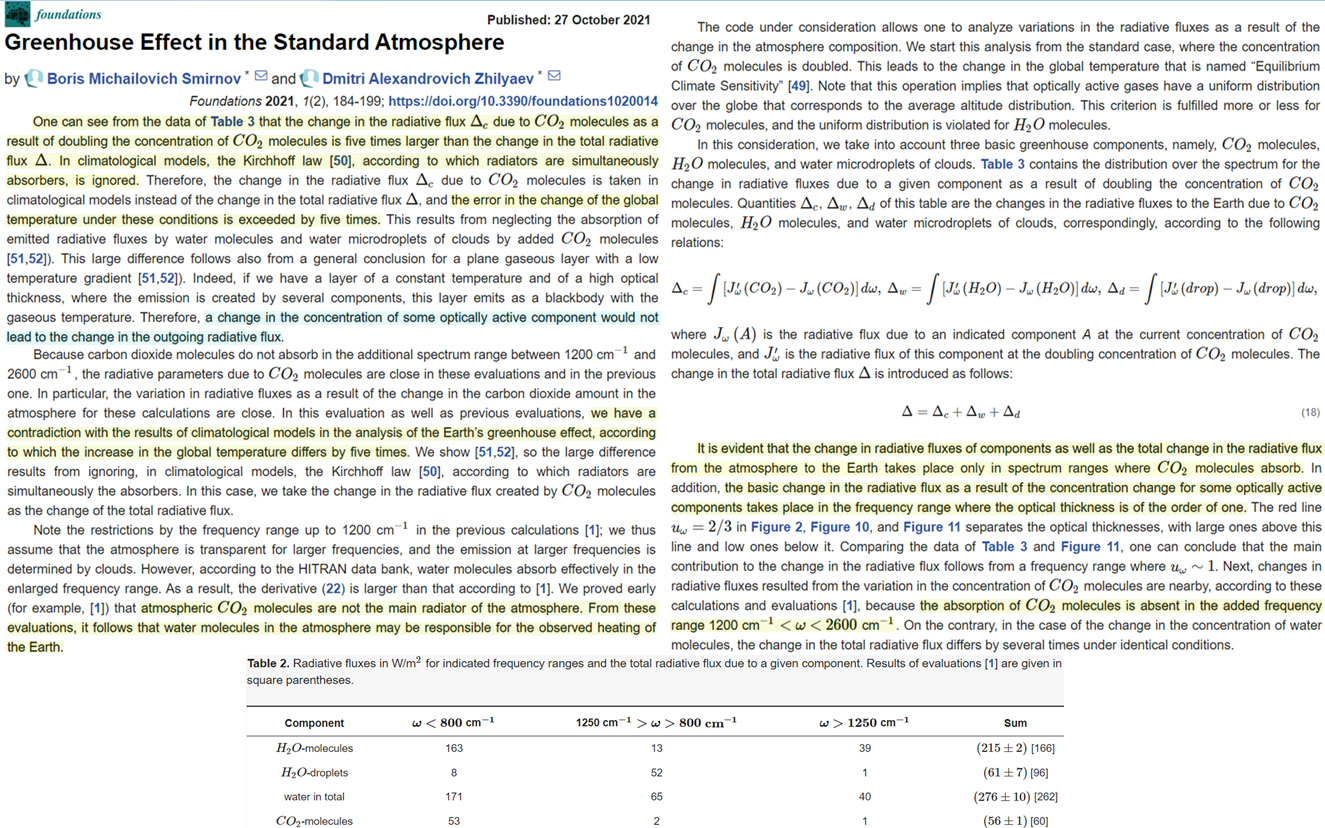
Because carbon dioxide molecules do not absorb in the additional spectrum range between 1200 cm−1 and 2600 cm−1, the radiative parameters due to CO2 molecules are close in these evaluations and in the previous one. In particular, the variation in radiative fluxes as a result of the change in the carbon dioxide amount in the atmosphere for these calculations are close. In this evaluation as well as previous evaluations, we have a contradiction with the results of climatological models in the analysis of the Earth’s greenhouse effect, according to which the increase in the global temperature differs by five times. [T]he large difference results from ignoring, in climatological models, the Kirchhoff law [50], according to which radiators are simultaneously the absorbers. In this case, we take the change in the radiative flux created by CO2 molecules as the change of the total radiative flux.
Note the restrictions by the frequency range up to 1200 cm−1 in the previous calculations [1]; we thus assume that the atmosphere is transparent for larger frequencies, and the emission at larger frequencies is determined by clouds. However, according to the HITRAN data bank, water molecules absorb effectively in the enlarged frequency range. [A]tmospheric CO2 molecules are not the main radiator of the atmosphere. From these evaluations, it follows that water molecules in the atmosphere may be responsible for the observed heating of the Earth.
It is emphasized that the causes and predictions of the global warming trend should be regarded as open scientific questions because several details concerning the physical processes associated with global warming remain uncertain. For example, the role of solar activities coupled with Milankovitch cycles are not yet fully understood. In addition, other factors, such as ocean CO2 uptake and volcanic activity, may not be negligible.
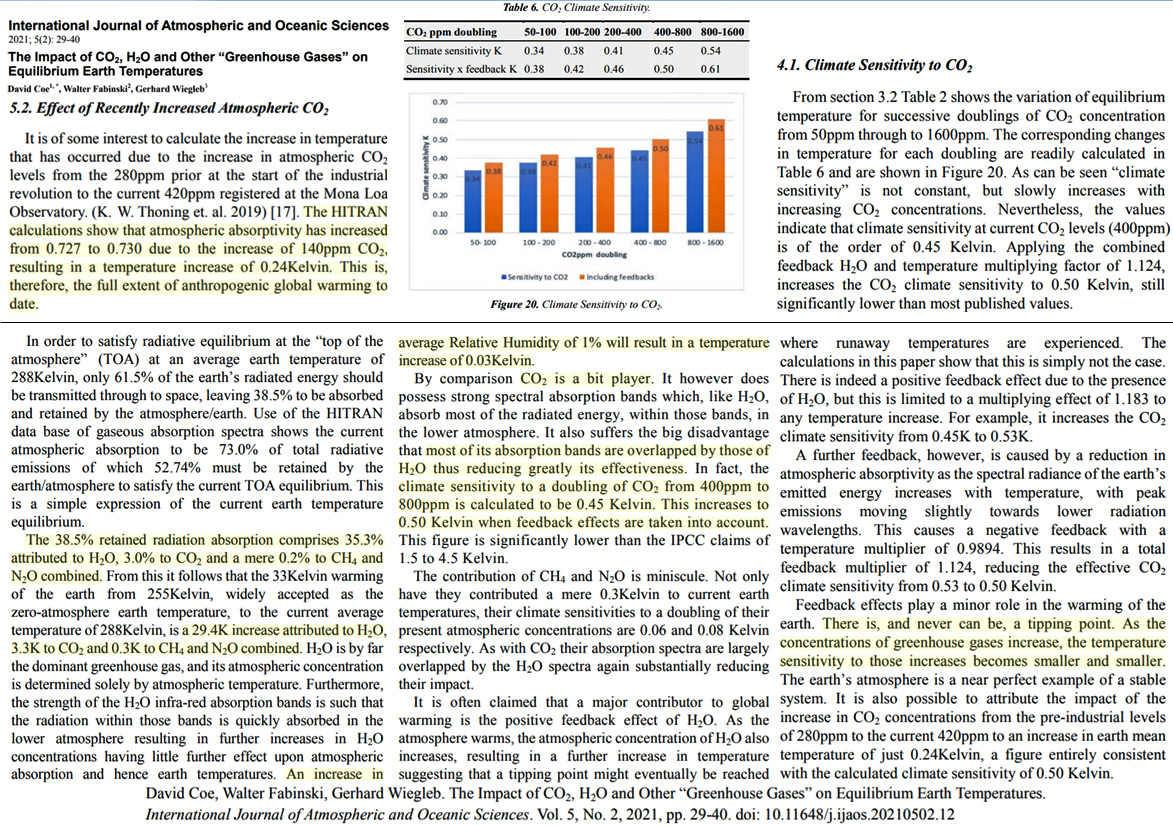
The HITRAN database of gaseous absorption spectra enables the absorption of earth radiation at its current temperature of 288K to be accurately determined for each individual atmospheric constituent and also for the combined absorption of the atmosphere as a whole. From this data it is concluded that H2O is responsible for 29.4K of the 33K warming, with CO2 contributing 3.3K and CH4 and N2O combined just 0.3K. Climate sensitivity to future increases in CO2 concentration is calculated to be 0.50K, including the positive feedback effects of H2O, while climate sensitivities to CH4 and N2O are almost undetectable at 0.06K and 0.08K respectively. This result strongly suggests that increasing levels of CO2 will not lead to significant changes in earth temperature and that increases in CH4 and N2O will have very little discernable impact.
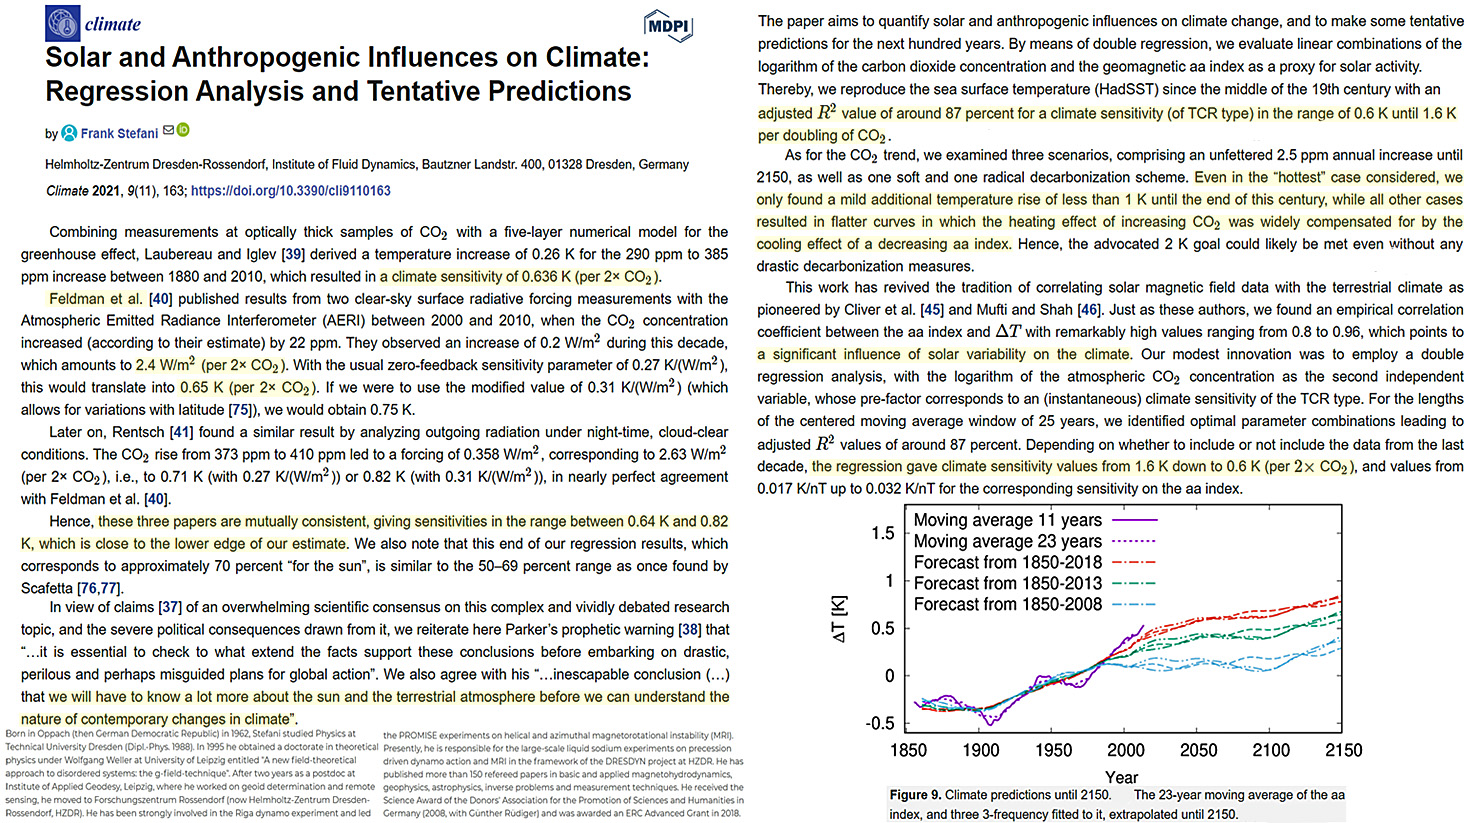
The paper aims to quantify solar and anthropogenic influences on climate change, and to make some tentative predictions for the next hundred years. By means of double regression, we evaluate linear combinations of the logarithm of the carbon dioxide concentration and the geomagnetic aa index as a proxy for solar activity. Thereby, we reproduce the sea surface temperature (HadSST) since the middle of the 19th century with an adjusted R2 value of around 87 percent for a climate sensitivity (of TCR type) in the range of 0.6 K until 1.6 K per doubling of CO2. The solution of the double regression is quite sensitive: when including data from the last decade, the simultaneous occurrence of a strong El Niño and of low aa values leads to a preponderance of solutions with relatively high climate sensitivities around 1.6 K. If these later data are excluded, the regression delivers a significantly higher weight of the aa index and, correspondingly, a lower climate sensitivity going down to 0.6 K. The plausibility of such low values is discussed in view of recent experimental and satellite-borne measurements. We argue that a further decade of data collection will be needed to allow for a reliable distinction between low and high sensitivity values. In the second part, which builds on recent ideas about a quasi-deterministic planetary synchronization of the solar dynamo, we make a first attempt to predict the aa index and the resulting temperature anomaly for various typical CO2 scenarios. Even for the highest climate sensitivities, and an unabated linear CO2 increase, we predict only a mild additional temperature rise of around 1 K until the end of the century, while for the lower values an imminent temperature drop in the near future, followed by a rather flat temperature curve, is prognosticated.
Unsettled Science, Failed Climate Modeling
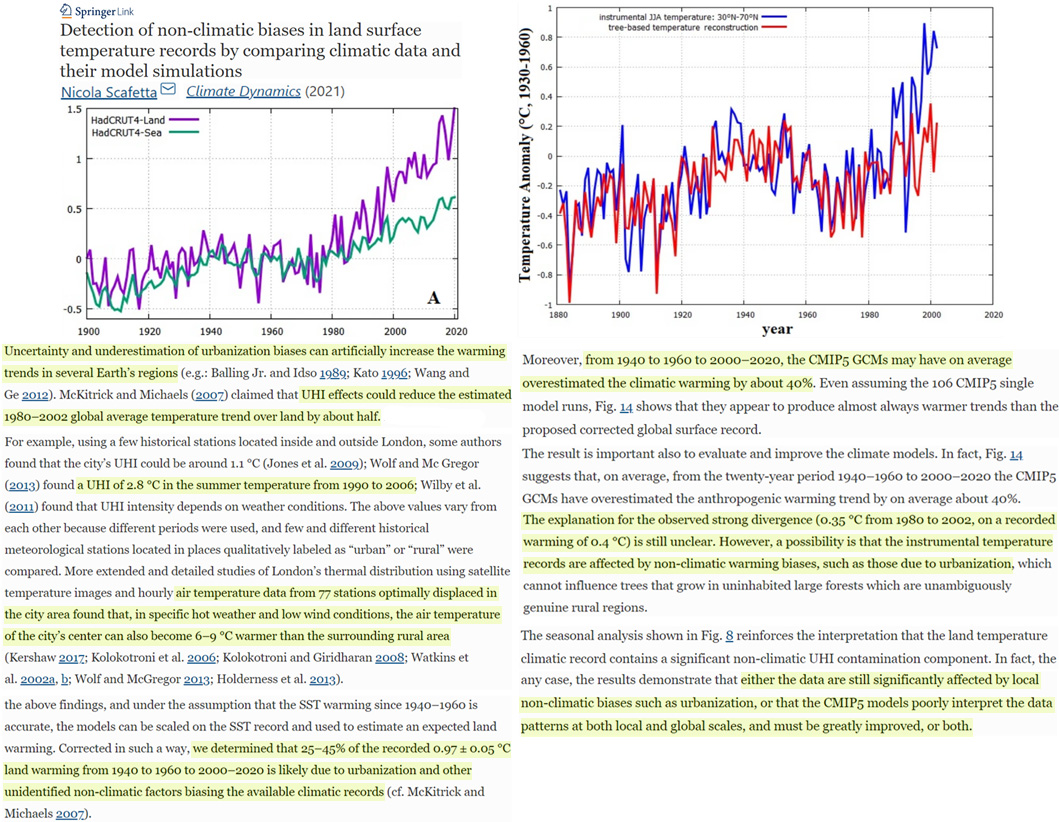
Uncertainty and underestimation of urbanization biases can artificially increase the warming trends in several Earth’s regions (e.g.: Balling Jr. and Idso 1989; Kato 1996; Wang and Ge 2012). McKitrick and Michaels (2007) claimed that UHI effects could reduce the estimated 1980–2002 global average temperature trend over land by about half. … [T]he 0.97 ± 0.05 °C instrumental land warming observed from 1940 to 1960 to 2000–2020 is likely made of a 0.61 ± 0.07 °C possibly autentic climatic warming plus a 0.36 ± 0.04 °C non-climatic warming bias. This means that 25–45%, that is about a third of the recorded global surface land warming from 1940 to 1960 to 2000–2020 could have been due to urbanization and other unidentified non-climatic biases. [T]he results demonstrate that either the data are still significantly affected by local non-climatic biases such as urbanization, or that the CMIP5 models poorly interpret the data patterns at both local and global scales, and must be greatly improved, or both.
Accurately projecting mass loss from ice sheets is of critical societal importance. However, despite recent improvements in ice sheet models, our analysis of a recent effort to project Greenland’s contribution to future sea-level suggests that few models reproduce historical mass loss accurately, and that they appear much too confident in the spread of predicted outcomes. The inability of models to reproduce historical observations raises concerns about the models’ skill at projecting mass loss.
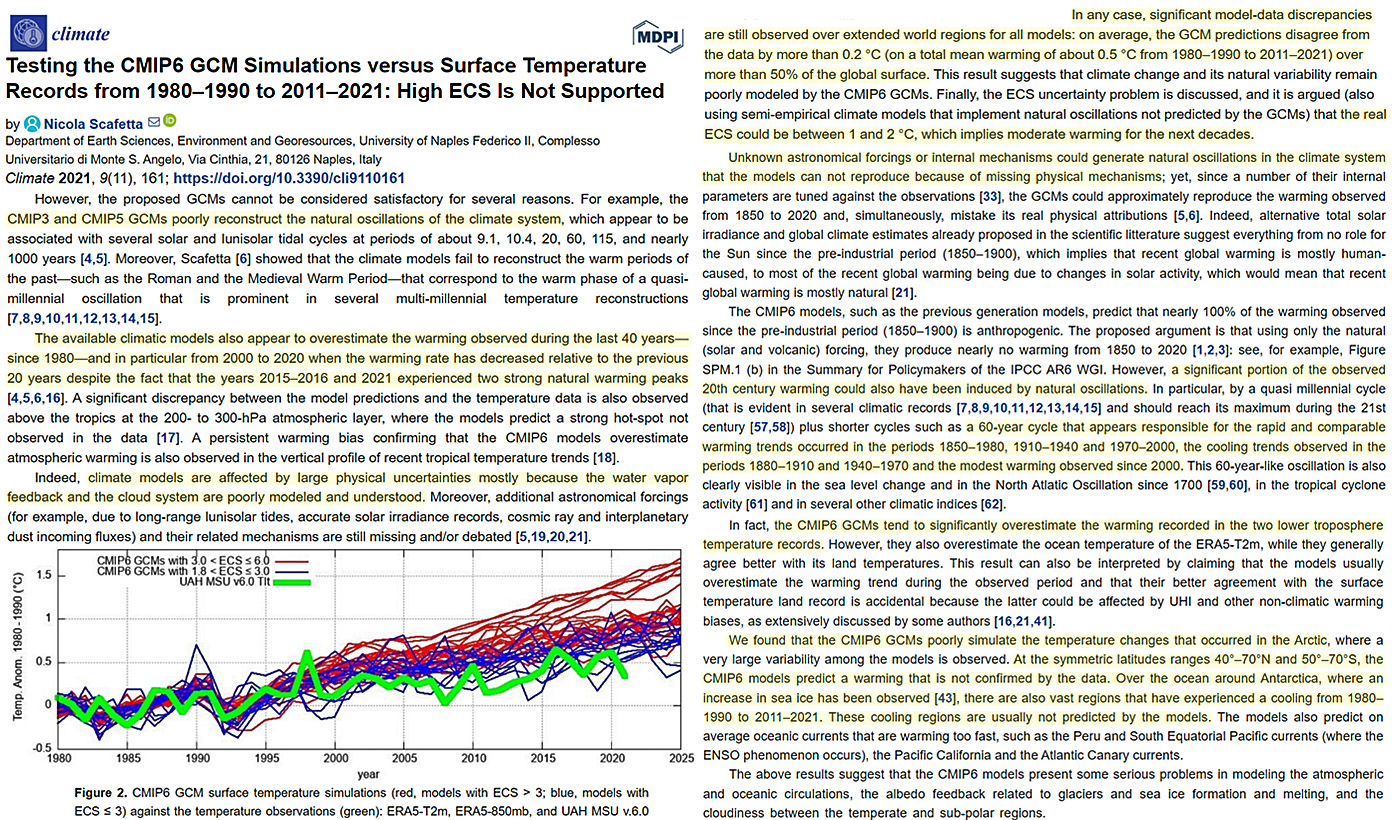
In any case, significant model-data discrepancies are still observed over extended world regions for all models: on average, the GCM predictions disagree from the data by more than 0.2 °C (on a total mean warming of about 0.5 °C from 1980–1990 to 2011–2021) over more than 50% of the global surface. This result suggests that climate change and its natural variability remain poorly modeled by the CMIP6 GCMs. Finally, the ECS uncertainty problem is discussed, and it is argued (also using semi-empirical climate models that implement natural oscillations not predicted by the GCMs) that the real ECS could be between 1 and 2 °C, which implies moderate warming for the next decades. … The available climatic models also appear to overestimate the warming observed during the last 40 years—since 1980—and in particular from 2000 to 2020 when the warming rate has decreased relative to the previous 20 years despite the fact that the years 2015–2016 and 2021 experienced two strong natural warming peaks [4,5,6,16]. A significant discrepancy between the model predictions and the temperature data is also observed above the tropics at the 200- to 300-hPa atmospheric layer, where the models predict a strong hot-spot not observed in the data [17]. A persistent warming bias confirming that the CMIP6 models overestimate atmospheric warming is also observed in the vertical profile of recent tropical temperature trends [18].
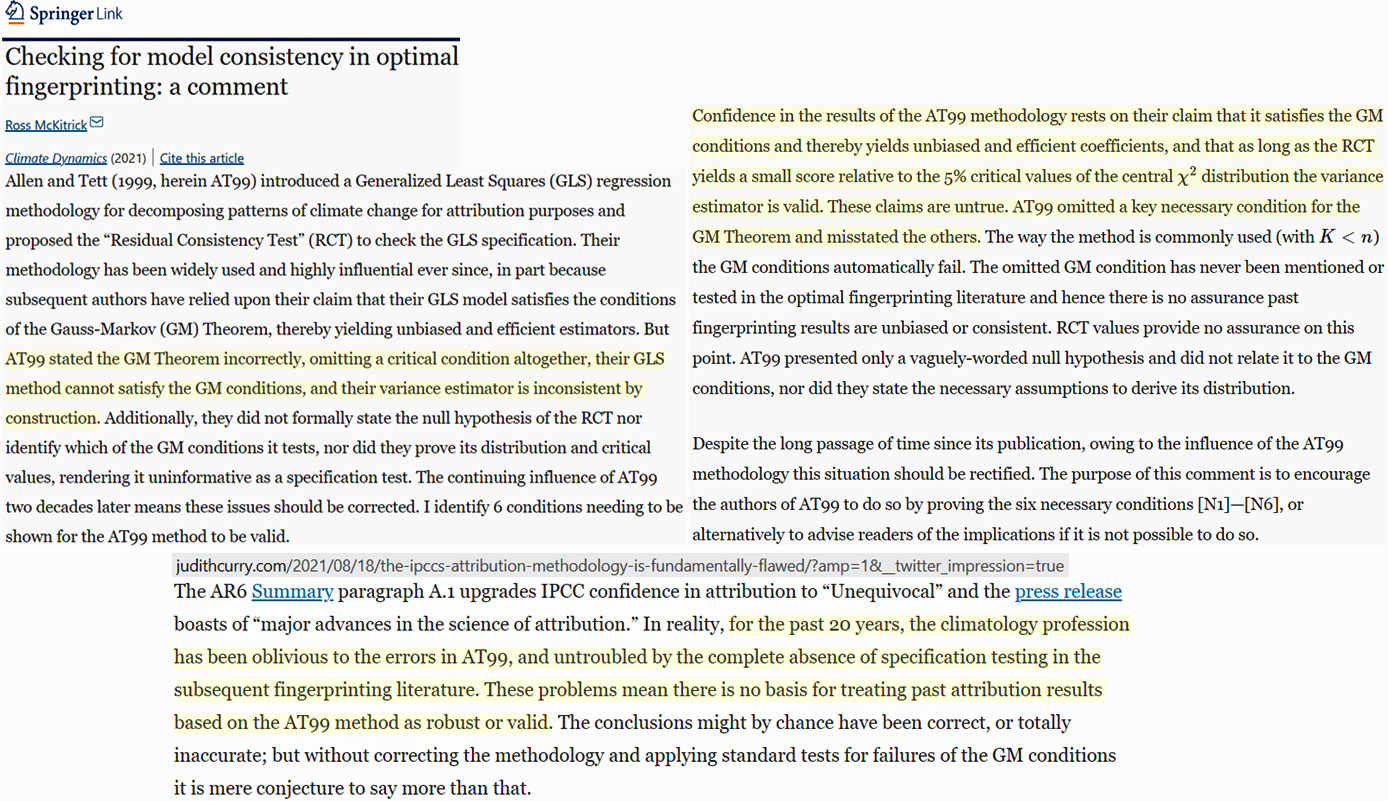
Allen and Tett (1999, herein AT99) introduced a Generalized Least Squares (GLS) regression methodology for decomposing patterns of climate change for attribution purposes and proposed the “Residual Consistency Test” (RCT) to check the GLS specification. Their methodology has been widely used and highly influential ever since, in part because subsequent authors have relied upon their claim that their GLS model satisfies the conditions of the Gauss-Markov (GM) Theorem, thereby yielding unbiased and efficient estimators. But AT99 stated the GM Theorem incorrectly, omitting a critical condition altogether, their GLS method cannot satisfy the GM conditions, and their variance estimator is inconsistent by construction. Additionally, they did not formally state the null hypothesis of the RCT nor identify which of the GM conditions it tests, nor did they prove its distribution and critical values, rendering it uninformative as a specification test. The continuing influence of AT99 two decades later means these issues should be corrected. I identify 6 conditions needing to be shown for the AT99 method to be valid. … Confidence in the results of the AT99 methodology rests on their claim that it satisfies the GM conditions and thereby yields unbiased and efficient coefficients, and that as long as the RCT yields a small score relative to the 5% critical values of the central χ2 distribution the variance estimator is valid. These claims are untrue. AT99 omitted a key necessary condition for the GM Theorem and misstated the others. The way the method is commonly used (with K<n) the GM conditions automatically fail. The omitted GM condition has never been mentioned or tested in the optimal fingerprinting literature and hence there is no assurance past fingerprinting results are unbiased or consistent. RCT values provide no assurance on this point. AT99 presented only a vaguely-worded null hypothesis and did not relate it to the GM conditions, nor did they state the necessary assumptions to derive its distribution.
[F]or the past 20 years, the climatology profession has been oblivious to the errors in AT99, and untroubled by the complete absence of specification testing in the subsequent fingerprinting literature. These problems mean there is no basis for treating past attribution results based on the AT99 method as robust or valid. The conclusions might by chance have been correct, or totally inaccurate; but without correcting the methodology and applying standard tests for failures of the GM conditions it is mere conjecture to say more than that.
A scarcity of hail observations and high-resolution modelling studies, and gaps in the understanding of physical processes, contribute to the current high uncertainty around the effects of climate change on hailstorms worldwide. … General indications based on observations and modelling are of overall hailstorm frequency increasing in Australia, slightly increasing in Europe and decreasing in East Asia and the USA. … Owing to a dearth of long-term observations, as well as incomplete process understanding and limited convection-permitting modelling —–studies, current and future climate change effects on hailstorms remain highly uncertain.
As the atmosphere warms, part of the cloud population shifts from ice and mixed-phase (‘cold’) to liquid (‘warm’) clouds. Because warm clouds are more reflective and longer-lived, this phase change reduces the solar flux absorbed by the Earth and constitutes a negative radiative feedback. This cooling feedback is weaker in the sixth phase of the Coupled Model Intercomparison Project (CMIP6) than in the fifth phase (CMIP5), contributing to greater greenhouse warming. Although this change is often attributed to improvements in the simulated cloud phase, another model bias persists: warm clouds precipitate too readily, potentially leading to underestimated negative lifetime feedbacks. In this study we modified a climate model to better simulate warm-rain probability and found that it exhibits a cloud lifetime feedback nearly three times larger than the default model. This suggests that model errors in cloud-precipitation processes may bias cloud feedbacks by as much as the CMIP5-to-CMIP6 climate sensitivity difference. Reliable climate model projections therefore require improved cloud process realism guided by process-oriented observations and observational constraints.
However, there is no consistent response of increasing Arctic amplification in the early twentieth century warming period during the 1920s–1940s in the CMIP5 models. This indicates the 1920s–1940s Arctic warming was unlikely to happen due to external forcings. Using the large CMIP6 ensemble in the historical experiment we show that the multi-model ensemble mean in the new generation of high-resolution CMIP6 models does not reproduce that warming either, thus posing questions how well the models capture internal climate variability and distinguish it from natural and anthropogenic forcings. This issue ultimately affects the reliability of future Arctic climate projections. … Multi-model ensemble mean does not reproduce early twentieth century Arctic warming. Internal variability is an unresolved contributor to the 1920s–1940s Arctic warming.
Significant underestimation of radiative forcing by aerosol–cloud interactions derived from satellite-based methods … Satellite-based estimates of radiative forcing by aerosol–cloud interactions (RFaci) are consistently smaller than those from global models, hampering accurate projections of future climate change. Here we show that the discrepancy can be substantially reduced by correcting sampling biases induced by inherent limitations of satellite measurements, which tend to artificially discard the clouds with high cloud fraction. Those missed clouds exert a stronger cooling effect, and are more sensitive to aerosol perturbations. By accounting for the sampling biases, the magnitude of RFaci (from −0.38 to −0.59 W m−2) increases by 55% globally (133% over land and 33% over ocean). Notably, the RFaci further increases to −1.09 W m−2 when switching total aerosol optical depth (AOD) to fine-mode AOD that is a better proxy for CCN than AOD. In contrast to previous weak satellite-based RFaci, the improved one substantially increases (especially over land), resolving a major difference with models.
However, in the course of the calculations, LCH01 realized that the clouds themselves were a major factor in the longwave budget, and allowed for water vapor and clouds to be unrelated. This, of course, minimized negative feedbacks (i.e., feedbacks that diminished rather than amplified the response to radiative forcing; conversely, positive feedbacks amplify the response.), which might otherwise be overestimated by a coherent relation of humidity and clouds. Nevertheless, the feedbacks were negative because it was found that high thin cirrus cloud cover, when normalized by a measure of cumulonimbus mass flux, diminished with increases in temperature allowing enhanced cooling. … Much of the rest of LCH01 was devoted to the description and implementation of simple calculations to infer the impact of the iris effect on the climate sensitivity. The limitations of LCH01 were carefully described. Although the iris effect was naturally restricted to the tropics where cumulonimbus convection is a dominant process, the radiative impact of the iris effect was averaged over the globe in order to estimate the impact on climate sensitivity. Again, the details are given in LCH01. The results suggested a very strong negative feedback that would cancel the positive feedbacks in current climate models. LCH01 also showed that the few climate models, then available, differed sufficiently from the observations to overwhelm the uncertainties in the observations. … Sagan and Mullen (1972) noted that according to the standard model of the sun, solar output should have been 20–30% less than today’s between 2 and 3.5 billion years ago (remember that a doubling of CO2 represents only a 2% change in radiative balance.). This should have led to an ice-covered planet, but the geological evidence indicated flowing water and possibly the complete absence of ice. The most commonly proposed solutions involved large quantities of greenhouse gases, but each of these had profound difficulties. For example, the amount of CO2 required was at least ten times greater than permitted by geological evidence from paleosols and other proxies.
The importance of accurate radiative effects of clouds in general circulation models (GCMs) can never be overemphasized. Poor representation of cloud radiation in GCMs tends to produce a biased cloud albedo and greenhouse effect, making their climate predictions far from realistic and thus unbelievable. Although great efforts have been made during the past three decades (Bogenschutz and Krueger 2013; Kuell and Bott 2014), GCMs are still struggling to simulate cloud radiation in a reasonable manner. Aside from the vast challenge of parameterization of subgrid-scale clouds in GCMs, modeling cloud radiation per se remains challenging as well, even though provided with perfect grid-mean cloud properties (i.e., cloud fraction, cloud water/ice content). The problem stems from the fact that cloud radiation depends nonlinearly on cloud properties, which show variability at small scales that are usually unresolved in GCMs.
Satellite SH observes 60 to 120 Wm−2 in the majority of the regions in TP while ERA5 SH observes 0 to 45 Wm−2 for the same regions. … Almost all studies show the decreasing SH in TP [2,6,30,33,34,35]. Despite a decrease in SH, atmospheric temperature over TP is continuously increasing, resulting in climate warming [1,8,27,29,33]. … In this study, the CERES Energy Balance and Filled (EBAF) ED4.1 product under clear sky conditions was used for downward shortwave (SW) and longwave (LW) flux at 1-degree spatial resolution. Surface fluxes are computed from CERES_EBAF_TOA flux using Langly Fu-Liou radiative transfer model [45,46]. Uncertainties in the computed downward SW and LW fluxes under clear-sky conditions are 4 Wm−2 and 6 Wm−2, respectively
[T]he radiative fluxes (longwave and shortwave) from some of the reanalyses show significant discrepancies when compared with the in situ measurements. Longwave radiation from MERRA-2 is biased high (too much oceanic heat loss), and NCEP-2 longwave does not correlate to in situ observations and other reanalyses. Shortwave radiation from NCEP-2 is biased low in winter and does not track the observed variability in summer. The discrepancies in radiative fluxes versus in situ fluxes are explored, and the potential regional implications are discussed using maps of satellite and reanalyses products, including radiation and cloud cover
Distorting the view of our climate future: The misuse and abuse of climate pathways and scenarios … [M]uch of the climate research community is presently off-track from scientific coherence and policy-relevance. Attempts to address scenario misuse within the community have thus far not worked. The result has been the widespread production of myopic or misleading perspectives on future climate change and climate policy. Until reform is implemented, we can expect the production of such perspectives to continue, threatening the overall credibility of the IPCC and associated climate research. However, because many aspects of climate change discourse are contingent on scenarios, there is considerable momentum that will make such a course correction difficult and contested – even as efforts to improve scenarios have informed research that will be included in the IPCC 6th Assessment.
A 30-year reconstruction of the Atlantic meridional overturning circulation shows no decline … Our model has not revealed an AMOC decline indicative of anthropogenic climate change (Stocker et al., 2013) nor the long-term decline reported in sea-surface-temperature-based reconstructions of the AMOC (Caesar et al., 2018). … Recent cold and fresh anomalies in the surface of the North Atlantic subpolar gyre seemed to indicate a return to a cool Atlantic phase associated with a weak AMOC (Frajka-Williams et al., 2017). However, a weakened AMOC was not the primary cause of these anomalies (Josey et al., 2018; Holliday et al., 2020).
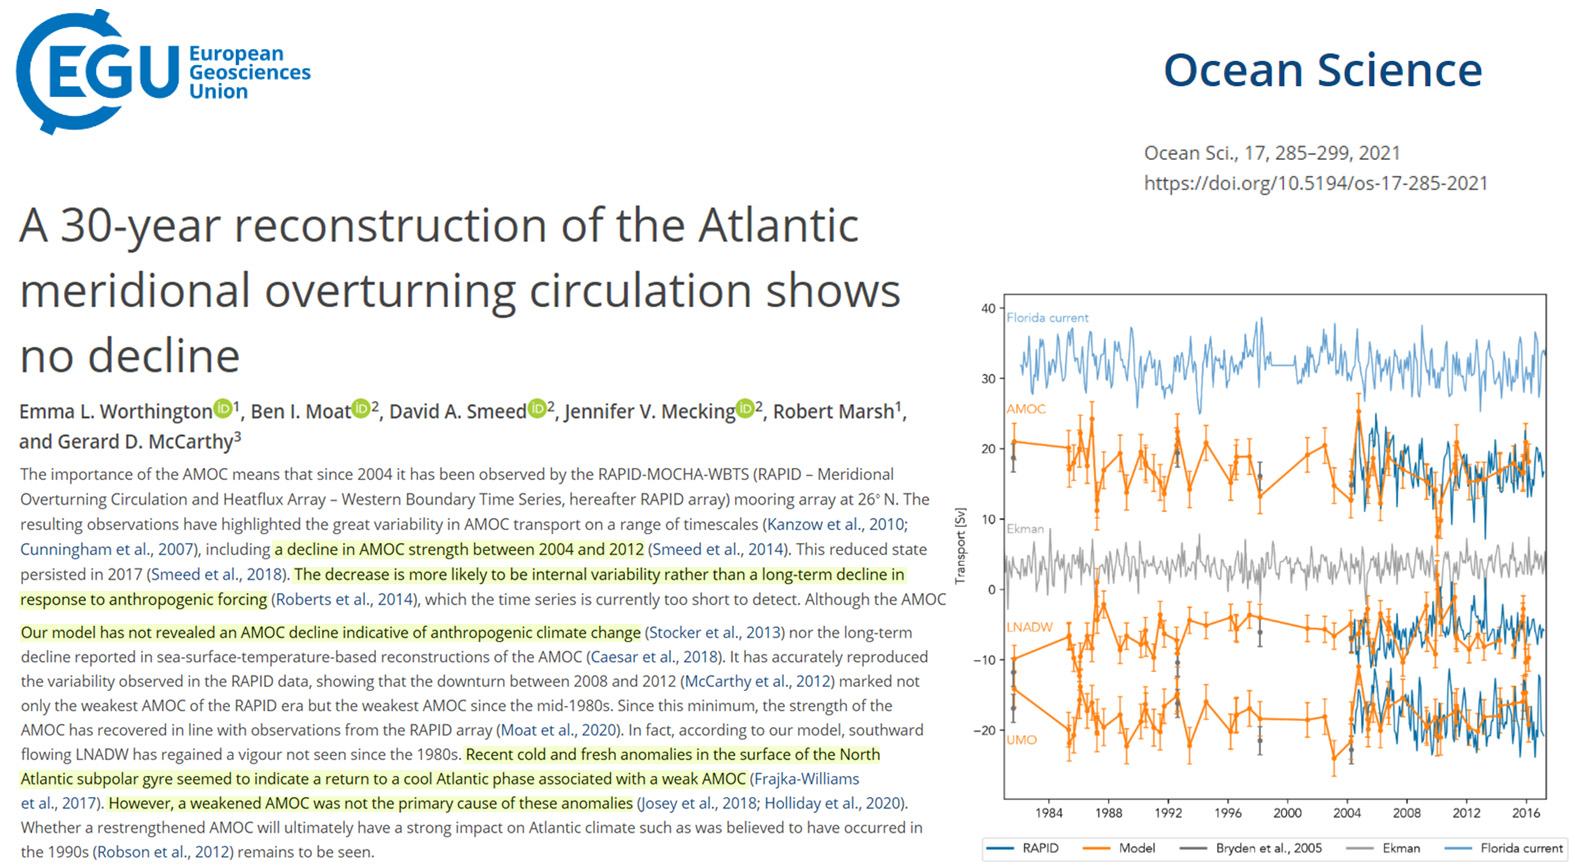
Most general circulation models (GCMs) neglect cloud longwave scattering in pursuit of computational efficiency.
Failing Renewable Energy, Climate Policies
Large‐scale photovoltaic solar farms envisioned over the Sahara desert can meet the world’s energy demand while increasing regional rainfall and vegetation cover. However, adverse remote effects resulting from atmospheric teleconnections could offset such regional benefits. We use state‐of‐the‐art Earth‐system model simulations to evaluate the global impacts of Sahara solar farms. Our results indicate a redistribution of precipitation causing Amazon droughts and forest degradation, and global surface temperature rise and sea‐ice loss, particularly over the Arctic due to increased polarward heat transport, and northward expansion of deciduous forests in the Northern Hemisphere. We also identify reduced El Niño‐Southern Oscillation and Atlantic Niño variability and enhanced tropical cyclone activity. Comparison to proxy inferences for a wetter and greener Sahara ∼6,000 years ago appears to substantiate these results. Understanding these responses within the Earth system provides insights into the site selection concerning any massive deployment of solar energy in the world’s deserts.
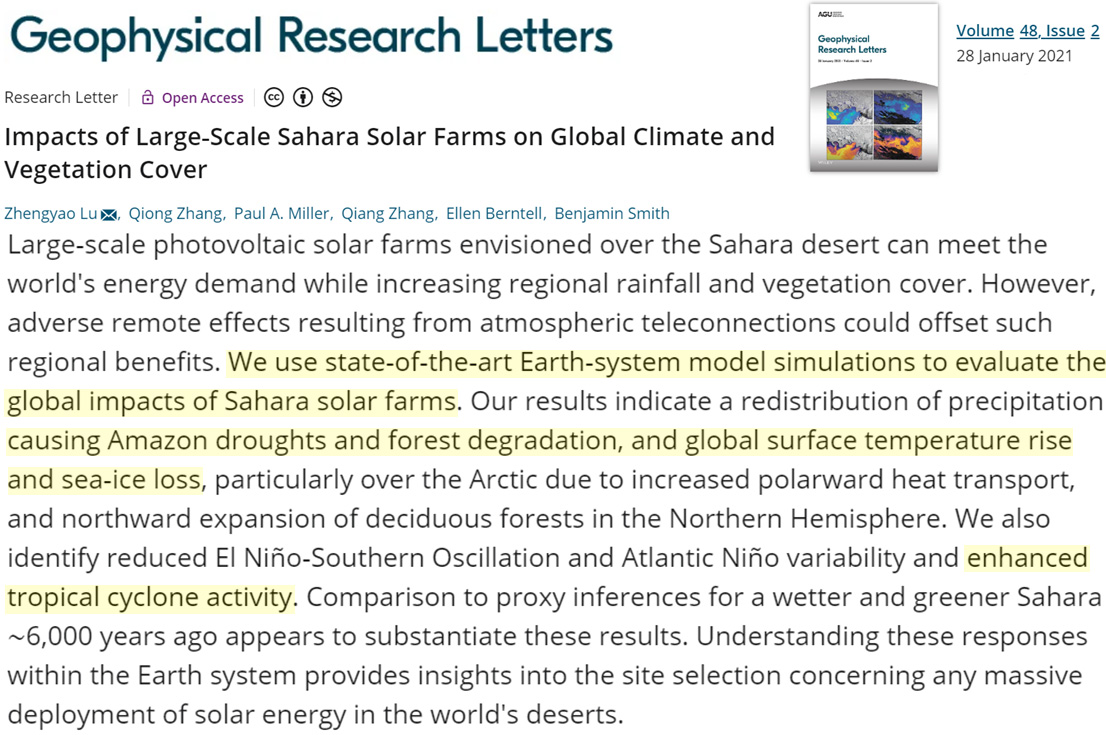
Last week, seven European countries pledged to stop important support for fossil-fuel projects abroad. They join the United States and other European countries in stopping funding for energy infrastructure projects in poor countries that depend on coal, gas and oil. This blanket ban will entrench poverty in regions such as sub-Saharan Africa, but do little to reduce the world’s carbon emissions. … ‘dispatchable’ gas-fuelled generators that are movable would be essential for South Africa to transition to renewable electricity, because wind and solar sources would be too variable as they were scaled up. And there is risk in scaling up too fast — the intermittent supply from a large wind farm in Kenya has made the electrical grid costly to operate. … Most of the legacy emissions causing global warming came from rich countries, which still rely on fossil fuels. It would be the height of climate injustice to impose restrictions on the nations most in need of modern infrastructure and least responsible for the world’s climate challenges.
Given that renewable energy RE growth is considered important for sustainability reasons, renewable energy must be assessed on its ecologically sustainable or ‘green’ energy return, which includes the energy costs of ecosystem maintenance as input energy costs. The green energy return is accordingly much lower than the conventional value, so that ecologically sustainable renewable energy is unlikely to deliver anything near existing global energy use. The paper further argues that such constraints on renewable energy growth rates mean it cannot be a timely response to global climate change. The paper concludes that energy reductions will be essential, mainly in high energy use countries. … Although the various RE sources are promoted as being ecologically sustainable, they, like the other energy sources, can also cause ecological damage over their life cycle. Those for hydroelectricity are well-known, but even wind and solar energy require minerals in short supply for their manufacture [39,40]. … The mining of these minerals can result in ethical problems; in the DR Congo, for example, the world’s leading cobalt producer, children work in the mines [42]. Mining is also often accompanied by serious environmental damage, such as tailings dam failures [43]. Even in high-income countries,the high production of waste such as tailings has become a problem that at the moment does not have concrete solutions in terms of the disposal of this waste. For example, in copper mining, for every ton of copper concentrate obtained, 151 tons of tailings are generated, and in addition, in some cases they are deposited on the seabed, causing environmental damage near the marine coast [44]. …For energy levels at or above the present, wind and solar output must increase by 1–2 orders of magnitude, given that other RE sources can only supply minor amounts.
Given cheaper operating costs, EVs might lead to an increase in the size of cities. Large tracts of land are needed for powering EVs through renewables. Electric vehicles (EVs) are widely regarded as the key to finally making private mobility clean, yet virtually no research is being conducted on their potential contribution to the expansion of impervious surfaces. This study aims to start a discussion on the topic by exploring three relevant issues: the impact of EVs’ operating costs on urban size, the space requirements of charging facilities, the land demand of energy production through renewables. Given cheaper operating costs compared to conventional vehicles, EVs might lead a 100 km2 European city to increase by about 0.2−1 km2 (depending on adoption rate and the fuel price to electricity price ratio) and an equally-large North-American city to increase by about 1−4 km2. Energy production would also have significant impacts, with Europe and the US potentially having to devote up to 5,000–6,000 km2 of land to photovoltaic panels or 56,000–70,000 km2 to wind turbines.
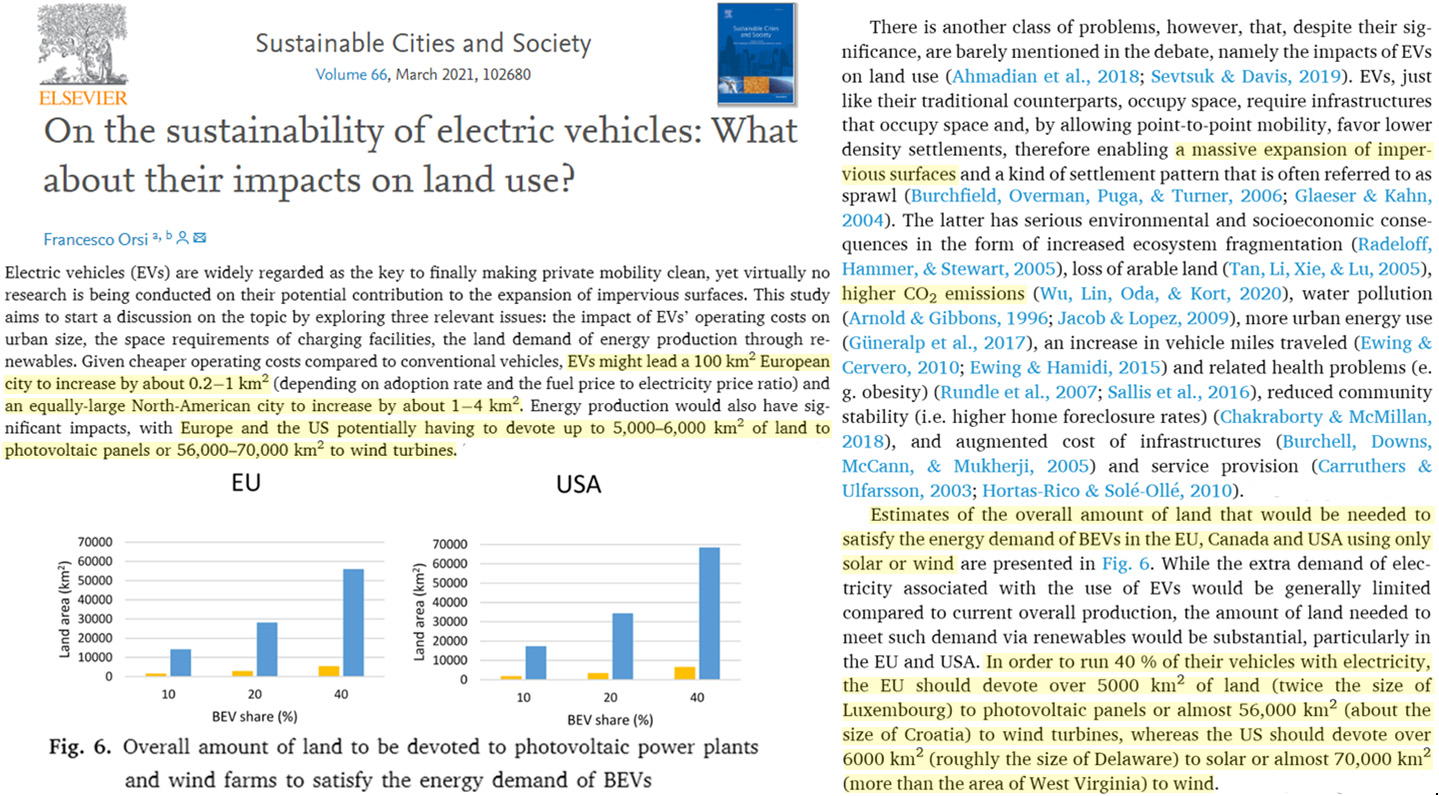
The opportunity to benefit from electric mobility stems from the opportunity to achieve a total primary energy supply (TPES) basically all by wind and solar. Unfortunately, these analyses are built on the rapidly increasing capacity (nominal generating power of wind and solar facilities) such as,4 and not on the achievable share of TPES, that is limited by the intermittency and unpredictability of wind and solar. The world TPES by source 1990-2017 from5 tells us that worldwide, the energy production by solar and wind, plus the negligible geothermal, tide, wave, and the ocean, is still only about 1.8% of the TPES. The solar and wind share of the TPES is still small, despite the dramatically increasing capacities, and not going to improve that much, because of the still unresolved and marginally tackled energy storage issue. Due to the intermittency of both solar and wind, that is the major challenge of renewable energy only economy, even expanding their capacities to extremely larger values, without energy storage, it is not enough.

In 2020, China built over three times as much new coal power capacity as all other countries in the world combined – the equivalent of more than one large coal plant per week. In addition, over 73 gigawatts (GW) of new coal power projects were initiated in China, five times as much as in all other countries, while construction permits for new coal projects also accelerated.
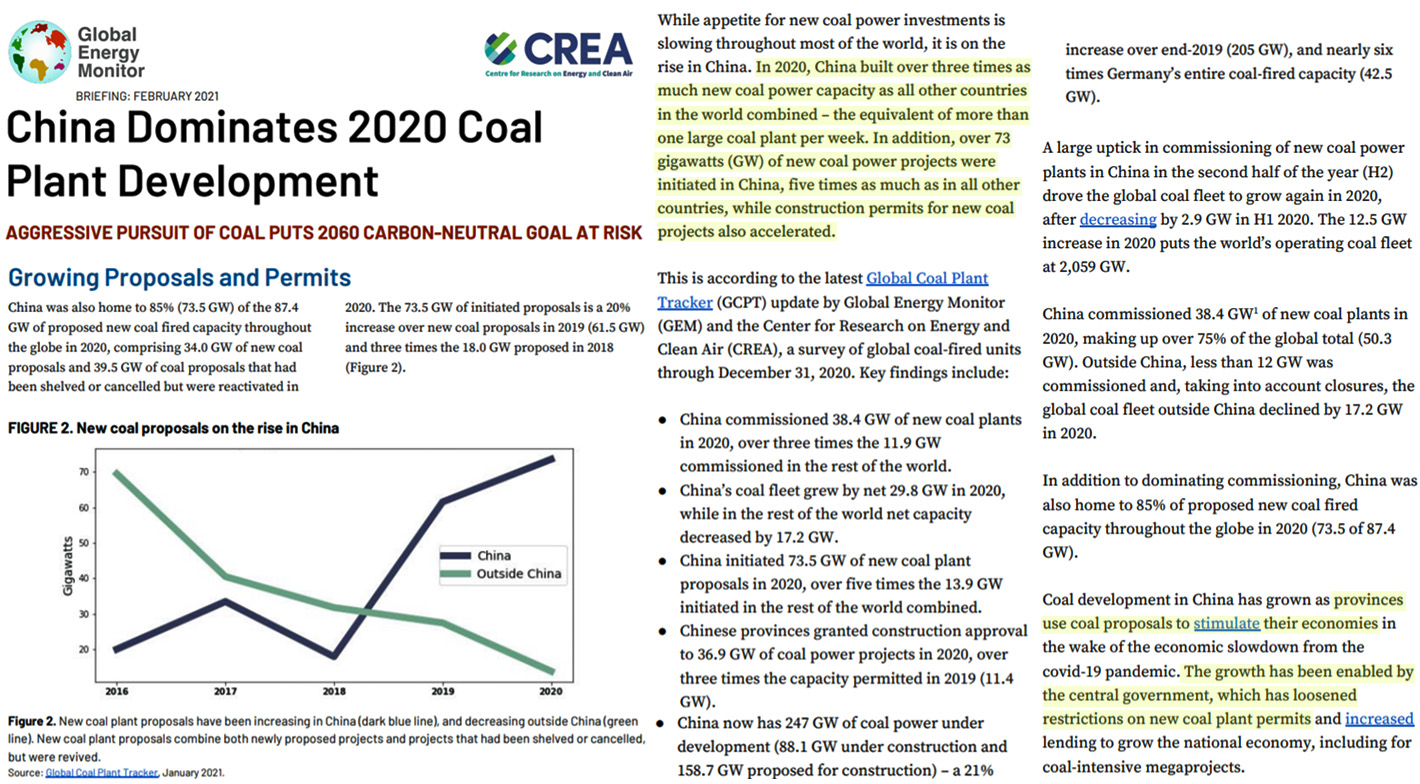
While ice accretion was found to take place over the entire span of the 50-m-long turbine blades, much more ice was found to accrete in the outbound regions of the blades (i.e., near blade tips) than those in the inbound regions (i.e., near blade roots) … The ice layers accreted near blade tips were found to have the maximum thickness, reaching up to 300 mm after the case with a turbine undergoing a 30.6-hourlong icing event. … Despite the high wind, iced wind turbines were found to rotate much slower and even shut down frequently during the icing event, with the icing-induced power loss being up to 80%.
Wind turbine blades spinning through cold, wet conditions can collect ice nearly a foot thick on the yard-wide tips of their blades. That disrupts blade aerodynamics. That disrupts the balance of the entire turbine. And that can disrupt energy production by up to 80 percent, according to a recently published field study led by Hui Hu, Iowa State University’s Martin C. Jischke Professor in Aerospace Engineering and director of the university’s Aircraft Icing Physics and Anti-/De-icing Technology Laboratory.
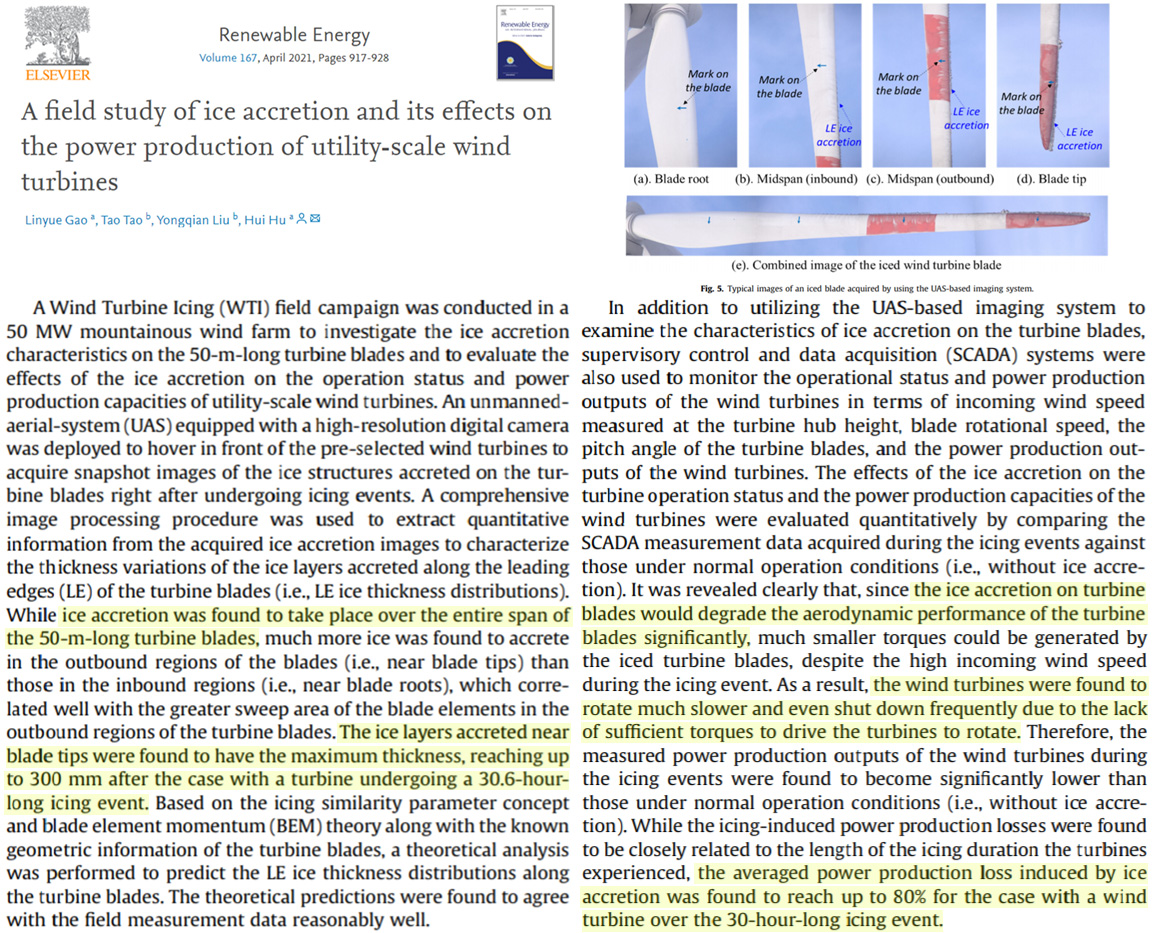

Corals Thrive In Warm, High CO2 Environments
Compared with the average Sr/Ca-SST of the 1990s, the Sr/Ca-SST between 6800 and 5000 B.P. was 0.9 ◦C–0.5 ◦C higher. A warmer climate makes the mid-Holocene an optimum coral growth period when corals grew abundantly (Clark et al., 2018; Yan et al., 2019). … During the period 3434–4568 B.P., the climate was colder than 6.8–5.0 ka B.P., but there were numerous coral bleaching episodes. … It is therefore plausible that coral bleaching caused by thermal stress has been repeated over the long-term scale of the mid-late Holocene period and severe or prolonged coral bleaching events can lead to massive coral death. This suggests that the mid-late Holocene coral thermal bleaching events are a natural response to abnormal temperature.
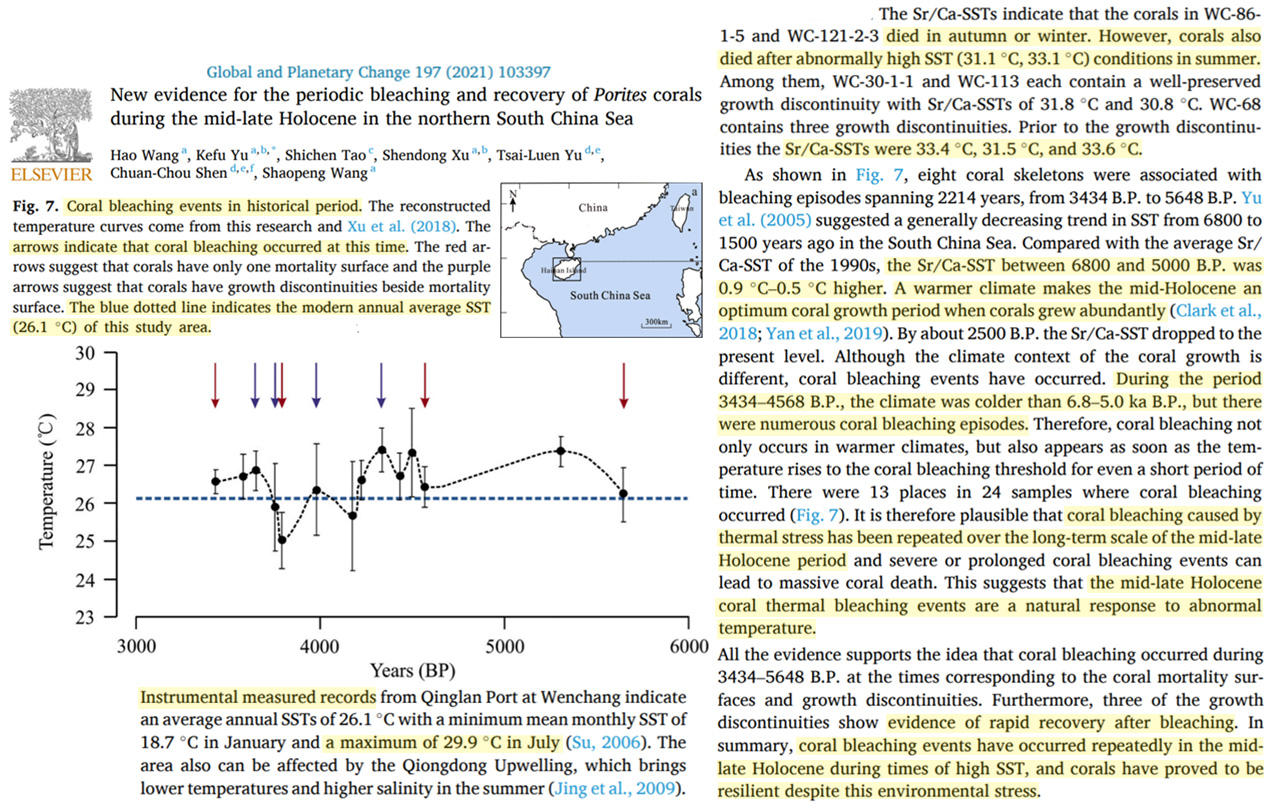
We analyse foraminiferal shell geochemical compositions, from Recent surface sediments and Marine Isotope stage (MIS) 9e and MIS11c aged sediments, from the International Ocean Discovery Program Expedition 359 Site U1467 drilled in the Inner Sea of the Maldives. We illustrate through traditional (pooled) geochemical analysis (δ18O, Mg/Ca) that tropical temperatures were indeed marginally warmer during MIS9e and MIS11c in comparison to the modern ocean. Individual foraminiferal analysis (IFA) from the Recent (representing the last few hundred years) and MIS9e samples shows SSTs occasionally breached the coral bleaching threshold similarly to the modern-day. Significantly, the number of transgressions was four times higher during MIS11c, a recognised analogue for a warmer modern world.
It is widely believed that coral bleaching is a phenomenon first observed less than 50 years ago. However, coral bleaching was first observed more than 150 years ago by Eugen von Ransonnet, during the period called the little ice age (ca. 1300 – ca. 1900). … Yonge already in 1931 found that living corals on the Great Barrier Reef were bleached after being exposed to high temperature (Oliver et al. 2009; Yonge and Nicholls 1931), and Kamenos and Hennige (2018) recorded the traces of coral bleaching in coral rock cores from the Great Barrier Reef back to 1575. So, coral bleaching is a phenomenon that always has existed as a normal way of adaptation to changing water temperatures, and is not a modern phenomenon. … Such coral bleaching during the last decades is reported particularly from marginal lower-temperature areas of the entire distribution area of hermatypic corals (Goreau and Hayes 1994; Oliver et al. 2009; Burke et al. 2011). On the other hand it is generally not, or to a much lower extent, reported from the central area, the so-called Coral Triangle (Oliver et al. 2009; Burke et al. 2011; Ridd 2017), where the water temperature is around 2–8 °C higher and more stable than in the marginal areas (Tchernia 1980; Tomczak and Godfrey 2002).

Our analysis suggests that approximately half a trillion corals (0.3 × 10¹²–0.8 × 10¹²) inhabit these coral reefs, similar to the number of trees in the Amazon. Two-thirds of the examined species have population sizes exceeding 100 million colonies, and one-fifth of the species even have population sizes greater than 1 billion colonies. Our findings suggest that, while local depletions pose imminent threats that can have ecologically devastating impacts to coral reefs, the global extinction risk of most coral species is lower than previously estimated.
“Given the huge size of these coral populations, it is very unlikely that they face imminent extinction.”
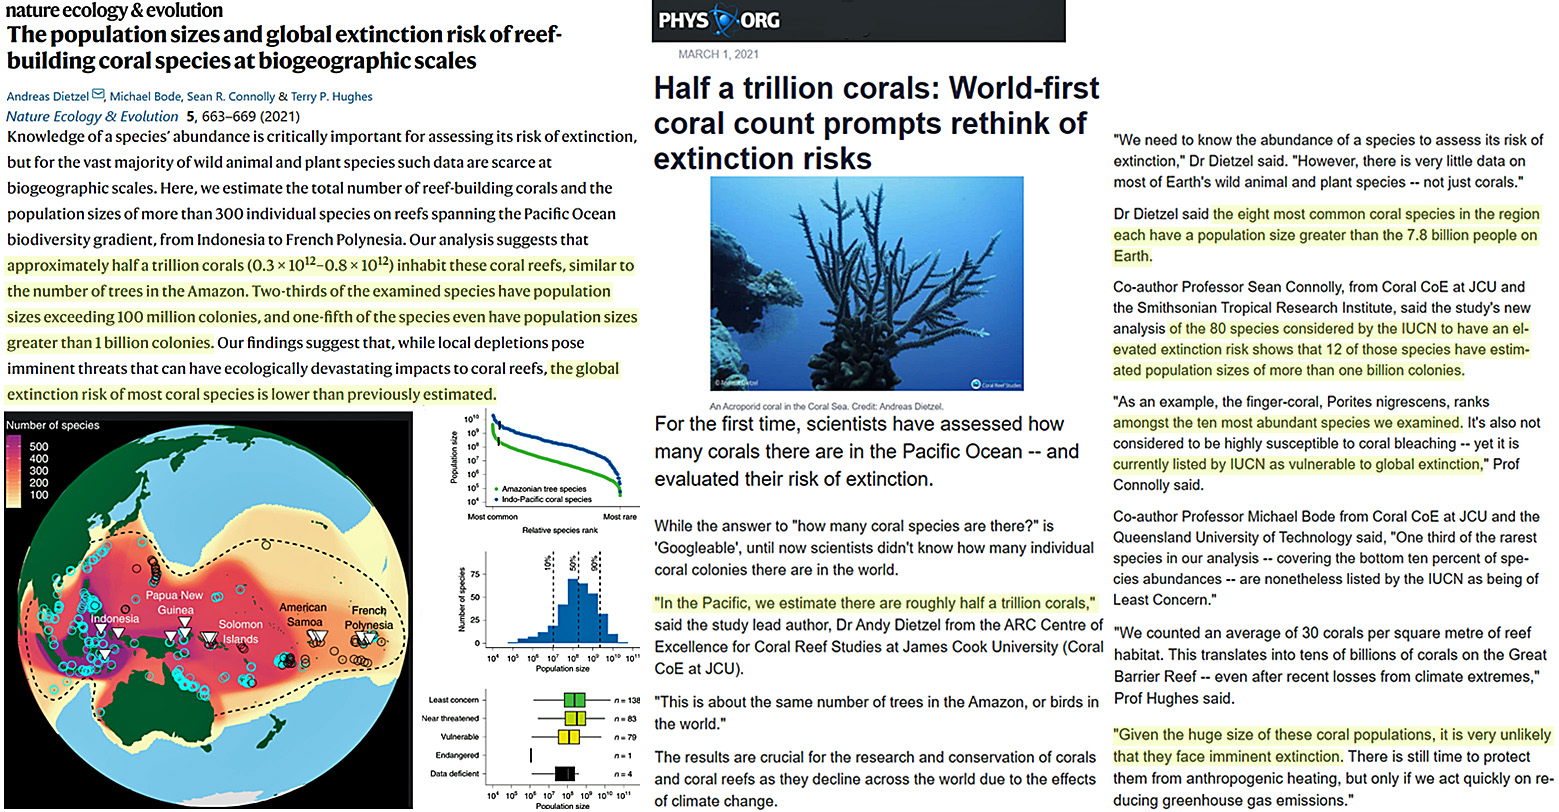
Elevated CO2, Warmth, Does Not Harm The Biosphere
Our results showed significantly shorter immature durations and higher pre‐adult survival rate under elevated CO2 (1,000 ppm) than those under ambient CO2 (400 ppm). The population of R. pedestris reared under elevated CO2 conditions showed higher intrinsic and finite rates of increase but a lower mean generation time than R. pedestris reared under ambient CO2 conditions. Our results show the population parameters and growth of R. pedestris are influenced by increased CO2 relative to ambient CO2 treatment.
Our analyses imply that the temperature tipping point when the impact of future warming shifts from positive to negative on the TP is greatly overestimated by current vegetation models. Future research needs to include varying thermal and CO2 acclimation effects on Topt across different time scales in vegetation models.
These results suggest that increased winter minimum temperature substantially mitigates the growth decline in juniper forests on the TP. As the minimum temperature generally occurs at night, we conclude that the asymmetric increase in nighttime temperature has decreased the incidence of juniper forest growth decline on the TP under climate warming. This alleviating effect of nighttime warming is likely due to reduced low-temperature constraints and reduced damage to tree growth.
The latitude of polar bear observations increased significantly and more bear sightings occurred in central areas along the coast of Spitsbergen and, north and east of Nordaustlandet. This corresponds well with findings of a study by Lone et al. (2018) that reported that the average number of days with suitable habitat related to sea ice for polar bears had increased in these areas during 2011– 15 compared to 1992–96.
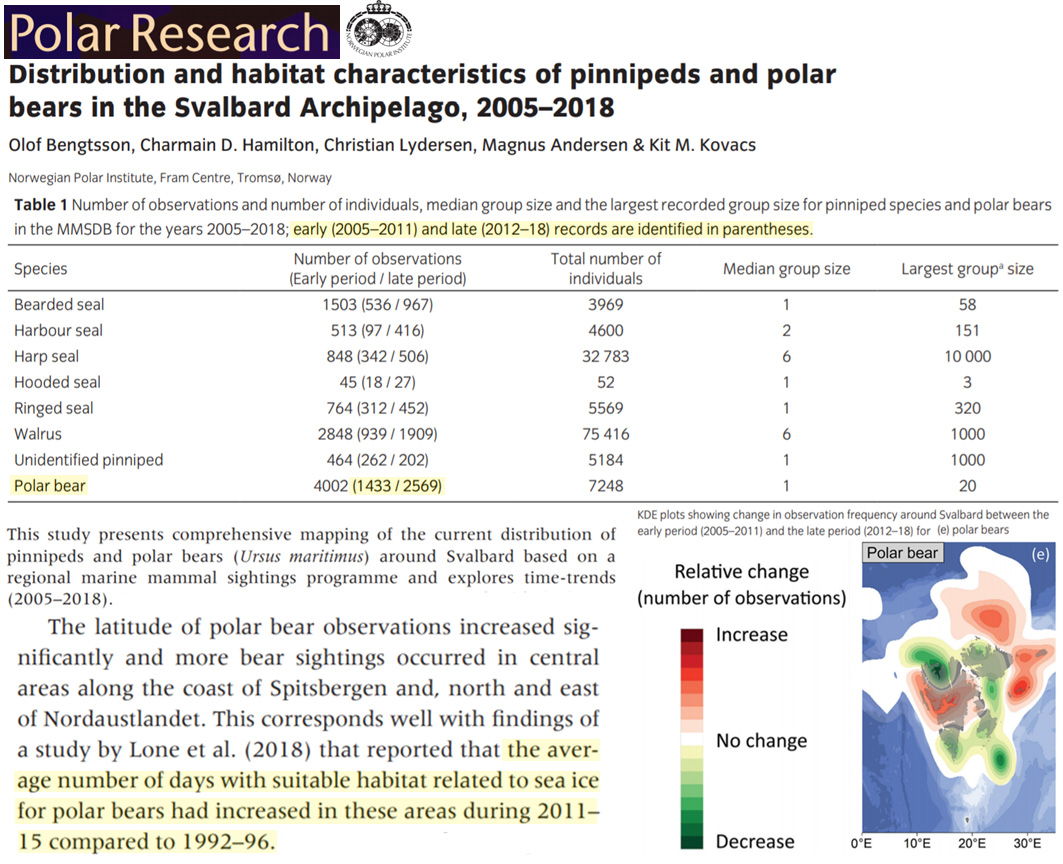
Neoglacial cooling caused wide abandonment of penguin colonies on the Scott Coast by increased sea ice and/or snow/ice cover … sedimentological evidence from Cape Ross deduced the permanent snow/ice cover at ∼1700 yr BP, which is consistent with a Neoglacial cooling period on the Scott Coast. We suggest that Neoglacial cooling caused the widespread abandonment of penguin colonies on the Scott Coast, by the increased coastal sea ice and/or snow/ice accumulation.
The most recent assessment concluded that the total population increased from a minimum of 1.15 (SD=0.090) million seals in 1971 to a maximum of 7.82 (SD=0.806) million animals in 2008, then declined to 7.45 (SD=0.698) million seals in 2012 (Fig. 2) (Hammill et al. 2015).
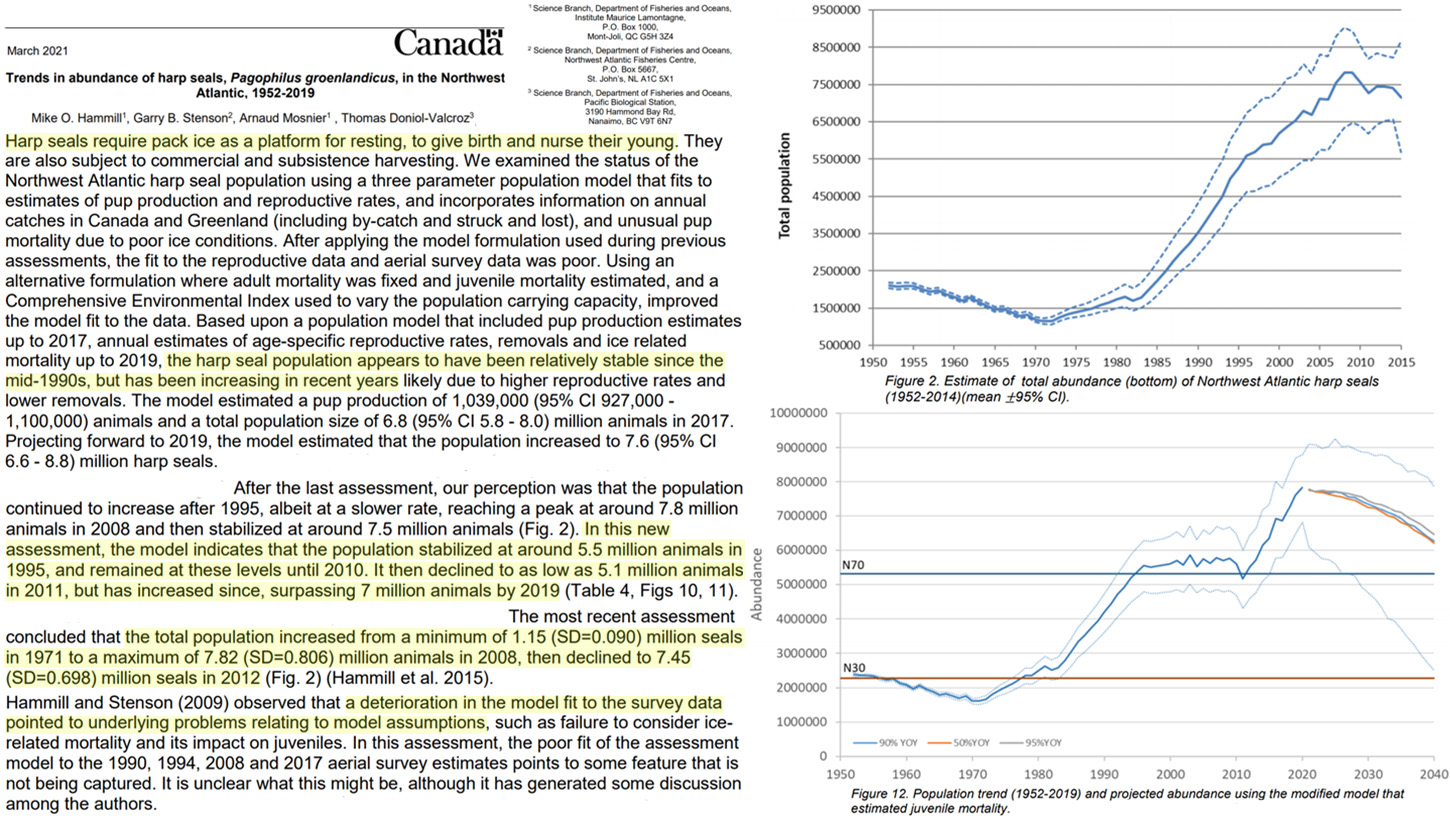
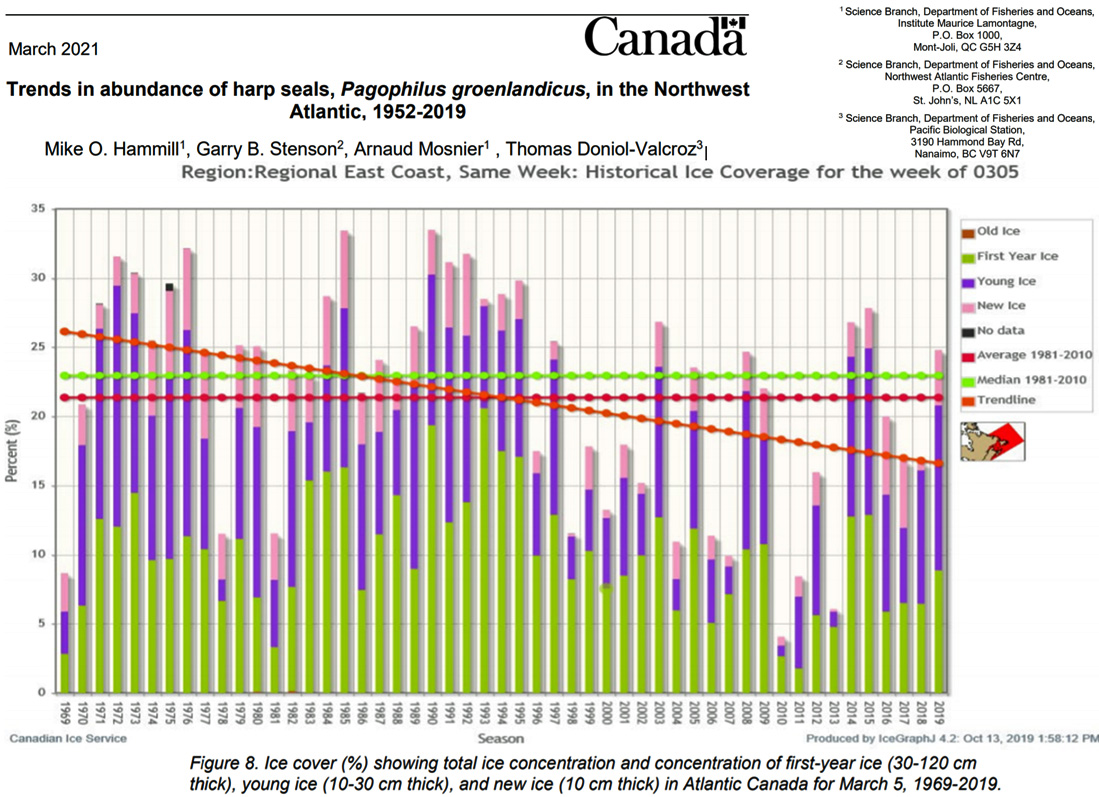
Significant reductions in sea ice in the Pacific Arctic have occurred over the last 2 decades. Comparing the results of similarly conducted studies, but from different time periods, can increase our understanding of how marine mammals are responding to this change. We modeled the habitat selection and movement behavior of juvenile bearded seals Erignathus barbatus tagged with satellite transmitters in the Bering, Chukchi, and Beaufort seas during 2014-2018, a period of rapid decline in sea ice cover. We compared our results to an earlier study of juvenile bearded seals tagged in the Chukchi Sea during 2004-2009, a period of relatively stable sea ice coverage, and found differences. Seals in the earlier period strongly selected habitat near the ice edge and intermediate ice concentrations (50-60%) in both winter and spring. Seals in the later period strongly selected habitat away from the ice edge, showed no selection for any ice concentration in winter, and weakly selected low ice concentrations in spring (<50%). The likely explanation for these differences is changes in sea ice habitat because the shift away from the ice edge corresponds with a shift in the distribution of intermediate ice concentrations that seals prefer. During the later period, seals still used intermediate ice, which occurred farther from the ice edge and was now the average ice concentration available to them, masking any preference for intermediate ice in the habitat selection model. This change in sea ice conditions, although significant, may not currently be detrimental for juvenile bearded seals.
Results showed modern walruses have similar cortisol concentrations to the archaeological walruses suggesting that current environmental conditions have not elevated stress-related hormone concentrations. September sea ice extent had a weak correlation to the stress biomarker cortisol, indicating the physiological stress response of walruses is not strongly associated with changes in sea ice extent.
Elevated CO2: Greens Planet, Higher Crop Yields
During the study period, VSC showed an overwhelmingly positive impact on annual total GPP (i.e., 39.2 Tg C yr−1, P<0.001), followed by the fertilization effect of rising CO2 (i.e., 11.9 Tg C yr−1, P<0.001). However, climate variation would be expected to have an overall negative effect (i.e., -9.9 Tg C yr−1, P<0.001), which is primarily related to the decline of the incoming solar radiation over this period. Consequently, China’s GPP showed a remarkable upward trend (i.e., 40.5 Tg C yr−1, P<0.001) during the study period. Our study highlighted the strong positive GPP contribution from VSC, which is mainly related to forest increase under the background of forest cover changes primarily from widespread forest conservation and restoration programs implemented in China since the late 1990s. Therefore, our study suggests that forest conservation and restoration could effectively increase terrestrial ecosystem GPP, despite the negative effects of climate change.
Substantial land surface greening has been observed globally over the last few decades. This greening has been primarily attributed to climate change and CO2 concentrations, but recent research studies have emphasized the large role of human land use in this process, especially agricultural land abandonment (ALA). The aim of this study was to investigate whether long-term gradual greening of agricultural land can aid in mapping abandoned land across Poland. Trend estimation and temporal segmentation were applied to the 1986–2019 annual Landsat-derived Normalized Difference Vegetation Index (NDVI) time series to detect periods of long-term greening and to assess its relationship with actual information on ALA. The results show that long-term greening is widespread in Poland (covering up to 60% of its territory), regardless of former and current land uses, most of which has stemmed from modifications within stable land use classes (as they cover 91% of Poland). The highest greening rates and intensities were observed due to conversions from agricultural to non-agricultural land use, which strongly suggests land abandonment and the proceeding succession.
In the present study, we quantitatively investigated the linkages between the normalized difference vegetation index (NDVI) and weather disturbances in spring (April and May) over Siberia for the period 1982–2015. … The results show that corresponding to the largest variance increase, for Siberia as a whole, the number of frost days has increased by 0.9 days (5%) and the accumulated adverse temperature has undergone a substantial increase of 18.9°C·day (15%). These results suggest that when there are active weather disturbances, the simultaneous increase in extremely cold temperatures plays a dominant role in adversely impacting vegetation activity. Our study demonstrates that, in addition to the increased mean temperature, the long-term decrease in weather disturbances over Siberia, as observed in recent decades, should also contribute significantly to vegetation greening. This finding promotes a further understanding of the impacts of climate change on regional vegetation activity.
The greening of the planet observed in recent decades has been attributed to a combination of CO2 fertilization, an alteration of nitrogen (N) cycles due to increasing N deposition, and climate and land-use changes (Song et al., 2018; Zhu et al., 2016).
The results suggest that the Mongolian Plateau experienced vegetation greening from 1982 to 2015. Precipitation and animal density were the most influential factors contributing to higher NDVI on the grasslands of Inner Mongolia and Mongolia. Our results highlight the dominant effect of climate variability, and especially of the precipitation variability, on the grassland greenness in Mongolian drylands.
Thirty-eight years of CO2 fertilization have outpaced growing aridity to drive greening of Australian woody ecosystems … CO2 fertilization has also been cited as one of the drivers of the widespread ‘greening’ phenomenon. However, attributing the size of this CO2 fertilization effect is complicated, due in part to a lack of long-term vegetation monitoring and interannual to decadal-scale climate variability. In this study we asked the question, how much has CO2 contributed towards greening? We focused our analysis on a broad aridity gradient spanning eastern Australia’s woody ecosystems. Next we analysed 38-years of satellite remote sensing estimates of vegetation greenness (normalized difference vegetation index, NDVI) to examine the role of CO2 in ameliorating climate change impacts. Multiple statistical techniques were applied to separate the CO2-attributable effects on greening from the changes in water supply and atmospheric aridity. Widespread vegetation greening occurred despite a warming climate, increases in vapor pressure deficit, and repeated record-breaking droughts and heatwaves. Between 1982–2019 we found that NDVI increased (median 11.3 %) across 90.5 % of the woody regions. After masking disturbance effects (e.g. fire), we statistically estimated an 11.7 % increase in NDVI attributable to CO2, broadly consistent with a hypothesized theoretical expectation of an 8.6 % increase in water-use-efficiency due to rising CO2. In contrast to reports of a weakening CO2 fertilization effect, we found no consistent temporal change in the CO2 effect. We conclude rising CO2 has mitigated the effects of increasing aridity, repeated record-breaking droughts, and record-breaking heat waves in eastern Australia.
Enhanced drought resistance of vegetation growth in cities due to urban heat, CO2 domes and O3 troughs … Using 75 urban-rural paired plots from three climate zones over the conterminous United States (CONUS), we find vegetation in urban areas exhibits a much stronger resistance to drought than in rural areas. Statistical analysis suggests the drought resistance enhancement of urban vegetation across CONUS is attributed to rising temperature (with a partial correlation coefficient of 0.36) and CO2 (with a partial correlation coefficient of 0.31) and reduced O3 concentration (with a partial correlation coefficient of −0.12) in cities. The controlling factor(s) responsible for urban-rural differences in drought resistance of vegetation vary across climate regions, such as surface O3 gradients in the arid climate, and surface CO2 and O3 gradients in the temperate and continental climates. Thus, our study provides new observational insights on the impacts of competing factors on vegetation growth at a large scale, and ultimately, helps reduce uncertainties in understanding terrestrial carbon dynamics.
Vegetation structural change and CO2 fertilization more than offset gross primary production decline caused by reduced solar radiation in China … Terrestrial gross primary production (GPP) is the largest carbon flux from the atmosphere to the terrestrial ecosystems. However, how GPP dynamics respond to vegetation structural change (VSC), climate change, and rising CO2 concentration are still unclear. In this study, we developed a process-based model (i.e., Farquhar GPP Model) to characterize GPP dynamics in China from 2001 to 2016, and further identify the dominant drivers for GPP variation related to VSC, climate change, and rising atmospheric CO2 through model scenario design. During the study period, VSC showed an overwhelmingly positive impact on annual total GPP (i.e., 39.2 Tg C yr−1, P<0.001), followed by the fertilization effect of rising CO2 (i.e., 11.9 Tg C yr−1, P<0.001). However, climate variation would be expected to have an overall negative effect (i.e., -9.9 Tg C yr−1, P<0.001), which is primarily related to the decline of the incoming solar radiation over this period. Consequently, China’s GPP showed a remarkable upward trend (i.e., 40.5 Tg C yr−1, P<0.001) during the study period.
Accelerated rate of vegetation green‐up related to warming at northern high latitudes. … The increasing trend in North America was mostly because of increased heat accumulation in spring (1.2% mon−1 decade−1), that is, more rapid green-up owing to warming, with an increased carbon dioxide concentration (0.6 mon−1 decade−1). The trend in Eurasia, however, was induced by warming, increased carbon dioxide concentration, and stronger radiation, 1.0%, 0.7%, and 0.5% mon−1 decade−1, respectively, but was partly counteracted by earlier pregreen-up dates of −1.2% mon−1 decade−1, that is, earlier initiation of growth which counteracted green-up rate acceleration. The results suggested that warming was the predominant factor influencing the accelerated RVG at high latitudes
The CO2 enrichment at the concentration of 1000 [ppm] induced greater growth and accumulation of dry mass, in addition to increasing the photosynthetic rate.
Future agricultural management programs should consider the responsiveness of crops to increasing atmospheric CO2 concentrations ([CO2]) and temperatures. Eddo is an important tuber crop widely grown in Asia, but its response to [CO2] and temperatures remains largely unknown. We investigated the responses of eddo and rice plants to elevated [CO2] (ambient [CO2] + 200 µmol mol−1) at low and high temperatures during the early-to-intermediate growth stage in temperature gradient chambers in 2018 and 2019. The dry weights (DWs) of the eddo leaf blades, petioles, roots, and above-ground parts as well as the DWs of the rice leaf blades, leaf sheaths and stems, above-ground parts, and whole plants significantly increased under elevated [CO2]. The number of leaves, leaf area, and SPAD value of eddo significantly increased under elevated [CO2], whereas the leaf area and SPAD value of rice did not. The net photosynthetic rate of eddo and rice tended to increase under elevated [CO2]. The increasing ratio of the total DW in elevated vs ambient [CO2] was significantly higher for eddo than for rice. The result indicates that elevated [CO2] increases the eddo biomass more than the rice biomass, possibly because of the increasing eddo leaf area and SPAD value induced by elevated [CO2]. The total DW of rice increased significantly in response to the high air temperature under elevated [CO2] conditions. However, the effect of [CO2] on the total DW of eddo was similar at both temperatures, reflecting the non-significant interaction between [CO2] and temperature.
Despite being evolved in shaded environments, most coffee (Coffea arabica L.) is cultivated worldwide under sparse shade or at full sunlight. Coffee is ranked as greatly responsive to climate change (CC), and shading has been considered an important management strategy for mitigating the harmful CC outcomes on the crop. However, there is no information on the effects of enhanced [CO2] (eCa) on coffee performance in response to light availability. Here, we examined how carbon assimilation and use are affected by eCa in combination with contrasting light levels. For that, greenhouse-grown plants were submitted to varying light levels (16 or 7.5 mol photons m−2 day−1) and [CO2] (ca. 380 or 740 [ppm] air) over six months. We demonstrated that both high light and eCa [enhanced [CO2]] improved growth and photosynthetic performance, independently. Despite marginal alterations in biomass partitioning, some allometric changes, such as higher root biomass-to-total leaf area and lower leaf area ratio under the combination of eCa and high light were found. Stimulation of photosynthetic rates by eCa occurred with no direct effect on stomatal and mesophyll conductances, and no signs of photosynthetic down-regulation were found irrespective of treatments. Particularly at high light, eCa led to decreases in both photorespiration rates and oxidative pressure. Overall, our novel findings suggest that eCa [enhanced [CO2]] could tandemly act with shading to mitigate the harmful CC effects on coffee sustainability.
Climate change has increasing effects on horticultural crops. To investigate the impact of CO2 and temperature at elevated levels on tomato production and quality of fruits an experiment was conducted by growing plants in open top chambers. The tomato plants were raised at EC550 (elevated CO2 at 550 ppm) and EC700 (elevated CO2 at 700 ppm) alone and in combination with elevated temperature (ET) + 2 °C in the open top chambers. These elevated CO2 and temperature treatment effects were compared with plants grown under ambient conditions. Outcome of the experiment indicated that growth parameters namely plant stature in terms of height (152.20 cm), leaf number (158.67), canopy spread (6127.70 cm2), leaf area (9110.68 cm2) and total dry matter (223.0 g/plant) were found to be high at EC700 compared to plants grown at ambient conditions in open field. The plants grown at EC700 also exhibited significantly higher number of flowers (273.80) and fruits (261.13), more fruit weight (90.46 g) and yield (5.09 kg plant−1) compared to plants grown at ambient conditions in open field. The percent increase in fruit yield due to EC varied from 18.37 (EC550) to 21.41 (EC700) percent respectively compared to open field … These findings reveal that CO2 at 700 ppm would be a better option to improve both quantitative as well as qualitative traits in tomato. … The present study clearly demonstrates that the climate change in terms of increased temperature and CO2 will have a positive effect on tomato by way of increase in production and quality of fruits.
Almost all elevated atmospheric CO2 concentrations (eCO2) studies have not addressed the potential responses of plant growth to different CO2 in daytime and nighttime. The present study was to determine the impact of daytime and/or nighttime eCO2 on growth and quality of mulberry (Morus alba L.), a perennial multipurpose cash plant. Six-month-old mulberry seedlings were hence grown in environmentally auto-controlled growth chambers under four CO2 concentrations: (1) ambient CO2 (ACO2, 410 μmol mol–1 daytime/460 μmol mol–1 nighttime), (2) sole daytime elevated CO2 (DeCO2, 710 μmol mol–1/460 μmol mol–1), (3) sole nighttime elevated CO2 (NeCO2, 410 μmol mol–1/760 μmol mol–1), and (4) continuous daytime and nighttime elevated CO2 (D + NeCO2, 710 μmol mol–1/760 μmol mol–1). Plant growth characteristics, nutrient uptake, and leaf quality were then examined after 120 days of CO2 exposure. Compared to control, DeCO2 and (D + N)eCO2 [elevated CO2, 710 ppm] increased plant biomass production and thus the harvest of nutrients and accumulation of leaf carbohydrates (starch, soluble sugar, and fatty acid) and N-containing compounds (free amino acid and protein)
Despite knowledge of the interaction between climate change factors significant uncertainty exists concerning the individual and interactive effects of elevated carbon dioxide (eCO2) and elevated temperature (eT) on the soil microbiome and function. Here we examine the individual and interactive effects of eCO2 and eT on tree growth, soil respiration (Rsoil), biomass, structural and functional composition of microbial community, nitrogen (N) mineralisation and N availability in a whole tree chamber experiment. Eucalyptus globulus plants were grown from seedling to ca. 10 m tall for 15 months in a nutrient-poor sandy soil under ambient and elevated (+ 240 ppm) atmospheric CO2 concentrations combined with ambient or elevated temperatures (+ 3 °C) in a full factorial design. Plant growth was strongly stimulated under eCO2, but eT had little impact on any measured plant property.
So far, the phytotoxic hazards of nano-sized mercuric oxide (HgO-NPs) are not investigated. Herein, the phytotoxicity of fully characterized HgO-NPs (100 mg/kg soil), prepared by coprecipitation method, on maize grown under ambient (aCO2, 410 ppm) and elevated CO2 (eCO2, 620 ppm) was investigated. Regardless of CO2 concentration, HgO-NPs treatment increased Hg levels in maize organs. HgO-NPs induced severe oxidative stress in aCO2 grown plants as indicated by reduced growth and photosynthesis and accumulation of reactive oxygen species (ROS), through photorespiration and nicotinamide adenine dinucleotide phosphate (NADPH) oxidase activities, and lipid and protein oxidation products. Although HgO-NPs increased molecular (polyphenols, flavonoids, tocopherols) and enzymatic (superoxide dismutase, catalase, peroxidase, ascorbate peroxidase, glutathione peroxidase) antioxidants in shoots of aCO2 plants, but this failed to fight the eruption of increased ROS. On contrary, eCO2 treatment mitigated the HgO-NPs impact by promoting photosynthesis and reducing the Hg-induced ROS production. Moreover, eCO2 promoted ROS detoxification via molecular antioxidants overproduction, enhanced superoxide dismutase, catalase and peroxidases activities, and modulation of reduced ascorbate/oxidized ascorbate and reduced glutathione/oxidized glutathione homeostasis. The combined HgO-NPs + eCO2 treatment also enhanced the glutathione-S-transferase activity. This study suggests that HgO-NPs cause severe phytotoxic hazards and this effect will be less detrimental under future CO2 climate.
Wang et al. reported a large decrease in CO2 fertilization effect (CFE) across the globe during the period 1982–2015 … We find that their claims are artifacts of incorrect processing of satellite data and problematic methods
The rising atmospheric CO2 concentration leads to a CO2 fertilization effect on plants—that is, increased photosynthetic uptake of CO2 by leaves and enhanced water-use efficiency (WUE). Yet, the resulting net impact of CO2 fertilization on plant growth and soil moisture (SM) savings at large scale is poorly understood. Drylands provide a natural experimental setting to detect the CO2 fertilization effect on plant growth since foliage amount, plant water-use and photosynthesis are all tightly coupled in water-limited ecosystems. A long-term change in the response of leaf area index (LAI, a measure of foliage amount) to changes in SM is likely to stem from changing water demand of primary productivity in water-limited ecosystems and is a proxy for changes in WUE. Using 34-year satellite observations of LAI and SM over tropical and subtropical drylands, we identify that a 1% increment in SM leads to 0.15% (±0.008, 95% confidence interval) and 0.51% (±0.01, 95% confidence interval) increments in LAI during 1982‒1998 and 1999‒2015, respectively. The increasing response of LAI to SM has contributed 7.2% (±3.0%, 95% confidence interval) to total dryland greening during 1999‒2015 compared to 1982‒1998. The increasing response of LAI to SM is consistent with the CO2 fertilization effect on WUE in water-limited ecosystems, indicating that a given amount of SM has sustained greater amounts of photosynthetic foliage over time.
We find consistent greening trends of the yearly LAI mean in the whole world: Asia (35% of overall global greening), Europe (32.5%), North America (13.3%), Africa (12.6%), South America (6%), and Australia (0.5%). These trends are detected mostly in the northern hemisphere (Figure 1). These greening patterns are consistent with those detected in other recent studies such as C. Chen, Park, et al. (2019); we detect the same greening patterns and, additionally, several more. … Using the mean or the median to aggregate yearly values can impact the results. Both mean and median detect similar greening regions, but browning is only detected when using the median (Figure 3). While the mean detects greening in ∼16.6 million km2 (273,247 grid cells) of the land surface and no browning, the median detects greening in ∼15.8 million km2 (258,385 grid cells) and browning in 1.1 million km2 (26,241 grid cells) of the land surface. Two browning patterns arise when using the yearly median: one in Siberia and one in Canada.
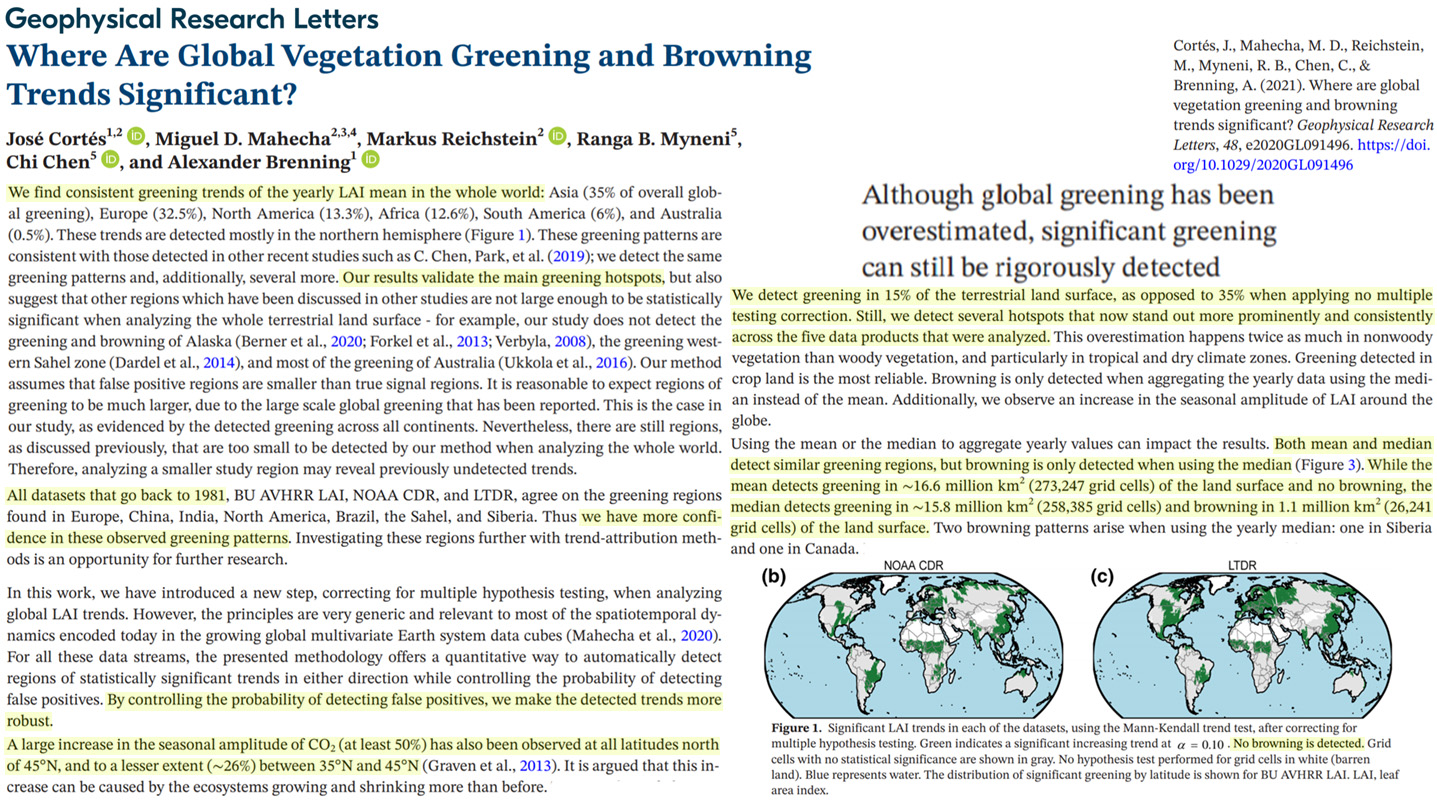
Vegetation greening in more than 94% of the Yellow River Basin (YRB) region in China during the 21st century caused jointly by warming and anthropogenic activities
Here we propose a unique system taking carbon dioxide (CO2) from indoor spaces and applying it to rooftop gardens or farms through existing ventilation systems with the elevated CO2 levels leading to a fertilization effect that increases plant growth. CO2 measurements were taken inside multiple classrooms as well as at the exhaust vents on a rooftop and air from exhaust was applied to crops and biomass and leaf number were measured. High concentrations of CO2 ([CO2]) persisted inside university classrooms as well as at rooftop exhaust vents in correlation with expected human occupancy and stayed around 1070 ± 70 and 830 parts per million (ppm) CO2 reaching a max of 4470 and 1300 ppm CO2 respectively. Growth in Spinacia oleraceae L. (spinach) grown next to exhaust air increased 4-fold in comparison to plants grown next to a control fan applying atmospheric air.
In lowland evergreen forests, most studies indicate that vegetation is greening because of CO 2 fertilization (Piao et al., 2020; Zhu et al., 2016) … The tropics are greening, but little is known about greening patterns in the tropical Andes. Using Normalized Difference Vegetation Index (NDVI) data on monthly and annual bases, this research analyzes greening across Ecuador from 1982–2010. Findings indicate overall significant greening after the mid ’90s with distinct seasonal variations across regions. In the Amazon greening occurs during months of low precipitation, resulting in a prolonged growing season and higher NDVI peak from the ’80s to the 2000s.
Recent studies [49,50] argue that C4 plants benefit from elevated CO2 indirectly by the interaction of decreased gs and water stress, that is, the drought stress is mitigated by rising CO2-induced higher water use efficiency. … Elevated CO2 stimulates carboxylation reactions and inhibits oxygenation reaction, promoting the process of photosynthesis. However, the affinity of Rubisco for CO2 and the solubility of CO2 (relative to O2) decrease with increasing temperature, thus the increase in temperature will promote photorespiration [48]. The stimulating effect of elevated CO2 on photosynthesis increases with the rising temperature, and CO2 fertilization has a stronger effect with high temperature.
Wilhelm Pfeffer pointed out that, at ca. 0.03 vol% CO2 (in 1900), photosynthesis is sub-optimal. Accordingly, due to human activities, anthropogenic CO2 released into the atmosphere promotes plant growth and crop yield. We have reproduced Pfeffer’s classical experiments on the role of CO2 with respect to plant development, and document that exhaled air of a human (ca. 4 vol% CO2) strongly promotes growth. We conclude that Pfeffer not only acted as a key figure in the establishment of experimental plant physiology. He was also the discoverer of the phenomenon of CO2-mediated global greening and promotion of crop productivity, today known as the “CO2-fertilization-effect”. These topics are discussed with reference to climate change and the most recent findings in this area of applied plant research.
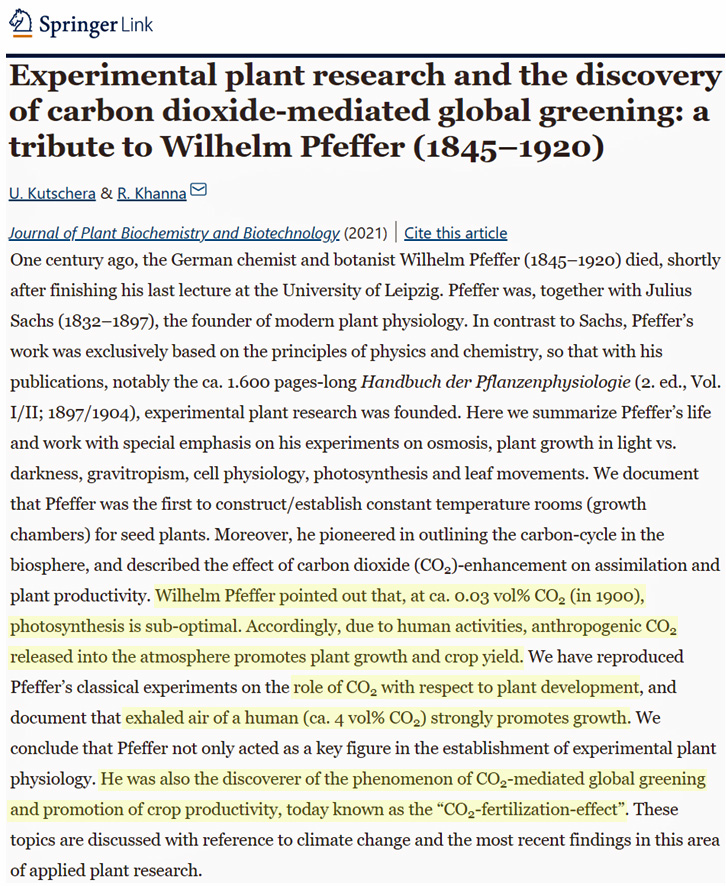
Global Warming Reduces Mortality. Cold Kills.
Heat and cold exposure were identified to be associated with increased risk of cardiovascular and respiratory mortality. Heat was not found to have an impact on hospital admissions. The estimated fraction of mortality attributable to cold was of greater magnitude in hospitalizations (17.5% for cardiovascular and 12.5% for respiratory diseases) compared to deaths (9% and 2.7%, respectively).
This study provides evidence about mortality attributable to non-optimal temperatures in adults aged 65 and over in Sofia, Bulgaria, between 2000 and 2017. We quantified the relationship between the daily mean temperature and mortality in the total elderly adult population aged 65 and over, among males and females aged 65 and over, as well as individuals aged 65–84 and 85 years or older. We used a distributed lag non-linear model with a 25-day lag to fully capture the effects of both cold and hot temperatures and calculated the fractions of mortality attributable to mild and extreme hot and cold temperatures. Cold temperatures had a greater impact on mortality than hot temperatures during the studied period. Most of the temperature-attributable mortality was due to moderate cold, followed by moderate heat, extreme cold, and extreme heat.
In 2019, the average cold-attributable mortality exceeded heat-attributable mortality in all countries for which data were available. … 8372 deaths…were attributable to cold and 452 deaths…were attributable to heat in South Africa in 2019.
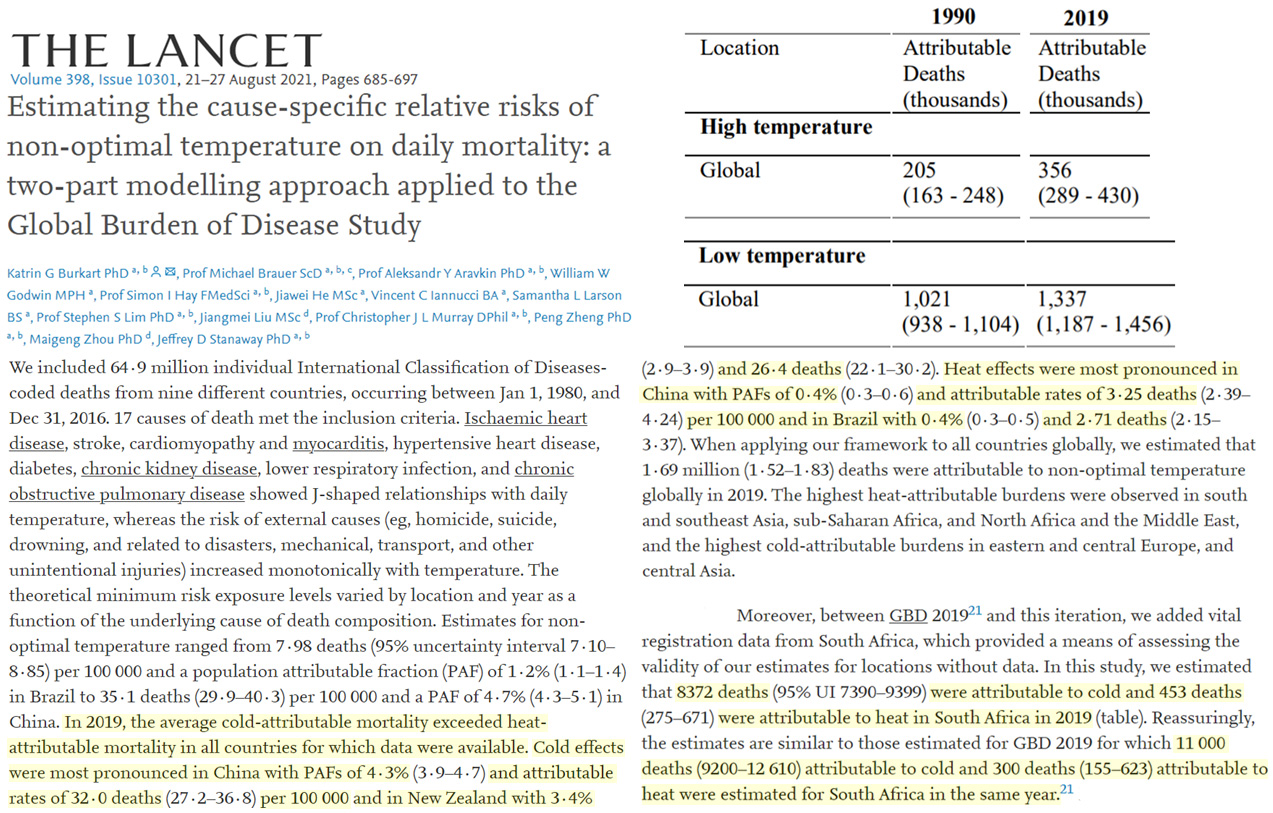
This paper presents an analysis of fatalities attributable to weather conditions in the Czech Republic during the 2000–2019 period. … The analysis is performed for floods, windstorms, convective storms, rain, snow, glaze ice, frost, heat, and fog. For each of them, the associated fatalities are investigated in terms of annual frequencies, trends, annual variation, spatial distribution, cause, type, place, and time as well as the sex, age, and behaviour of casualties. There were 1164 weather-related fatalities during the 2000–2019 study period, exhibiting a statistically significant falling trend. Those attributable to frost (31 %) predominated, followed by glaze ice, rain, and snow. Fatalities were at their maximum in January and December and at their minimum in April and September. Fatalities arising out of vehicle accidents (48 %) predominated in terms of structure, followed by freezing or hypothermia (30 %). … According to the database of the Czech Statistical Office, deaths caused by exposure to excessive natural cold are markedly predominant among five selected groups of weather-related fatalities, and their numbers exhibit a statistically significant rise during 2000–2019.
In general, 6.90% (95% confidence interval (CI): 4.62%, 9.18%) of YLLs [years of life lost] could be attributed to non-optimum temperatures at the national level, with differences across different regions, ranging from 5.36% (95% CI: −3.36%, 6.89%) in east region to 9.09% (95% CI: −5.55%, 23.73%) in northwest region. For each deceased person, we estimated that non-optimum temperature could cause a national-averaged 1.02 years (95% CI: 0.68, 1.36) of life loss, with a significantly higher effect due to cold exposure (0.89, 95% CI: 0.59, 1.19) than that of hot exposure (0.13, 95% CI: 0.09, 0.16).
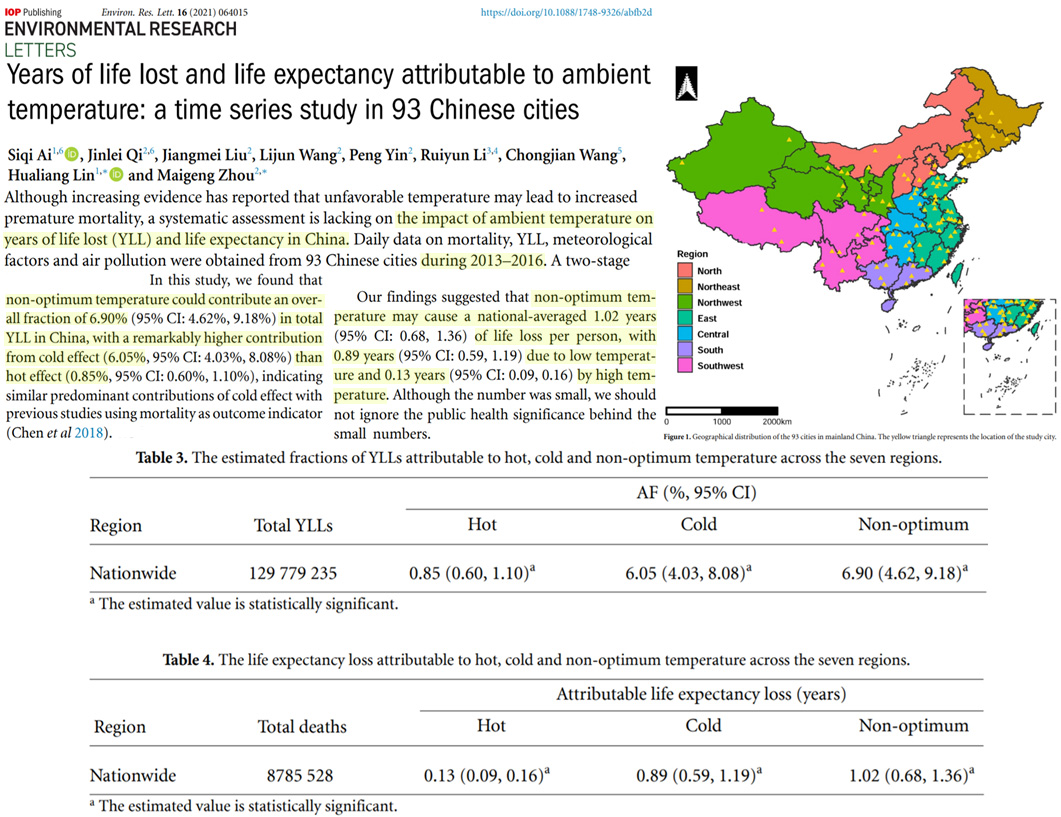
Life loss of cardiovascular diseases per death attributable to ambient temperature: A national time series analysis based on 364 locations in China … This study examines the health effects of non-optimal temperature, and quantify temperature-related life loss per death. Life loss per CVD death attributable to non-optimal temperatures was 1.51. Most [1.07 (95% eCI: 1.00, 1.15) years] of temperature-related life loss of CVD was attributed to moderate cold.
Although numerous studies have investigated premature deaths attributable to temperature, effects of temperature on years of life lost (YLL) remain unclear. We estimated the relationship between temperatures and YLL, and quantified the YLL per death caused by temperature in China. We collected daily meteorological and mortality data, and calculated the daily YLL values for 364 locations (2013–2017 in Yunnan, Guangdong, Hunan, Zhejiang, and Jilin provinces, and 2006–2011 in other locations) in China. A time-series design with a distributed lag nonlinear model was first employed to estimate the location-specific associations between temperature and YLL rates (YLL/100,000 population), and a multivariate meta-analysis model was used to pool location-specific associations. Then, YLL per death caused by temperatures was calculated. The temperature and YLL rates consistently showed U-shaped associations. A mean of 1.02 (95% confidence interval: 0.67, 1.37) YLL per death was attributable to temperature. Cold temperature caused 0.98 YLL per death with most from moderate cold (0.84).
Urbanization Artificially Adds To Warming Trend
Changes in land use, especially urbanization, alter the biophysical properties of Earth’s surface, which in turn affects local climate and even contributes to global warming. … Using the ensemble mean of eight temperature reanalysis datasets as background climate, along with in situ observations from 2353 meteorological stations, here we analyze the warming effects of land use changes in China between 1980 and 2015. Results show that OMR trends from land use changes collectively reached +0.100, +0.098, and +0.146 °C/decade for annual mean, maximum, and minimum temperature, contributing approximately 1/4 to 1/3 of overall observed warming trends, and stronger contributions were observed in the three largest urban agglomerations (i.e., Jing-Jin-Ji, the Yangtze River Delta, and the Pearl River Delta). The spatial distribution of OMR trends shows a great deal of heterogeneity that is closely related to impervious surface (positively) and vegetation cover (negatively). Warming trends induced by land use changes (including urbanization) present evident diurnal asymmetry (stronger for minimum than maximum) and vary with season (greater in winter/spring than in summer/autumn) and generally increase over time. Our results highlight that observed warming trends in China were likely influenced substantially by land use changes, especially in highly urbanized areas.
Based on the classification of rural and urban stations, the global and regional land annual mean and extreme temperature indices series over 1951–2018 for all stations and rural stations were calculated, and the urbanization effects and the urbanization contribution of global land annual mean and extreme temperature indices series are quantitatively evaluated using the difference series between all stations and the rural stations. The results showed that the global land annual mean time series for mean temperature and most extreme temperature indices experienced statistically significant urbanization effects. The urbanization effects in the mean and extreme temperature indices series generally occurred after the mid-1980s, and there were significant differences of the magnitudes of urbanization effects among different regions. The urbanization effect on the trends of annual mean and extreme temperature indices series in East Asia is generally the strongest, which is consistent with the rapidly urbanization process in the region over the past decades, but it is generally small in Europe during the recent decades.
Fires
Fire has a long history in Australia and is a key driver of vegetation dynamics in the tropical savanna ecosystems that cover one quarter of the country. Fire reconstructions are required to understand ecosystem dynamics over the long term but these data are lacking for the extensive savannas of northern Australia. This paper presents a multiproxy palaeofire record for Marura sinkhole in eastern Arnhem Land, Northern Territory, Australia. The record is constructed by combining optical methods (counts and morphology of macroscopic and microscopic charcoal particles) and chemical methods (quantification of abundance and stable isotope composition of pyrogenic carbon by hydrogen pyrolysis). This novel combination of measurements enables the generation of a record of relative fire intensity to investigate the interplay between natural and anthropogenic influences. The Marura palaeofire record comprises three main phases: 4600–2800 cal BP, 2800–900 cal BP and 900 cal BP to present. Highest fire incidence occurs at ~4600–4000 cal BP, coinciding with regional records of high effective precipitation, and all fire proxies decline from that time to the present. 2800–900 cal BP is characterised by variable fire intensities and aligns with archaeological evidence of occupation at nearby Blue Mud Bay. All fire proxies decline significantly after 900 cal BP. The combination of charcoal and pyrogenic carbon measures is a promising proxy for relative fire intensity in sedimentary records and a useful tool for investigating potential anthropogenic fire regimes.
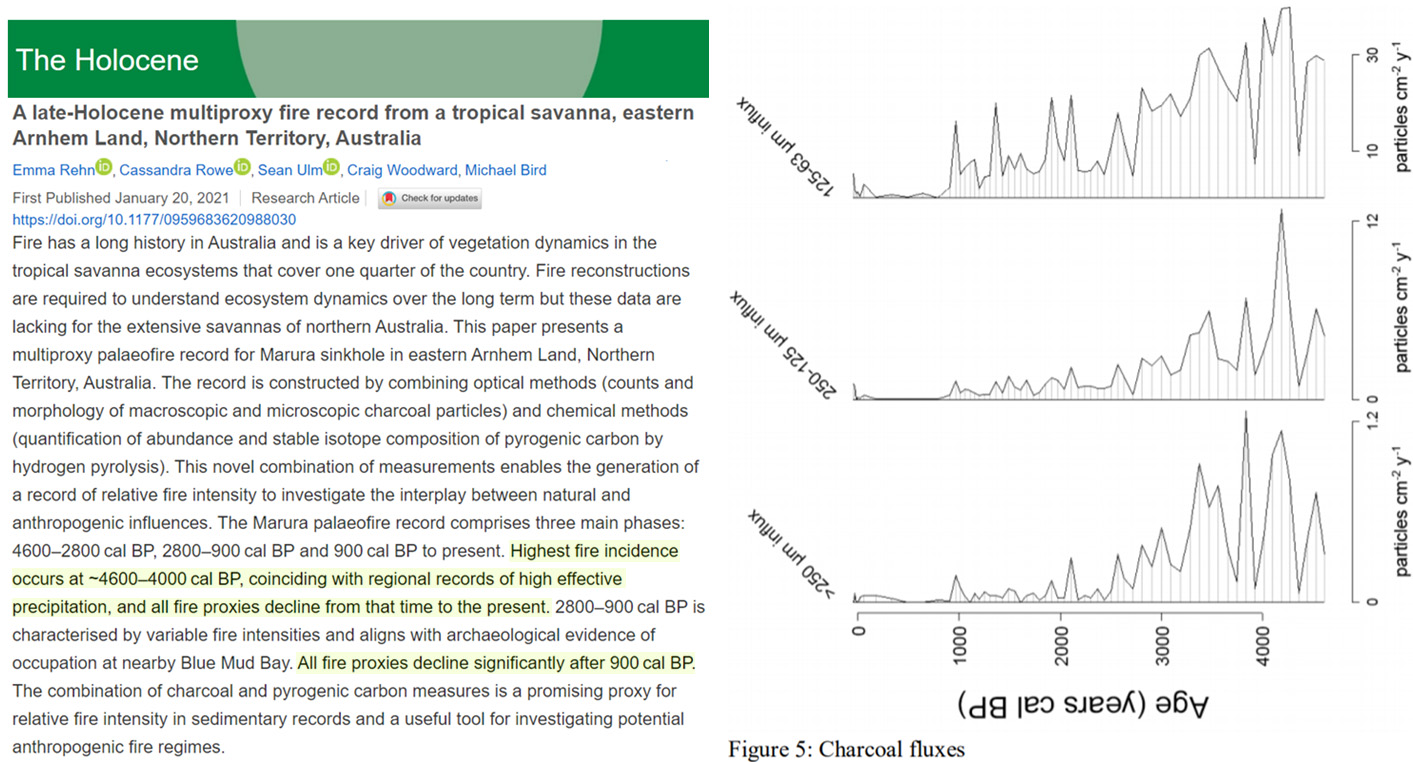
Results show low fire activity from ca. 9870 to 6000 cal yr BP, after which time fire increased and remained frequent until ca. 500 cal yr BP. A woodland environment existed at the site in the early Holocene, with the modern coniferous forest establishing ca. 6000–5500 cal yr BP. A mixed-severity fire regime has existed at the site for the past ~6000 years, with both higher- and lower-severity fire episodes occurring on average every ~80–100 years. However, only one fire episode occurred in the Long Lake watershed during the past 500 years, and none within the past ~150 years.
Fire plays a pivotal role in shaping terrestrial ecosystems and the chemical composition of the atmosphere and thus influences Earth’s climate. The trend and magnitude of fire activity over the past few centuries are controversial, which hinders understanding of preindustrial to present-day aerosol radiative forcing. Here, we present evidence from records of 14 Antarctic ice cores and 1 central Andean ice core, suggesting that historical fire activity in the Southern Hemisphere (SH) exceeded present-day levels. To understand this observation, we use a global fire model to show that overall SH fire emissions could have declined by 30% over the 20th century, possibly because of the rapid expansion of land use for agriculture and animal production in middle to high latitudes. Radiative forcing calculations suggest that the decreasing trend in SH fire emissions over the past century largely compensates for the cooling effect of increasing aerosols from fossil fuel and biofuel sources. … [T]he global burned area observed by satellite decreased 24% over the past two decades, mainly driven by agricultural expansion and intensification … Between 1750 and the early part of the 20th century, LPJ-LMfire simulates a relatively stable level of fire emissions in the SH, followed by a 30% decrease until about 1990
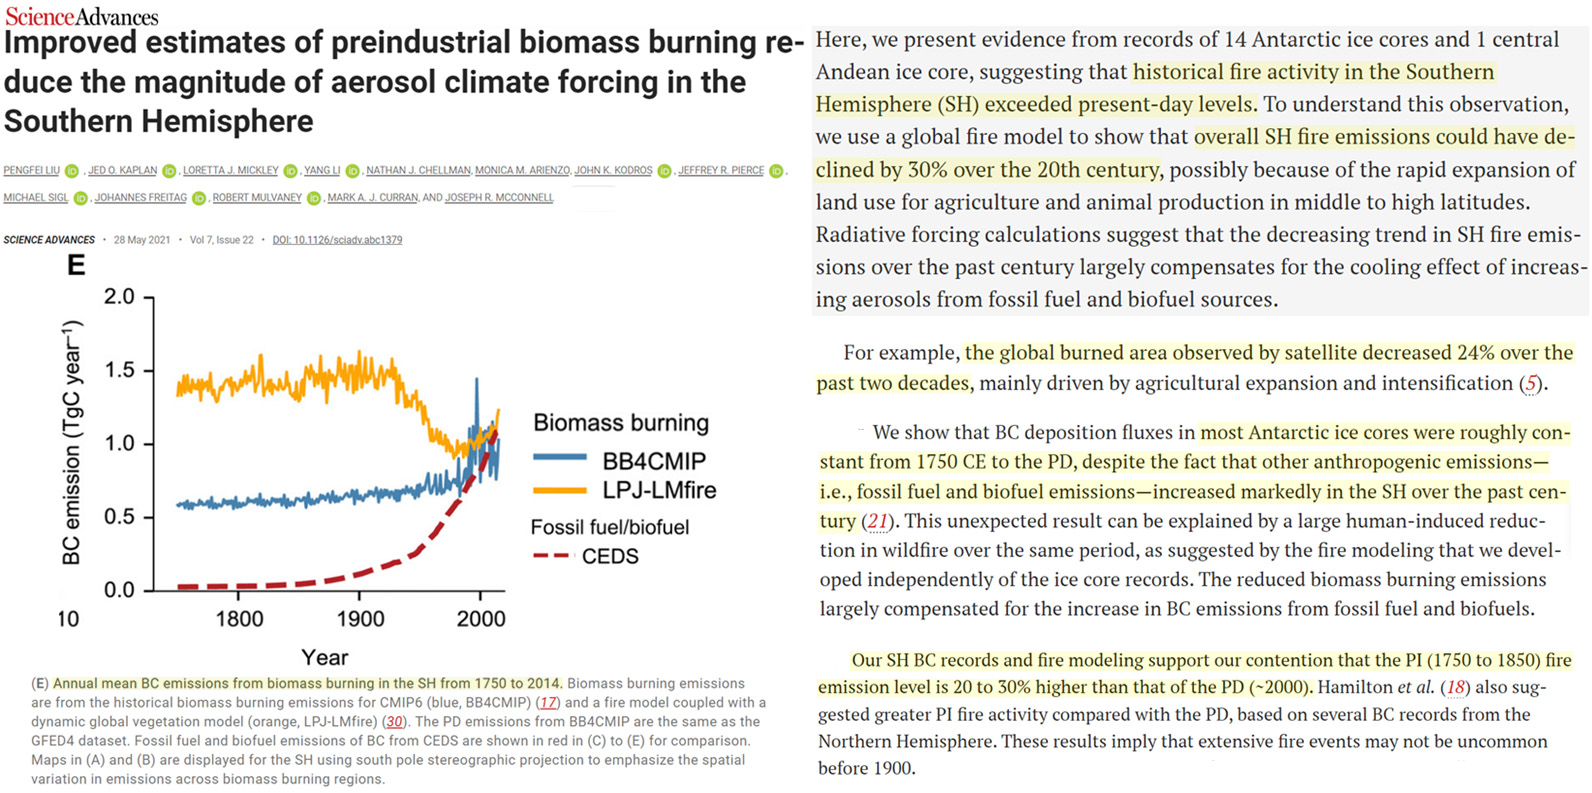
No Increasing Trends In Intense Hurricanes
The (global) risk of dying in a natural disaster is “very likely” falling. Global property losses per unit of wealth are “likely” falling.
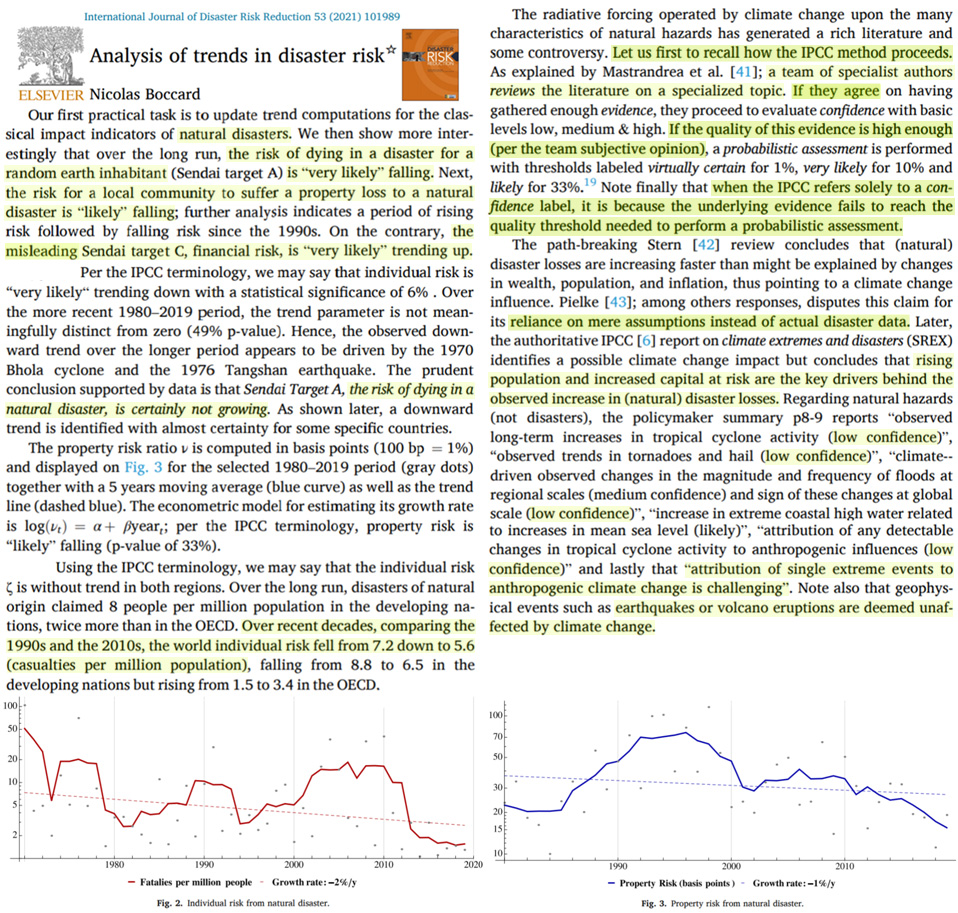
Tropical cyclone integrated kinetic energy on the other hand is a measure which takes into account both the size and the intensity of the cyclones and is more representative of its destructiveness. Here, we investigate integrated kinetic energy in three different global climate models following a common protocol. We find that an increase in horizontal model resolution results in smaller and more intense storms, but that the range of integrated kinetic energy produced by the models remains similar in both configurations. On the other hand, allowing the atmosphere and ocean to interact with each other in the models tends to reduce the size and the intensity of the storms, resulting in lower integrated kinetic energy. Comparing cyclone integrated kinetic energy between present conditions and a projected future climate scenario did not suggest notable changes between the two periods.
Once the adjustment is added to the recorded number of Atlantic HUs and MHs, substantial year-to-year and decade-to-decade variability is still present in the data, with the late-19th, mid-20th and early-21st centuries showing relative maxima, and the early 20th and late 20th centuries showing local minima (Fig. 2). However, after adjustment, the recent epoch (1995–2019) does not stand out as unprecedented in either basin-wide HU or MH frequency. There have been notable years since 2000 in terms of basin-wide HU frequency, but we cannot exclude at the 95% level that the most active years in terms of NA basin-wide HU or MH frequency occurred in either the 19th century or mid-20th century (blue lines and shading in Fig. 2a, b). Further, we cannot exclude that the most active epoch for NA HU frequency was in the late-19th century, with the mid-20th century comparable to the early-21st in terms of basin-wide HU frequency. … Furthermore, the 1980–2019 increases in basin-wide HU and MH frequency are not a continuation of a longer-term trend, but reflect a recovery from a strong minimum in the 1970s and 1980s (Fig. 2)—this evolution suggests a dominant contribution to past multidecadal variations of HU and MH frequency from some combination of multi-decadal internal climate variability (such as Atlantic Multidecadal Variability tied to variations in the strength of meridional ocean heat transport in the Atlantic—refs. 16,17,18) and/or non-greenhouse gas forcing, such as variations in anthropogenic or natural aerosols. … The homogenized basin-wide HU and MH record does not show strong evidence of a century-scale increase in either MH frequency or MH/HU ratio associated with the century-scale, greenhouse-gas-induced warming of the planet. … [S]ubstantial variability in HU frequency has been present in the Atlantic, and the inactive period in the late 20th century may have been the most inactive period in recent centuries
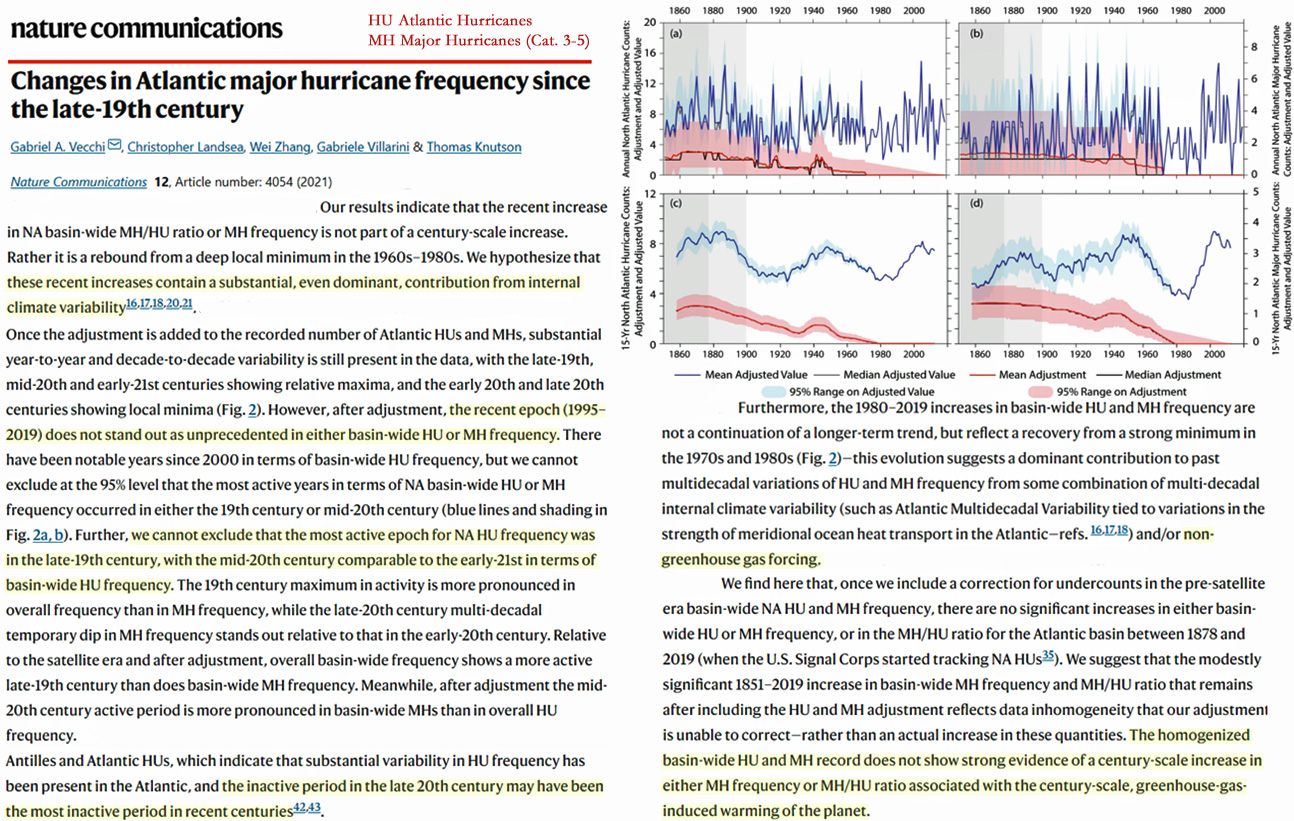
Here we utilise an Australian natural disaster database of normalised insurance losses to show compound disasters are responsible for the highest seasonal financial losses. Though their component events occur most frequently in the eastern seaboard, they may also comprise disasters on both sides of the continent. There has been no temporal trend in their frequency since 1966. A new compound disaster scale is proposed for Australian conditions. A bootstrapping analysis reveals the pairing of Bushfire and Tropical Cyclone to occur far less often than would be expected by chance. This is because these perils occur most frequently under contrasting climate states. Climate variability influences the frequency, intensity and type of perils contributing to compound disasters with the clearest relationship being with the El Niño Southern Oscillation. Given that ENSO is the most predictable climate driver at seasonal timescales, this may assist better forecasting of their occurrence and higher degrees of readiness.
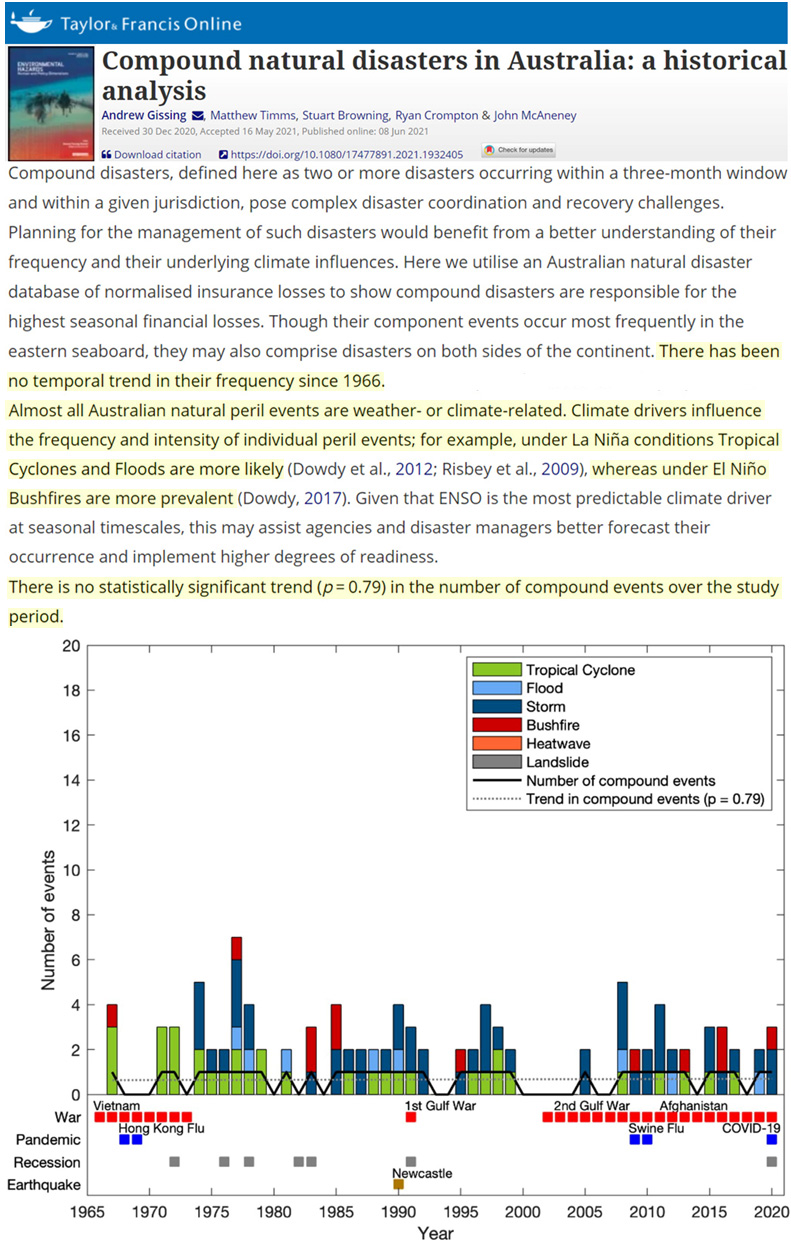
Specifically, the EHA [The Extended Hurricane Activity] index suggests hurricane activity was subdued during the warm period of the MCA, more pronounced and variable during the LIA, containing several distinct precipitation minima including from ca. 1400–1550 CE, ca. 1650–1720 CE, ca. 1780–1800 CE and ca. 1840–1880 CE, and then subdued again during the period of recent warming from 1950–2010 CE (Figure 3a; Burn and Palmer, 2014, 2015). … During the late industrial period (ca. 1950–2010 CE), when the EHA index suggests a return to a more subdued state, the assemblage is dominated (>90%) by C. meneghiniana. Although there are only two diatom intervals post 1950 CE, the stability of the assemblages during this period suggests minimal changes in the limnology of the lagoon which agrees with the EHA index of subdued hurricane activity.
No Increasing Trend In Drought Frequency, Severity
The SPEI reconstruction revealed high year-to-year and inter-decadal variation with 1774 (SPEI -3.11) and 1787 (SPEI +2.13) being the driest and the wettest years, respectively. The five year mean of reconstructed SPEI revealed droughts in 1818–1822, 1798–1802, 1813–1817, 1793–1797, 1958–1962 and pluvials in 1783–1787, 1838–1842, 1788–1792, 1933–1937, 1808–1812.
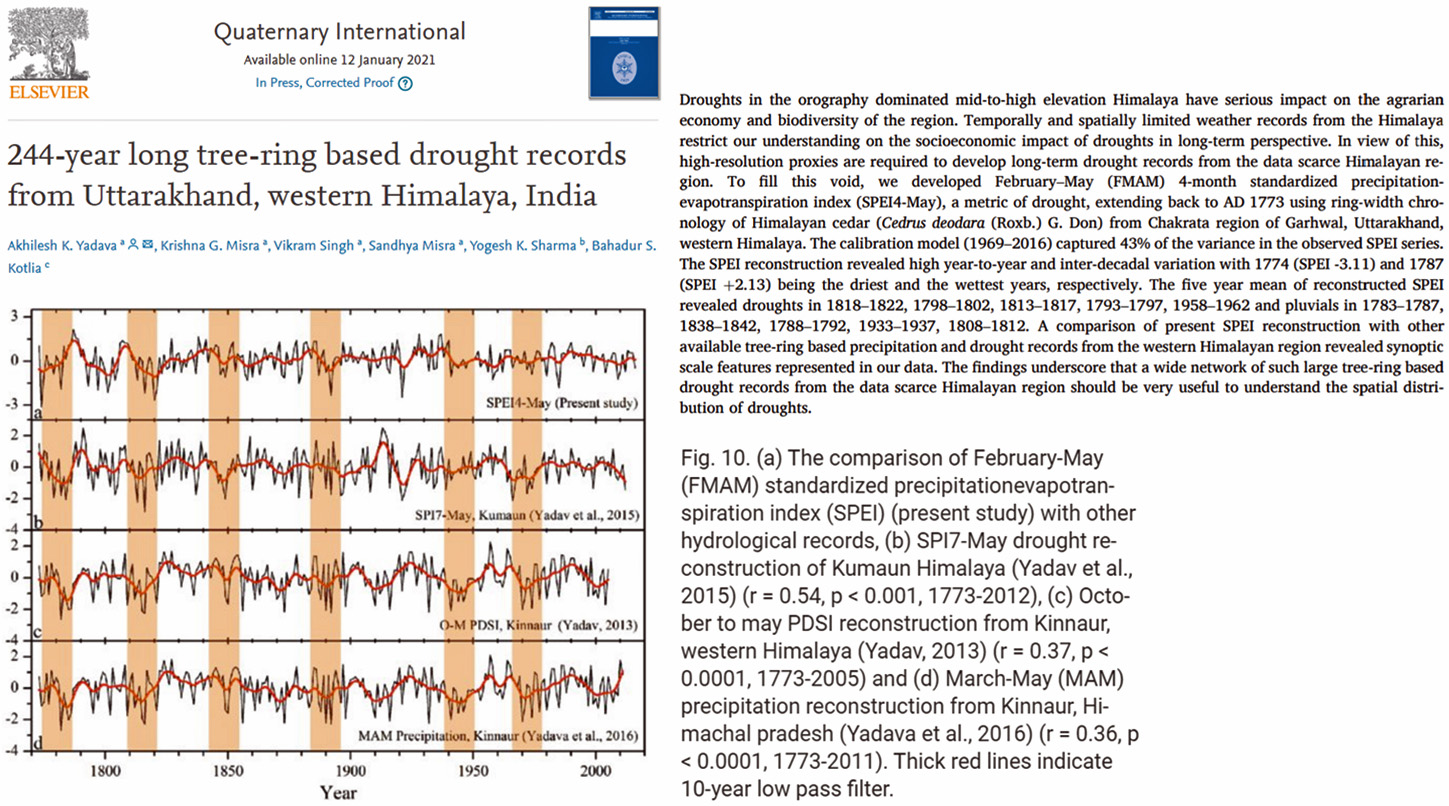
Megadroughts are notable manifestations of the American Southwest, but not so much of the European climate. By using long-term hydrological and meteorological observations, as well as paleoclimate reconstructions, here we show that central Europe has experienced much longer and severe droughts during the Spörer Minimum (~AD 1400–1480) and Dalton Minimum (~AD 1770–1840), than the ones observed during the 21st century. These two megadroughts appear to be linked with a cold state of the North Atlantic Ocean and enhanced winter atmospheric blocking activity over the British Isles and western part of Europe, concurrent with reduced solar forcing and explosive volcanism. Moreover, we show that the recent drought events (e.g., 2003, 2015, and 2018), are within the range of natural variability and they are not unprecedented over the last millennium.
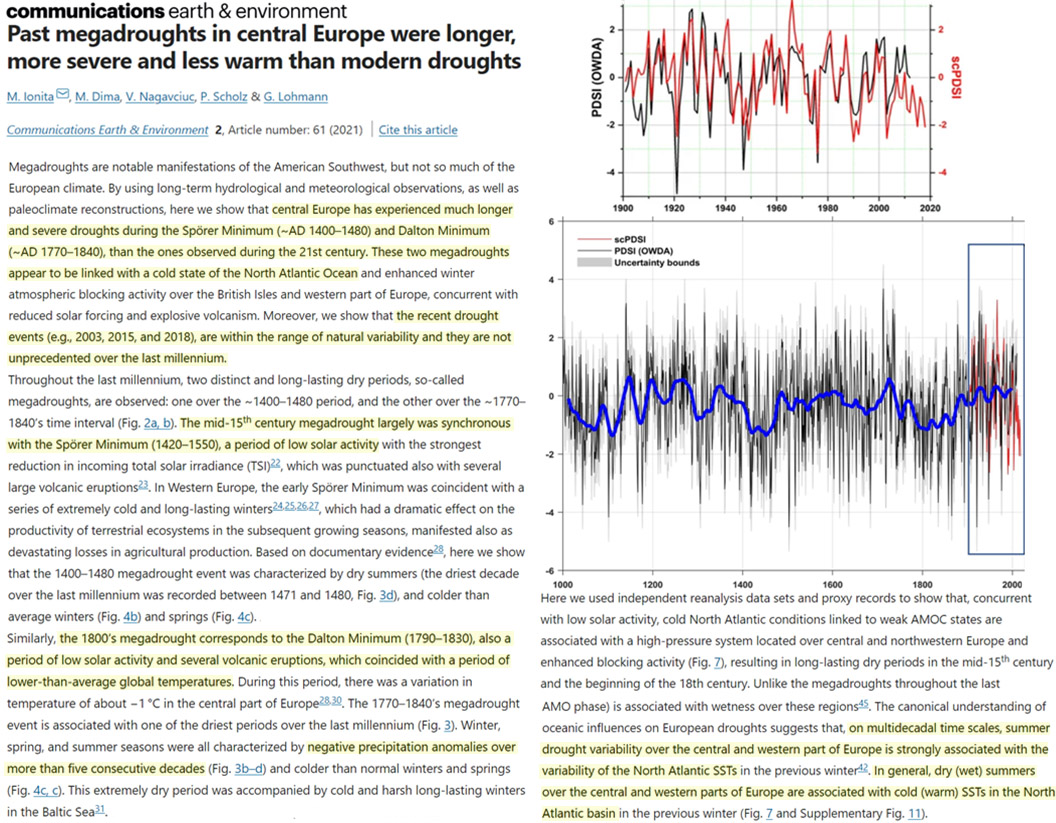
We analysed long-term variability and trends in meteorological droughts across Western Europe using the Standardized Precipitation Index (SPI). Precipitation data from 199 stations spanning the period 1851–2018 were employed, following homogenisation, to derive SPI-3 and SPI-12 series for each station, together with indices on drought duration and severity. Results reveal a general absence of statistically significant long-term trends in the study domain, with the exception of significant trends at some stations, generally covering short periods. The largest decreasing trends in SPI-3 (i.e., increasing drought conditions) were found for summer in the British and Irish Isles. In general, drought episodes experienced in the last two or three decades have precedents during the last 170·years, emphasizing the importance of long records for assessing change.
We examine the drought variability over the conterminous United States (CONUS) for 1915–2018 using the Noah-MP land surface model. We examine different model options on drought reconstruction, including optional representation of groundwater and dynamic vegetation phenology. Over our 104-yr reconstruction period, we identify 12 great droughts that each covered at least 36% of CONUS and lasted for at least 5 months. The great droughts tend to have smaller areas when groundwater and/or dynamic vegetation are included in the model configuration. We detect a small decreasing trend in dry area coverage over CONUS in all configurations. We identify 45 major droughts in the baseline (with a dry area coverage greater than 23.6% of CONUS) that are, on average, somewhat less severe than great droughts. We find that representation of groundwater tends to increase drought duration for both great and major droughts, primarily by leading to earlier drought onset (some due to short-lived recovery from a previous drought) or later demise (groundwater anomalies lag precipitation anomalies). In contrast, representation of dynamic vegetation tends to shorten major droughts duration, primarily due to earlier drought demise (closed stoma or dead vegetation reduces ET loss during droughts). On a regional basis, the U.S. Southwest (Southeast) has the longest (shortest) major drought durations. Consistent with earlier work, dry area coverage in all subregions except the Southwest has decreased. The effects of groundwater and dynamic vegetation vary regionally due to differences in groundwater depths (hence connectivity with the surface) and vegetation types.
The results showed that the first principal component(PC1) explaining 50.9% of total variance revealed a coherent spatial mode, indicating that the coherent drought or flood was major spatial mode over Yunnan during the last five and a half centuries. The PC1 scores showed a temporal pattern of three stages of drought and flood, i.e. active 1470~1680 A.D.(the 1st stage), when Yunnan saw many exceptional and severe droughts and floods as well as mega-droughts and mega-floods persisting for several years; inactive 1681 A.D. to 1910 A.D.(the 2nd stage), when few droughts and floods occurred in Yunnan; and active last century(1911~2012 A.D., the 3rd stage), when Yunnan saw more droughts, and even experienced a mega-drought lasting four years from 2009 A.D. to 2012 A.D. The result of wavelet analysis showed three periodic bands at 3~7 a, 10~15 a and 30~50 a significant at 95% confidence level. The 3~7 a cycle occurred through nearly five and a half centuries, whereas 10~15 a and 30~50 a oscillations appeared significantly in 1580~1750 A.D. and 1470~1700 A.D., respectively. A comparison of PC1 scores with a series of climatic proxies and large-scale climatic patterns indicated that coherent droughts and floods in rainy season over Yunnan were mainly controlled by the South Asian summer monsoon, which was affected by the interannual variation of ENSO and IOD as well as the interdecadal variation of PDO and AMO.
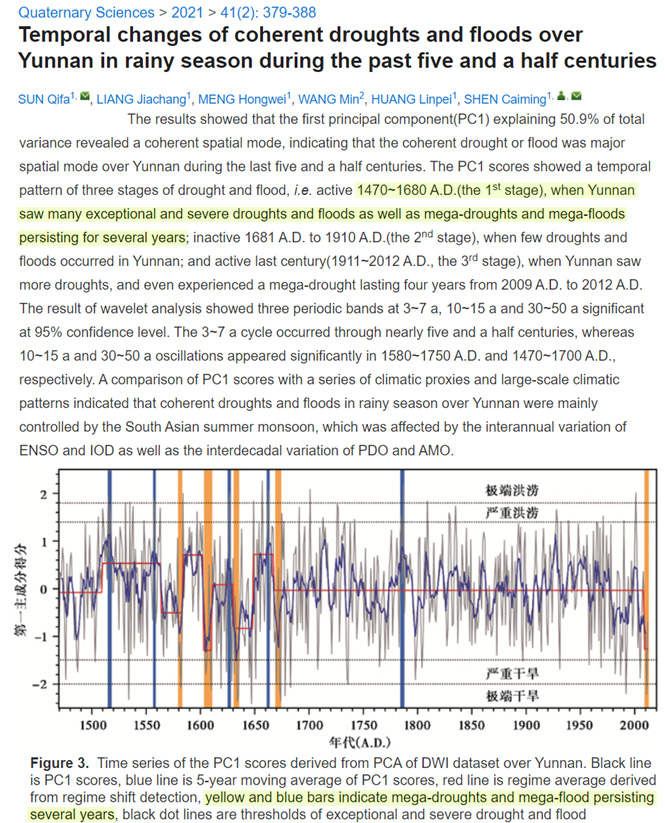
Northern parts of Australia have experienced increasing annual rainfall totals, resulting in increased water availability in the tropics with increased soil moisture, evapotranspiration, and runoff, particularly during the hot, wet monsoon season. In contrast, the southwest and southeast coast of Australia have experienced declines in rainfall, particularly in the colder months, corresponding with decreasing evapotranspiration, soil moisture, and runoff. Trends in flooding are aligned with runoff trends, and closely follow trends in rainfall, with changes in soil moisture of secondary influence. Streamflow droughts, measured by the standardised runoff index, are increasing across large parts of Australia, with these increases more widespread than changes in rainfall alone. Increases in rainfall in the tropics of northern Australia appear to be related to decreasing drought occurrence and extent, but this trend is not universal, suggesting changes in rainfall alone are not an indicator of changing drought conditions.
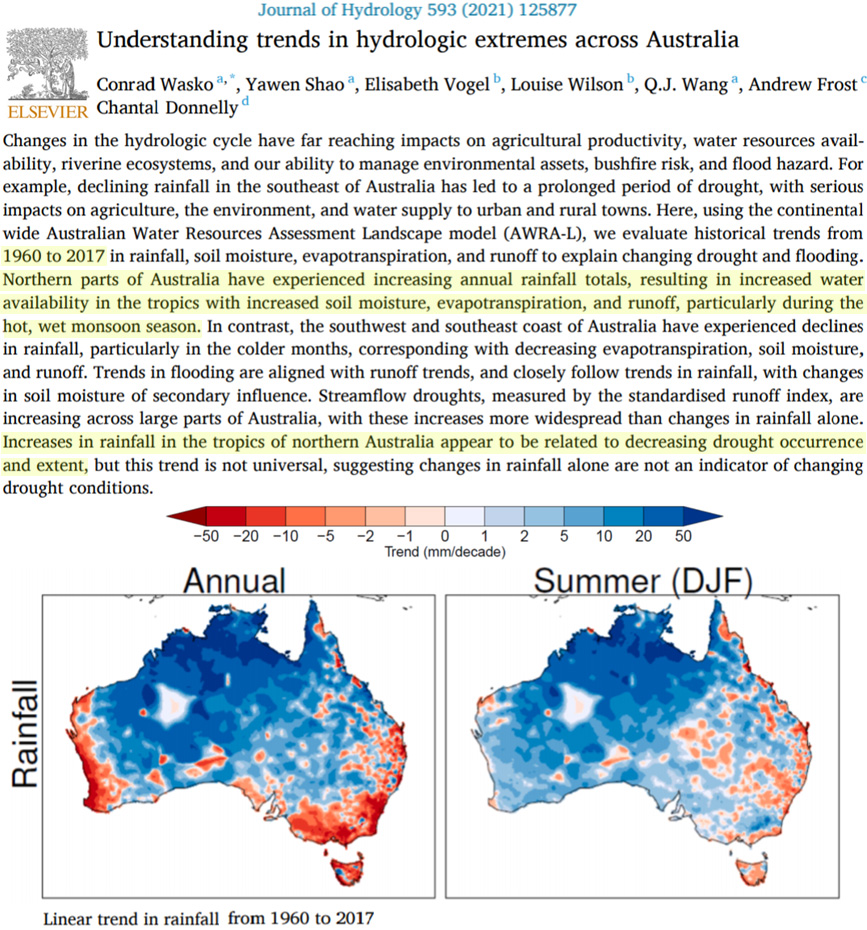
Concepts like the 100‐year flood event can be misleading if they are not updated to reflect significant changes over time. Here, we model observed annual maximum daily streamflow using a nonstationary approach to provide the first global picture of changes in: (a) the magnitudes of the 20‐, 50‐, and 100‐year floods (i.e., flows of a given exceedance probability in each year); (b) the return periods of the 20‐, 50‐, and 100‐year floods, as assessed in 1970 (i.e., flows of a fixed magnitude); and (c) corresponding flood probabilities. Empirically, we find the 20‐/50‐year floods have mostly increased in temperate climate zones, but decreased in arid, tropical, polar, and cold zones. In contrast, 100‐year floods have mostly decreased in arid/temperate zones and exhibit mixed trends in cold zones, but results are influenced by the small number of stations with long records, and highlight the need for continued updating of hazard assessments. … Changes in flood return periods mirror the changes in flood magnitude and vary greatly around the world (Figures 3 and S6), but some distinct regional patterns can be seen. The 20‐, 50‐, and 100‐year floods of the 1970s have become, on average, ∼41‐, 152‐, and 358‐year floods under present‐day conditions (at 3174/2164/1262 sites with nonstationary records, respectively). … At the global scale, consistent with results for flood magnitude and return periods, we find a decrease in flood probabilities, which contrasts with global increases in the frequency of extreme precipitation (Papalexiou & Montanari, 2019). The 20‐year flood representative of conditions in 1970, which had a 79% chance of occurring over a 30‐year horizon under conditions equivalent to the 1970s, now has a 52% chance of occurring (median of 3174 sites). The 50‐year flood, which had a 45% chance of occurring over a 30‐year horizon under conditions equivalent to the 1970s, now has an 18% chance of occurring (median of 2164 sites). Similarly, the 100‐year flood, which had a 26% chance of occurring, now has an 8% chance of occurring (median of 1262 sites), based on an updated, but constant 30‐year annual event probability over the lifetime of a 30‐year mortgage or design horizon.
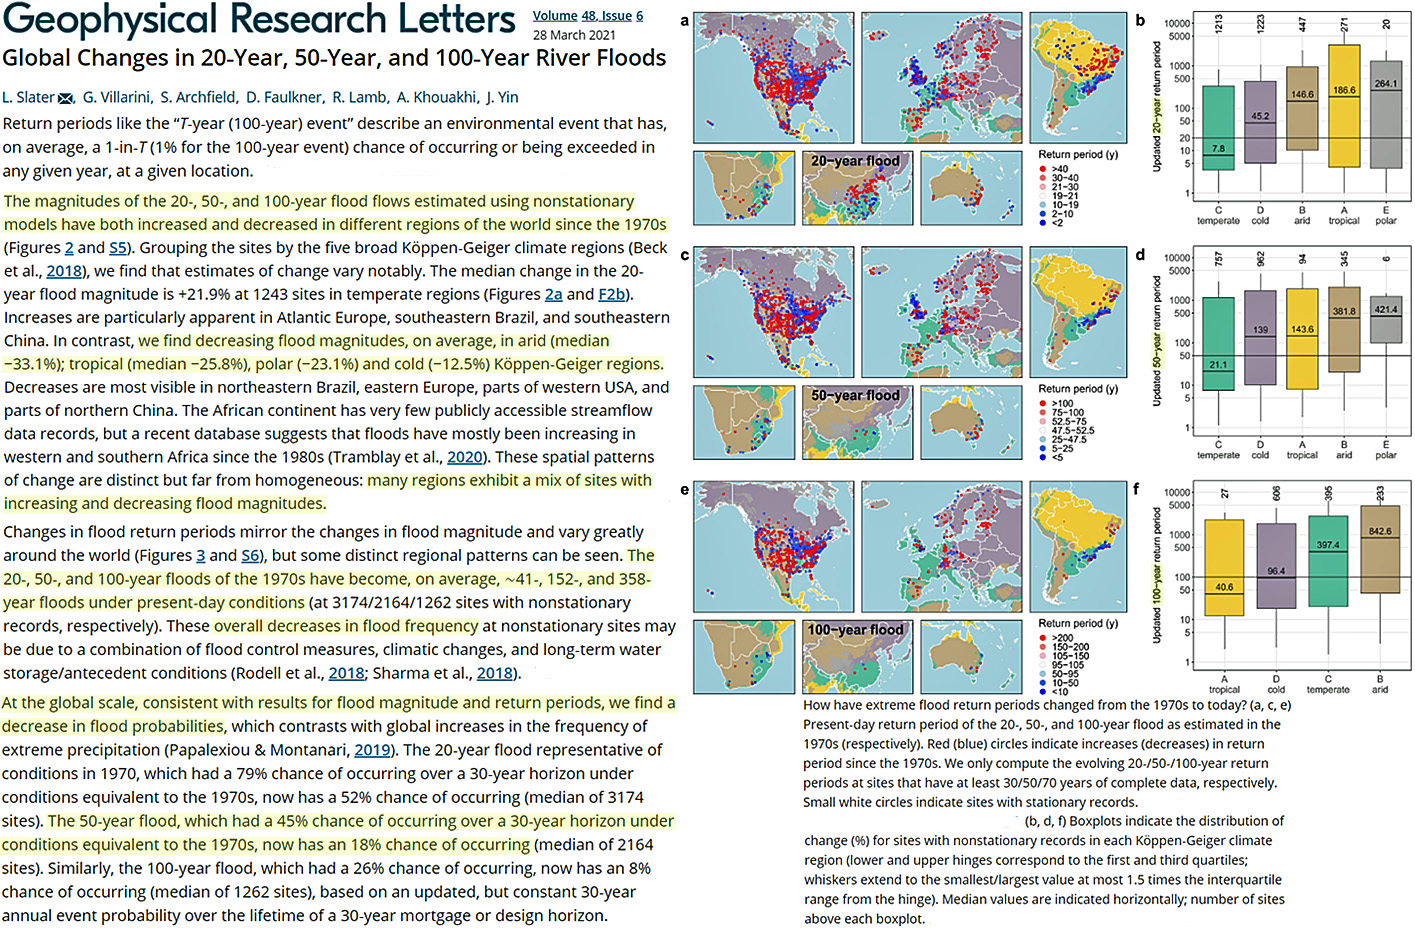
Drylands, comprising land regions characterized by water-limited, sparse vegetation, have commonly been projected to expand globally under climate warming. Such projections, however, rely on an atmospheric proxy for drylands, the aridity index, which has recently been shown to yield qualitatively incorrect projections of various components of the terrestrial water cycle. Here, we use an alternative index of drylands, based directly on relevant ecohydrological variables, and compare projections of both indices in Coupled Model Intercomparison Project Phase 5 climate models as well as Dynamic Global Vegetation Models. The aridity index overestimates simulated ecohydrological index changes. This divergence reflects different index sensitivities to hydroclimate change and opposite responses to the physiological effect on vegetation of increasing atmospheric CO2. Atmospheric aridity is thus not an accurate proxy of the future extent of drylands. Despite greater uncertainties than in atmospheric projections, climate model ecohydrological projections indicate no global drylands expansion under greenhouse warming, contrary to previous claims based on atmospheric aridity.
Natural CO2 Emissions A Net Source, Not A Net Sink
Climatic events during the study period had a significant impact on the .Remote sensing was used to evaluate air-sea CO2 exchange in the Amazon River plume. … The plume was a net source of CO2 to the atmosphere during rising water. Including the plume area closer to the river mouth makes the ARP a net source of CO2 with an annual net sea-air flux of 8.6 ± 7.1 Tg C y−1 from 2011 to 2014.
We describe the first direct measurements of evaporation and CO2 flux over a calcifying seagrass meadow near Bob Allen Keys, Florida. Over the 78-d study, CO2 emissions were 36% greater during the day than at night, and the site was a net CO2 source to the atmosphere of 0.27 ± 0.17 μmol m−2 s−1(xc ± standard deviation). A quarter (23%) of the diurnal variability in CO2 flux was caused by the effect of changing water temperature on gas solubility.
Elevated CO2 Does Not Harm Human Cognition
Microgravity and elevated CO2 levels are two important environmental spaceflight stressors that can adversely affect astronaut cognitive performance and jeopardize mission success. This study investigated the effects of 6° head-down tilt bed rest (HDBR) with (n = 11 participants, 30-day HDBR) and without (n = 8 participants, 60-day HDBR) elevated ambient (3.73 mmHg) CO2 concentrations on cognitive performance. Participants of both groups performed all 10 tests of NASA’s Cognition battery and a brief alertness and mood survey repeatedly before, during, and after the HDBR period. Test scores were adjusted for practice and stimulus set effects. Concentrating on the first 30 days of HDBR, a modest but statistically significant slowing across a range of cognitive domains was found in both groups (controls: −0.37 SD; 95% CI −0.48, −0.27; adjusted P < 0.0001; CO2: −0.25 SD; 95% CI −0.34, −0.16; adjusted P < 0.001), most prominently for sensorimotor speed. These changes were observed early during HDBR and did not further deteriorate or improve with increasing time in HDBR. The study found similar cognitive effects of HDBR irrespective of CO2 levels, suggesting that elevated CO2 neither ameliorated nor worsened the HDBR effects. In both groups, cognitive performance after 15 days of recovery was statistically indistinguishable from pre-HDBR performance.
In a business as usual scenario, atmospheric carbon dioxide concentration (CO2) could reach 950 parts per million (ppm) by 2100. Indoor CO2 concentrations will rise consequently, given its dependence on atmospheric CO2 levels. If buildings are ventilated following current standards in 2100, indoor CO2 concentration could be over 1300 ppm, depending on specific ventilation codes. Such exposure to CO2 could have physiological and psychological effects on building occupants. We conducted a randomized, within-subject study, examining the physiological effects on the respiratory functions of 15 persons. We examined three exposures, each 150 min long, with CO2 of: 900 ppm (reference), 1450 ppm (decreased ventilation), and 1450 ppm (reference condition with added pure CO2). We measured respiratory parameters with capnometry and forced vital capacity (FVC) tests. End-tidal CO2 and respiration rates did not significantly differ across the three exposures. Parameters measured using FVC decreased significantly from the start to the end of exposure only at the reduced ventilation condition (p < 0.04, large effect size). Hence, poor ventilation likely affects respiratory parameters. This effect is probably not caused by increased CO2 alone and rather by other pollutants—predominantly human bioeffluents in this work—whose concentrations increased as a result.
[T]he human body can adapt to high concentrations of pure CO2 (20 000 ppm) without adverse effects on physiological or psychological parameters. Our results provide additional confirmation that negative health effects at high indoor air CO2 concentrations cannot be attributed to CO2 but are most likely caused by other pollutants. … In terms of accuracy and speed in the three cognitive performance tasks, no significant changes were found at exposure to 20 000 ppm CO2 compared to 770 ppm. … Our findings our in accordance with earlier research that found null effects of CO2 on cognitive performance with exposures between 5000 and 20 000 ppm CO2 with or without exercise.
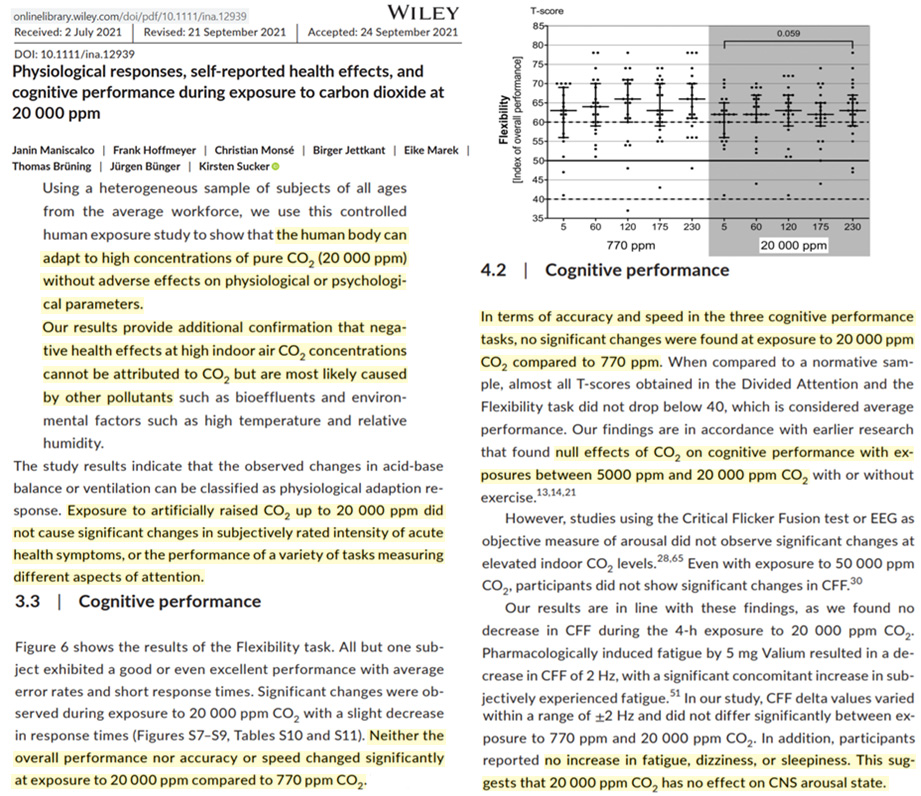
It has been claimed that the dangerous rise in atmospheric CO2 levels will impede our brain functions, and namely that the continued fossil fuel emissions will impair cognition. In particular, it is said that indoor CO2 levels may reach levels well above 1,000 p.p.m. and this may be harmful to cognition by the end of this century. It is shown as even continuing at the present rate the atmospheric CO2 concentration is not expected to exceed 690 p.p.m. by 2100. Since no significant effects on cognitive performance are seen also for indoor CO2 levels much higher than 1,000 p.p.m., opening the window of crowded spaces could be a simple but effective mitigation strategy better than building up wind and solar capacity.
Miscellaneous
We found that the maximum temperature was higher when more trees were cut and canopy was more open. Logging 100 trees per hectare increased maximum temperature by 0.21–0.34 K at ground level and by 0.09–0.17 K in 1.3 m above ground. Opening the forest canopy by 10% significantly increased Tmax, measured 1.3 m above ground by 0.46 K (including pine and beech stands) and 0.35 K (only pine stands). At ground level, Tmax increased by 0.53 K for the model including pine and beech stands and by 0.41 K in pure pine stands. Relative temperature cooling capacity decreased with increasing wood harvest activities, with below average values in 2018 (and 2019) when more than 656 (and 867) trees per hectare were felled. In the pine forests studied, the relative temperature buffering capacity 1.3 m above ground was lower than average values for all sample plots when canopy cover was below 82%. In both study years, mean maximum temperature measured at ground level and in 1.3 m was highest in a pine-dominated sample plots with relatively low stand volume (177 m3 ha−1) and 9 K lower in a sample plot with relatively high stock volumes of Fagus sylvatica (>565 m3 ha−1). During the hottest day in 2019, the difference in temperature peaks was more than 13 K for pine-dominated sample plots with relatively dense (72%) and low (46%) canopy cover.
Over two-thirds of terrestrial carbon is stored belowground, and a significant amount of the atmospheric CO2 assimilated by plants is respired by roots and microbes in soils (2, 3). Soil respiration (Rs), consisting of root (autotrophic) respiration (Ra) and microbial (heterotrophic) respiration (Rh), is therefore a key process in the terrestrial carbon cycle. … Previous studies using statistical models have produced mean annual global Rs estimates from 78 to 108 Pg C year−1, and the error associated with each estimation was high (table S1). One study (7) noted that the lack of large-scale, observation-driven Rs estimates was a major problem in constraining regional-scale to global-scale C fluxes.
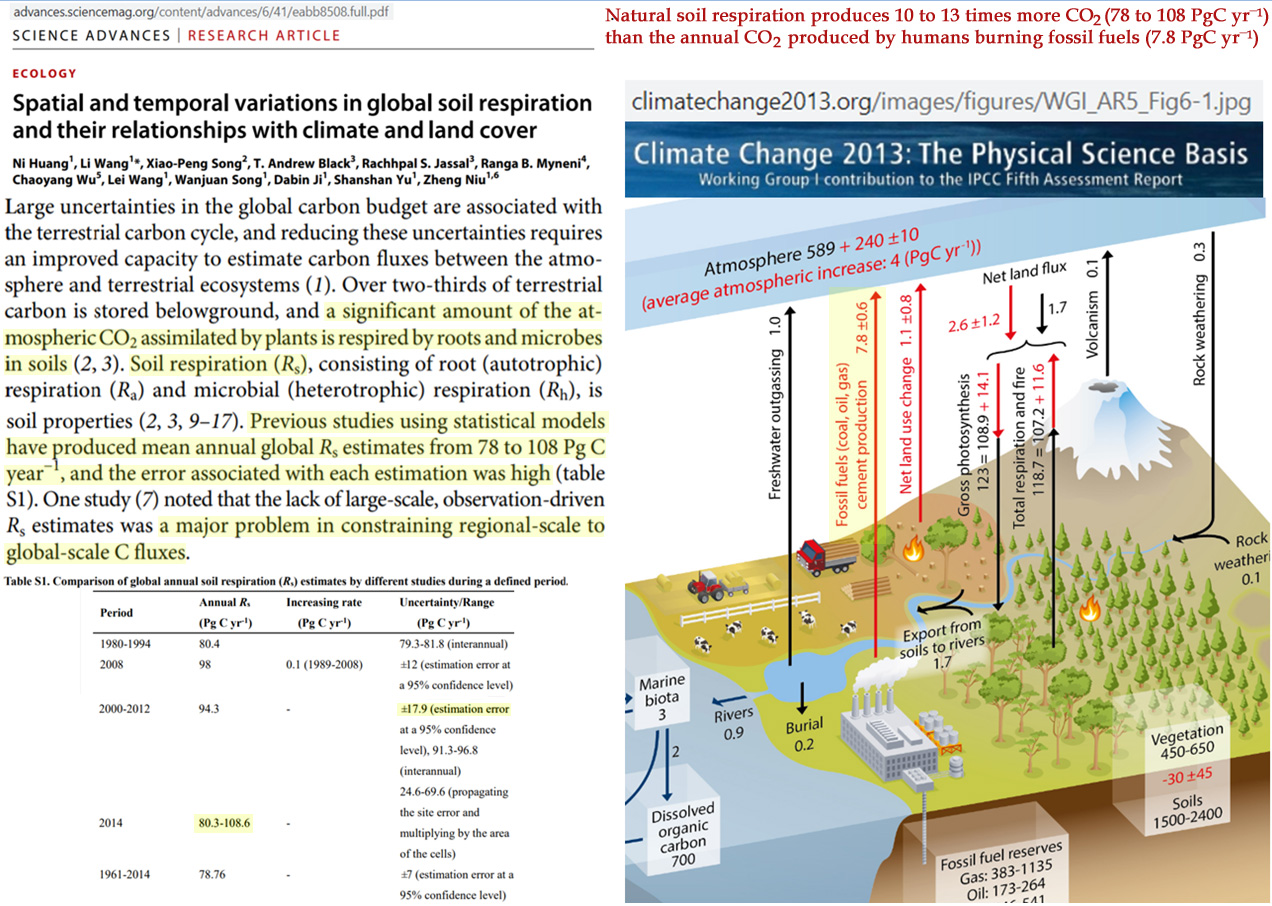
Two proxies of paleo Patm derived from amber (resin) and the difference between pCO2 as derived from global marine and terrestrial sources indicate a drop in paleo-Patm from about 1.2 to 1 bar over the period 3 Ma to 2.6 Ma BP.

In most northern boreal forests, it is still assumed that temperature is the most limiting factor for tree growth, despite a globally observed loss of about 8.7million km² in temperature-limited tree growth area, predominantly located in North-America and Asia (Anchukaitis et al., 2017; Babst et al., 2019). Recent divergence or decoupling between tree growth and mean summertime temperature further emphasizes that the assumption of temperature being the most limiting factor for tree growth might no longer be valid
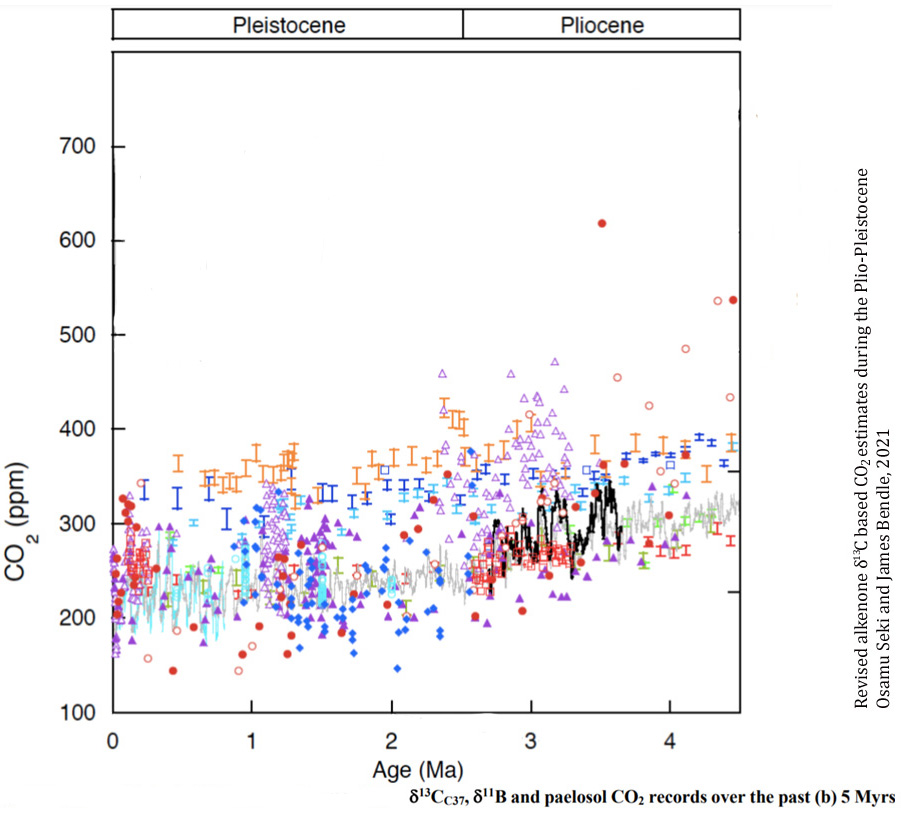
Our models suggest that wild pigs are uprooting a median area of 36,214 km2 (mean of 123,517 km2) in their non-native range, with a 95% prediction interval (PI) of 14,208 km2–634,238 km2. This soil disturbance results in median emissions of 4.9 million metric tonnes (MMT) CO2 per year (equivalent to 1.1 million passenger vehicles
(press release) Wild pigs are having a bigger climate change impact than one million cars
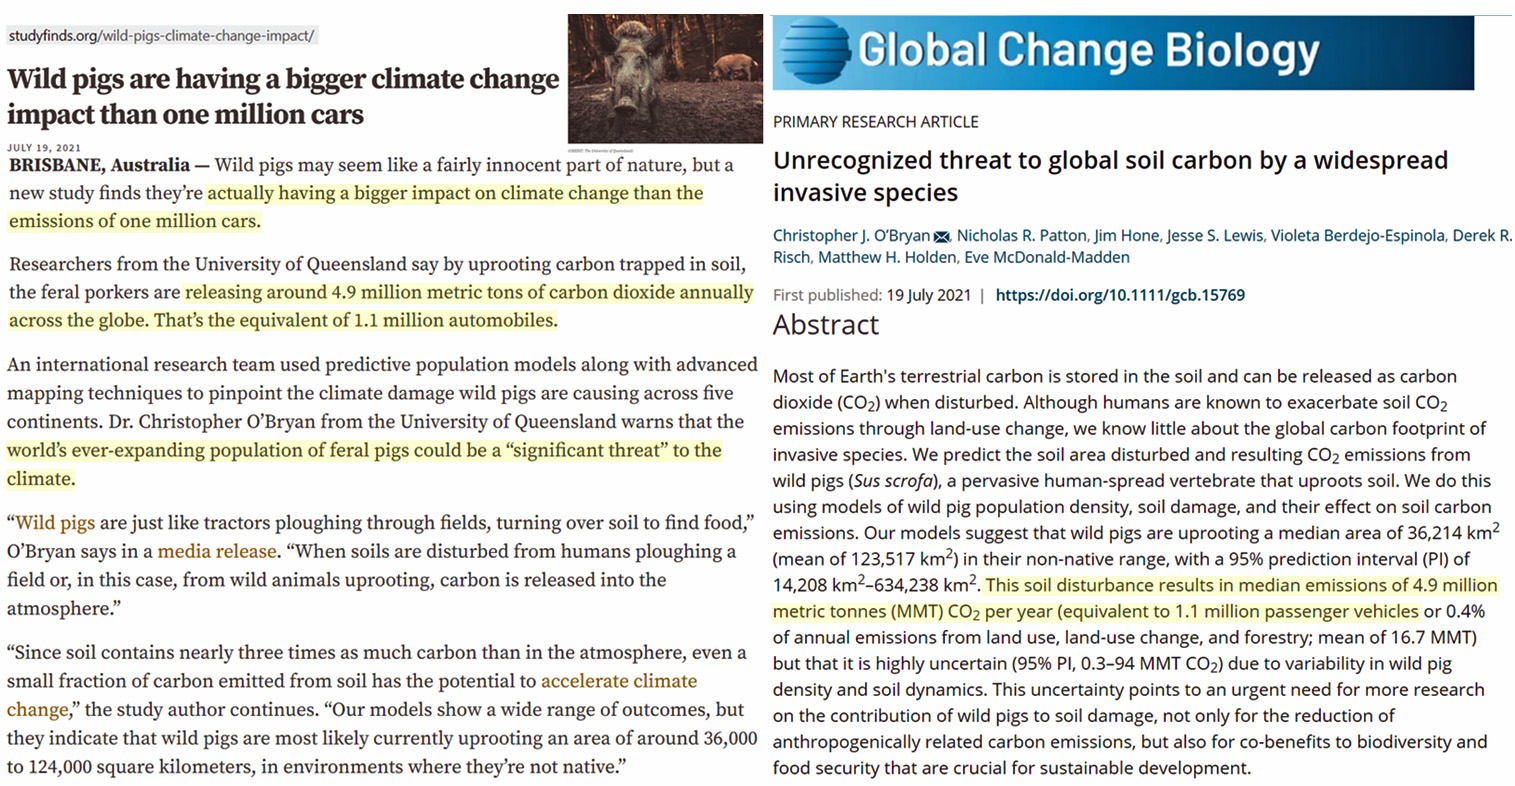
Goulet Coulombe and Göbel, 2021
Despite overwhelming evidence for anthropogenic forcing being the main driver of global climate change (Masson-Delmotte et al. 2018), scientists have also observed that especially since the turn of the millennium, global temperature has plateaued despite ever-rising greenhouse gases and contrary to projections from key climate models. … Results for CO2 are rather surprising. Irrespective of the ordering, GMTA [global mean temperature] is reported to cause more CO2 than the reverse, a finding contradicting SMCGL’s results and common wisdom. … [A]pparently counterintuitive finding that GMTA explains a larger portion of the forecast error variance of CO2 than vice versa
During Pleistocene cold stages, the non-glaciated northern latitudes were characterized by extensive herb-dominated grassland vegetation that supported a wide array of large herbivores … Productivity of vegetation should have been relatively high compared to current conditions to support high densities of large herbivores, and soils should have been more fertile than today in the arctic … Pleistocene conditions of the mammoth steppe are not easily restored today. The harsh continental to suboceanic climate gradient was the overriding factor for species composition of current vegetation in our study area.
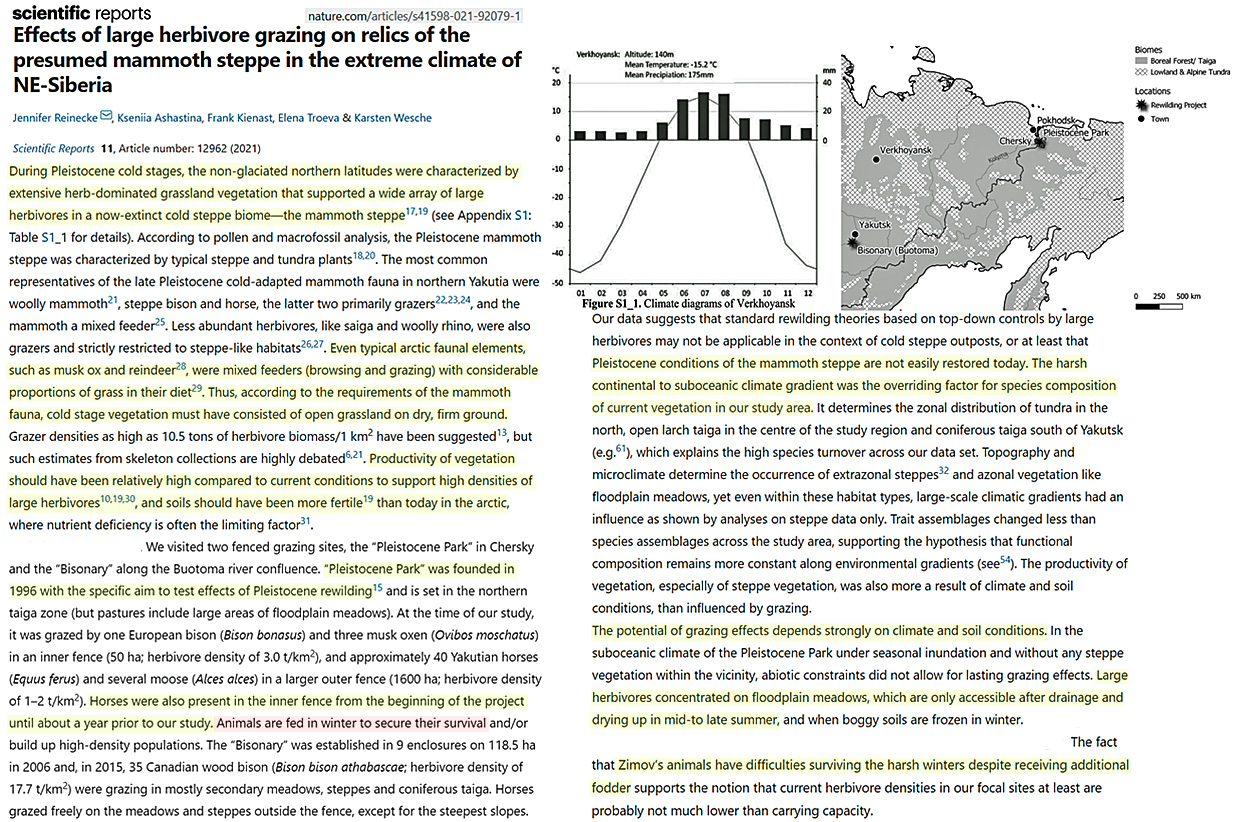
The natural variability of reef-seawater pH since preindustrial times has been constrained by high resolution δ11B measurements in a ~ 300- year-old massive Porites coral in Flinders reef from the southwestern Pacific Ocean (Pelejero et al., 2005; Liu et al., 2014). Large variations in reef-water pH from 7.9 to 8.2 showed an interdecadal oscillation and covaried with the Interdecadal Pacific Oscillation (IPO) index over a period of ~50 years (Fig. 12a, Pelejero et al., 2005).
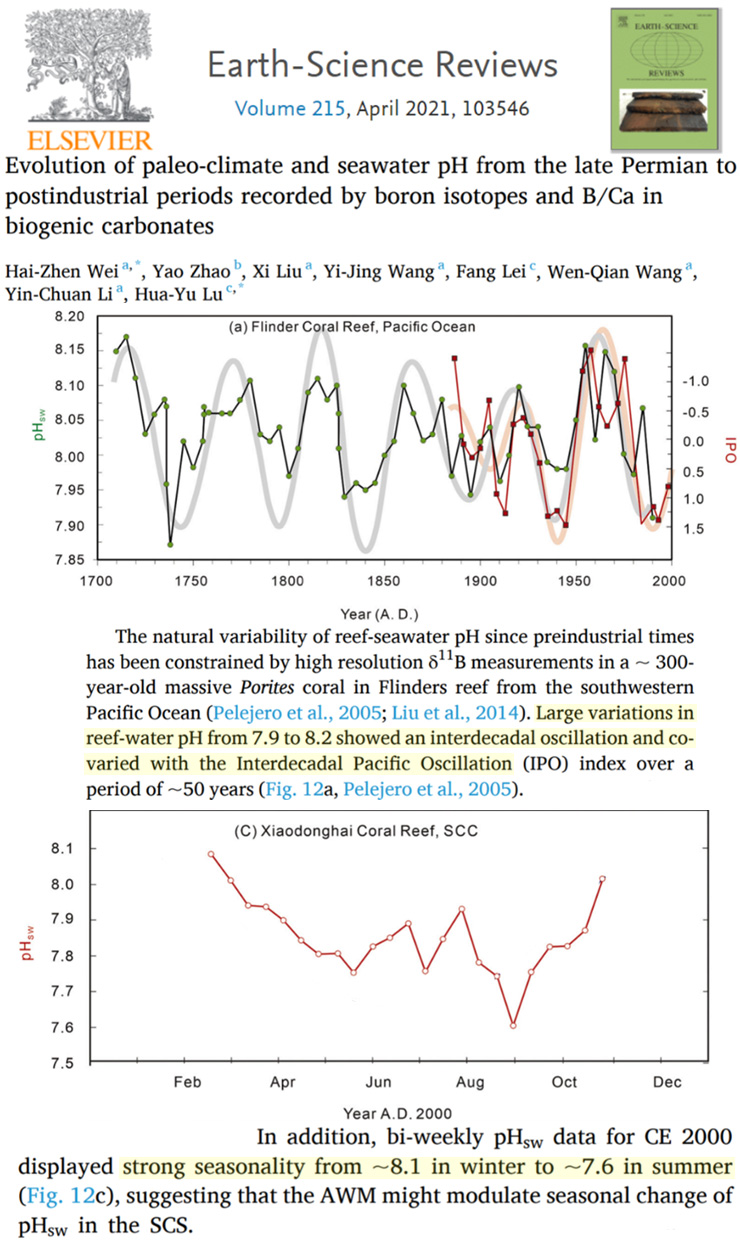
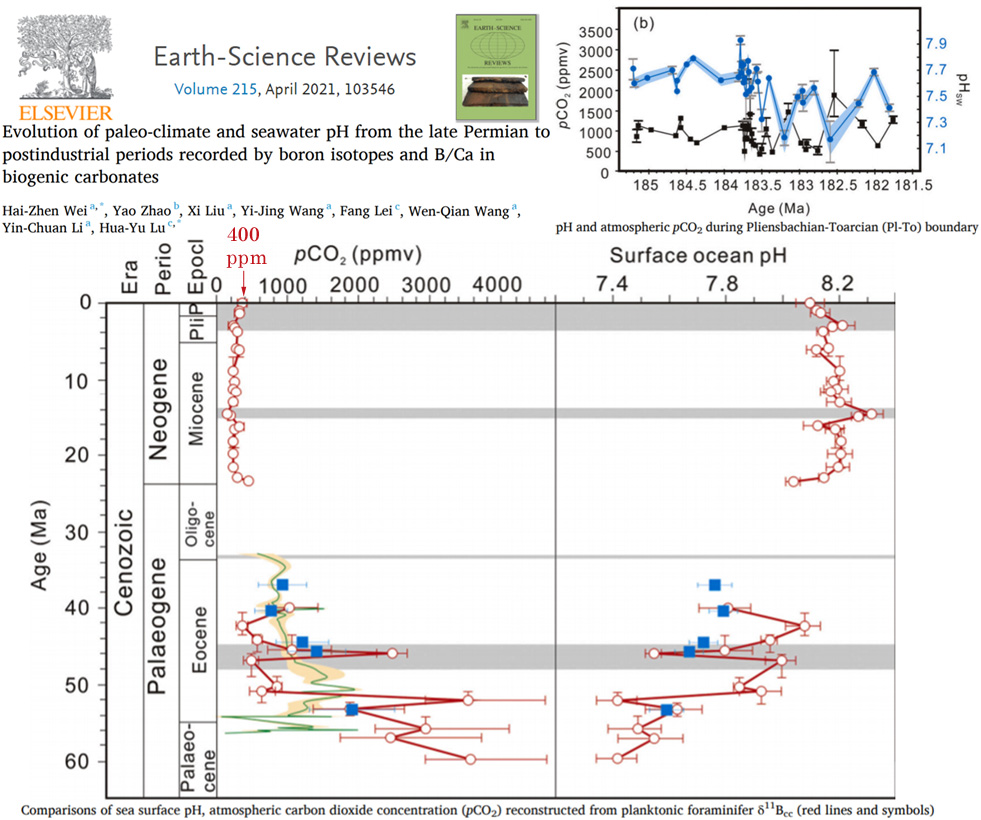
A higher temperature was associated with a lower incidence of COVID-19. … The COVID-19 incidence showed a stronger association with temperature than with relative humidity or wind speed. An inverse association was identified between the COVID-19 incidence and temperature. The corresponding 14-day cumulative relative risk was 1.28 [95% confidence interval (CI), 1.20–1.36] at 5 °C, and 0.75 (95% CI, 0.65–0.86) at 22 °C with reference to the risk at 11 °C. … The COVID-19 incidence decreased with the increase of temperature. Our study suggests that the spread of COVID-19 may slow during summer but may increase during winter.
Measured biomarkers indicated higher stress levels were achieved during the stressed activity. Per-person CO2 emission rates were greater for stressed than relaxed activity (30.3 ± 2.1 vs 27.0 ± 1.7 g/h/p, p = 0.0044, mean ± standard deviation).
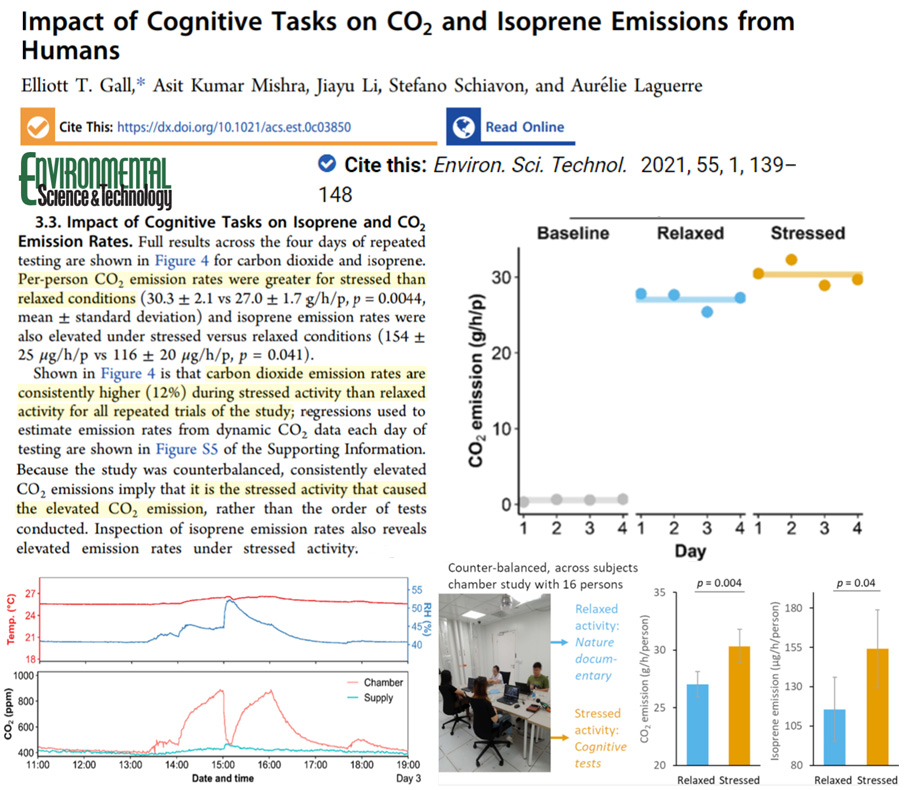
Based on analyses of ground-based and satellite observations and experiments with a radiative transfer model, we estimate a 1.3% (2.3 W/m²) increase in surface irradiance with respect to the 2010–2019 mean due to a low median aerosol optical depth, and a 17.6% (30.7 W/m²) increase due to several exceptionally dry days and a very low cloud fraction overall. Our analyses show that the reduced aerosols and contrails due to the COVID-19 measures are far less important in the irradiance record than the dry and particularly cloud-free weather. … At noon, removal of clouds (red) increases the irradiance by 250.7 W/m², and removing water vapour (orange) increases irradiance by a further 130.8 W/m² whereas the presence of aerosols (light blue) lowers the irradiance only by 12.5 W/m². Both the removal of water vapour and clouds have a larger effect on the irradiance than removing aerosols, due to the typically larger optical depth of clouds than of aerosols.
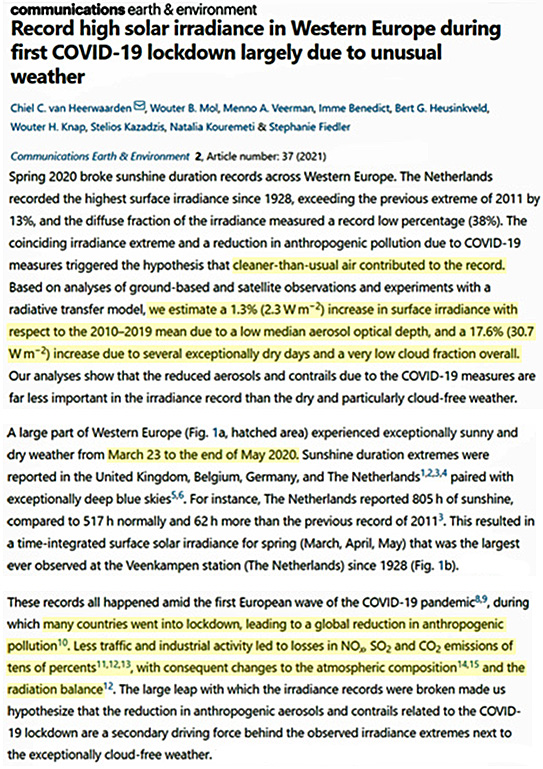
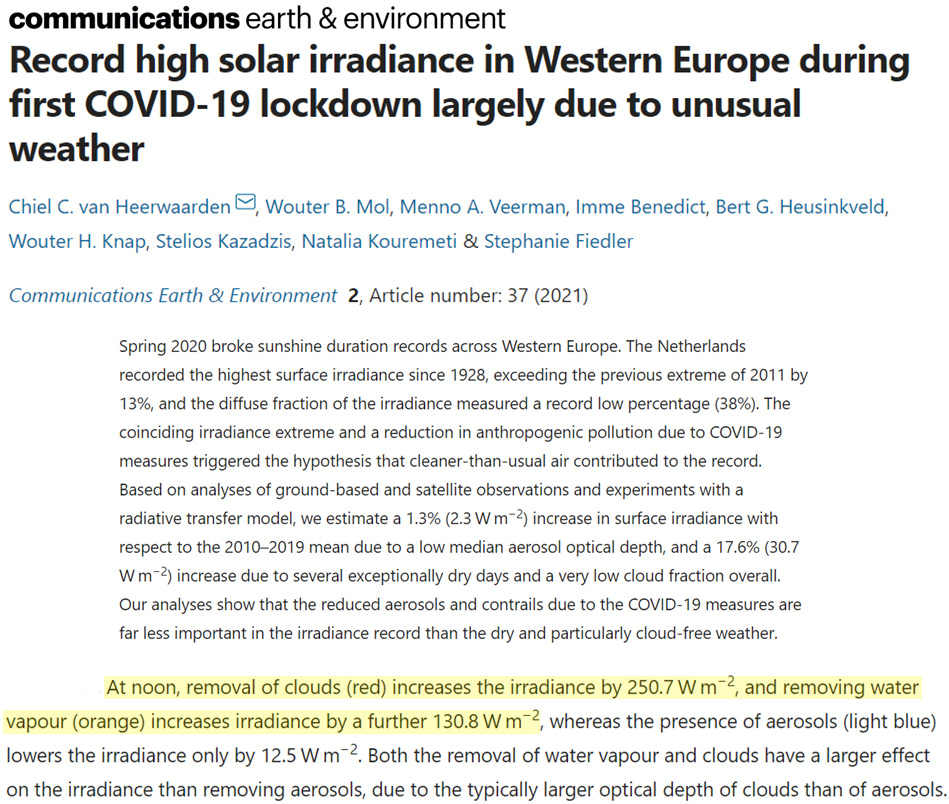
We used land surface temperature (LST) and normalized difference vegetation index (NDVI) data from 2000 to 2019, using change trend analysis, correlation analysis, and other methods to explore the impact of vegetation cover changes on ground surface temperature. From 2000 to 2019, in the central Guizhou urban agglomeration, the LST showed a fluctuating downward trend, with an average trend rate of -5.1%a-1. NDVI showed a fluctuating upward trend, with an average trend rate of 0.56%a-1. The area with increasing LST (P<0.5) accounted for about 9.8%, and the area with a decreasing trend accounted for about 90.2%. The region of NDVI showing an increasing trend (P<0.5) accounted for approximately 97.34%, and the area of decreasing trend accounts for about 2.67%. About 96.8% of the regional area NDVI is negatively correlated with LST, and about 3.2% of the regional area is positively correlated.
Apocalyptic forecasts are unique. They have, by definition, no prior history and are observed only in their failure. As a result, they fit poorly with our mental models for evaluating and using them. However, they are made with some frequency in the context of climate change. We review a set of forecasts involving catastrophic climate change-related scenarios and make several observations about the characteristics of those forecasts. We find that mentioning uncertainty results in a smaller online presence for apocalyptic forecasts. However, scientists mention uncertainty far more frequently than non-scientists. Thus, the bias in media toward coverage of non-scientific voices may be ‘anti-uncertainty’, not ‘anti-science’. Also, the desire among many climate change scientists to portray unanimity may enhance the perceived seriousness of the potential consequences of climate catastrophes, but paradoxically undermine their credibility in doing so. We explore strategies for communicating extreme forecasts that are mindful of these results.
For decades, climate change researchers and activists have used dramatic forecasts to attempt to influence public perception of the problem and as a call to action on climate change. These forecasts have frequently been for events that might be called “apocalyptic,” because they predict cataclysmic events resulting from climate change. … Rode and Fischbeck, professor of Social & Decision Sciences and Engineering & Public Policy, collected 79 predictions of climate-caused apocalypse going back to the first Earth Day in 1970. With the passage of time, many of these forecasts have since expired; the dates have come and gone uneventfully. In fact, 48 (61%) of the predictions have already expired as of the end of 2020.
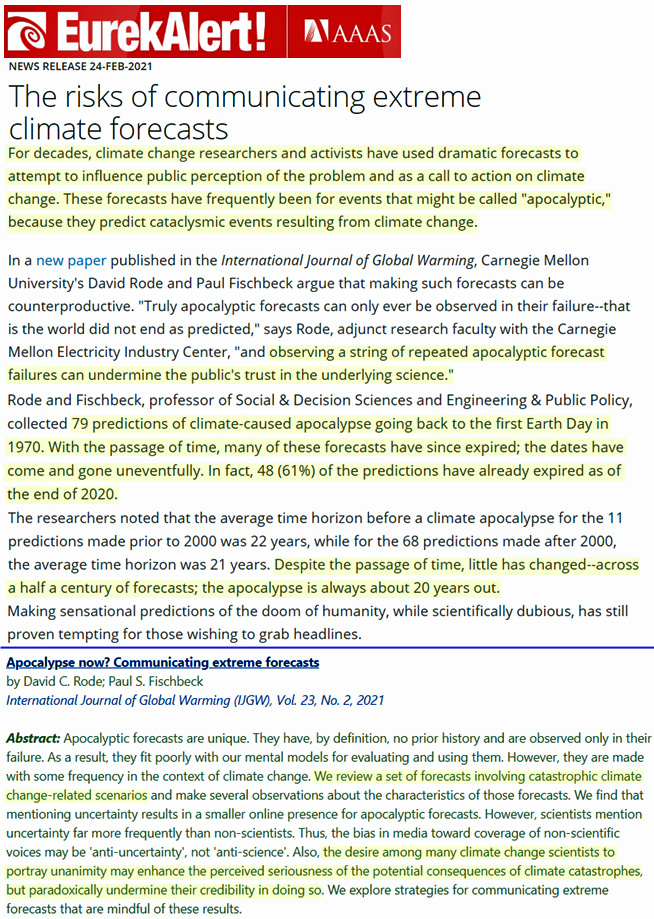
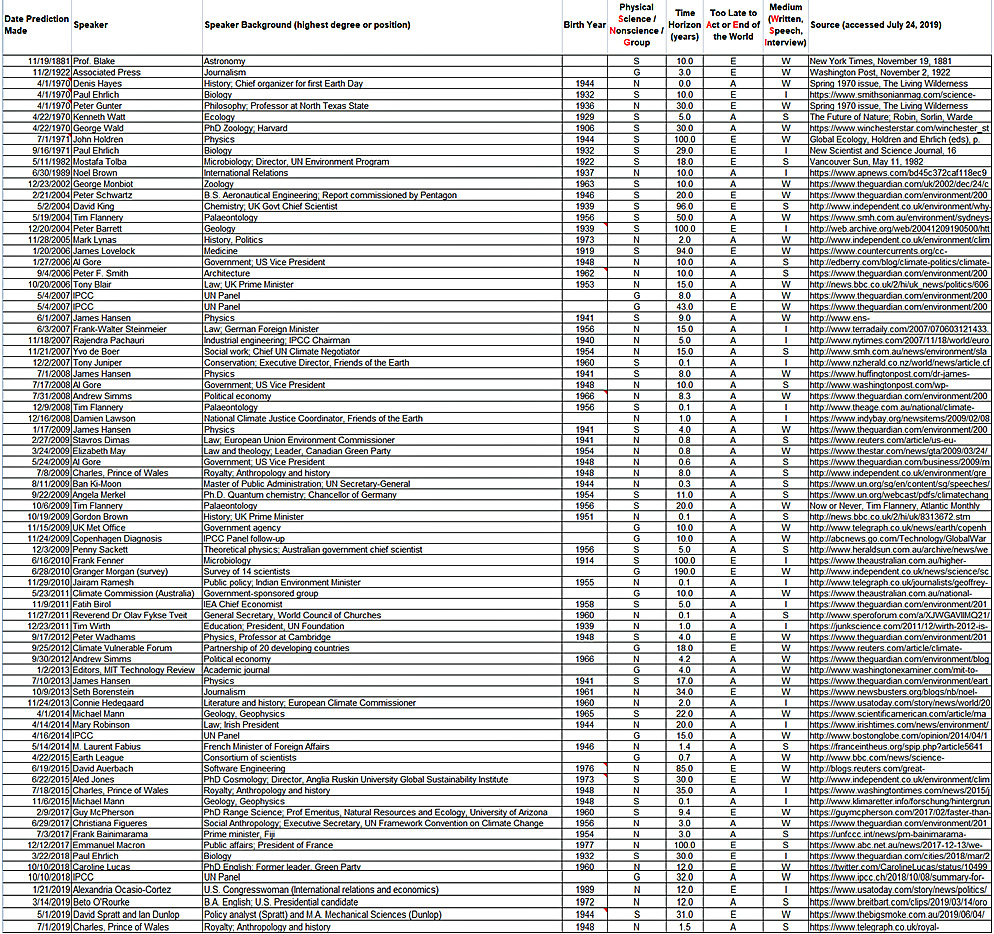


Recent Comments