Germany’s economy expected to dip into recession as Green policies backfire.
Since a coalition of the SPD socialists, Green environmentalists and FDP liberals took over the government in late 2021, the German economy has been declining and business confidence eroding.
Degrowth
Today Blackout News reports that the German socialist/green/liberal government has revised its economic outlook downward once again.
Recall that in 2021 the economy recovered strongly, with GDP growth reaching 2.7%. But at the end of the year, the socialists, greens and liberals took over, pledging to implement a green revolution. Almost immediately the economy slowed to a growth of 1.9% in 2022 and an anemic 0.1% in 2023.
But nothing to worry about, Germany’s economic minister Robert Habeck (Greens) insisted. The malaise was all Russia’s fault, and Germany only needed to stay his green course. The troubles, after all, have little to do with Germany’s skyrocketing energy costs and his green policies. Things will surely improve.
Back to recession
Well, they haven’t. And today, things are getting worse by the minute. According to Blackout News:
Germany’s economic situation has deteriorated drastically this year. Instead of the expected growth, Economics Minister Robert Habeck is now forecasting a decline in economic output. Originally a plus of 0.3 percent was forecast, now a minus of 0.2 percent is being calculated. These new figures reflect the serious situation of the German economy.”
Habeck promises growth – starting next year!
Now, Habeck, who has no financial or economic education at all – see below, wants us to forget 2024 and is promising 1.1% growth for 2025 and a ruddy 1.6% for 2026. Habeck said in a recent interview. “The growth initiative of this federal government is a necessary first step.”
Minister is confident that the German economy will be able to grow more strongly in the coming years if his measures are fully implemented.
Grim future for the Greens
Habeck’s promises haven’t panned out in three years. yet he expects us to believe they will beginning next year. The air is getting very thin for Habeck, his fellow Greens and Socialists. Next year federal elections are taking place and the polls look as grim as the economy.
The liberal arts economist
Economics Minister Robert Habeck studied German language and philosophy and received a Masters Degree in literature and philosophy in 1996. He was awarded doctorate in 2000 and joined the ALLIANCE 90/THE GREENS in 2002. Today he is Germany’s Federal Minister for Economics.
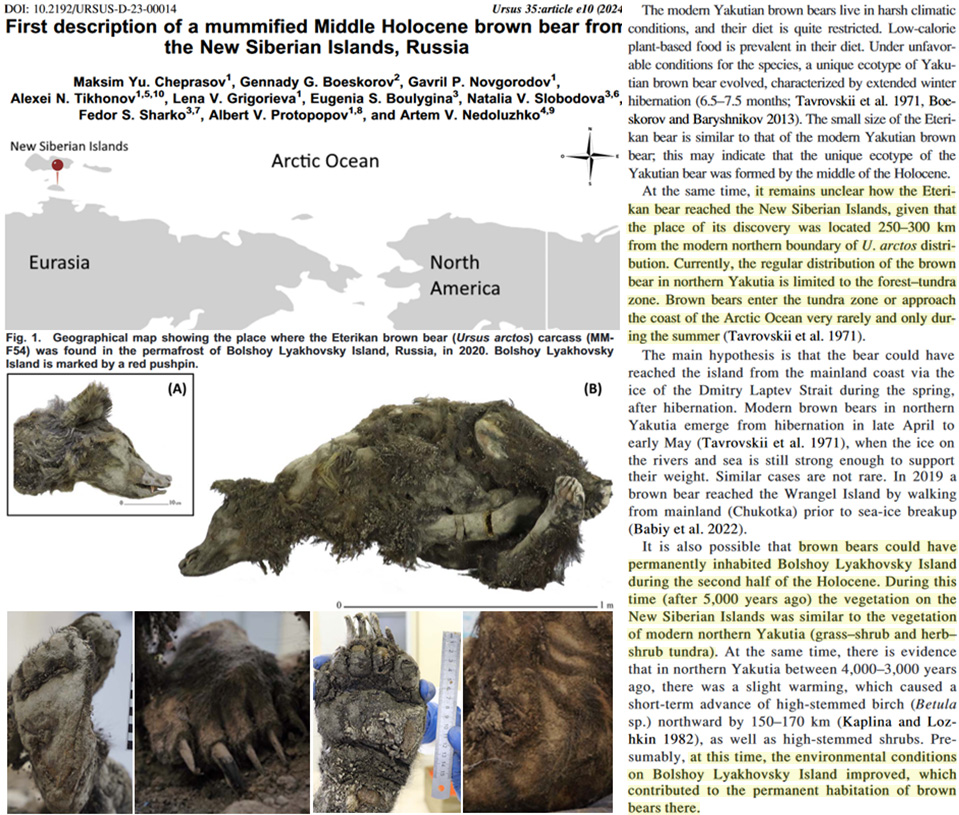
A new study provides still more evidence the Arctic was warmer than it is today as recently as a few thousand years ago.
In 2020 the well-preserved carcass of a Yakutian brown bear (Ursus arctos) was discovered buried in permafrost on the terrain of the treeless tundra Bolshoy Lyakhovsky Island in the Arctic Ocean, 73°N.
The Yakutian brown bear currently occupies only the forested regions of Eurasia, with a northern limit of northern Yakutia (Republic of Sakha), 65°N.
The female bear’s age has been dated to approximately 3500 years ago, during the Middle to Late Holocene. At that time the Arctic was warm enough at that latitude to support vegetation (grasses, shrubs) that only persist in the northern Yakutia region today.
The authors suggest brown bears may have been permanent residents of the Siberian Arctic’s islands from about 5000 years ago until a few thousand years ago, when, as today, the Arctic became too cold for the vegetation production requisite for their sustenance.
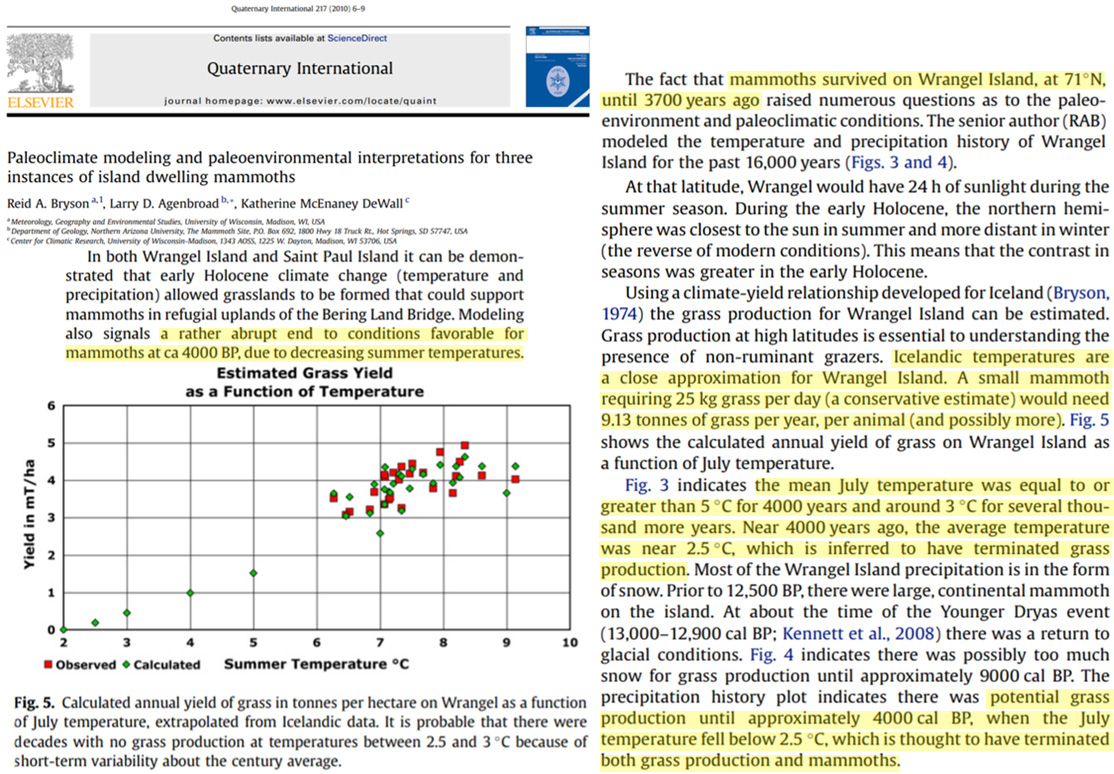
In the same vein, the Arctic’s Wrangel Island (71°N) is home to extensive mammoth remains. Radiocarbon dating indicates the woolly mammoth continued living on this island until 3700 years ago, or until the Arctic climate became too cold to provide enough grass year-round to sustain them (Bryson et al., 2010, Arppe et al., 2019).
A small mammoth is modeled to have conservatively required 25 kg of grass per day to survive. Mean July temperatures decreased from above 5°C during the Early Holocene to below 2.5°C – the threshold for grass production – by about 4000 years ago. Consequently, without enough year-round grass to feed on, the woolly mammoth died out (Bryson et al., 2010).
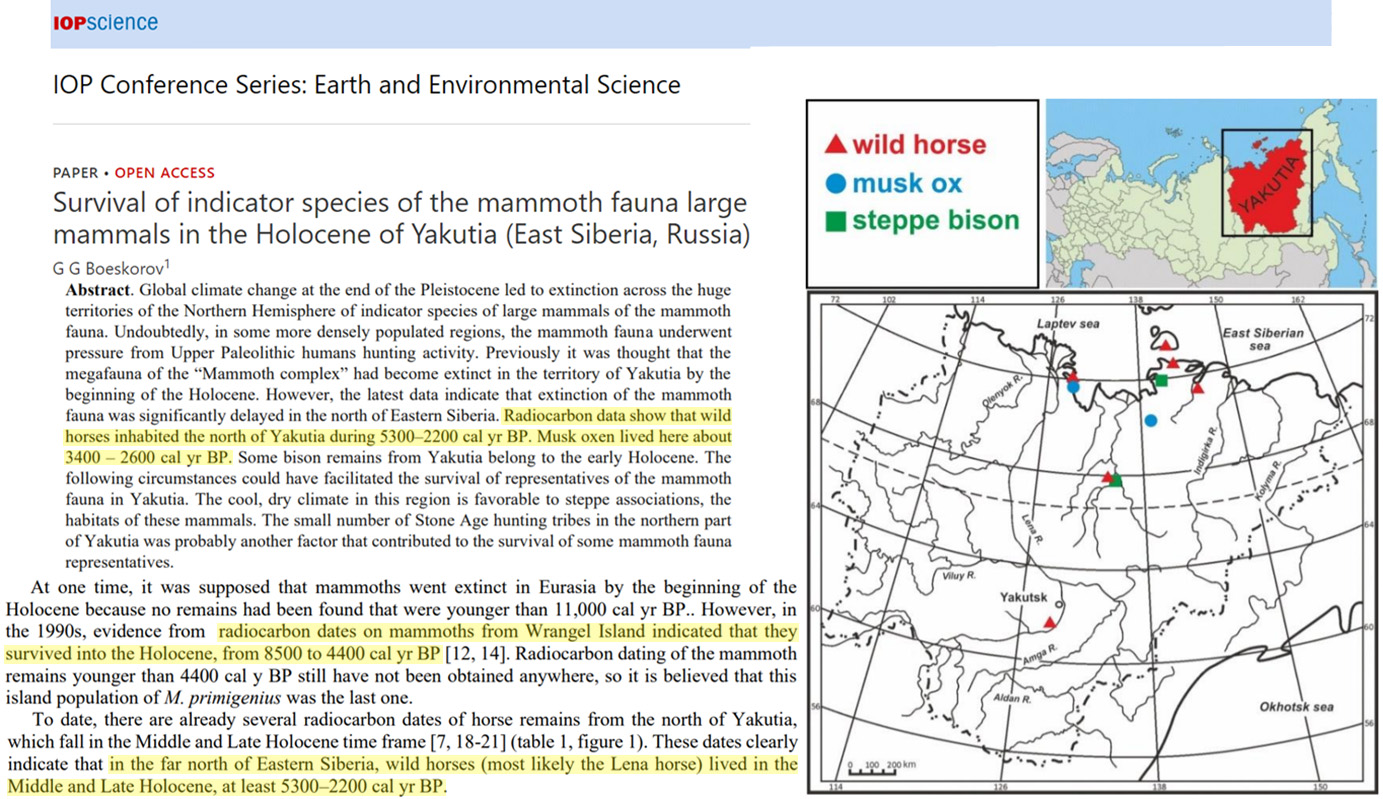
Other research (Boeskorov, 2020) has provided further evidence the Arctic climate was hospitable to grass-eating megafauna until as recently as a few thousand years ago.
The remains of wild horses, musk ox, and bison have been located north of the Arctic circle in the East Siberian Sea (Arctic Ocean) dating to 5300 to 2200 calibrated years before present. The northernmost Siberian climate is far too cold to sustain these large mammals with enough food year-round today.
The researchers at the Potsdam Institute for Climate Impact Research PIK are among the world leaders of the Church of Global Warming and are responsible for various stylistic fantasies such as the “tipping points”.
Stefan Rahmstorf in particular, known since the 2000s for his rabidness (more here), hardly misses an opportunity to spread catastrophic news that is, however, quite easy to refute.
His earlier statement: “We are losing control of the climate system” from 2019 is legendary. When has humanity ever had control over the Earth’s climate?
According to the familiar pattern…
“Too warm – climate catastrophe
Too cold – climate catastrophe
Too dry – climate catastrophe
Too wet – climate disaster
All good – still a climate catastrophe”
…the mass media and their purveyors of doom are currently constructing the apocalyptic climate riders from the Atlantic hurricanes off North America, announcing the imminent end.
In order to activate the viewer’s conformist instinct, the “news” programs like to present luminaries of climate science – currently Stefan Rahmstorf on ZDF German public television, who presents the Milton storm as exceptional and unprecedented. The reason for the weather conditions: industrial carbon dioxide, of course, which is inexorably heating the earth.
But is Rahmstorf’s prediction true?
EIKE Vice President Michael Limburg thinks as follows:
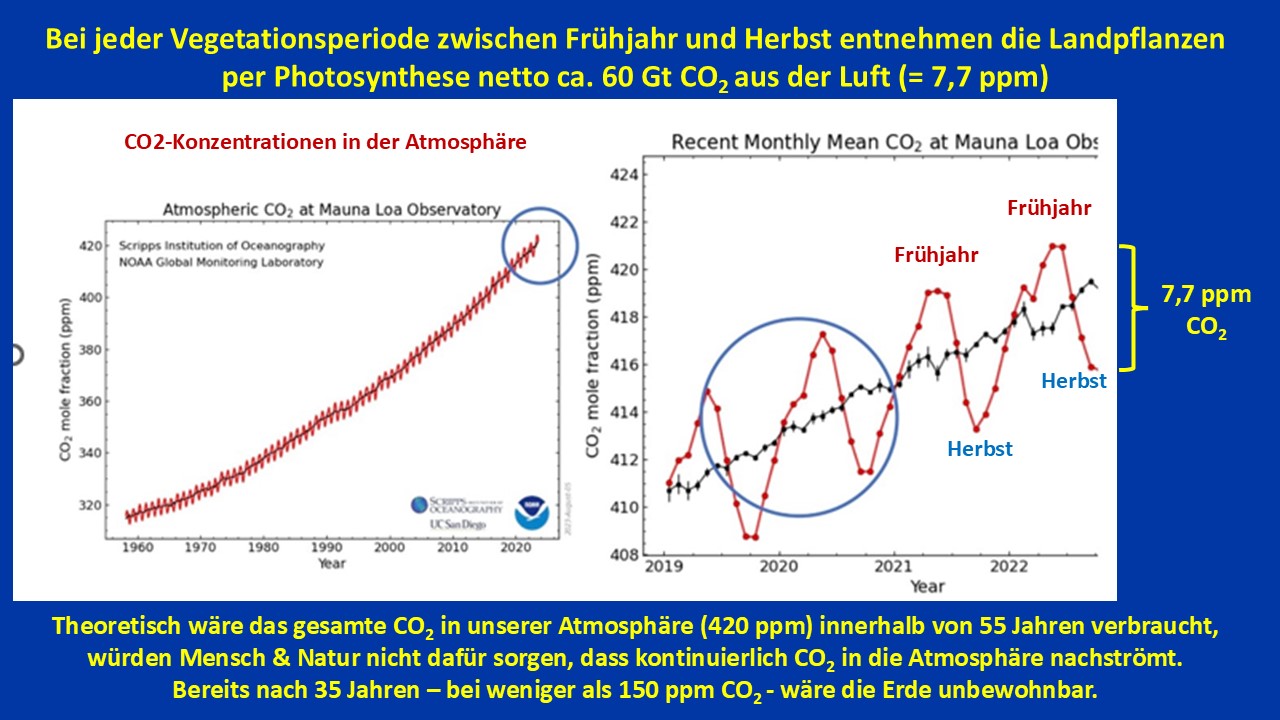
What Rahmstorf is saying is unbelievable. CO2 would remain in the air for 1,000s of years. The correct answer would be a few to a few tens of years. For example, Tom Segalstadt, a geologist from the University of Oslo, has shown in his paper “Carbon cycle modelling and the residence time of natural and anthropogenic atmospheric CO2: on the construction of the ‘Greenhouse Effect Global Warming’ dogma” that the residence time is about 5 years. Ganteför also shows in this video that because of the C14, which rose sharply due to above-ground A-bomb tests after WW2, after a test ban from 1963, the C14 value (allusion to CO14 O2) through the sinks almost fell back to the natural value after approx. 50 years. And the easily accessible data on CO2 concentration on a global scale not only shows the average value, but also the increase and decrease due to plant growth at an annual rate. This difference is about 6-7 ppm, and the duration is 1 year. If the residence time were a thousand or more years, a drop would not even have to show up. Prof. Klaus D. Döhler has also drawn attention to this. See fogure.
Mauna Loa; CO2 in the atmosphere with plant growth
EIKE contributor Josef Kowatsch seconds:
Beginning at the 6: 0 min mark on ‘heute journal’, it starts with the PIK professor’s panicky eyes, hard to believe what Mr. Rahmstorf claimed, CO2 is staying in the air ‘for decades’. Yes, Rahmstorf actually claimed this lie. All he had to do was look at the zig-zag curve of atmospheric CO2 values, the international comparative standard measured at Mauna Loa. Then he would have noticed (or maybe not?) that during each vegetation period from spring to autumn, around 6 ppm of CO2 is removed from the air and metabolized by plants into biomass. If no new CO2 were added, then – from a purely mathematical point of view – all the CO2 in the air on our planet would be metabolized into biomass in just 70 years.
What did he demand? Answer: Immediate zero emissions of CO2 so that the current situation does not get worse. This is alarmist science like in the Middle Ages with the sale of sins that people invented themselves and from which they could buy themselves out. Otherwise there was the threat of a hellish purgatory after death.
How much longer will we put up with this?”
EIKE reader Gerald Pesch writes
Hurricane “Milton” was the prime example of a climate doomsday story gone completely wrong. Heralded by the media as the ultimate storm, the punishment of Gaia for sinful humans, the fastest moving hurricane from Cat 1 to Cat 5 in living memory.
The meteorologists on state television showed graphics with the water temperatures in the Gulf (temperatures that were of course caused by humans…) as an explanation for the imminent apocalyptic event and then, Thursday morning, nothing… I couldn’t believe my eyes, “Welt online” reported shortly before 9:00 a.m. that the all-destroying monster storm had been downgraded to Cat. 1!
The System Media frantically searched for images of the devastation in order to at least be able to provide a retraction battle, then there was silence, other panic topics were sought, Milton was forgotten faster than its fastest gust of wind…
The next storm is sure to come and then they’ll all be back, the “climate experts” from politics and the system media, proclaiming Gaia’s punishment to the sinful people.
What a crazy climate circus is taking place.”
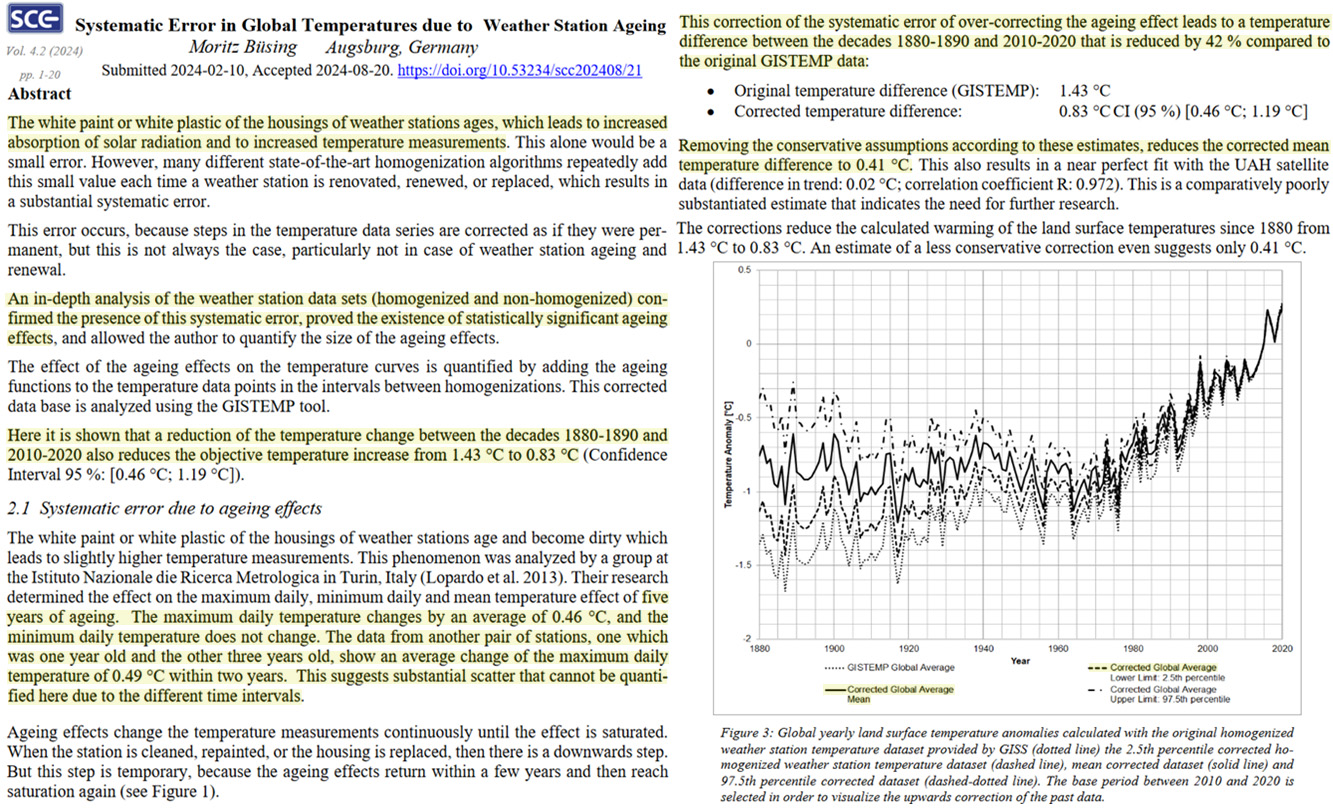
The globe may have only warmed by 0.41 to 0.83°C in the last 140 years.
According to a new study, weather station data has been shown to non-climatically and erroneously record warmer-than-actual temperatures due to the steady and perpetual aging process almost universally observed in temperature gauges.
When a weather station temperature gauge’s white paint or white plastic ages and darkens, this allows more solar radiation to be absorbed by the gauge than when the gauge is bright white and new. Within a span of just 2 to 5 years, a gauge has been observed to record maximum temperatures 0.46°C to 0.49°C warmer than in gauges that have not undergone an aging process. This artificial warming is not corrected in modern data sets, and it builds up over time – even when the gauges are cleaned or resurfaced every few years.
If these systematic artificial warming errors were to be corrected rather than ignored, the 140-year (1880-’90 to 2010-’20) GISTEMP global warming trend plummets from the current estimate of +1.43°C down to +0.83°C, a 42% differential. The temperature reduction can be even more pronounced – from +1.43°C down to +0.41°C – if a set of conservative assumptions (described in detail in the paper) are removed.
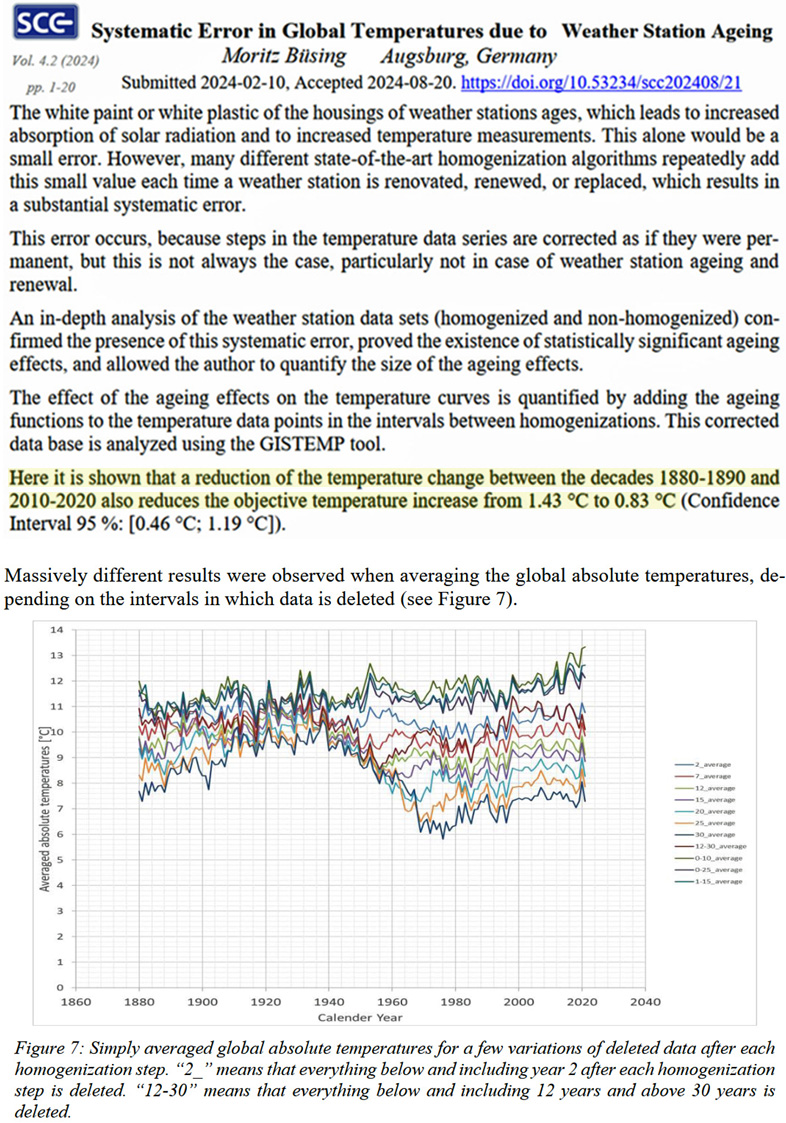
Interestingly, when the systematically erroneous temperature data are removed, or homogenized, at different intervals of time (2 years vs. 12 to 30 years, etc.), the global temperature trend – indeed, the long-term global warming trend – can be shown to effectively disappear, depending on the time interval. This can be observed below, in Figure 7.
As this chart illustrates, temperature data can homogenized, or adjusted, to exhibit just about any trend or non-trend the creator of the chart intends to. Data can be bent and manipulated to show strong warming, weak warming, or even no warming over the last 140 years.
Perhaps the modern version of global warming is not nearly as unprecedented or even unusual as it is purported to be.
North Africa seems to be greening as a result of climate change, which mostly occurs naturally.
Satellite photos and studies have shown that the Sahara desert has been shrinking over the past 40 years, e.g. read here and here.
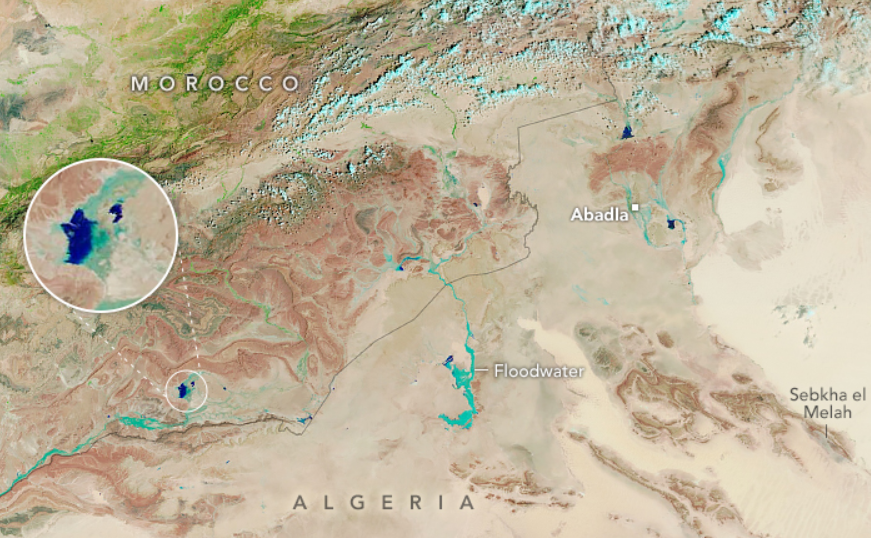
The latest news is from the southeastern Moroccan desert, which is among the driest around the world, where it is reported to have gotten up to 100 mm of rain within a 24 hour period in September. Hard hit were villages 400 miles from the capital city of Rabat, including Tata, reports Al Jazeera here.
“What’s also fascinating is that normally dry lakes in the Sahara are filling due to this event,” said Moshe Armon, a senior lecturer at the Institute of Earth Sciences and the Hebrew University of Jerusalem. Several of these lakes are visible in the image as dark blue areas, including one in Morocco’s Iriqui National Park (shown in detail within the inset circle).
“It’s been 30 to 50 years since we’ve had this much rain in such a short space of time,” added Houssine Youabeb of Morocco’s General Directorate of Meteorology. See more photos here.
“Preliminary satellite analysis shows accumulations of many tens to more than 200 millimeters of rainfall in the areas affected—roughly equivalent to what the region receives in a year. The rainfall accumulation estimates are based on NASA’s IMERG (Integrated Multi-Satellite Retrievals for GPM) data,” NASA reported.
The rains, of course, are welcome, making a harsh region a bit less harsh for those living there. Nothing you’ll hear about in the climate propaganda media.
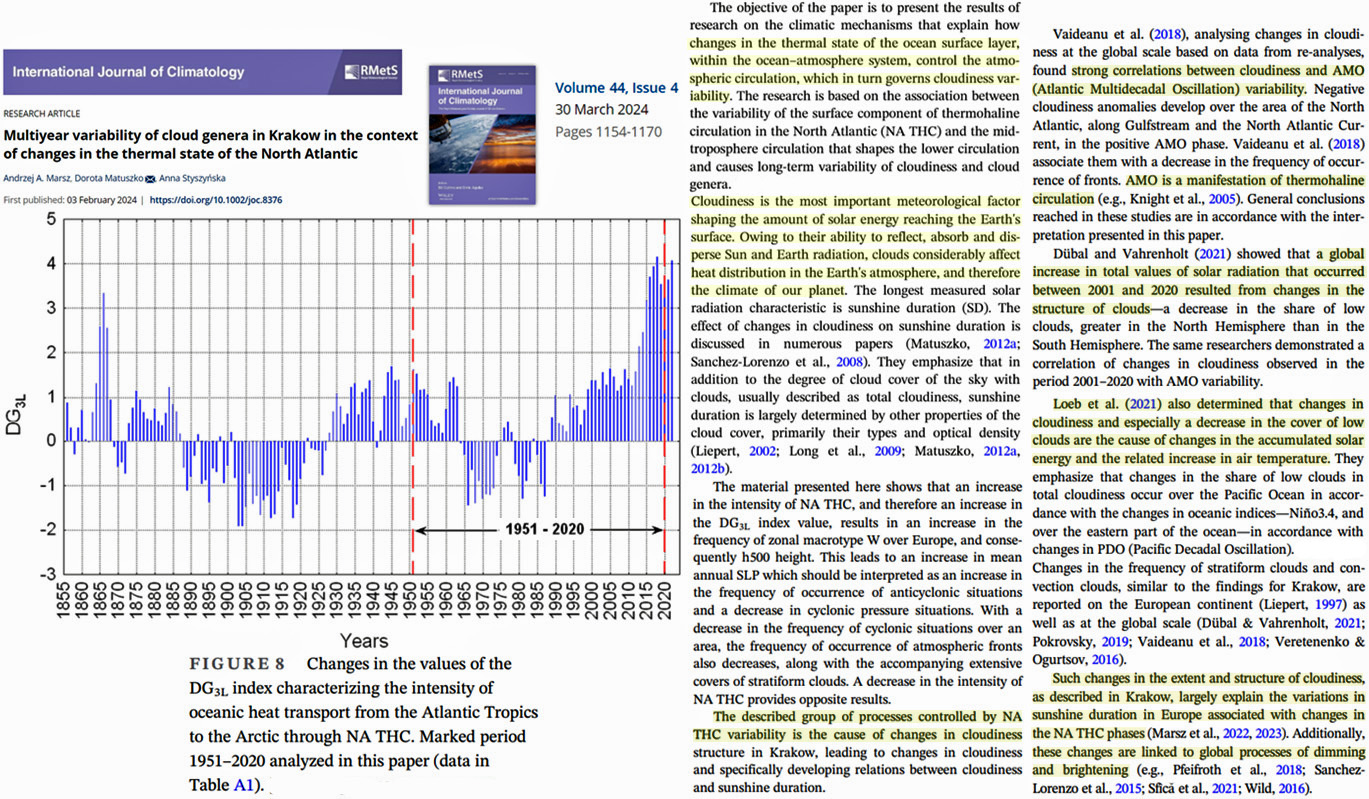
The radiation budget changes shaping trends in global dimming (cooling) and global brightening (warming) are driven by cloud cover changes, which are themselves modulated by internal deep ocean processes.
A new study assesses the associated factors in North Atlantic climate variations, noting how critical clouds are in modulating Earth’s Energy Imbalance (EEI).
“Cloudiness is the most important meteorological factor shaping the amount of solar energy reaching Earth’s surface.”
The authors find cloud changes are seemingly driven by variations in the intensity of the ocean’s internal thermohaline circulation, which is itself associated with AMO, PDO indices.
“…strong correlations between cloudiness and AMO (Atlantic Multidecadal Oscillation) variability. … AMO is a manifestation of thermohaline circulation.”
In turn, cloud changes predominantly determine how much solar energy is absorbed by the Earth’s surface, driving warming or cooling trends.
“…changes in cloudiness…are the cause of changes in the accumulated solar energy and related increase in air temperature”
While this is a regional study using climate data from Krakow (Poland) spanning the last 150 years, especially the 1950-2020 period, the authors point out that the cloud variations and their driving factors are aligned with changes across the European continent, and on a global scale too.
“Such changes in the extent structure of cloudiness…largely explain the variations in sunshine duration in Europe associated with changes in NA THC [North Atlantic thermohaline circulation] phases. Additionally, these changes are linked to global processes of dimming and brightening.”
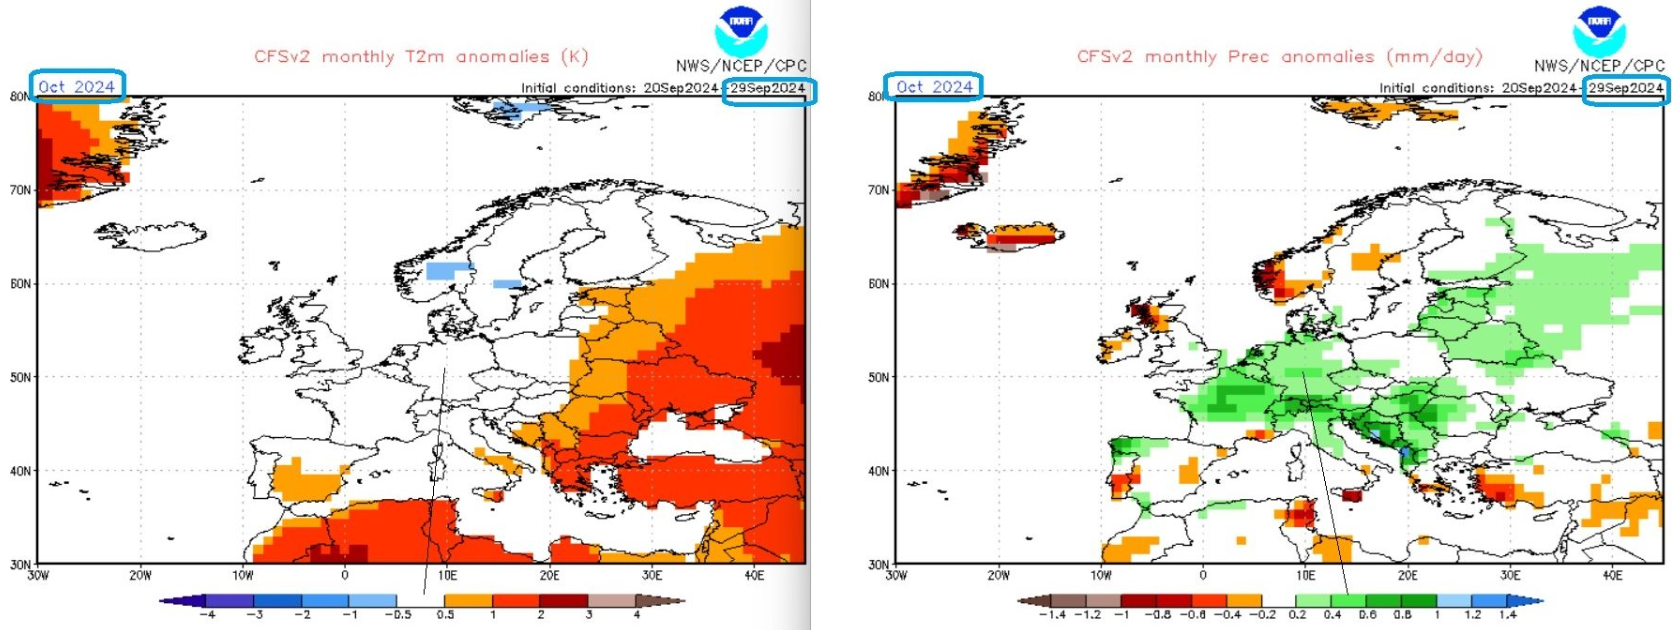
As the chart above depicts, the deviations of the 2m temperatures from the globally valid WMO climate mean 1991-2020 are expected to be around 0°C. Above-average precipitation is expected.
This could be a snowy October at times for the higher altitudes in Germany… It’s a good thing that the gas storage facilities in Germany are almost full to the brim at 96% ahead of the third Russian attack winter in a row… Source: CFSv2 forecasts TA2m and precipitation Europe.
The ECMWF long-term forecasts also predict October 2024 will be quite cool across Central Europe, especially in the first half.
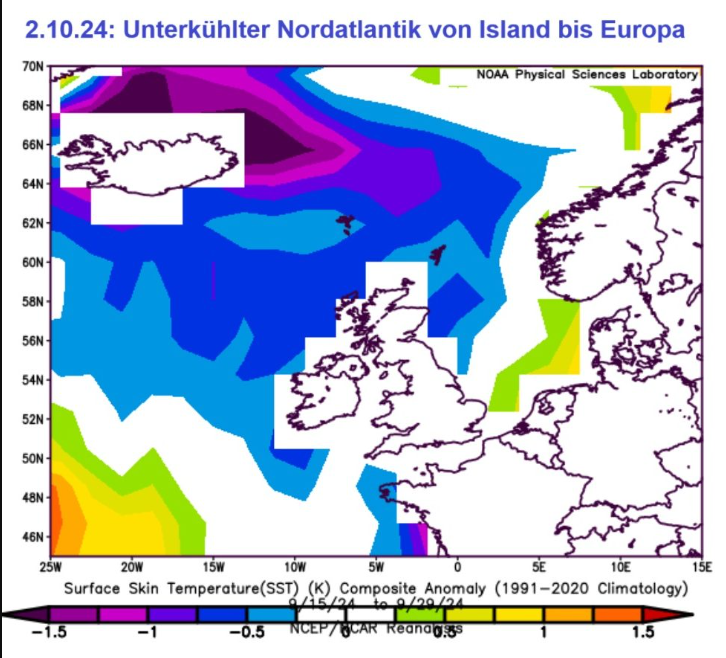
Cold Atlantic sea surface
The North Atlantic sea surface temperature between Iceland and Europe were cooled in the second half of September and offer less warming of the air layers close to the ground with westerly and north-westerly winds in western and central Europe: an indication of a rather cool October?
The NOAA reanalysis shows the North Atlantic between Iceland and Europe in the second half of September 2024 to be undercooled compared to the global WMO climate mean 1991-2020.
With westerly to northwesterly winds, the near-surface subpolar air masses are warmed less than average, suggesting a cool October in western and central Europe.
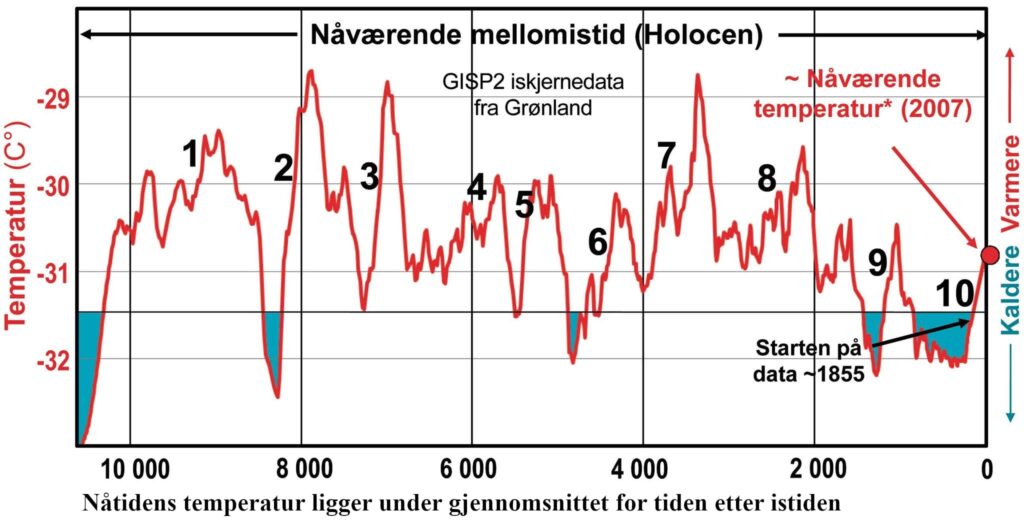
Norwegian climate blog site avdekt.no here reports how the GISP2 ice core data from Greenland shows the current temperature is well below the Holocene average.
Moreover, these temperatures also match perfectly with the historical sources in Norway and Europe, according to avedkt.no.
The chart below shows a temperature reconstruction based on ice cores going back more than 10,000 years.
The temperature over the Holocene was above today’s level on at least 9 occasions, each spanning many years. Indeed today’s temperature is still on the cool side for the Holocene.
Although man is having a heating impact on today’s modern climate through land-use and modest greenhouse gas warming, natural solar and oceanic factors are still far more powerful than man’s impact. How else can the wide variations occurring over the Holocene be explained?
Today’s temperature is still 2°C below the warmer peaks seen 7,900, 7,000 and 3,400 years ago.
The Greenland GISP2 ice core is viewed as a gold standard when it comes to proxy data-based temperature reconstructions, unlike other proxy data reconstructions based on dubious tree ring analyses.
Germany’s green movement was propelled mainly by activists opposed to nuclear power in the 1980s and 90s. Since then, Germany has shut down its entire fleet of nuclear power reactors and is struggling to keep the lights on with renewable energy, mainly wind and sun.
Today German activists are focused on shutting down the remaining fossil fuel power, which in a normal world would make nuclear power attractive again. But not for the fundamentalist enviro-nutjobs. However, they may need to give in if they want to continue enjoying the amenities of the modern digital world and smartphones.
Blackout News here reports. “After Oracle and Microsoft, Google also plans to power its data centers with nuclear power.” apparently, wind and sun just don’t make the grade. CO2-neutrality just won’t be possible without nuclear power.
“Google’s leadership confirms the company is working on large-scale data centers that require over 1 gigawatt of electricity. Sundar Pichai, CEO of Google and Alphabet, spoke last week at Carnegie Mellon University in Pittsburgh about the potential use of small modular nuclear reactors (SMRs) for power generation,” reports Blackout News, citing powermag.
According to reports, Google is currently forming a team to research alternative energies without CO₂ emissions and plans to use small modular nuclear reactors to power its AI data centers.
“We are now working on data centers with over 1 gigawatt of power. Two years ago, we wouldn’t have imagined that, and all of that requires energy,” said Pichai in Pittsburgh.
Today, many of Google’s data centers operate on a basis of about 90 percent CO2-free. But 100% won’t be possible without nuclear, it appears.
Pichai said he sees money going into SMRs …for nuclear energy and that he’s optimistic about the medium to long term energy needs being met.
As AI expands, so is the interest in data centers, which require enormous amounts of power to operate. Oracle CEO Larry Ellison plans to invest more than 10 billion dollars in building data centers and Microsoft aims to restart the reactor at the decommissioned Three Mile Island nuclear power plant in Pennsylvania to meet the energy requirements for AI.
Amazon Web Services plans to buy power from the 2.5-GW Susquehanna nuclear plant for its nearby data center campus.
Big Tech’s move to nuclear energy to power its data centers show that green energies like wind and sun alone cannot meet the energy needs of our modern digital world.
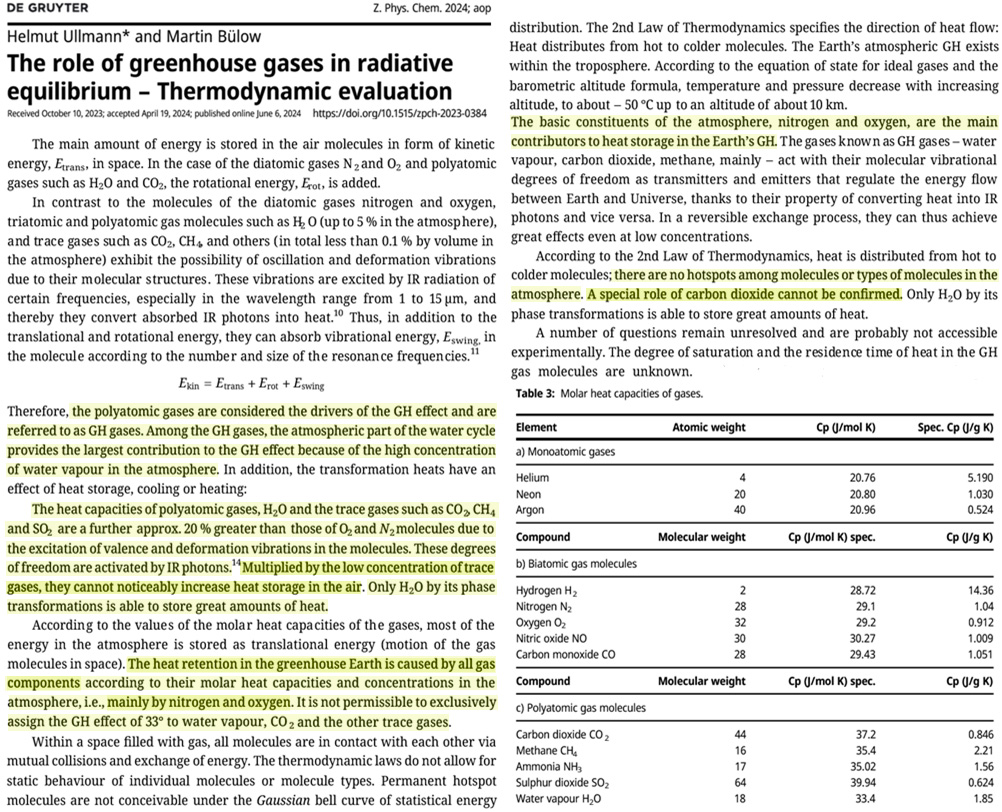
“The heat retention in the greenhouse Earth is caused by all gas components…mainly by nitrogen and oxygen. It is not permissible to exclusively assign the GH effect of 33° to water vapour, CO2, and the other trace gases.” – Ullmann and Bülow, 2024
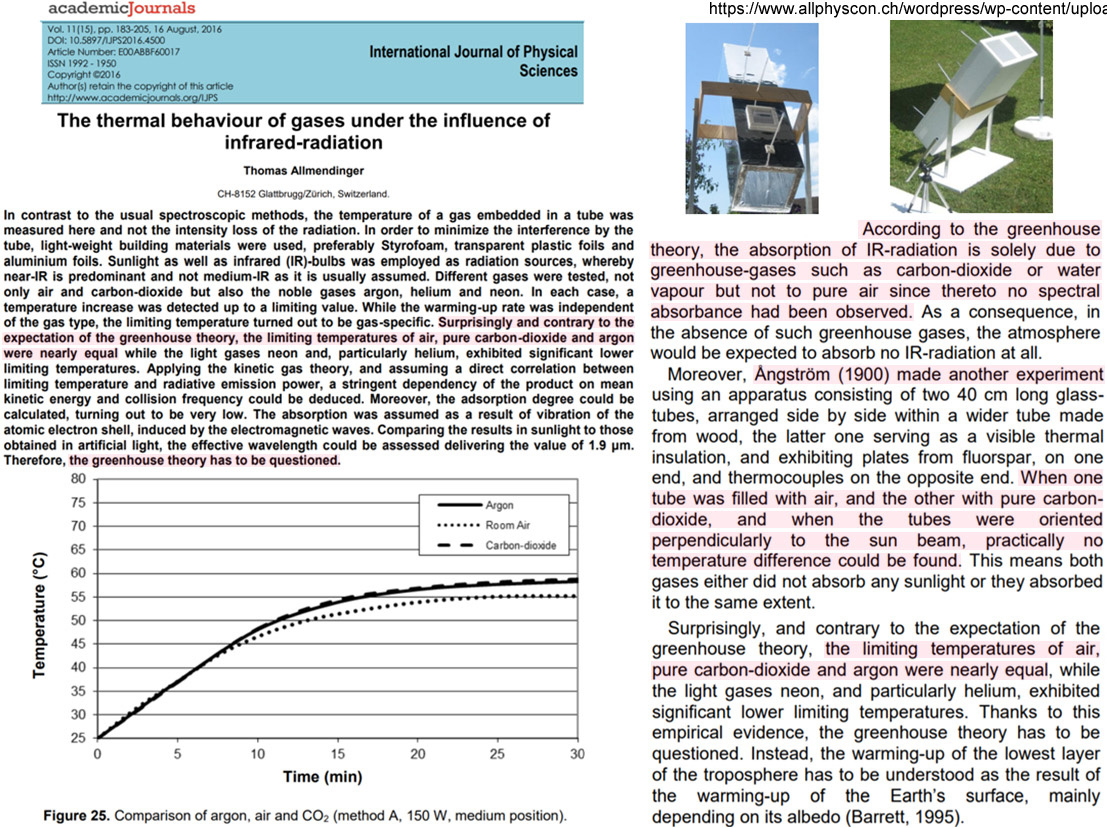
Chemical physicists Helmut Ullmann and Martin Bülow have published a new paper detailing the lack of meaningful or noticeable “specialness” that trace greenhouse gases like carbon dioxide (CO2, 0.042% of the atmosphere) and methane (CH4, 0.00018%) possess in determining Earth’s greenhouse effect heating.
The imagined 33°C greenhouse effect thought experiment
The popularized greenhouse effect thought experiment requires imagining what temperature the Earth would be if there were no atmospheric greenhouse gases (water vapor, CO2, CH4). It is believed these trace (less than 0.1% of the atmospheric composition combined) heat-absorbing gaseous agents, combined with water vapor (up to 4% of the atmosphere in tropical areas), are the only gases capable of restricting heat loss to space. Thus, greenhouse gases are thought to ultimately keep the Earth’s land and ocean surface temperature 33°C warmer (288 K vs. 255 K) than it would otherwise be in their imagined absence.
It is simultaneously imagined that even though oxygen (O2, 21%), nitrogen (N2, 78%), and argon (Ar, 0.9%) together account for 999,000 ppm (99.9%) of the atmosphere’s gaseous composition, none of these gases absorb and re-emit heat, and thus they cannot slow cooling or count as contributors to the imagined 33°C warmer Earth atmosphere. Only the trace gases and water vapor – the so-called greenhouse gases – can slow cooling, or retain heat.
That’s what the thought experiment says, anyway. Physics say otherwise.
The O2 and N2 greenhouse effect
Ullmann and Bülow point out that the greenhouse effect is not only not exclusively determined by trace greenhouse gases like CO2 or CH4, but these trace gases play such an unimportant role that they’re not even noticeable. Only water vapor has the capacity to absorb heat to a degree that is detectable. The primary gaseous determinants of Earth’s greenhouse effect are not trace gases like CO2 and CH4, but, consistent with their atmospheric abundance, N2 and O2.
“The basic constituents of the atmosphere, nitrogen and oxygen, are the main contributors to heat storage in the Earth’s GH [greenhouse effect].”
“The heat retention in the greenhouse Earth is caused by all gas components…mainly by nitrogen and oxygen. It is not permissible to exclusively assign the GH effect of 33° to water vapour, CO2, and the other trace gases.”
Non-greenhouse gases absorb heat too
There is good reason to conclude O2 and N2 are the primary greenhouse effect determinants. Contrary to popular belief, real-world experiments show that N2, O2, and Ar actually do absorb heat, albeit about 20% less effectively than the so-called greenhouse gases do. A mere 20% dropoff is not significant when the abundance (99.9%) of these gases is considered relative to the abundance (less than 0.1%) of greenhouse gases.
“The heat capacities of polyatomic gases, H2O and the trace gases such as CO2, CH4, and SO2 are a further approx. 20% greater than those of O2 and N2 molecules. … Multiplied by the low concentration of trace gases, they cannot noticeably increase heat storage in the air. Only H2O…is able to store great amounts of heat.”
As mentioned, this phenomenon has been observed experimentally. For example, when air (99% O2 and N2), pure (100%) CO2, and pure (100%) Ar are warmed in experimental conditions, they all absorb heat to nearly the same degree.
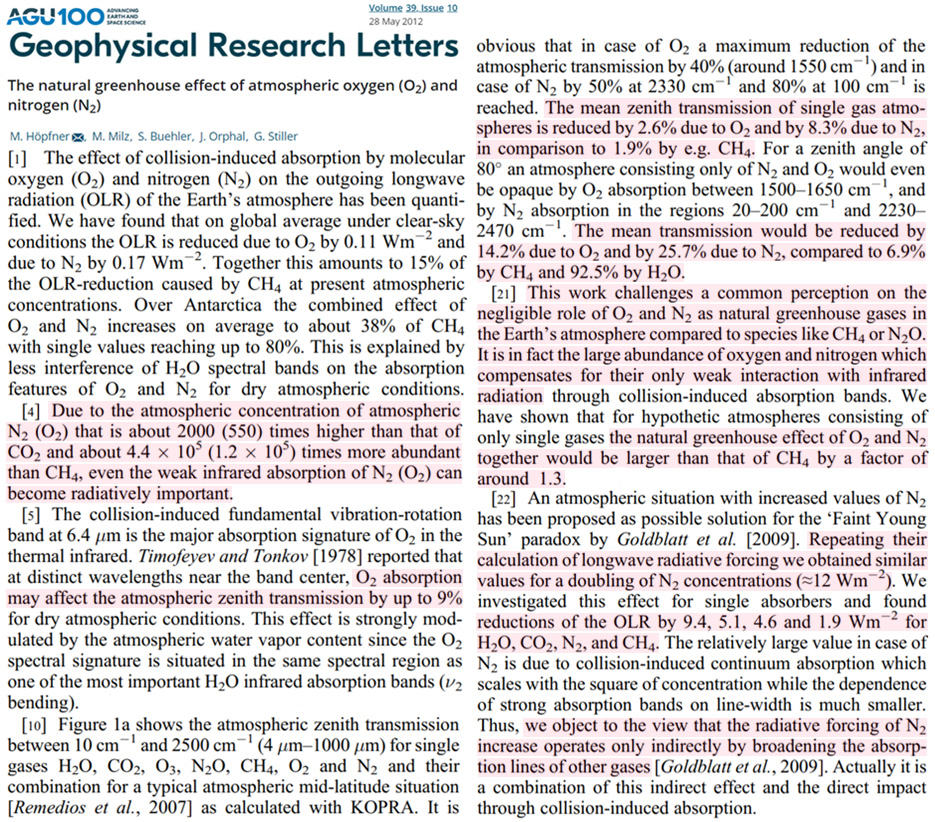
An earlier work published in Geophysical Research Letters (Hopfner et al., 2012) also clarifies that O2 and N2 should be considered “natural greenhouse gases in Earth’s atmosphere.” Although O2 and N2 absorb heat (infrared radiation) more weakly than CO2 and CH4, they do indeed absorb heat, and they do not have a negligible role in Earth’s greenhouse effect because of their relative abundance when compared to CO2 and CH4.
“This work challenges a common perception on the negligible role of O2 and N2 as natural greenhouse gases in Earth’s atmosphere…”
“It is in fact the large abundance of oxygen and nitrogen which compensates for their only weak interaction with infrared radiation…”
“Due to the atmospheric concentration of atmospheric N2 (O2) that is about 2000 (550) times higher than that of Co2 and about 4.4 x 10⁵ (1.2 x 10⁵) times more abundant than CH4, even the weak infrared absorption of N2 (O2) can become radiatively important.”
“Thus, we object to the view that the radiative forcing of N2 increase operates only indirectly by broadening the absorption lines of other gases.”
Finally, Drs. Ullmann and Bülow emphasize just how non-special CO2 is as a greenhouse gas in Earth’s atmosphere. As noted above, they point out that CO2’s contribution to the greenhouse effect is not even noticeable. They also assert that the laws of physics require there is no so-called “hotspot” in Earth’s atmosphere due to the conglomeration of CO2 molecules. There is nothing CO2 does that is thermally “special” relative to other gases.
“According to the 2nd Law of Thermodynamics, heat is distributed from hot to cold molecules; there are no hotspots among molecules or types of molecules in the atmosphere. A special role of carbon dioxide cannot be confirmed.”
In a conversation with the EIKE editorial team, our reader Garik Müller noted that recent solar storms have promoted cloud formation – which would contradict the Svensmark-Shaviv effect and the Forbush effect.
But the Earth’s atmosphere is known to be much more complicated than the computer models of climate researchers – solar radiation can also have a different effect under different circumstances.
A discussion article by Garik Müller
Question from EIKE:
When there is a lot of solar wind, the particles from space are deflected away from the earth, the Forbush effect. If there are fewer particles, there are fewer cloud nuclei. The recent solar ejections should therefore have reduced the clouds, nnless certain solar events produce particles that can penetrate the van Allen belt.
Garik Müller:
It is high-energy radiation that comes both from the cosmic realm and is emitted towards the Earth during certain solar activities. Usually the starting point on the sun points away from the Earth. This time, however, the Earth was directly in focus. Due to the cascade effect, the ionizing radiation reaches the troposphere.
The Forbush effect actually only works if the “solar storm” points towards the Earth at the same time.
If it is offset in time, it does not have such a strong effect.
However, the Svensmark-Shaviv effect, which I believe to be conclusive and correct after having studied it for a long time, is only the first stumbling block in events like this year and is far more strongly influenced by the sun. There was still little cloud cover until the beginning of June. As a result, we had higher global surface temperatures, which subsequently fell, as the evaporation rate over the oceans increased considerably, which in turn led to a partial fall in sea surface temperatures, especially in the Atlantic and Pacific.
After that, there was a period of increased solar activity, as I was able to learn from observations of a friend in Frankfurt. Whenever large-scale cloud formation began, the number of sunspots were considerably higher. This has also been the case recently. It has also been interesting to observe that the processes were always congruent in time.
If you then take the work of Zharkova, it seems striking that such events seem to accumulate towards the end of a solar maximum, which then often coincides with local weather phenomena such as the current one, which again raises many questions. It becomes unpleasant when the flow systems intensify the whole thing together with the topographical conditions.
The reactions from the climate hysterics are neither helpful nor appropriate. BBut then it becomes so mathematically complex that 99.9% of scientists can hardly describe it. Meticulous work would be necessary. This cannot be done using existing algorithmic models because the models would then crash.
This is the point where mathematics catches up with conventional theory. There is some work on this, but you won’t find anything about it without targeted research.
The idea came to me when I thought of my work on meson passages in this context. The theoretical foundations from this are very helpful for this topic.
More literature on this:
[1] Review of Particle Physics, C. Amsler et al., Physics Letters B667, 1 (2008)
[2] O.C. Allkofer, H. Jokisch, A survey on the recent measurements of the absolute vertical cosmicray muon flux at sea level, Il Nuovo Cimento A (1971-1996), Volume 15, Number 3, 1973, Pages 371-389.
[3] Thomas Hebbeker, Charles Timmermans, A compilation of high energy atmospheric muon data at sea level, Astroparticle Physics, Volume 18, Issue 1, August 2002, Pages 107-127.
[4] M. Fuidl, Kosmische Myonen in Schulversuchen, Johannes-Gutenberg-Universitaet Mainz, Institut fur¨ Physik, September 2003.
[5] C. Wiebusch, Astroteilchenphysik -Vorlesungsskriptum, RWTH Aachen, III. Physikalisches Institut, Sommer 2010.
[6] S. Schael, Teilchen und Astrophysik -Vorlesungsskriptum, RWTH Aachen, I. Physikalisches Institut, Winter 2008.
[7] W.R.Leo: Techniques for Nuclear and Particle Physics Experiments, Springer Verlag 1987
[8] J.Krieger, GNU Public License / wikimedia Commons http://upload.wikimedia.org/wikipedia/commons/a/ab/Photomultiplier_schema_de.png
[9] J.N. Crookes, B.C. Rastin, An investigation of the absolute intensity of muons at sea-level, Nuclear Physics B, Volume 39, 1 April 1972, Pages 493-508.
[12] R. Haeusler, A. F. Badea, H. Rebel, I. M. Brancus, J. Oehlschlager, Distortions of experimental muon arrival time distributions of extensive air showers by the observation conditions, Astroparticle Physics, Volume 17, Issue 4, July 2002, Pages 421-426.
[13] Allkofer, O. C., Grieder, P. K. F., Cosmic Rays on Earth, Physik Daten, ISSN 0344-8401, 1984.
[14] Helios Dr. Bulle GmbH & Co. KG, Tea Boy Nr. 3334 -002 http://www.helios-wertheim.com/Sitemap/Tea_Boy/
[15] S. Sciutto, COSMUS work group, AIRES Simulations http://astro.uchicago.edu/cosmus/projects/aires/
[16] Auger Engineering Array Group, Pierre Auger Observatory http://www.auger.org/observatory/animation.html
[17] F. Schmidt, CORSIKA Shower Images http://www.ast.leeds.ac.uk/~fs/showerimages.html
[18] K.-H. Kampert and A. A. Watson. Extensive air showers and ultra high-energy cosmic rays: a historical review., European Physical Journal H 37:359-412 (August 2012). doi:10.1140/epjh/e2012-30013-x
[19] I. Allekotte et al., The Surface Detector System of the Pierre Auger Observatory , Nucl. Inst. Meth., vol. A586, pp. 409-420 (2008), arXiv:astro-ph/0712.2832
[20] J. de Mello Neto (for the Pierre Auger Collaboration), Studies of Cosmic Rays at the Highest Energies with the Pierre Auger Observatory, EPJ Web of Conferences(2014), doi: http://dx.doi.org/10.1051/epjconf/20147100036
[21] J. Bl¨ orandel, Cosmic rays from the knee to the highest energies, Progressumer, R. Engel and J.R. H¨ in Particle and Nuclear Physics, vol. 63, p. 293-338 (October 2009),http://arxiv.org/abs/0904. 0725
[22] M.G. Aartsen et al., Observation of High-Energy Astrophysical Neutrinos in Three Years of IceCube Data, IceCube Collaboration, Phys.Rev.Lett., Volume 113, 2014 http://arxiv.org/abs/1405.5303
[23] Anne Schukraft, Search for a diffuse flux of extragalactic neutrinos with the IceCube Neutrino Observatory, Dissertation, Rheinisch-Westf¨alische Technische Hochschule (RWTH) Aachen, June 2013
[24] IceCube Collaboration, Evidence for High-Energy Extraterrestrial Neutrinos at the IceCube Detector, Science, 22 November 2013, Vol. 342 no. 6161, DOI: 10.1126/science.1242856
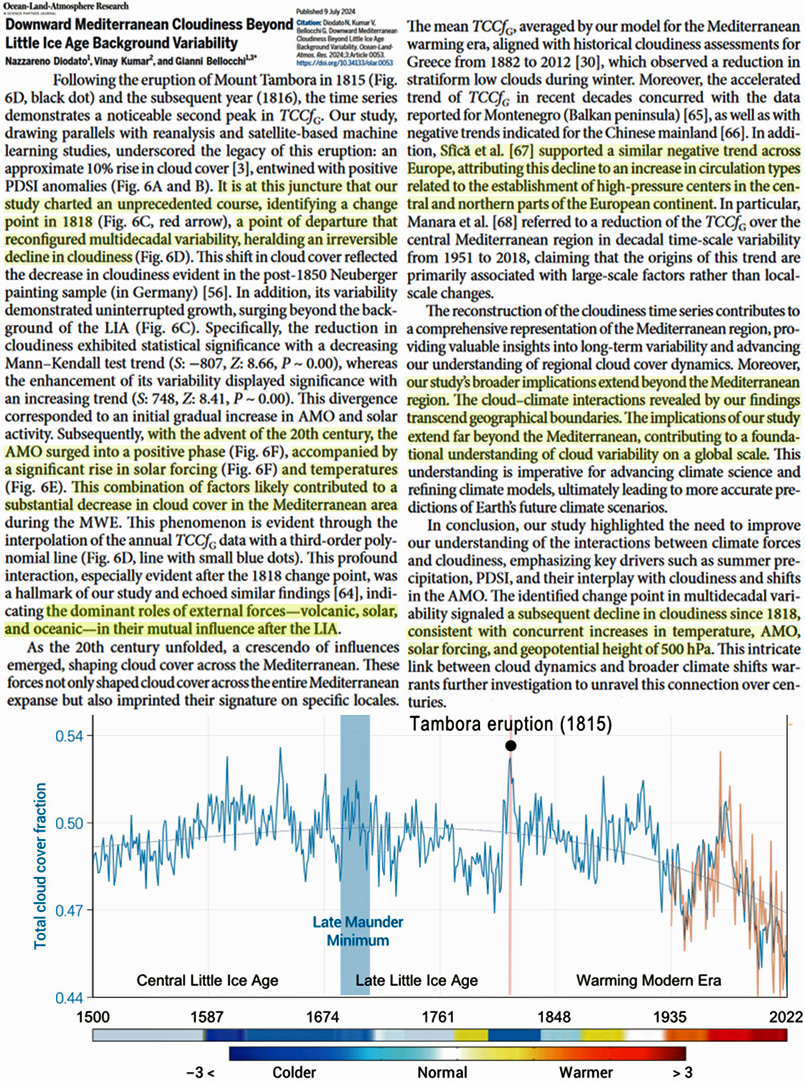
Per a new study, the last 200 years of global warming are associated with cloud cover decline, and this decreasing cloud albedo can be linked to “the dominant roles of external forces – volcanic, solar, and oceanic – in their mutual influence after the LIA [Little Ice Age].”
Scientists have now formulated new 1500 to 2022 CE reconstruction of cloud cover over the Mediterranean region. The authors suggest their reconstruction of cloud cover may be representative of more than just this region, as it is a product of large scale processes that may “transcend geographical boundaries.” In other words, what happens in the Mediterranean region may well have global implications.
The reconstruction indicates the modern declining cloud cover trend may not only have been occurring since 2000, but, except for a brief increasing period from about 1945 to 1980 (that coincided with a global cooling trend), has been ongoing for over 200 years. The “turning point” years were 1815-1818, following the eruption of Mount Tambora. From that point on there has been a precipitous decline in cloud cover that departs from multi-decadal variability.
The authors suggest the “dominant” factors linked to the post-1800s include solar forcing, volcanic forcing, and the Atlantic Multi-decadal Oscillation (AMO).
“Our study…indicating the dominant roles of external forces – volcanic, solar, and oceanic – in their mutual influence after the LIA”
“This combination of factors [AMO surging to a positive phase, a significant rise in solar forcing] likely contributed to a substantial decrease in cloud cover in the Mediterranean area.”
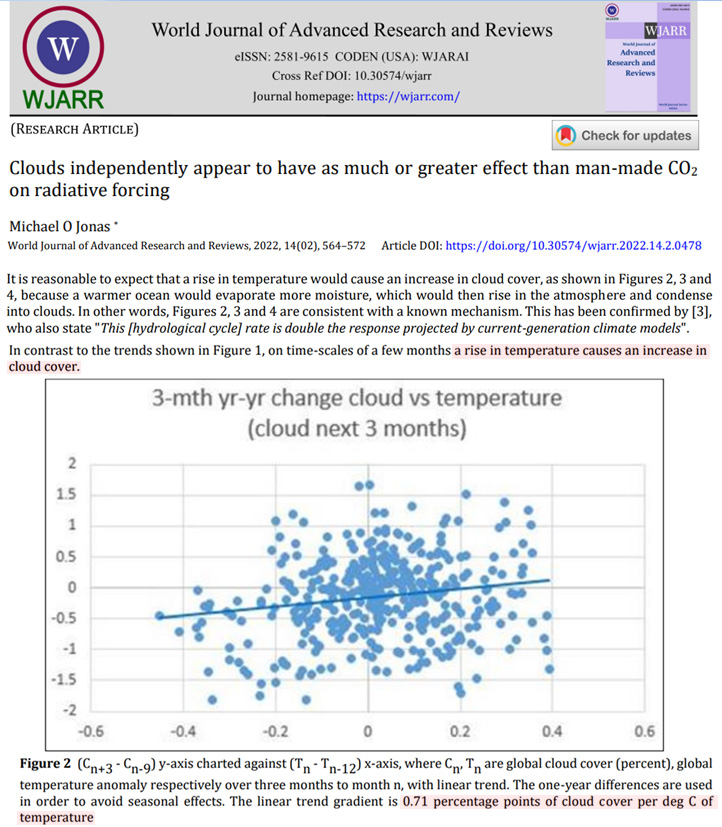
Interestingly, the authors also repeat the model-based assumption that the post-LIA rising temperatures could have been a contributing causal factor in the 1800s-to-present cloud cover decline. In other words, the warming led to cloud decline, and not the other way around. This assumption is odd, at best. It is well known warmer seawater adds more water to the air than cooling seawater. Which is why, for example, water vapor concentrations reach 35,000 ppm in the tropics, but less than 1,000 ppm at the poles.
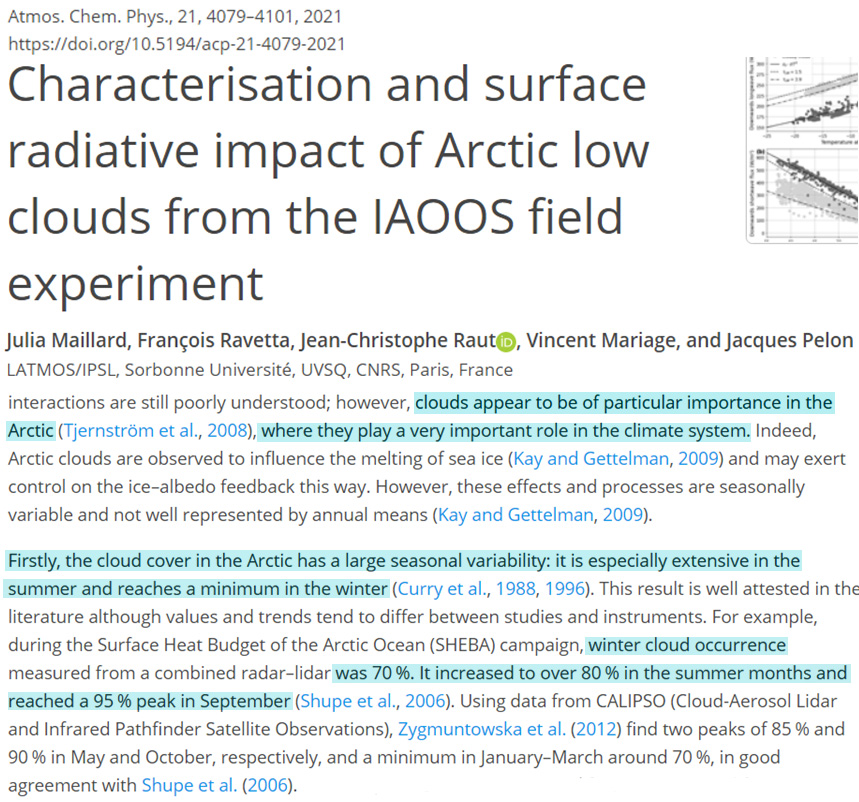
Also, it is well known that warmer summers are cloudier than colder winters (see Malliard et al., 2021 and Abrahim et al., 2022 below, for example). Cloudier summers can be 10 to 15°C warmer than clearer-sky winters across the middle and high latitudes. In contrast, the modern warming trend of only tenths of a degree in recent decades could only produce negligible changes in clouds relative to these much larger seasonal temperature changes. Besides, a decline in cloud cover is the opposite of what occurs with warmer temperatures anyway.
Anthropogenic global warming apologists want to believe the observed decline cloud cover in recent decades is human caused. Thus, climate model inputs have been programmed to say warming from rising greenhouse gases leads to cloud decline, and cloud decline leads to more warming – a perpetual, runaway positive feedback.
Problematically, actual, real-world observations show warming leads to cloud increases, not decreases. Thus, neither warming nor rising greenhouse gases can explain the observed modern cloud decline.
And since declining cloud cover, a function of “unforced internal variabilty,” allows more solar radiation absorption at the surface, this can explain modern warming.
By continuing to use the site, you agree to the use of cookies. more information
The cookie settings on this website are set to "allow cookies" to give you the best browsing experience possible. If you continue to use this website without changing your cookie settings or you click "Accept" below then you are consenting to this. More information at our Data Privacy Policy


Recent Comments