
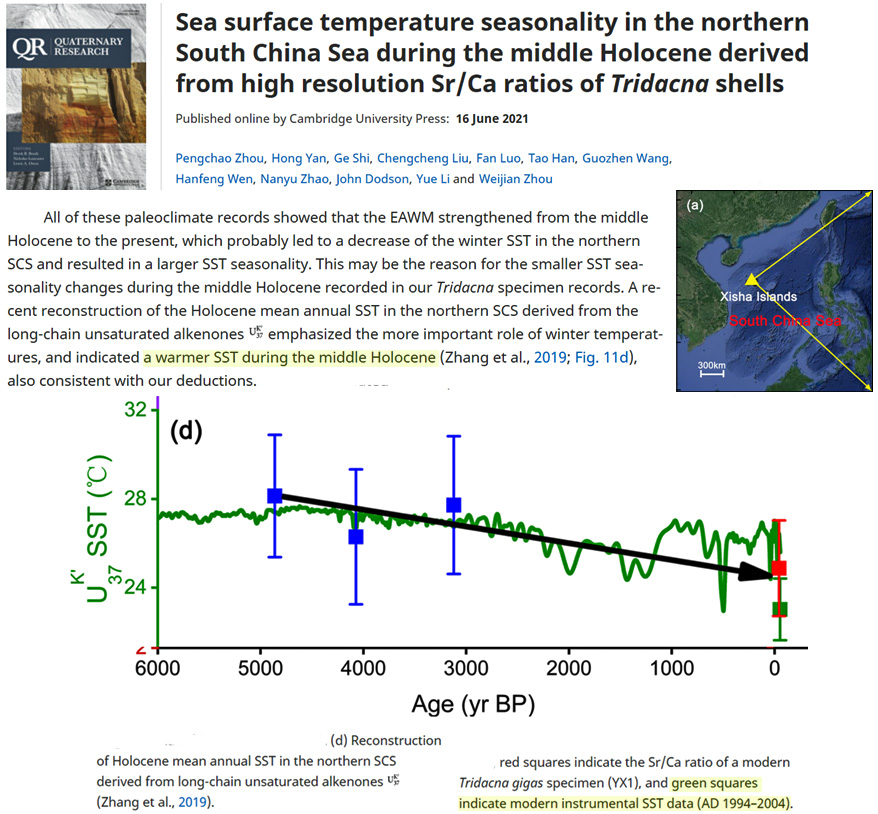
Zhou et al., 2021 South China Sea ~4°C warmer SST during the Middle Holocene…1994-2004 coldest temperatures of the last 6000 years
Tarasov et al., 2021 (full paper) Arctic Siberia was 3.5 to 5°C warmer than today during the peak of the last glacial (180 ppm CO2), providing year-round grass grazing for large herbivores
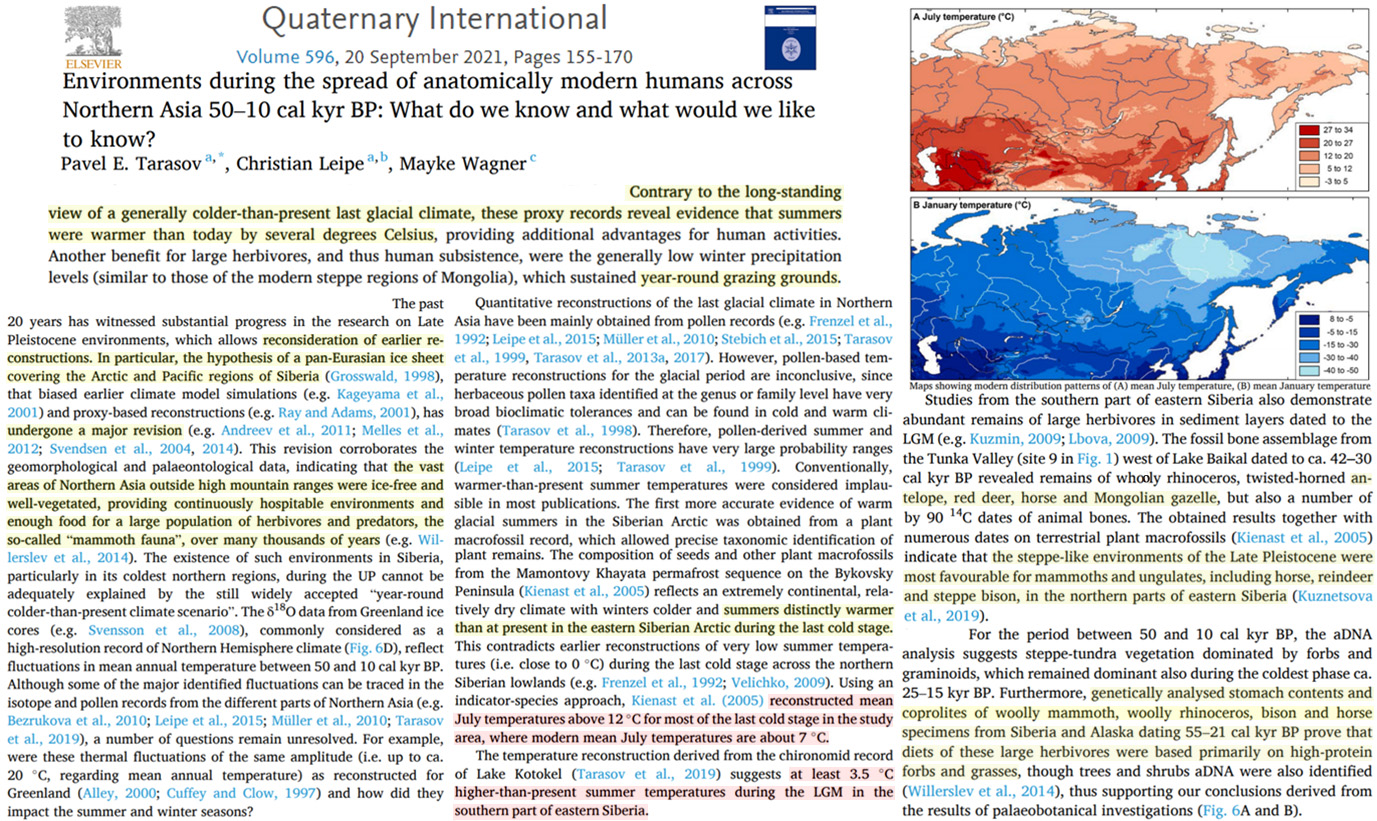
Environments during the spread of anatomically modern humans across Northern Asia 50–10 cal kyr BP …. Northern Asia (here, the Russian Federation east of the Urals) played a key role in the spread of anatomically modern humans (AMH) across the Eurasian continent during the Upper Palaeolithic (UP). … Contrary to the long-standing view of a generally colder-than-present last glacial climate, these proxy records reveal evidence that summers were warmer than today by several degrees Celsius, providing additional advantages for human activities. Another benefit for large herbivores, and thus human subsistence, were the generally low winter precipitation levels (similar to those of the modern steppe regions of Mongolia), which sustained year-round grazing grounds. These factors apparently outweighed the harsh colder-than-present winter conditions and promoted habitation of AMH in Northern Asia even during the Last Glacial Maximum (LGM) ca. 30‒18 cal kyr BP. … [R]econstructed mean July temperatures 12°C for most of the last cold stage in the study area, where modern mean July temperatures are about 7°C … [A]t least 3.5°C higher-than-present summer temperatures during the Last Glacial Maximum [CO2 180 ppm] in the southern part of eastern Siberia
Wetterich et al., 2021 Siberian Arctic had “warmer-than-today temperatures (by up to 4–4.5° C)” during the last glacial (180 ppm CO2), or between “39 and 31 cal kyr BP”
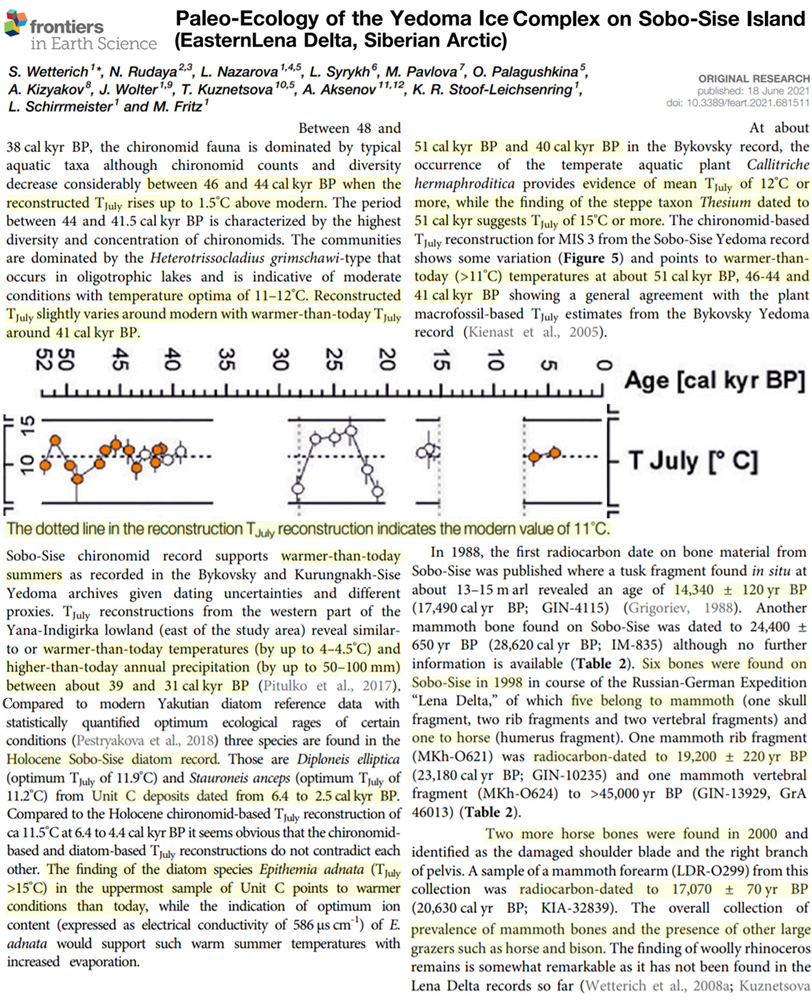
Between 48 and 38 cal kyr BP, the chironomid fauna is dominated by typical aquatic taxa although chironomid counts and diversity decrease considerably between 46 and 44 cal kyr BP when the reconstructed TJuly rises up to 1.5°C above modern. The period between 44 and 41.5 cal kyr BP is characterized by the highest diversity and concentration of chironomids. The communities are dominated by the Heterotrissocladius grimschawi-type that occurs in oligotrophic lakes and is indicative of moderate conditions with temperature optima of 11–12°C. … Reconstructed TJuly slightly varies around modern with warmer-than-today TJuly around 41 cal kyr BP. … At about 51 cal kyr BP and 40 cal kyr BP in the Bykovsky record, the occurrence of the temperate aquatic plant Callitriche hermaphroditica provides evidence of mean TJuly of 12° C or more, while the finding of the steppe taxon Thesium dated to 51 cal kyr suggests TJuly of 15°C or more. The chironomid-based TJuly reconstruction for MIS 3 from the Sobo-Sise Yedoma record shows some variation (Figure 5) and points to warmer-than today (>11° C) temperatures at about 51 cal kyr BP, 46-44 and 41 cal kyr BP showing a general agreement with the plant macrofossil-based TJuly estimates from the Bykovsky Yedoma record (Kienast et al., 2005). … TJuly reconstructions from the western part of the Yana-Indigirka lowland (east of the study area) reveal similarto or warmer-than-today temperatures (by up to 4–4.5° C) and higher-than-today annual precipitation (by up to 50–100 mm) between about 39 and 31 cal kyr BP (Pitulko et al., 2017)
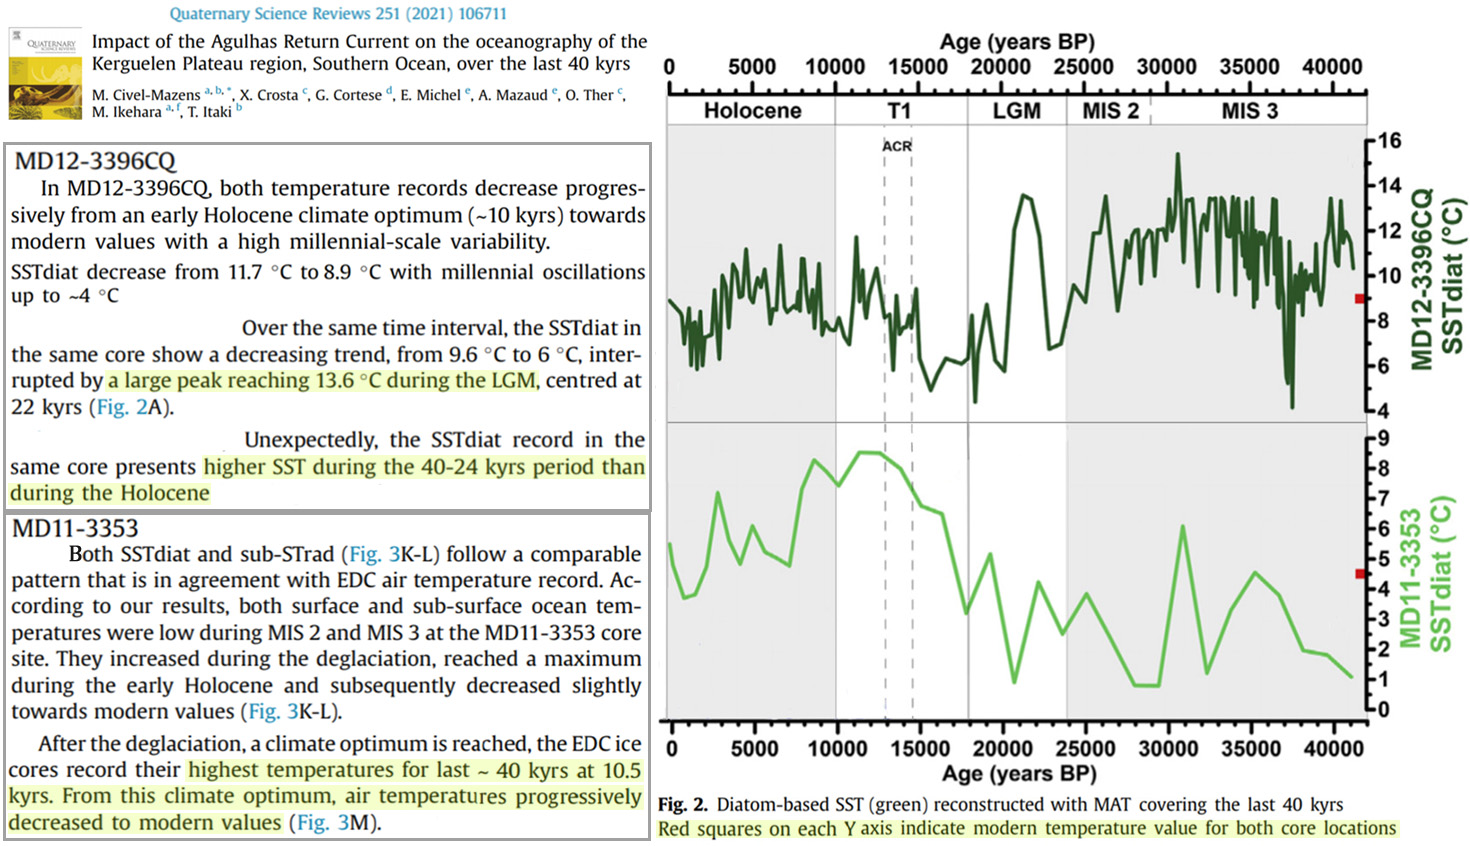
Civel-Mazens et al., 2021 22,000 years ago (180 ppm CO2) Southern Ocean surface temperatures peaked at 13.6°C, which is ~4-5°C warmer than today (~9°C)
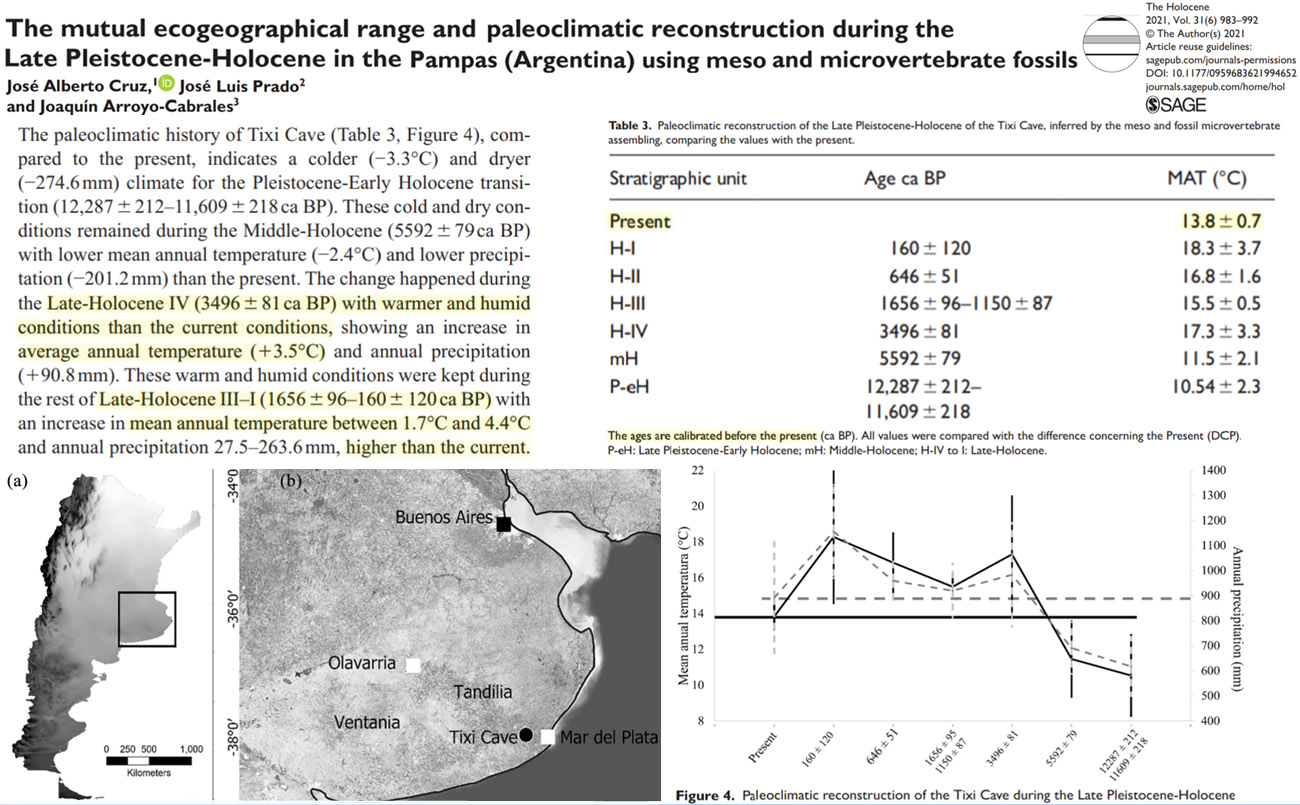
Cruz et al., 2021 Argentina 1.7°C to 4.4°C warmer than today during the 1800s
The paleoclimatic history of Tixi Cave (Table 3, Figure 4), compared to the present, indicates a colder (−3.3°C) and dryer (−274.6mm) climate for the Pleistocene-Early Holocene transition (12,287±212–11,609±218ca BP). These cold and dry conditions remained during the Middle-Holocene (5592±79ca BP) with lower mean annual temperature (−2.4°C) and lower precipitation (−201.2mm) than the present. The change happened during the Late-Holocene IV (3496±81ca BP) with warmer and humid conditions than the current conditions, showing an increase in average annual temperature (+3.5°C) and annual precipitation (+90.8mm). These warm and humid conditions were kept during the rest of Late-Holocene III–I (1656±96–160±120 ca BP) with an increase in mean annual temperature between 1.7°C and 4.4°C and annual precipitation 27.5–263.6mm, higher than the current.
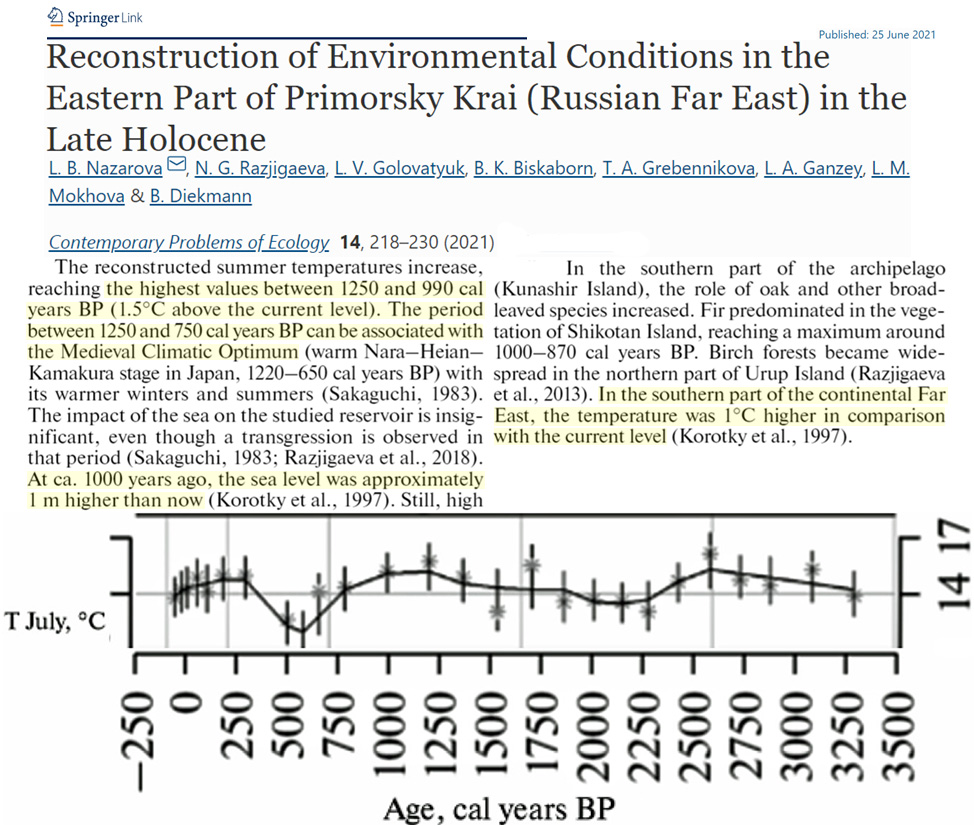
Nazarova et al., 2021 (full) East Russia 1.5°C warmer than present during Medieval Warm Period (750-1250 AD)
The Medieval Climate Optimum (Nara–Heian–Kamakura stage in Japan) reconstructed for the eastern part of Primorsky Krai in the period from 1250 to 750 cal years BP featured a humid climate with summer temperatures ca. 1.5°C higher than at present. The period between 750 and 250 cal years BP correlates with the Little Ice Age: summer temperatures had dropped to 1.5–2°C below the modern one.
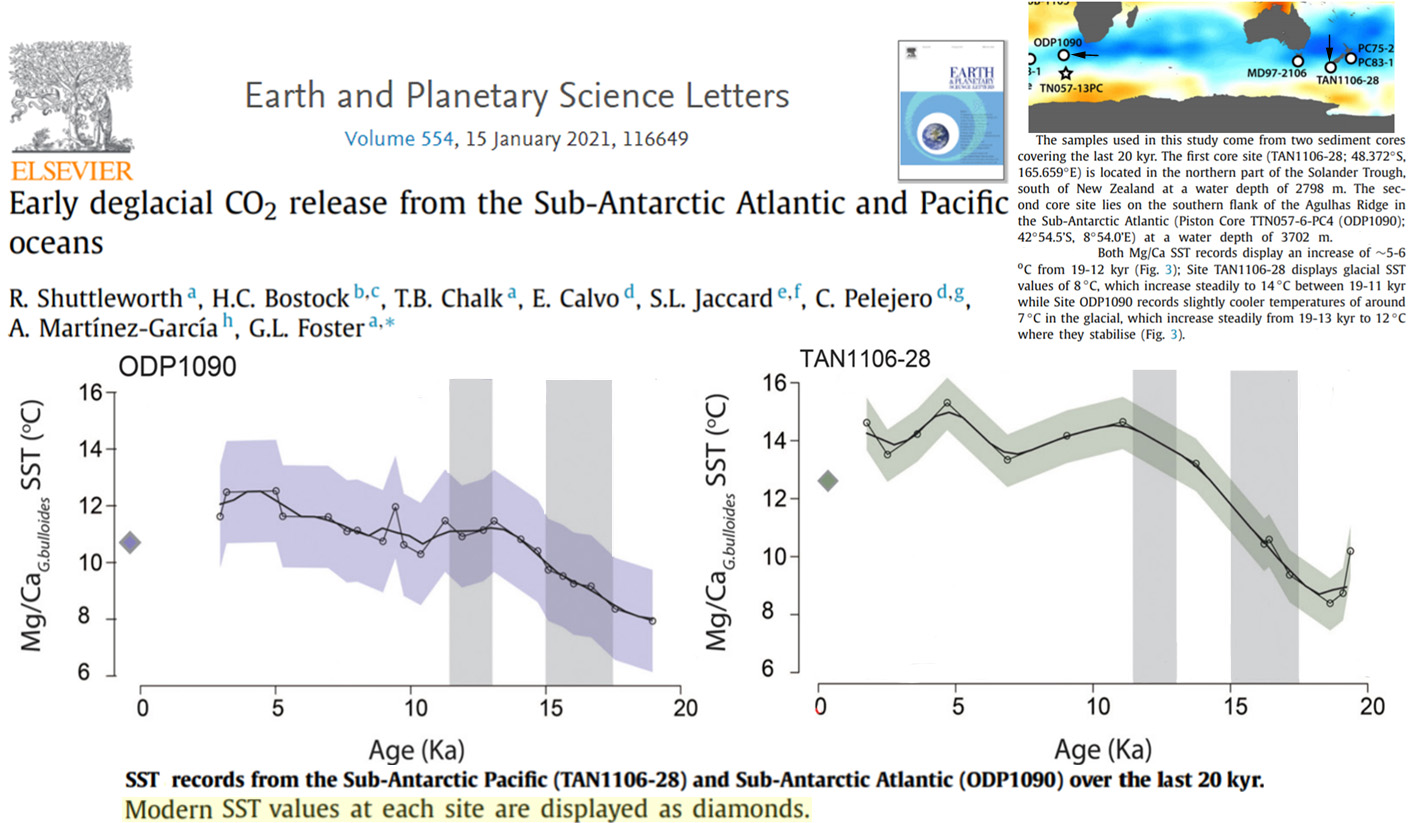
Shuttleworth et al., 2021 Sub-Antarctic Atlantic ~2°C warmer (see diamonds) ~4000 to ~5000 years ago
Allan et al., 2021 Greenland 5-7°C warmer (4-5°C vs. 10-12°C) than today from 7,500 to 5,500 years ago.
At present…summer SST ranging from 4.0-5.2 °C (Ribergaard 2014). … Subzone B2 (from ~10 to 5 ka BP) is marked by…high summer SST ranging from 6 to 12 °C with an average of ~9 °C … Subzone A3 (from ~2.7 to ~1.3 ka BP) is characterized by cold conditions with summer SST of ~5 °C … Optimal thermal conditions…the July surface air temperature (SAT) estimated from pollen grains was ~10 to ~12 °C from ~7.5 to ~5.5 ka BP (Frechette & de Vernal 2009).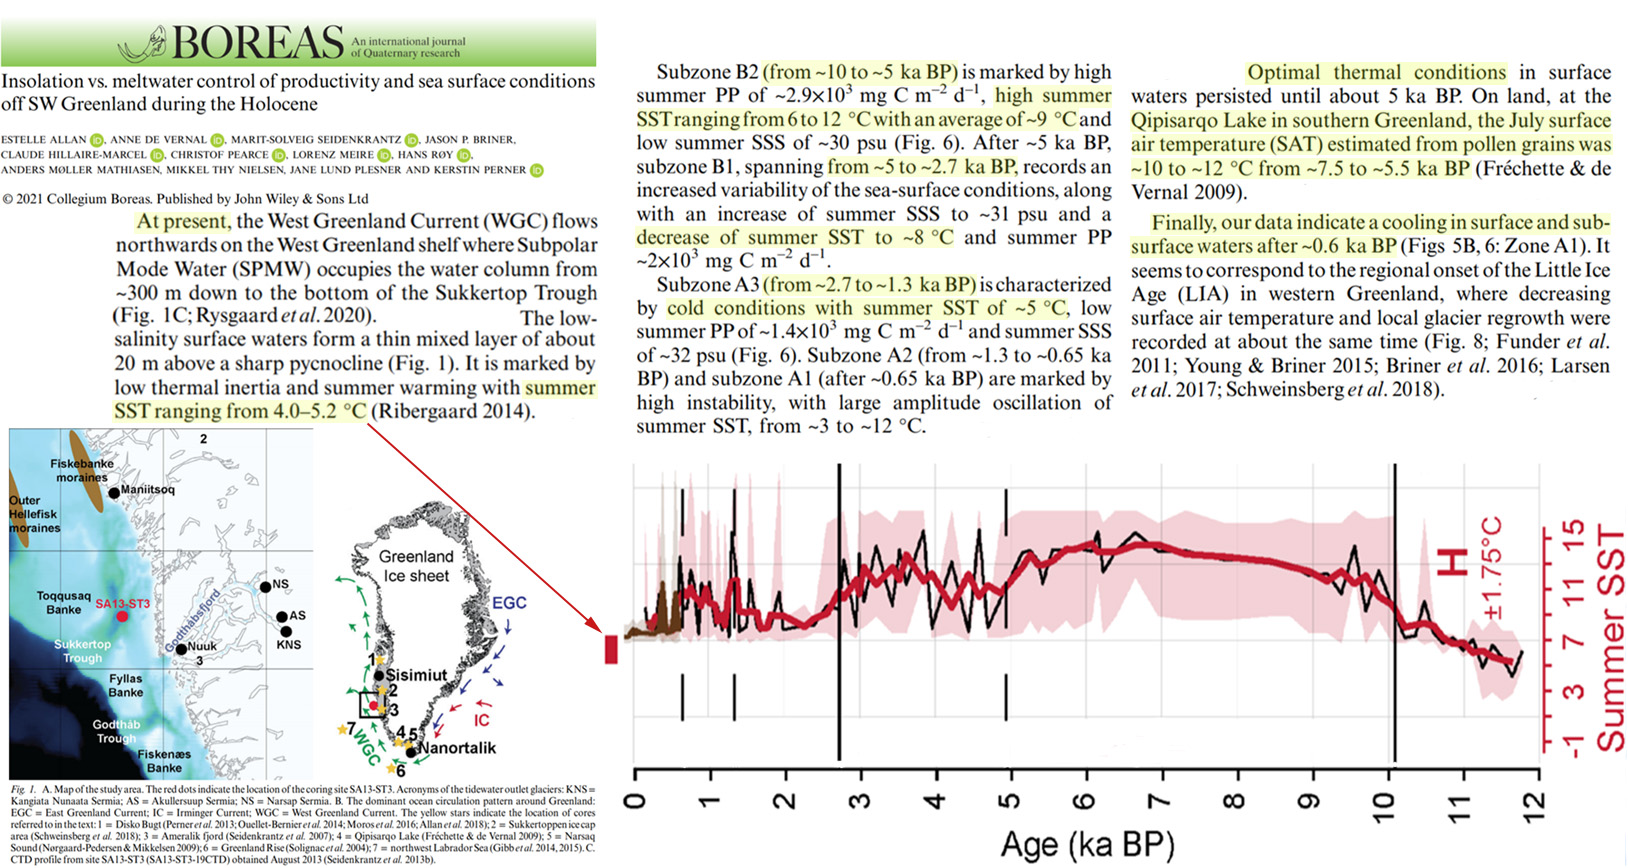
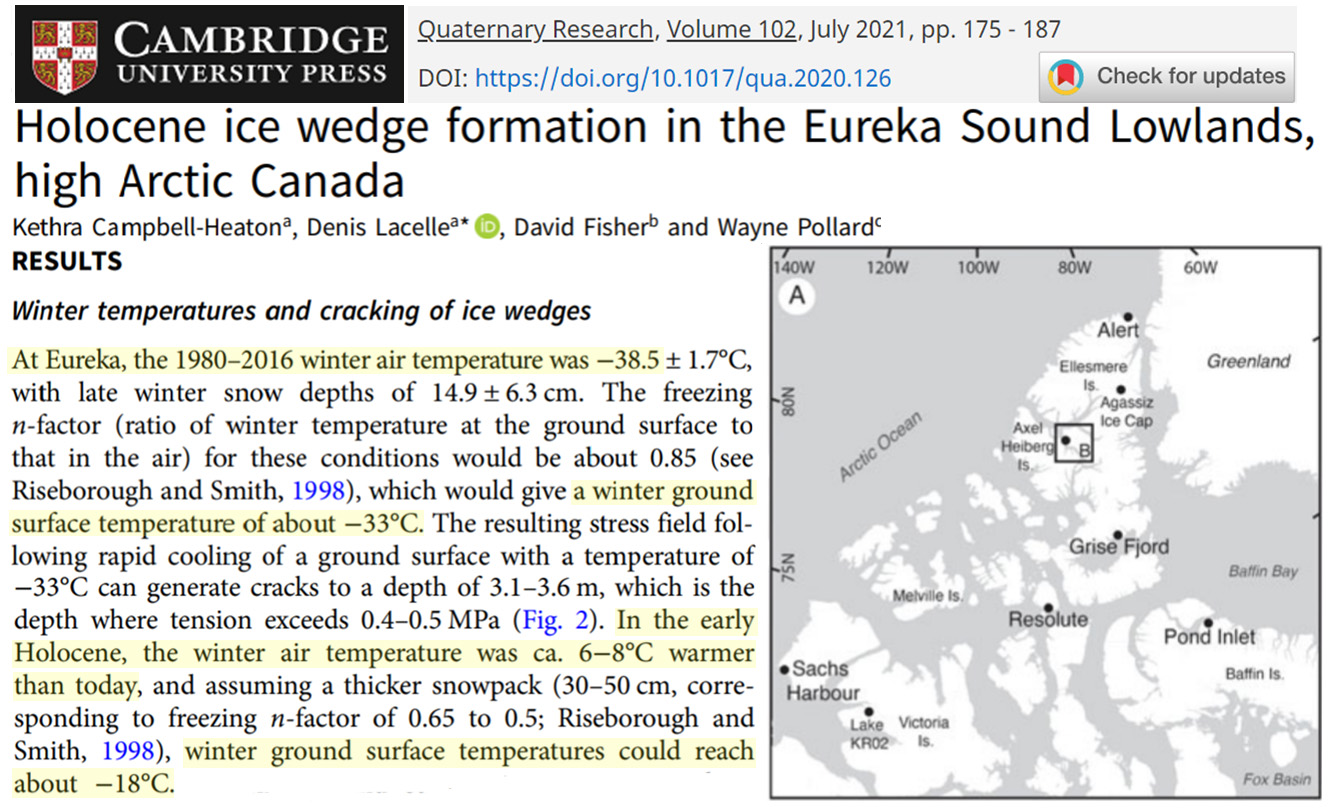
Campbell-Heaton et al., 2021 Arctic Canada 6-8°C warmer than today during Early Holocene
The 25-yr mean annual air temperature record shows a rapid early Holocene warming with temperatures being 6°C warmer than today at 10 ka followed by a gradual cooling to AD 1700 (Lecavalier et al., 2017). … In the early Holocene, the winter air temperature was ca. 6-8°C warmer than today
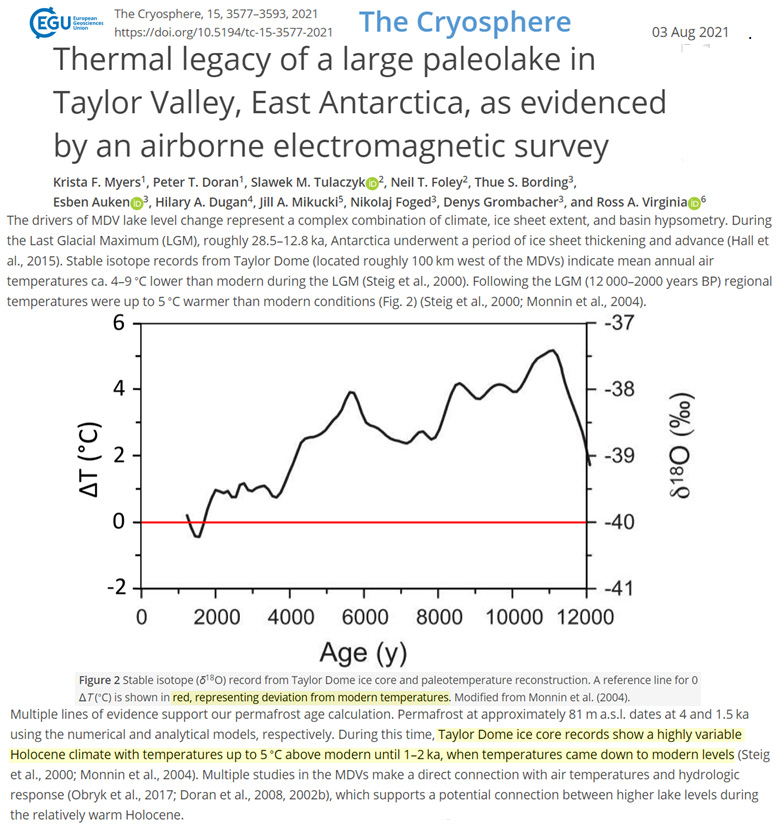
Myers et al., 2021 Antarctica “5 °C warmer than modern conditions” during the Early Holocene
The drivers of MDV lake level change represent a complex combination of climate, ice sheet extent, and basin hypsometry. During the Last Glacial Maximum (LGM), roughly 28.5–12.8 ka, Antarctica underwent a period of ice sheet thickening and advance (Hall et al., 2015). Stable isotope records from Taylor Dome (located roughly 100 km west of the MDVs) indicate mean annual air temperatures ca. 4–9 °C lower than modern during the LGM (Steig et al., 2000). Following the LGM (12 000–2000 years BP) regional temperatures were up to 5 °C warmer than modern conditions (Fig. 2) (Steig et al., 2000; Monnin et al., 2004). … Resistivity data suggest that active permafrost formation has been ongoing since the onset of lake drainage and that as recently as 1500–4000 years BP, lake levels were over 60 m higher than present. This coincides with a warmer-than-modern paleoclimate throughout the Holocene inferred by the nearby Taylor Dome ice core record. Our results indicate Mid to Late Holocene lake level high stands, which runs counter to previous research finding a colder and drier era with little hydrologic activity throughout the last 5000 years. … Taylor Dome ice core records show a highly variable Holocene climate with temperatures up to 5 ∘C above modern until 1–2 ka, when temperatures came down to modern levels (Steig et al., 2000; Monnin et al., 2004).
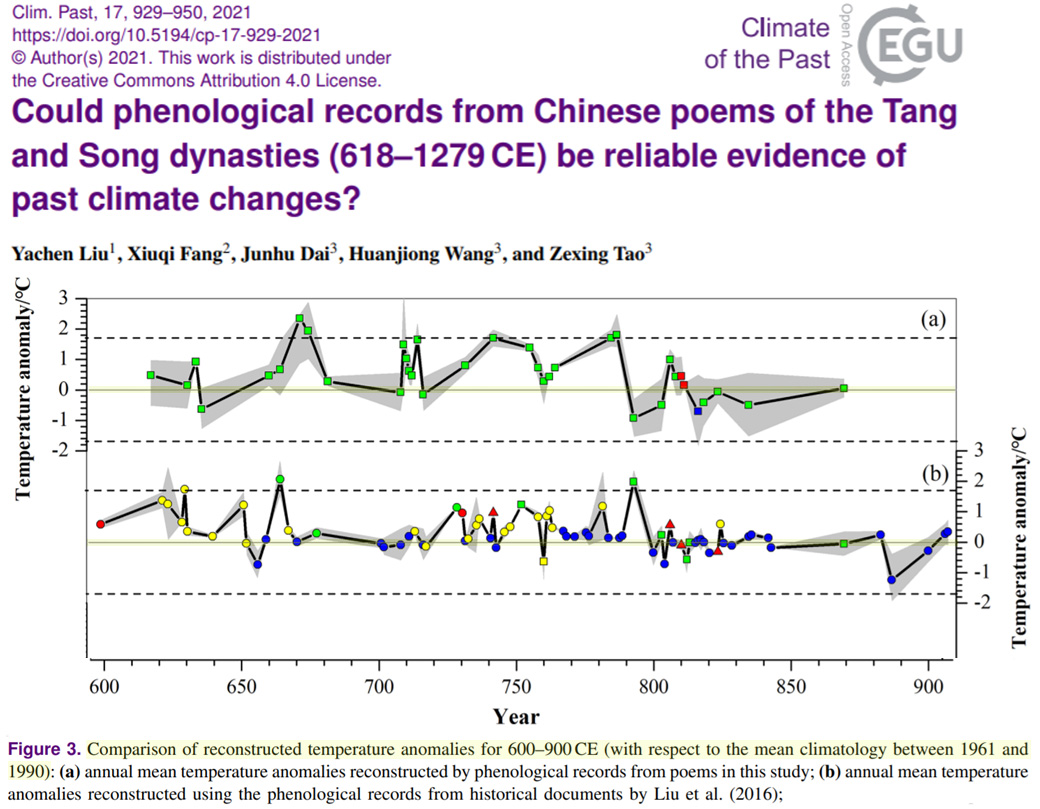
Liu et al., 2021 Central China 1-2°C warmer than 1961-1990 during 1st millennium per temperature reconstructions from poems
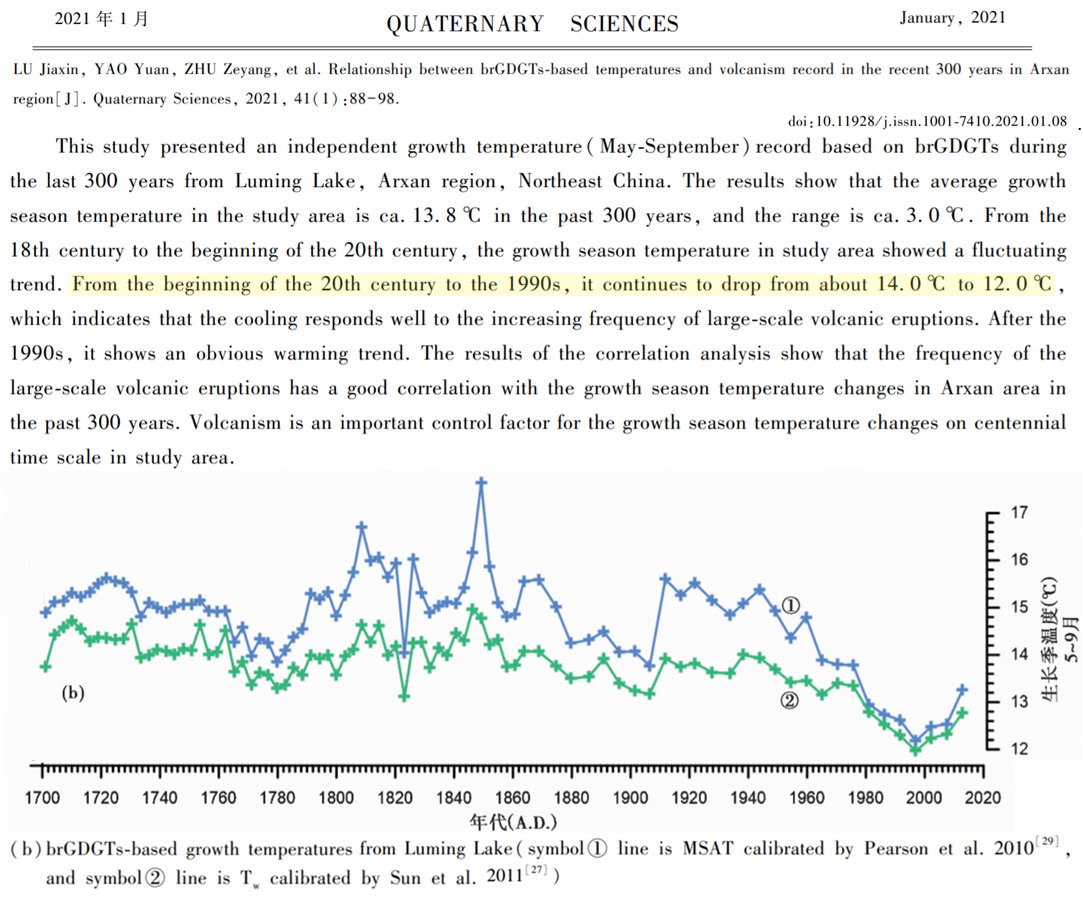
Lu et al., 2021 Northeast China 2°C warmer than today in the 1800s
This study presented an independent growth temperature (May-September) record based on brGDGTs during the last 300 years from Luming Lake, Arxan region, Northeast China. The results show that the average growth season temperature in the study area is ca. 13.8 ℃ in the past 300 years, and the range is ca. 3.0 ℃. From the 18th century to the beginning of the 20th century, the growth season temperature in study area showed a fluctuating trend. From the beginning of the 20th century to the 1990s, it continues to drop from about 14.0 ℃ to 12.0 ℃, which indicates that the cooling responds well to the increasing frequency of large-scale volcanic eruptions. After the 1990s, it shows an obvious warming trend. The results of the correlation analysis show that the frequency of the large-scale volcanic eruptions has a good correlation with the growth season temperature changes in Arxan area in the past 300 years. Volcanism is an important control factor for the growth season temperature changes on centennial time scale in study area.
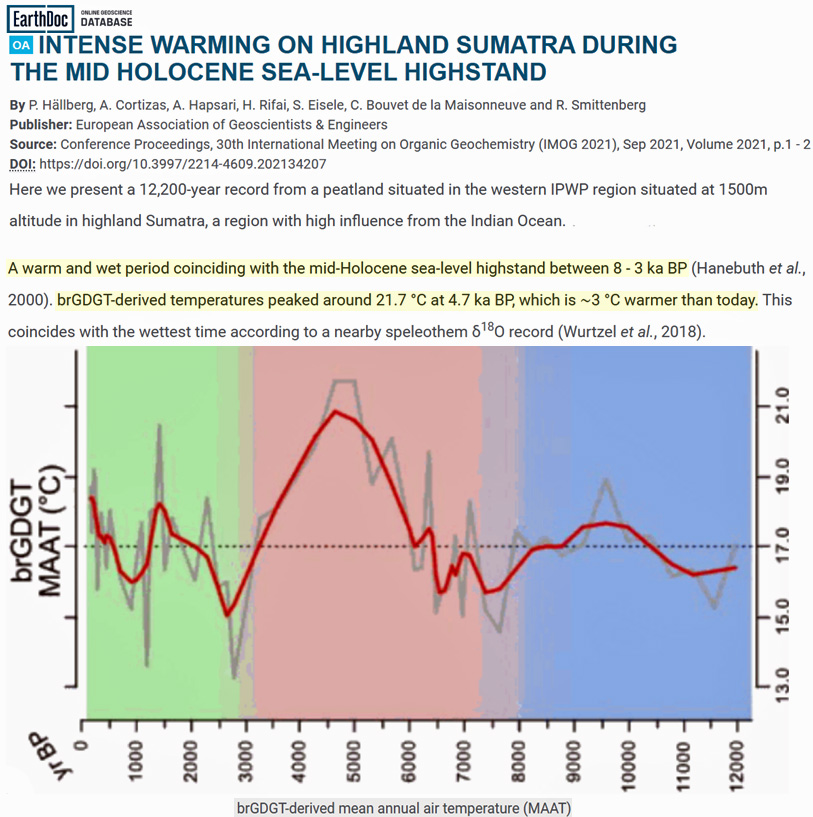
Hällberg et al., 2021 Indian Ocean “3°C warmer than today around 5 ka BP”
Here we present a 12,200-year record from a peatland situated in the western IPWP region situated at 1500m altitude in highland Sumatra, a region with high influence from the Indian Ocean. … Around 8 ka BP the climate started to warm considerably, ENSO was reduced and temperatures were as much as 3˚C warmer than today around 5 ka BP.
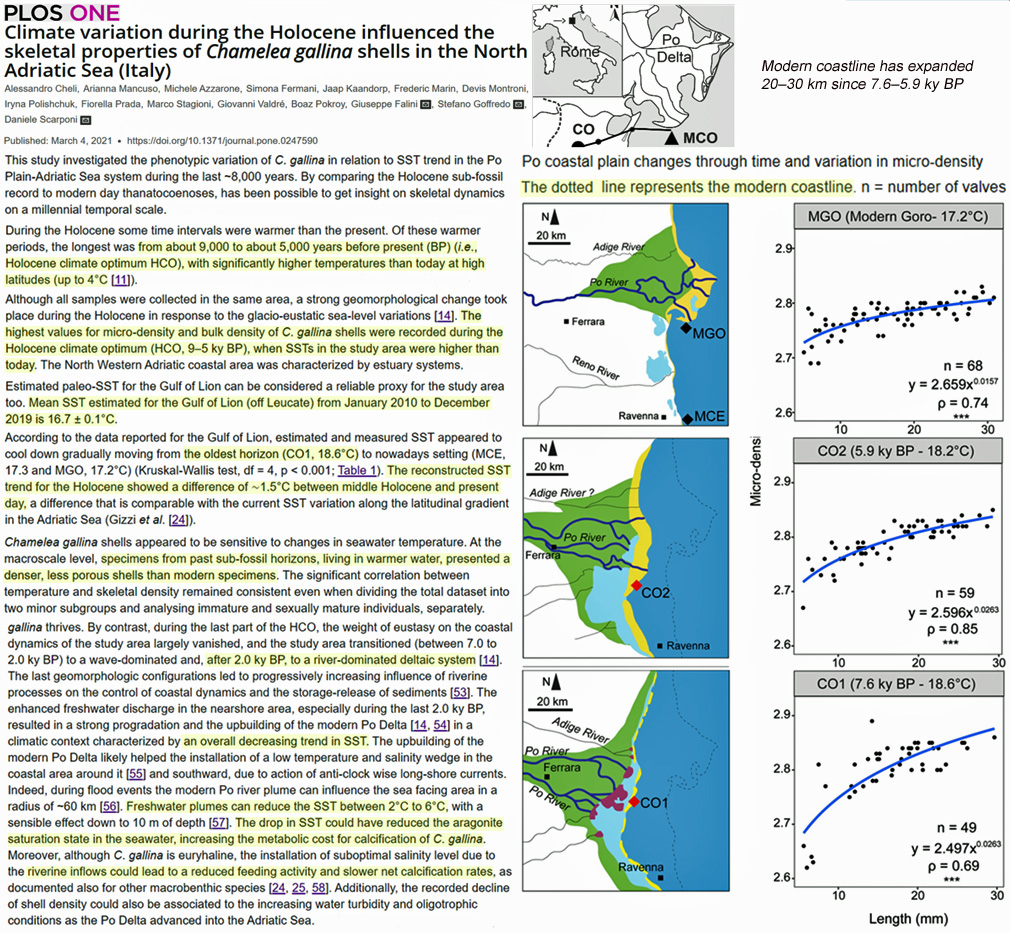
Cheli et tal., 2021 Adriatic Sea (Italy) 4°C warmer than today 9,000 to 5,000 years ago
Of these warmer periods, the longest was from about 9,000 to about 5,000 years before present (BP) (i.e., Holocene climate optimum HCO), with significantly higher temperatures than today at high latitudes (up to 4°C [11]).
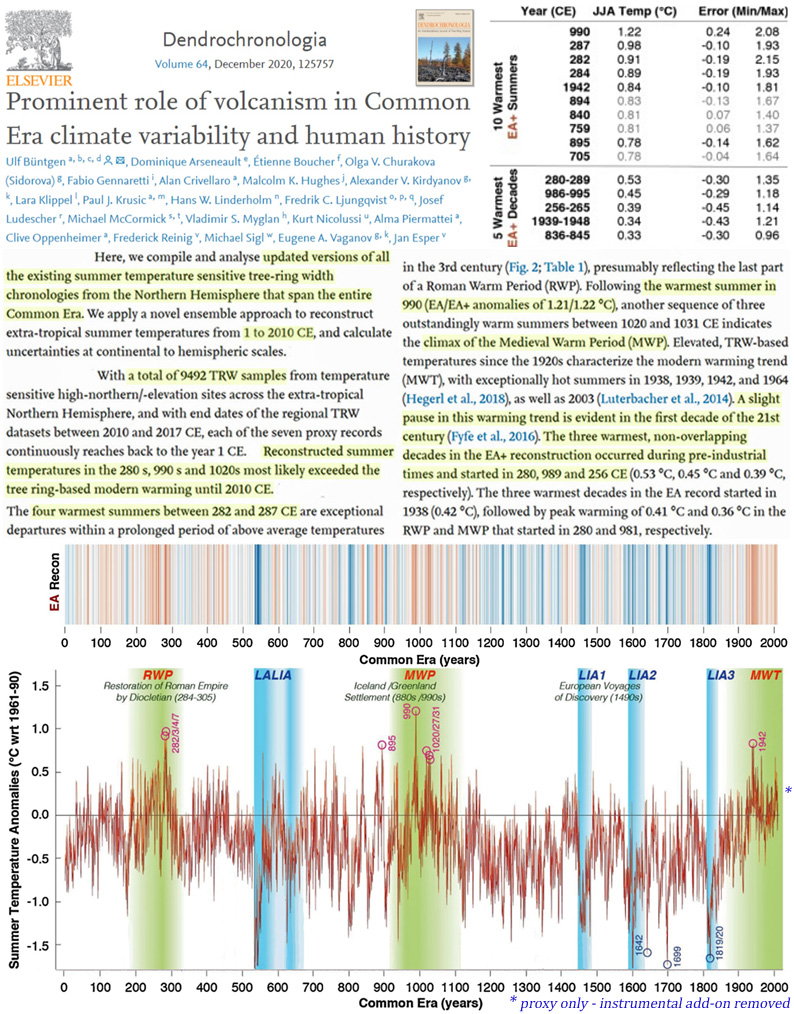
Buntgen et al., 2021 Northern Hemisphere, 1940s 4th warmest decade of 1-2010 CE
Following the warmest summer in 990 (EA/EA+ anomalies of 1.21/1.22 °C), another sequence of three outstandingly warm summers between 1020 and 1031 CE indicates the climax of the Medieval Warm Period (MWP). Elevated, TRW-based temperatures since the 1920s characterize the modern warming trend (MWT), with exceptionally hot summers in 1938, 1939, 1942, and 1964 (Hegerl et al., 2018), as well as 2003 (Luterbacher et al., 2014). A slight pause in this warming trend is evident in the first decade of the 21st century (Fyfe et al., 2016). The three warmest, non-overlapping decades in the EA+ reconstruction occurred during pre-industrial times and started in 280, 989 and 256 CE (0.53 °C, 0.45 °C and 0.39 °C, respectively).
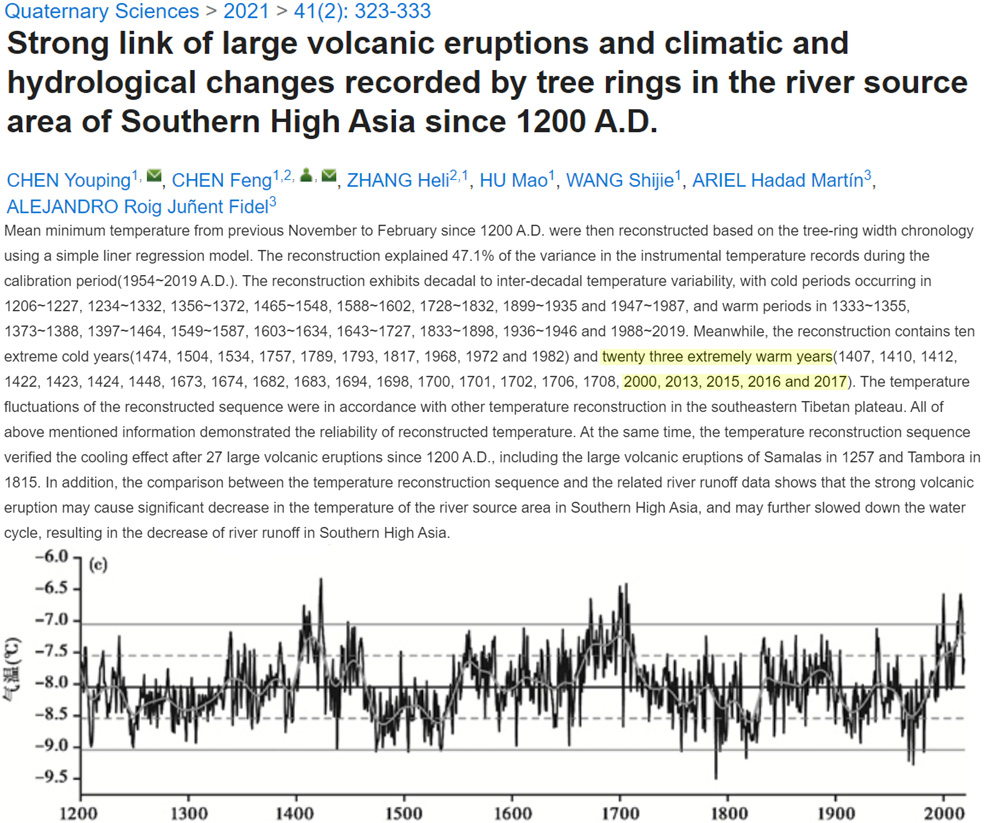
Chen et al., 2021 Southern High Asia as warm as 2000s during 1400s, 1690s AD
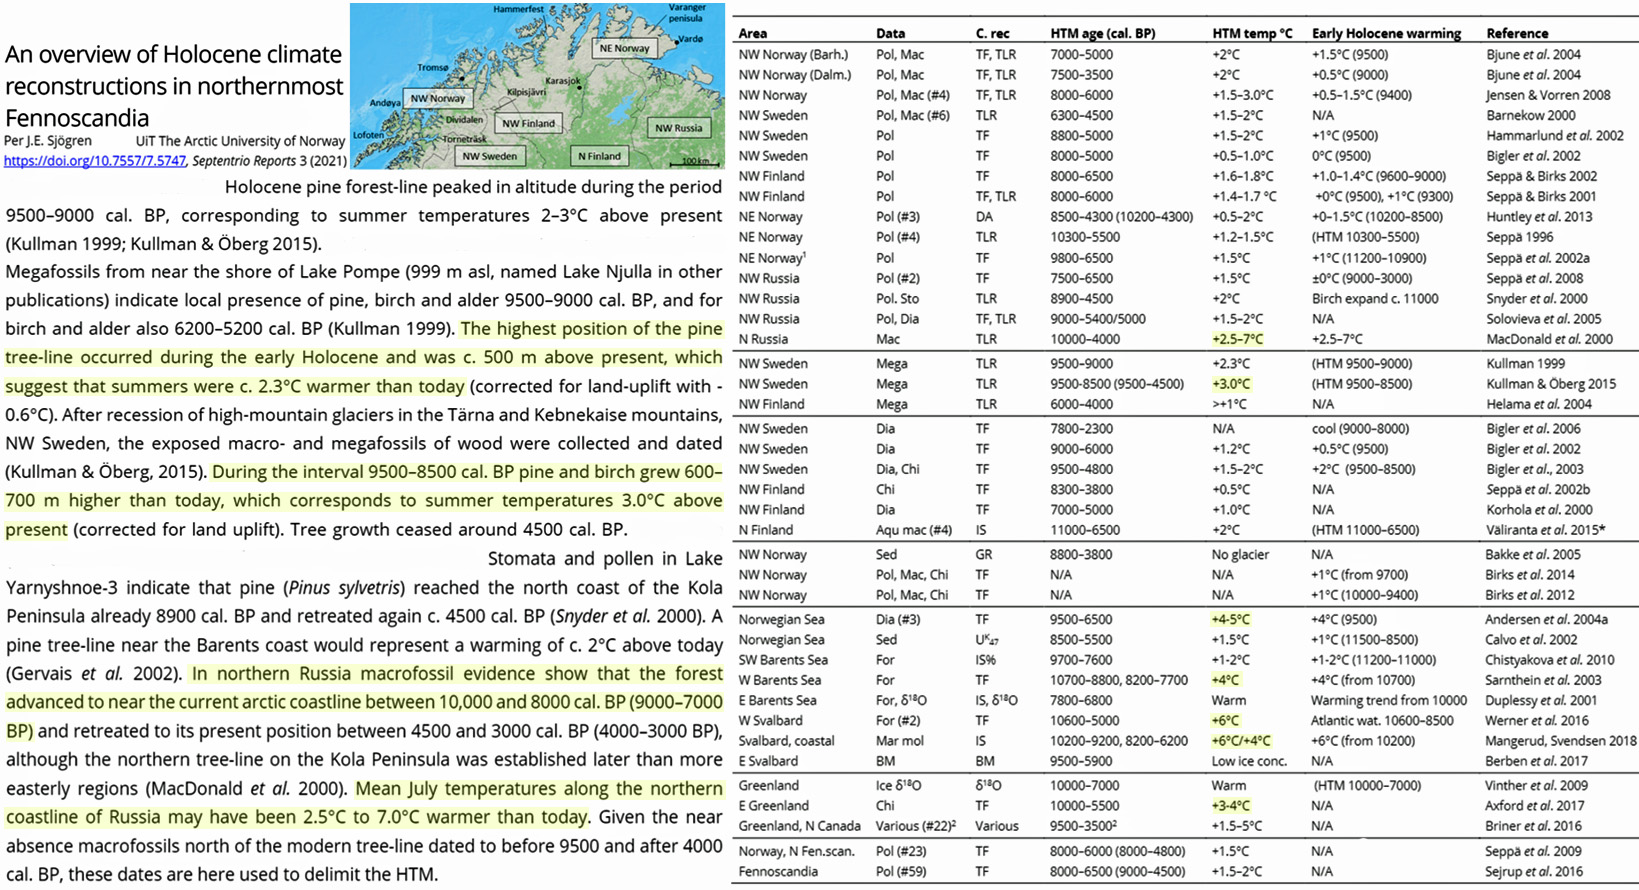
Sjögren, 2021 Sub-Arctic Norway, Sweden, Finland, Russia 2.5°C to 7.0°C warmer than today during Early Holocene
The highest position of the pine tree-line occurred during the early Holocene and was c. 500 m above present, which suggest summers were c. 2.3°C warmer than today … During the interval 9500-8500 cal. BP pine and birch grew 600-700 m higher than today, which corresponds to summer temperatures 3.0°C above present … In northern Russia macrofossil evidence show that the forest advanced to near the current arctic coastline between 10,000 and 8000 cal. BP (9000-7000 BP) … Mean July temperatures along the northern coastline of Russia may have been 2.5°C to 7.0°C warmer than today.
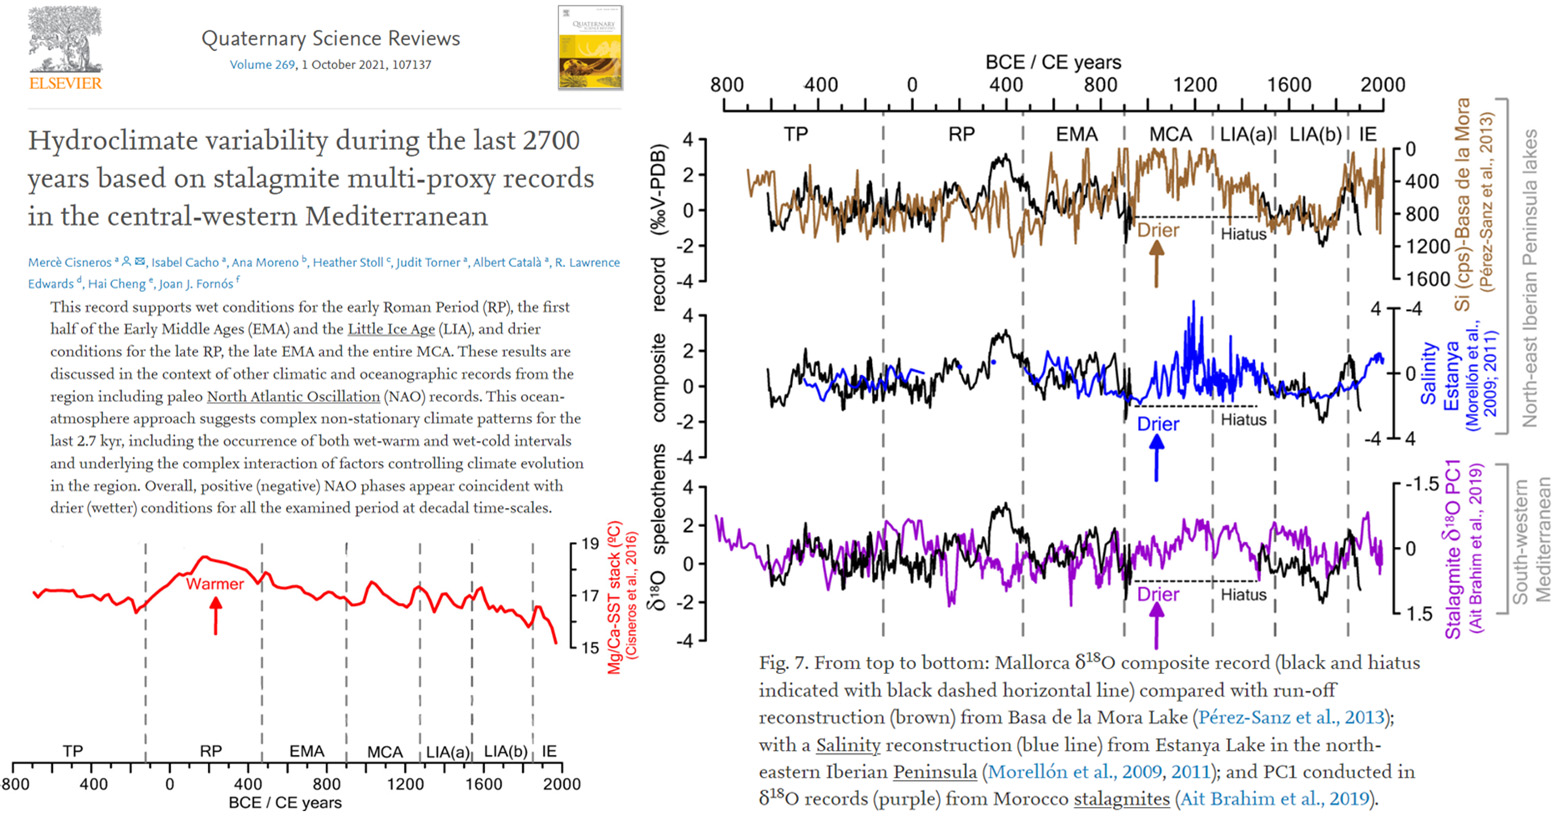
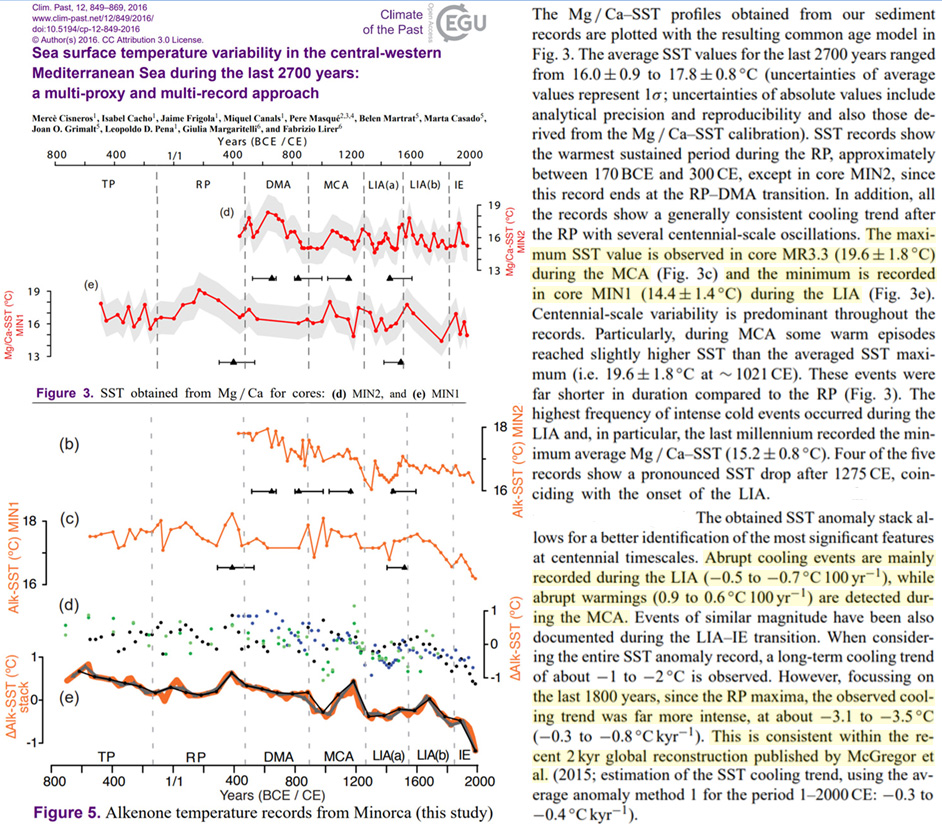
Cisneros et al., 2021 (referencing Cisneros et al., 2016) Mediterranean 2-3°C warmer ~1,500 years ago
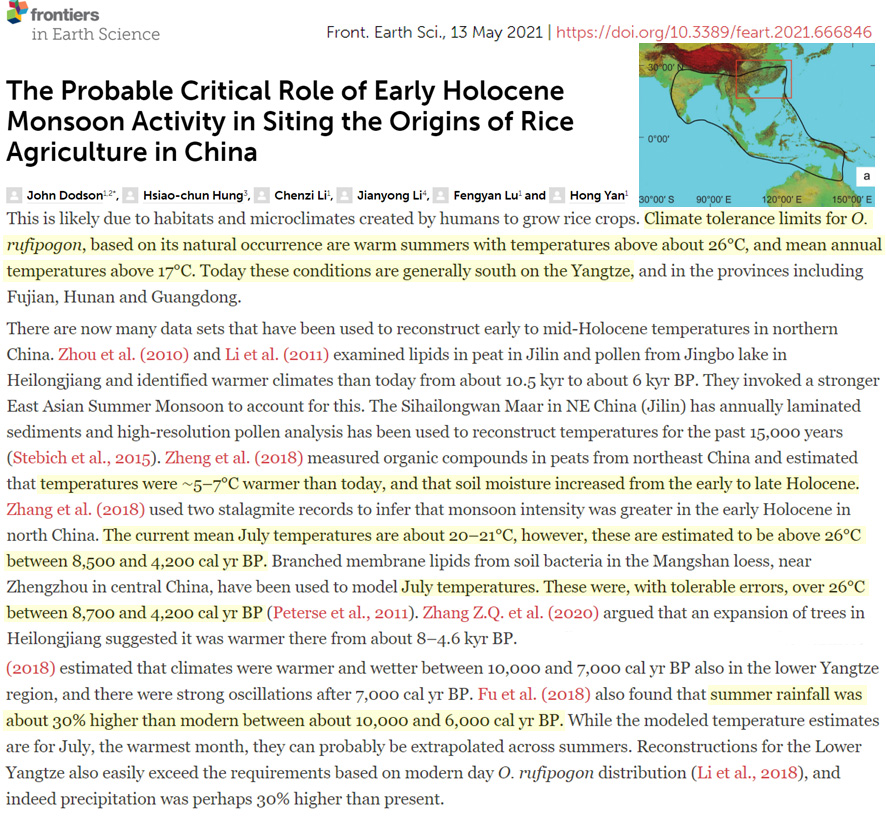
Dodson et al., 2021 Northeast China “5-7°C warmer than today” between 8,700 and 4,200 years ago
Zheng et al. (2018) measured organic compounds in peats from northeast China and estimated that temperatures were ∼5–7°C warmer than today, and that soil moisture increased from the early to late Holocene. Zhang et al. (2018) used two stalagmite records to infer that monsoon intensity was greater in the early Holocene in north China. The current mean July temperatures are about 20–21°C, however, these are estimated to be above 26°C between 8,500 and 4,200 cal yr BP. Branched membrane lipids from soil bacteria in the Mangshan loess, near Zhengzhou in central China, have been used to model July temperatures. These were, with tolerable errors, over 26°C between 8,700 and 4,200 cal yr BP (Peterse et al., 2011). Zhang Z.Q. et al. (2020) argued that an expansion of trees in Heilongjiang suggested it was warmer there from about 8–4.6 kyr BP.
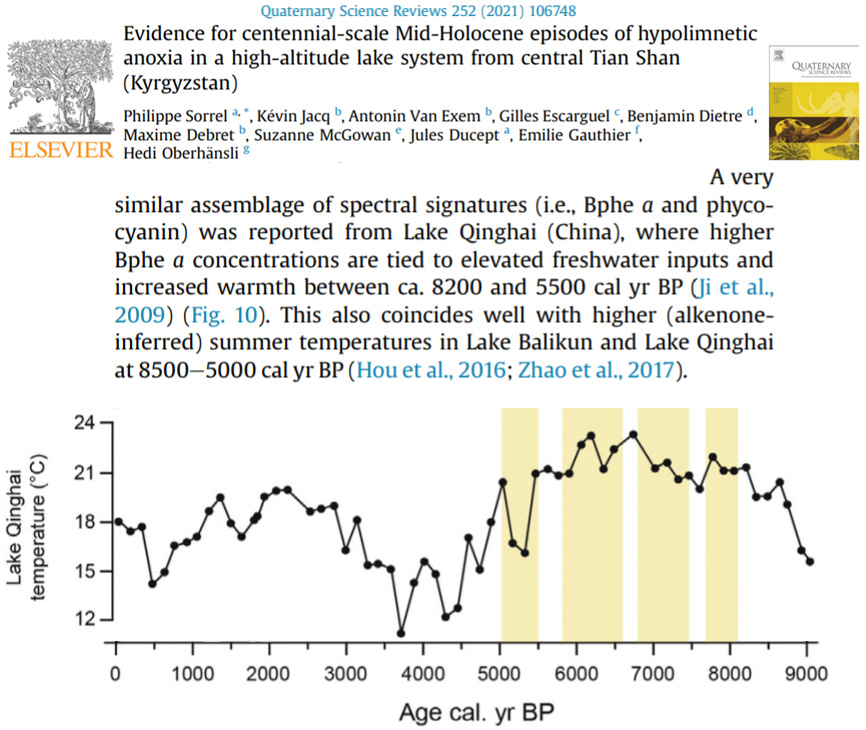
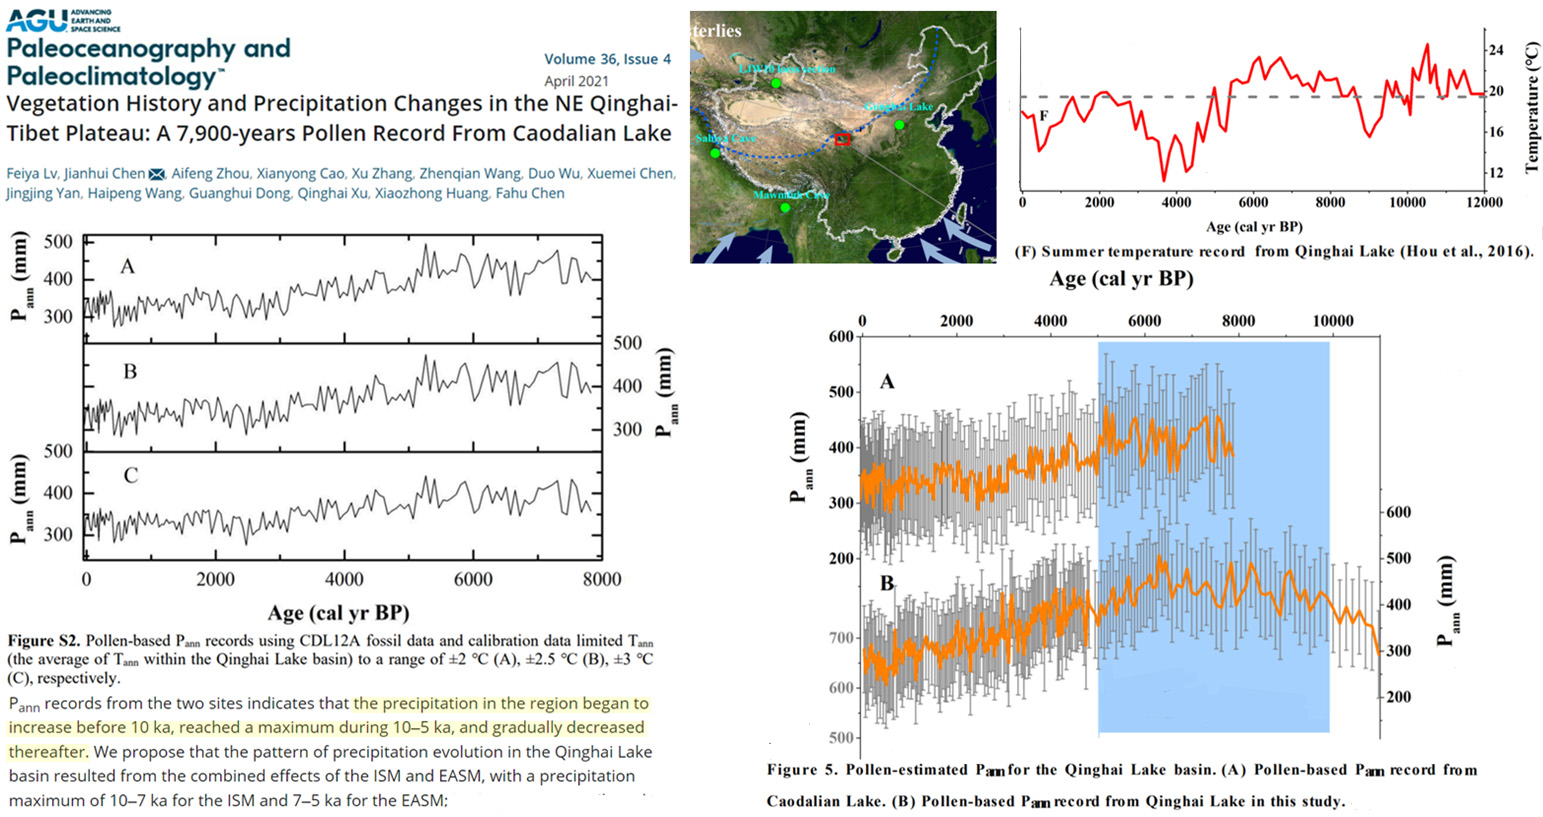
Sorrell et al., 2021 Lake Qinghai 2-4°C warmer 6000-8000 years ago
Helmans et al., 2021 Northern Europe July temps “several degrees warmer” when CO2 220-260 ppm
Few fossil-based environmental and climate records in northern Europe are dated to Marine Isotope Stage (MIS) 5a around 80 kaBP … [T]he climate optima of the predominant intermediate- to warm-water chironomid taxa suggest July temperatures exceeding present-day values by up to several degrees, in line with climate inferences from a variety of aquatic and wetland plant indicator species. … Summer temperatures exceeding present day values are inferred for the Early and Middle Holocene (Shala et al. 2017) and all three warm MIS 5 substages (Valiranta et al. 2009; Engels et al. 2010; Plikk et al. 2018; Salonen et al. 2018; this study), whereas warmer-than-today winters are additionally reconstructed for MIS 5e (Salonen et al. 2018).
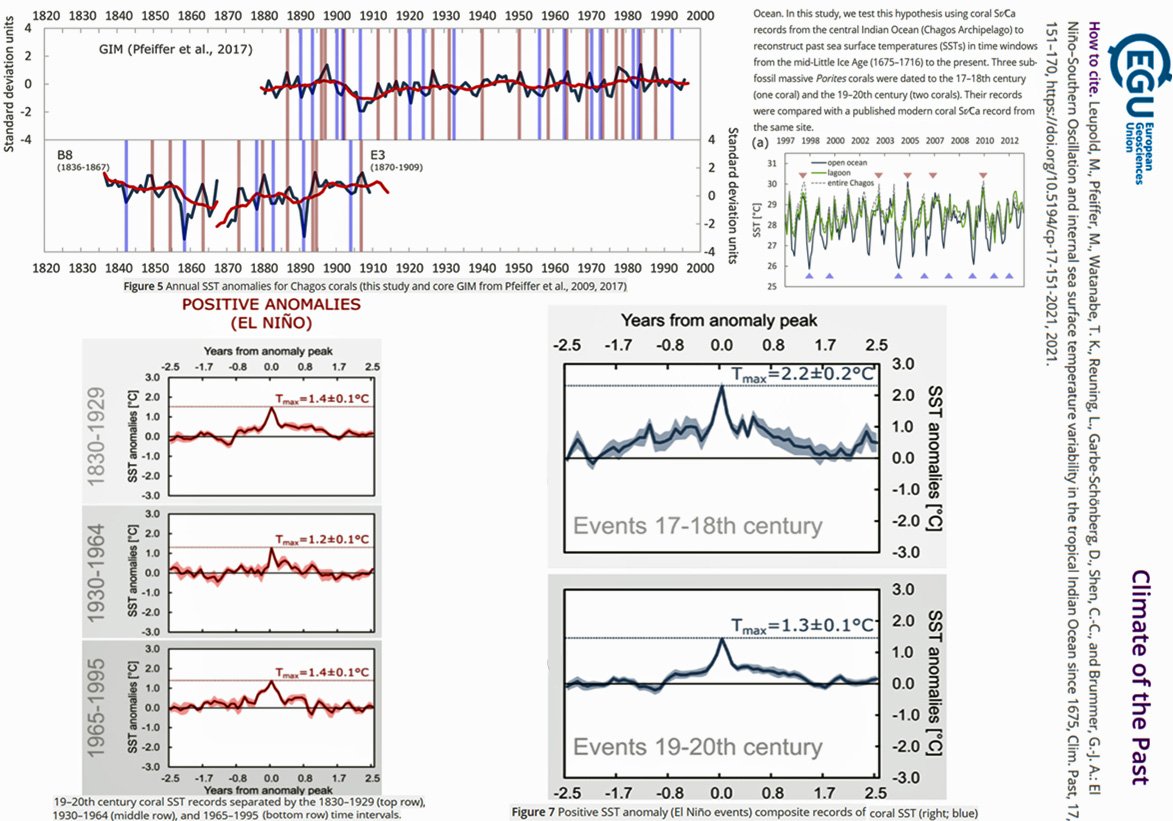
Leupold et al., 2021 Central Indian Ocean Tmax same (1.4°C) in 1830-1929 as from 1965-1995. Peak anomalies in the 1600s and 1700s ~0.9°C warmer (2.2°C) than peaks in 1800s, 1900s (1.3°C)
Sicre et al., 2021 Early Holocene N. Iceland SSTs 3°C warmer than today
Two sediment cores retrieved off North Iceland (western Nordic Seas) and on the eastern flank of Reykjanes Ridge (Iceland Basin) were analyzed to generate high-resolution alkenone-derived sea surface temperature (SST) records to investigate North Atlantic Ocean circulation changes during the Holocene. Early Holocene SSTs off North Iceland were unstable (10 ± 1 °C) and 3 °C warmer than today reflecting active northward heat transport of the Atlantic Meridional Overturning Circulation (AMOC) interrupted by intermittent Polar Waters incursions onto the North Icelandic shelf. The Holocene thermal optimum occurred synchronously east of Reykjanes Ridge, with a mean value of 11.5 °C (±0.5 °C) similar to today, consistent with a sustained influence of AMOC. Both records indicate that the circulation across the North Atlantic intensified between 8000 and 7000 yr BP.
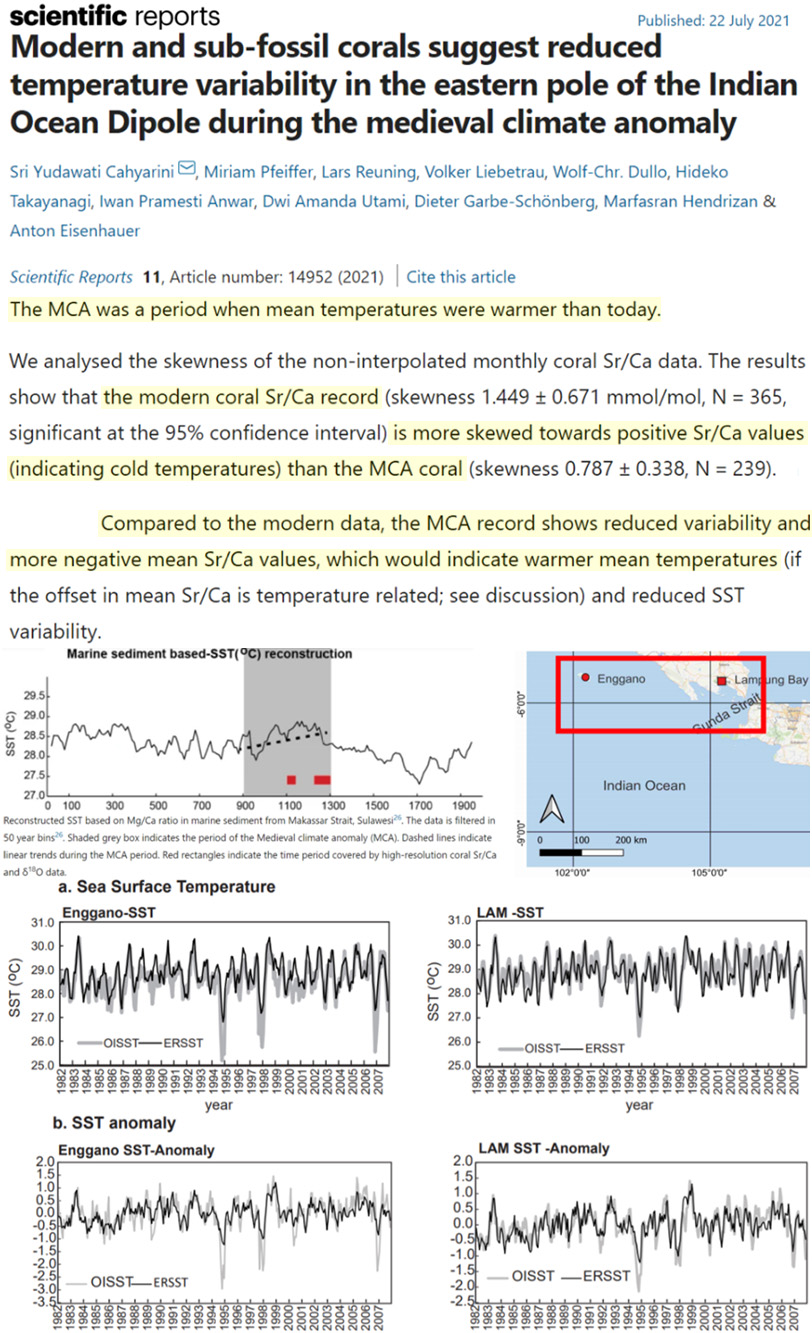
Yudawati-Cahyarini et al., 2021 Indian Ocean “warmer than today” during Medieval Warm Period
The MCA [Medieval Climate Anomaly] was a period when mean temperatures were warmer than today. … Compared to the modern data, the MCA record shows reduced variability an more negative mean Sr/Ca values, which would indicate warmer mean temperatures
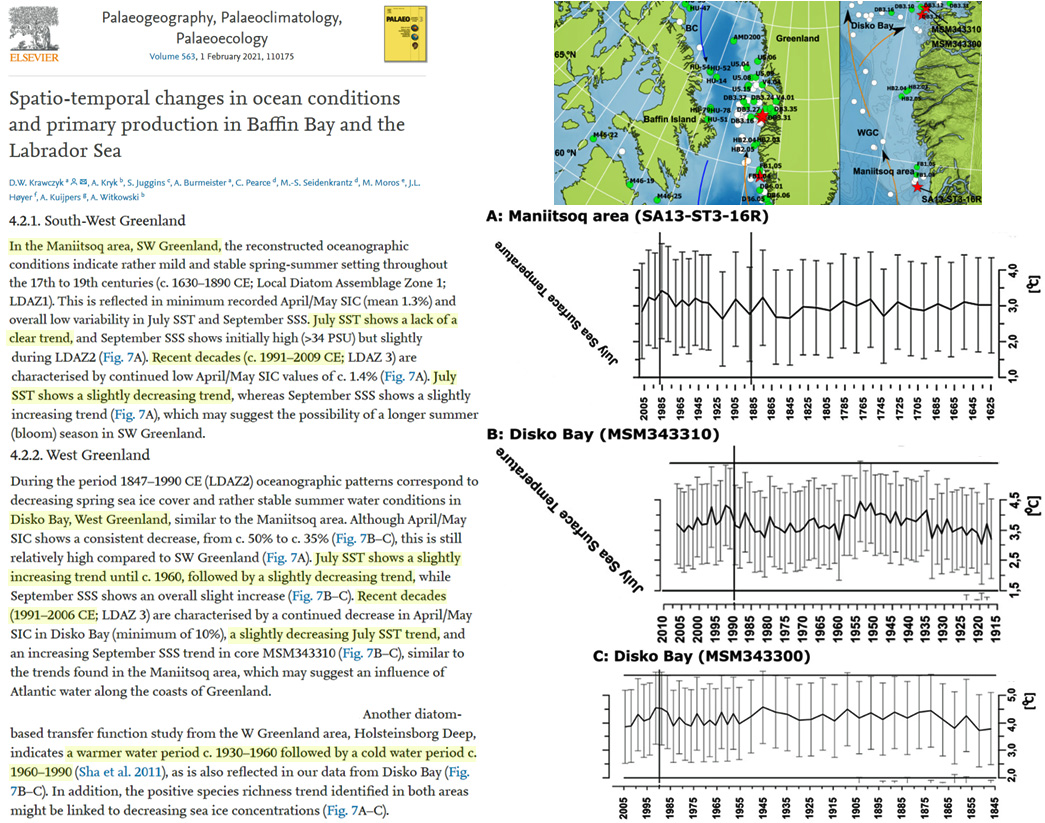
Krawczyk et al., 2021 SW Greenland “slightly decreasing temperatures 1991-2006…no net warming since 1625, 1915, 1845 (Maniitsoq, Disko Bay)
In the Maniitsoq area, SW Greenland…July SST shows lack of a clear trend … Recent decades (c. 1991–2009 CE; LDAZ 3) are characterised by continued low April/May SIC values of c. 1.4% (Fig. 7A). July SST shows a slightly decreasing trend … Disko Bay, West Greenland…Recent decades (c. 1991-2006; LDAZ 3)…a slightly decreasing July SST trend
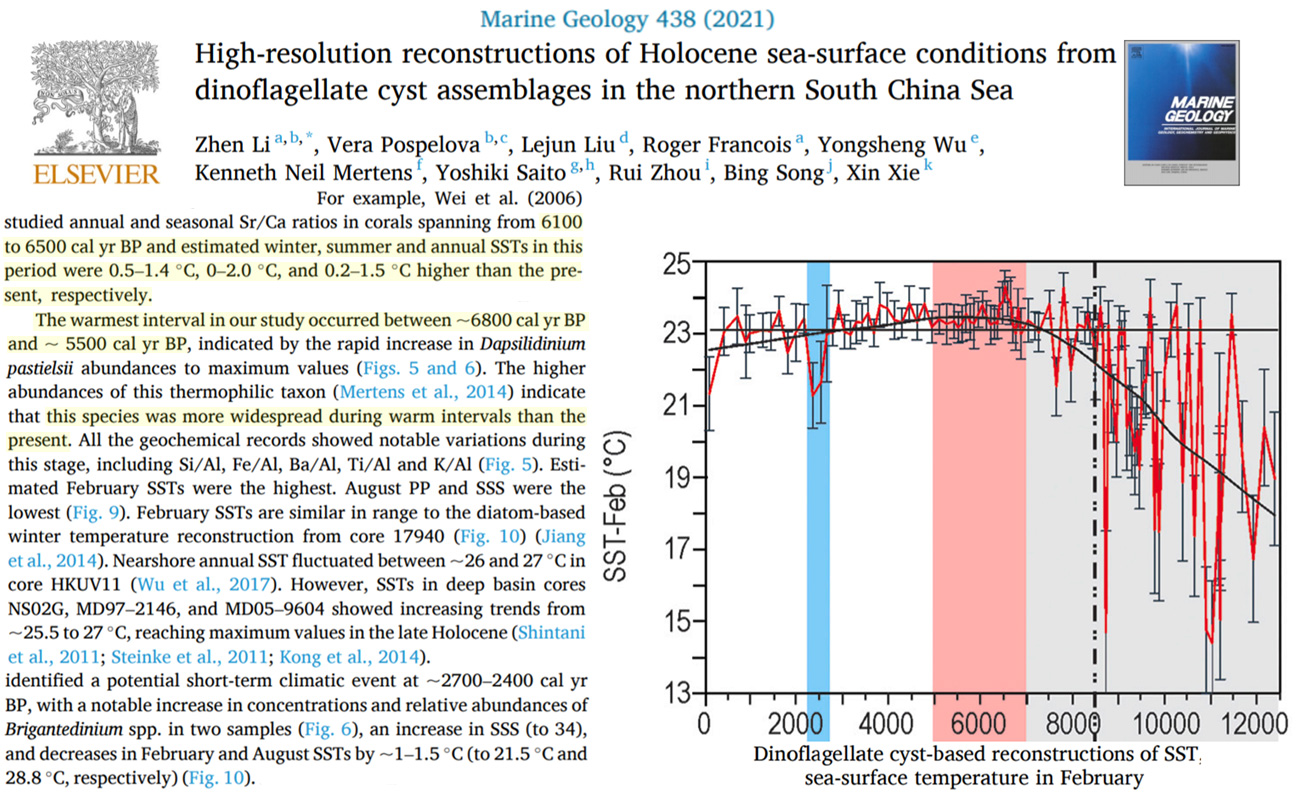
Li et al., 2021 South China Sea SSTs 0.5 to 2.0°C “higher than the present” 6100 to 6500 years ago
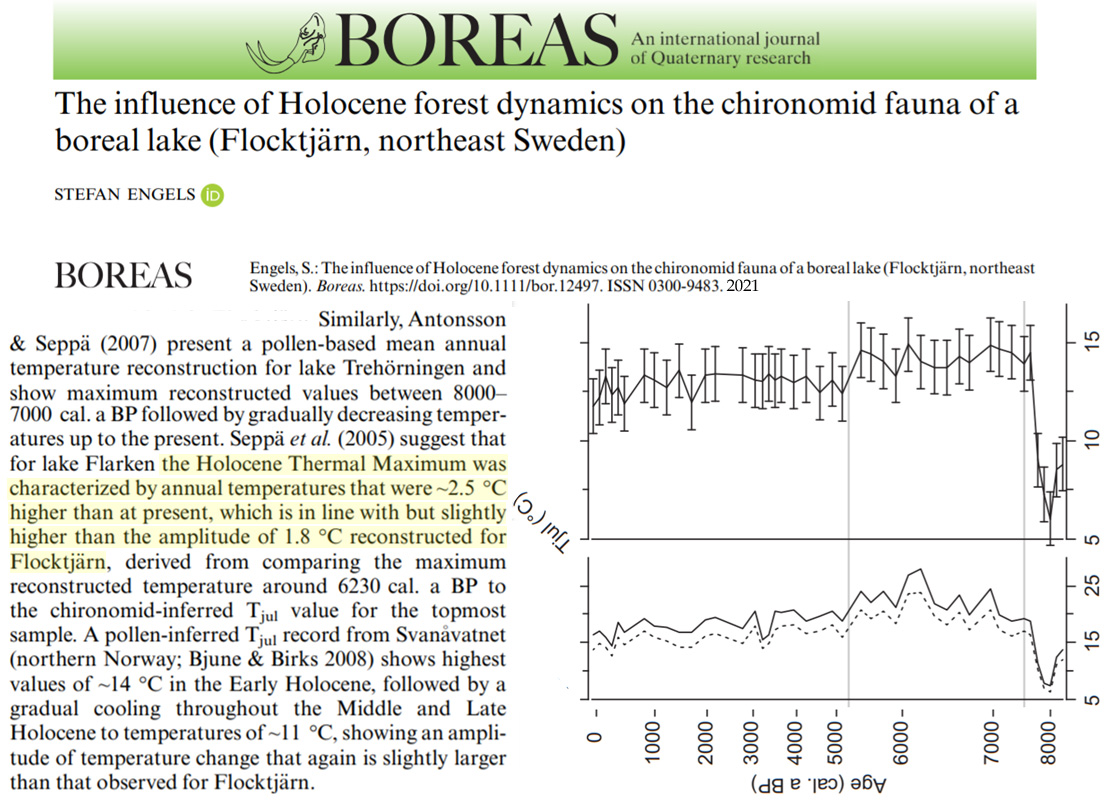
Engels, 2021 NE Sweden 2.5°C warmer than at present during Holocene Thermal Maximum
Kullman, 2021 N. Sweden early Holocene summer temperature “at least 3 °C warmer than the early 21st century”
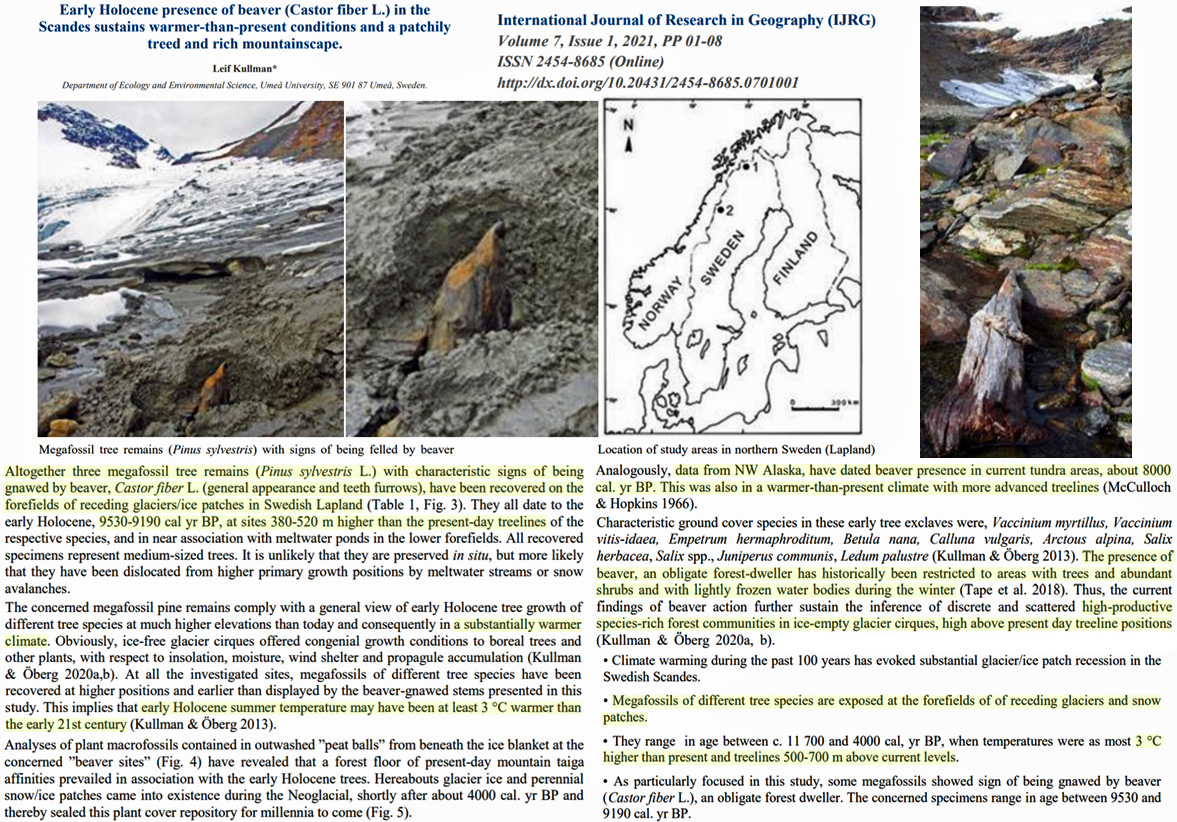
[C]urrent sites of glaciers and ice patches, 400-700 elevational meters atop of current treelines, harboured early Holocene stands of many of today´s boreal tree- and ground-cover species prevailing in northern Scandinvia. … Altogether three megafossil tree remains (Pinus sylvestris L.) with characteristic signs of being gnawed by beaver, Castor fiber L. (general appearance and teeth furrows), have been recovered on the forefields of receding glaciers/ice patches in Swedish Lapland (Table 1, Fig. 3). They all date to the early Holocene, 9530-9190 cal yr BP, at sites 380-520 m higher than the present-day treelines of the respective species, and in near association with meltwater ponds in the lower forefields. … The concerned megafossil pine remains comply with a general view of early Holocene tree growth of different tree species at much higher elevations than today and consequently in a substantially warmer climate. … At all the investigated sites, megafossils of different tree species have been recovered at higher positions and earlier than displayed by the beaver-gnawed stems presented in this study. This implies that early Holocene summer temperature may have been at least 3 °C warmer than the early 21st century (Kullman & Öberg 2013). Megafossils of different tree species are exposed at the forefields of of receding glaciers and snow patches. • They range in age between c. 11 700 and 4000 cal, yr BP, when temperatures were as most 3 °C higher than present and treelines 500-700 m above current levels.
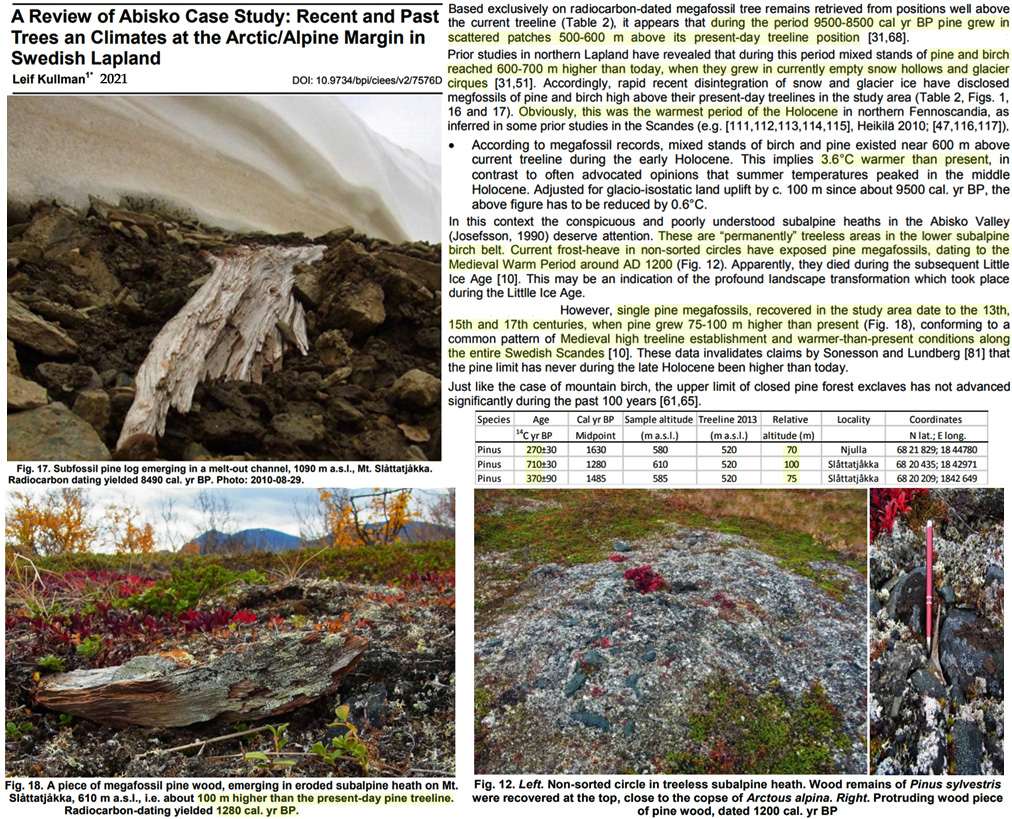
Kullman, 2021 Swedish Lapland 3.6°C warmer than present 9500-8500 years ago
In this context the conspicuous and poorly understood subalpine heaths in the Abisko Valley (Josefsson, 1990) deserve attention. These are “permanently” treeless areas in the lower subalpine birch belt. Current frost-heave in non-sorted circles have exposed pine megafossils, dating to the Medieval Warm Period around AD 1200 (Fig. 12). Apparently, they died during the subsequent Little Ice Age [10]. This may be an indication of the profound landscape transformation which took place during the Little Ice Age. … Based exclusively on radiocarbon-dated megafossil tree remains retrieved from positions well above the current treeline (Table 2), it appears that during the period 9500-8500 cal yr BP pine grew in scattered patches 500-600 m above its present-day treeline position [31,68]. … Prior studies in northern Lapland have revealed that during this period mixed stands of pine and birch reached 600-700 m higher than today, when they grew in currently empty snow hollows and glacier cirques [31,51]. … According to megafossil records, mixed stands of birch and pine existed near 600 m above current treeline during the early Holocene. This implies 3.6°C warmer than present, in contrast to often advocated opinions that summer temperatures peaked in the middle Holocene.
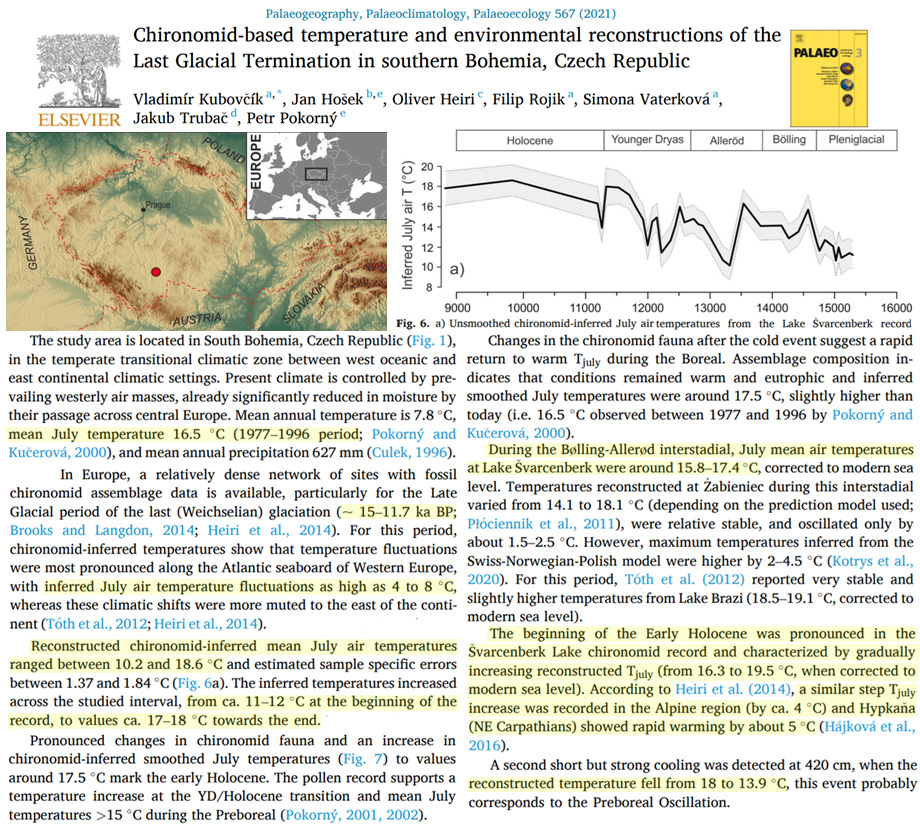
Kubovcik et al., 2021 Czech Republic July temps 16.5°C today, up to 19.5°C (3°C warmer) during Early Holocene
[Modern] mean July temperature is 16.5°C (1977-1996 period) … During the Bolling-Allerod interstadial [15.7 to 12.7 ka], July mean air temperatures at Lak Svarcenberk were around 15.8 – 17.4°C … The beginning of the Early Holocene was pronounced in the Svarcenberk Lake chironomid record and characterized by a gradually increasing reconstructed July temperature (from 16.3 to 19.5°C)
Axford et al., 2021 Greenland 3-5°C warmer than 1950 during Early Holocene
Highlighting and accounting for some key issues with proxy interpretation, we find that much of Greenland experienced summers 3 to 5°C warmer than the mid-twentieth century in the early Holocene—earlier and stronger warming than often presumed. Warmth had dramatic consequences: Many glaciers disappeared, perennial sea ice retreated, plants and animals migrated northward, the Greenland Ice Sheet shrank rapidly, and increased meltwater discharge led to strong marine water stratification and enhanced winter sea ice in some areas.
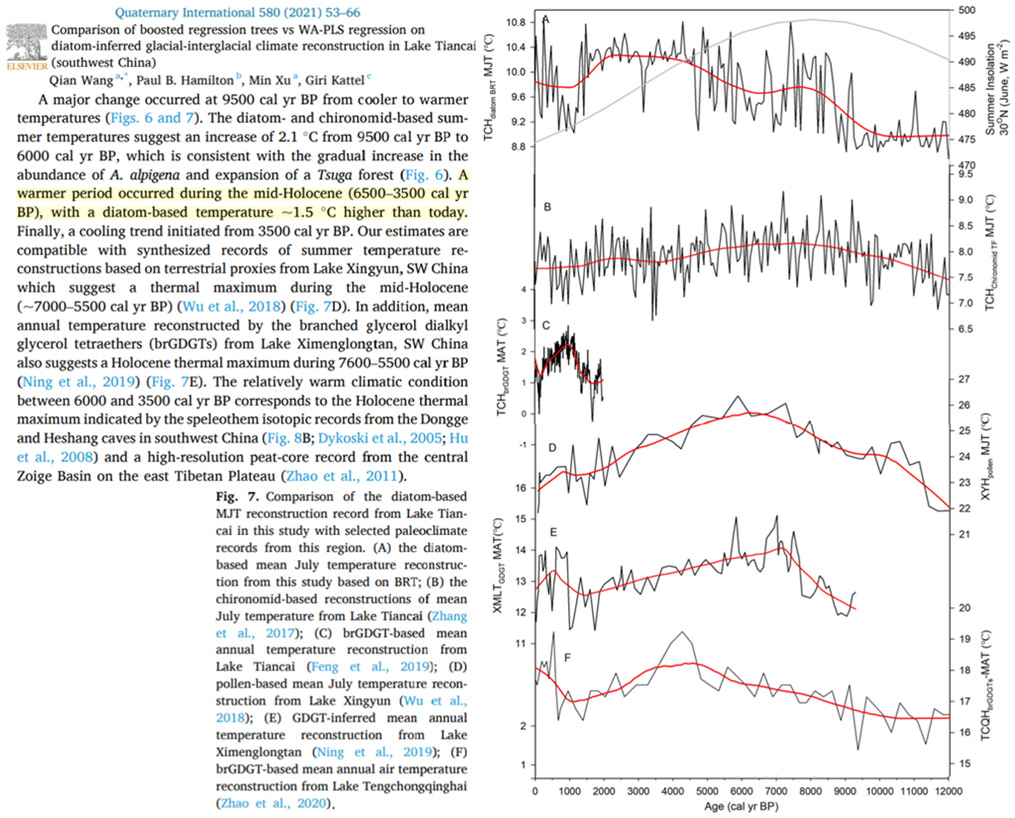
Wang et al., 2021 Southwest China temperatures warmer than today during the middle Holocene
Chen et al., 2021 Global mean temperatures “1–2 °C higher than the present” when CO2 was ~260 ppm
The global mean temperature in the Holocene climate optimum was 1–2 °C higher than the present
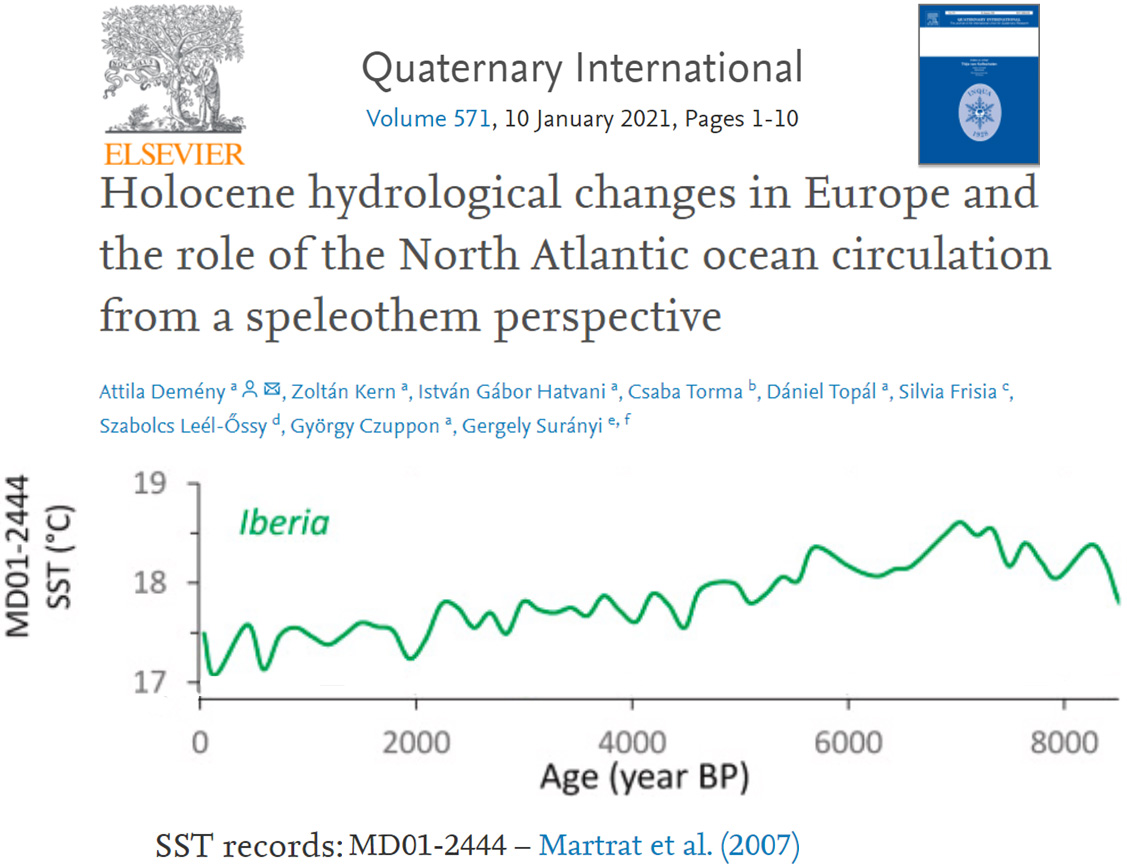
Demeny et al., 2021 Iberia ~1°C warmer than today 8,000 to 6,000 years ago
Fletcher et al., 2021 Arctic temperatures 13°C to 18°C warmer than present during the Pliocene (~350 ppm CO2)
Extreme rarity of conifer fossils or of any insects associated with forests also shows that the Fosheim Dome sites may not be as old as Remus Creek (24) and South Bay (25) or the Beaufort Formation. However, one of the mosses in the Fosheim Dome assemblage (Pleurozium schreberi (Willd. ex Brid.) Mitt.) is a Subarctic to boreal species. So, although trees were rare or did not grow near this site, they may have in more southerly locations on Ellesmere Island, indicating a climate warmer than today. The temperature estimate from mutual climate range of beetles is Tmax-mean of 10.7ºC, 8.3ºC warmer than present, and Tmin-mean -28.4ºC, 13ºC warmer than present (Elias and Matthews, 2002). Whether this was in latest Pliocene time or during an early Quaternary interglaciation is not presently known. … The remains of trees in the Arctic have also allowed for analysis of palaeoclimate using qualitative assessments based on ring widths and geochemical methods. For example, Csank et al. (2011a) conducted a detailed analysis of Larix wood from the Beaver Pond locality. They studied both ring widths and stable isotopes in the wood and conclude that during the 250-year life of one tree, the June-July growing season temperatures were 15.8±5.0°C or 11.8±5.1°C warmer than at present and mean annual temperatures (‒1.4±4.0°C) were 18.3±4.1°C warmer than present.
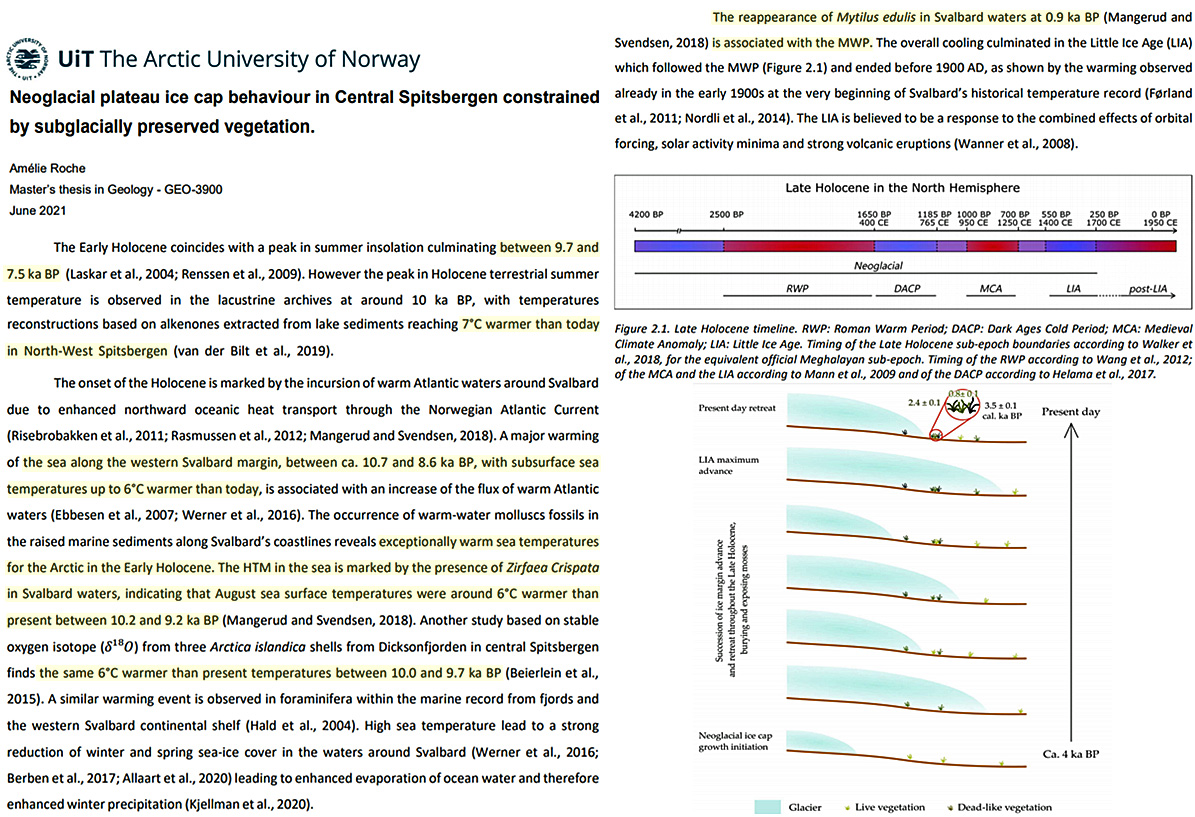
Roche, 2021 Northwest Spitsbergen “7°C warmer than today” during the Early Holocene
Jin et al., 2021 Ross Sea region warmer than today during the Medieval Warm Period
Our results indicate a relatively warm period occurred in the study area [~1400-800 yr BP], in accordance with an ‘optimum’ warming in the Ross Sea region. From a regional view, this warm period was also consolidated with climatic records from the western Ross Sea, most likely corresponding to a well-recognized climate perturbation known as the Medieval Climate Anomaly (MCA) in many parts of the world.
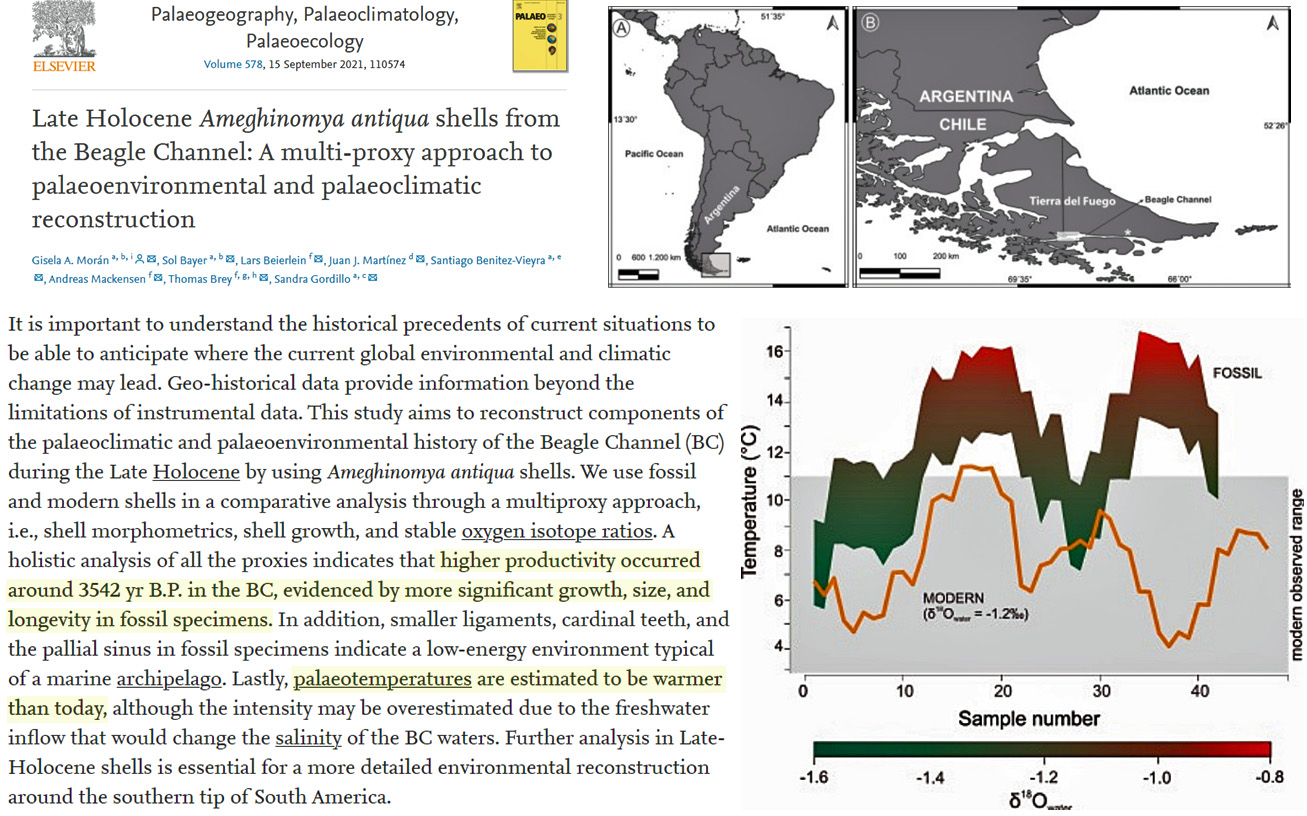
Morán et al., 2021 Southernmost South America “warmer than today” (2-3°C?) during the Late Holocene
This study aims to reconstruct components of the palaeoclimatic and palaeoenvironmental history of the Beagle Channel (BC) during the Late Holocene by using Ameghinomya antiqua shells. We use fossil and modern shells in a comparative analysis through a multiproxy approach, i.e., shell morphometrics, shell growth, and stable oxygen isotope ratios. A holistic analysis of all the proxies indicates that higher productivity occurred around 3542 yr B.P. in the BC, evidenced by more significant growth, size, and longevity in fossil specimens. In addition, smaller ligaments, cardinal teeth, and the pallial sinus in fossil specimens indicate a low-energy environment typical of a marine archipelago. Lastly, palaeotemperatures are estimated to be warmer than today, although the intensity may be overestimated due to the freshwater inflow that would change the salinity of the BC waters.
Larocca and Axford, 2021 Early Holocene Arctic-wide summer temperatures “at least ~2°C above present”
Finally, our early Holocene estimate of Arctic–wide summer warming of at least ~2°C above present is consistent with previous syntheses of paleotemperature evidence from the Arctic.
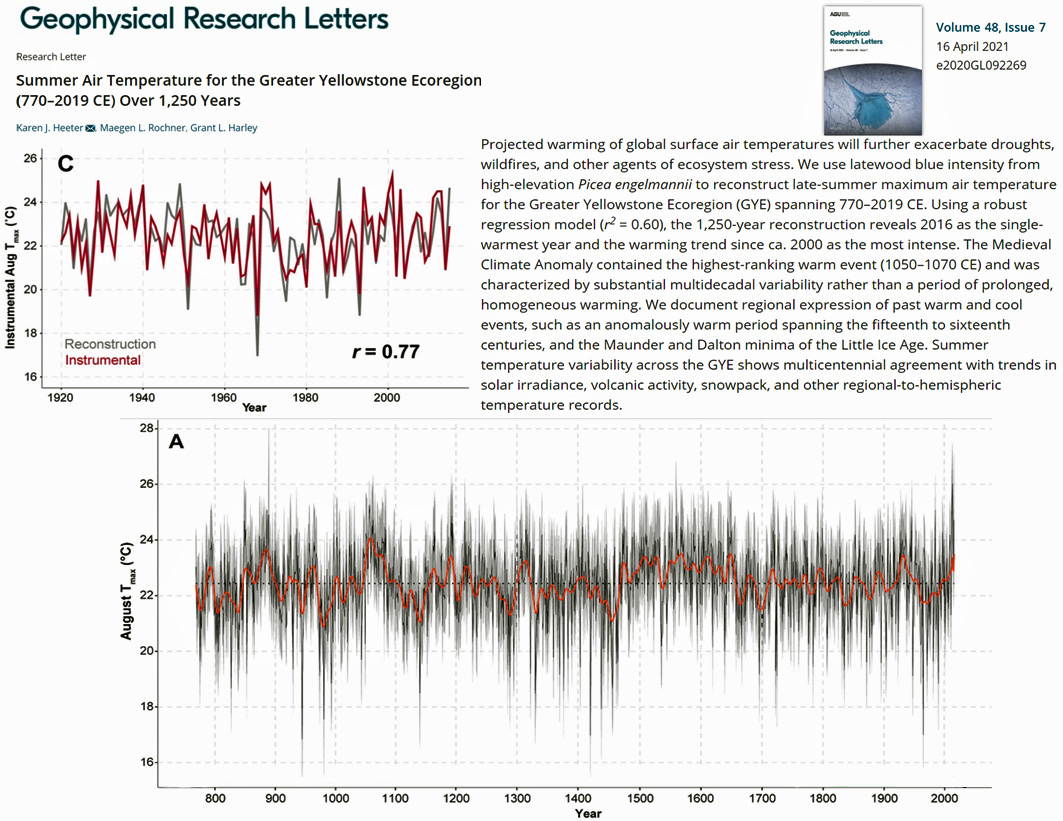
Heeter et al., 2021 Yellowstone region has no obvious net warming from 770 to 2019
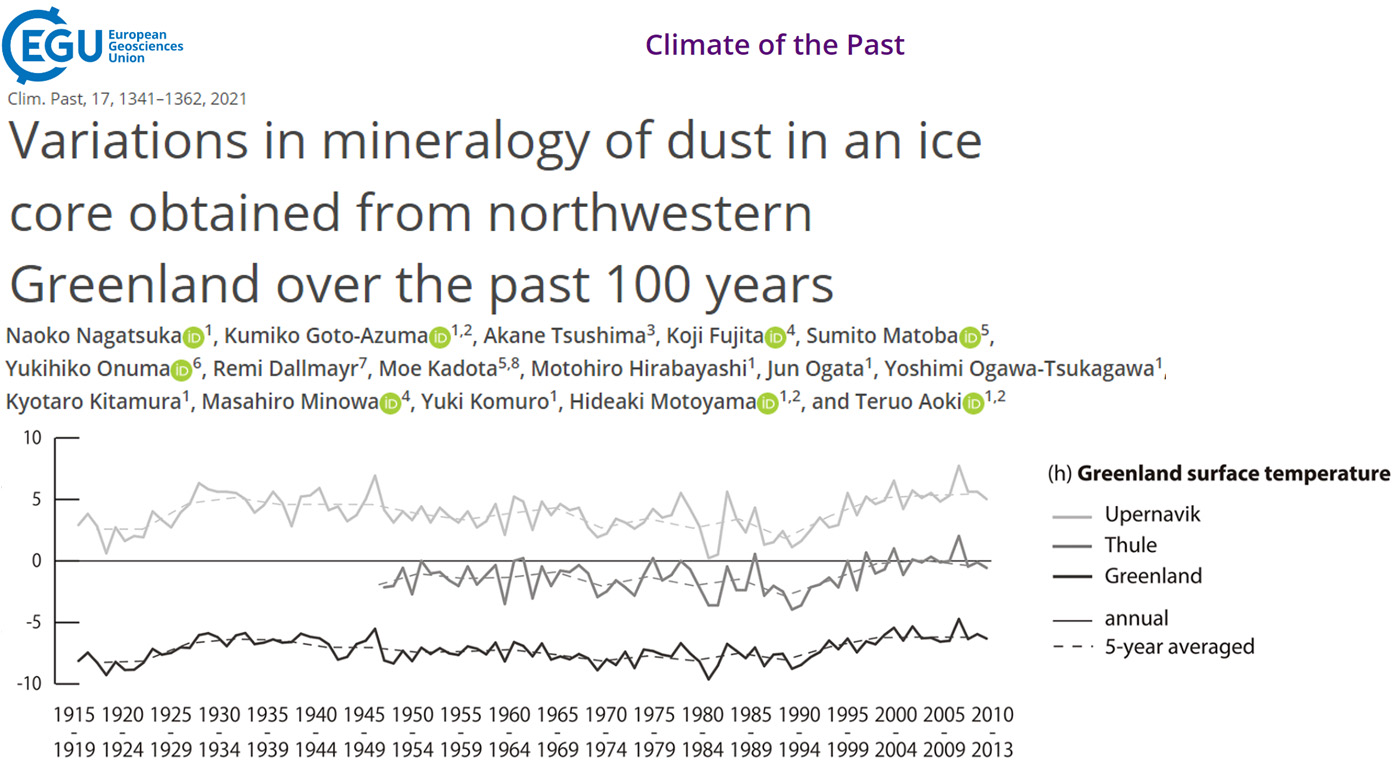
Nagatsuka et al., 2021 Greenland has had no obvious net warming since 1930s
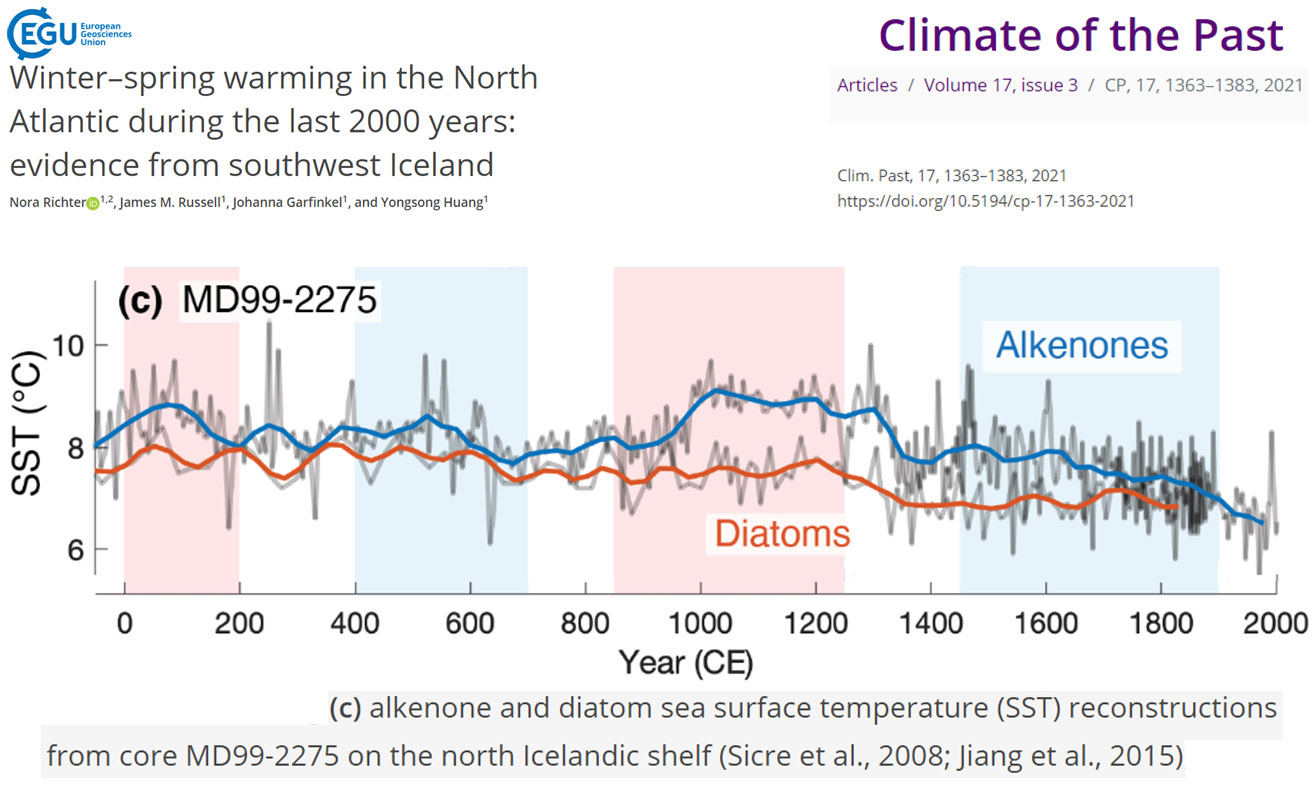
Richter et al., 2021 North Iceland 2-3°C warmer during Medieval Warm Period (1000s to 1200s AD)
Zheng et al., 2021 Central China as warm as 2000s during early 1800s
Hannold et al., 2021 North America’s temperatures 3-5°C higher during Pliocene despite lower CO2
The MAT estimated by averaging all the calculated temperatures is 22 ± 3 ◦C (±1σ), which is significantly warmer than modern MAT in Chihuahua (18.1 ± 1.2 ◦C; ±1σ). The reconstructed temperatures at the study site ~5 Ma were consistent with the results of model simulations suggesting a 3–5 ◦C higher temperature in the Pliocene than modern along the North American Cordillera (Haywood et al., 2000; Haywood and Valdes, 2004).
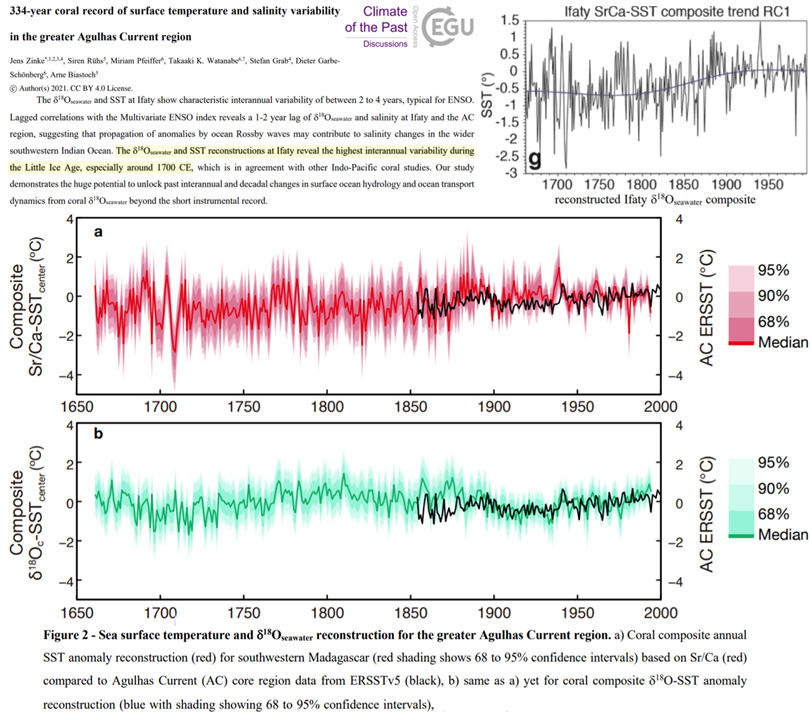
Zinke et al., 2021 Madagascar region has had no obvious net warming since 1700s
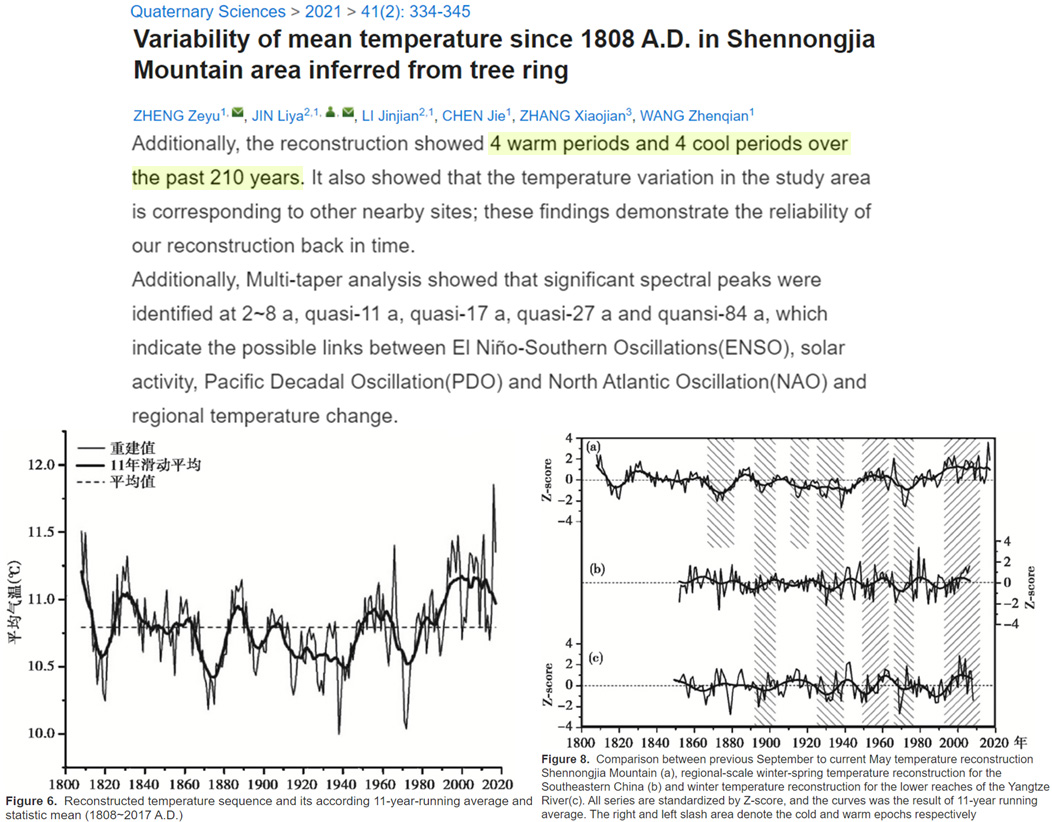
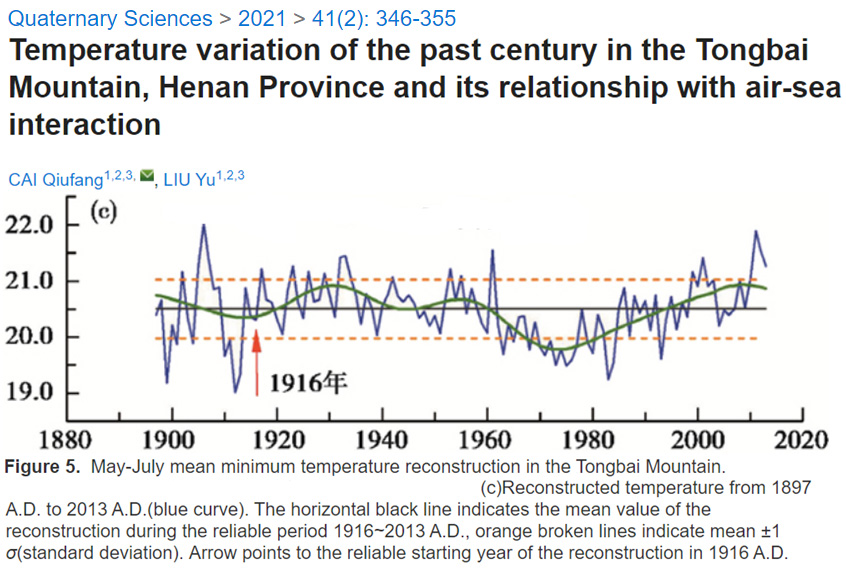
Cai and Liu, 2021 Tongbai Mountain (China) has had no obvious net warming since early 1900s
Liu et al., 2021 Northern Asia “~2–3°C warmer than today” from~8,000 to 3,000 years ago
During the Holocene Megathermal (8,000 ~ 3,000 cal yr BP), the climate of northern Asia was a Holocene thermal and humidity maximum by other proxy data (Stebich et al., 2015), with summer temperatures ~2–3°C warmer than today (Blinnikov et al., 2002; Valiranta, Kultti, & Seppa, 2006).
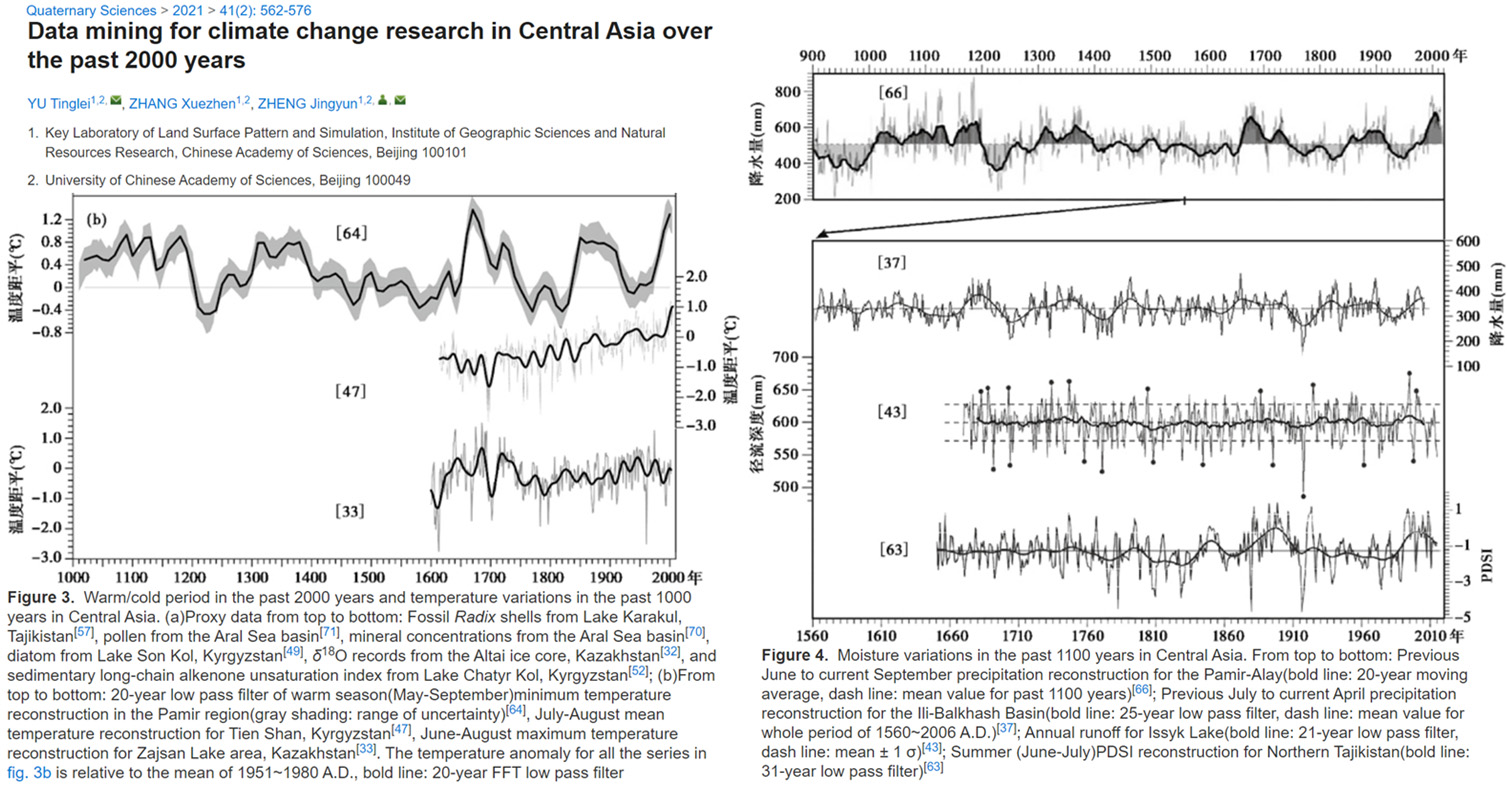
Yu et al., 2021 No net warming in Central Asia during the last 400 to 1,000 years
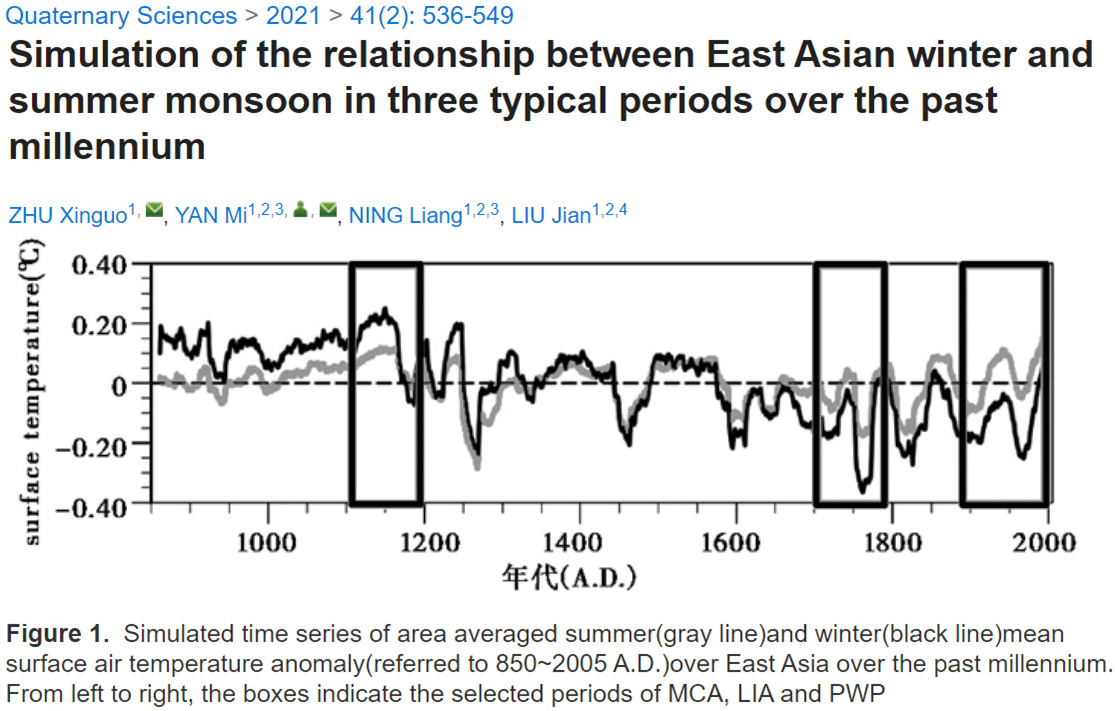
Zhu et al., 2021 Medieval Warm Period warmer than modern in East Asia
Baumer et al., 2021 Laptev Sea “4 °C warmer than today” from 11,500 to 8,400 years ago
The beginning of the Early Holocene warming at 11.6 cal. ka BP at Lake Emanda coincides with the maximum in local insolation (Berger & Loutre 1991; Fig. 4) and is consistent with warming around Lake Billyakh at 11.3 cal. ka BP (Muller € et al. 2009), in the Laptev Sea region at 11.5 cal. ka BP (Andreev et al. 2011) and at Lake El’gygytgyn at 12 cal. ka BP (Swann et al. 2010). Pollen-based climate reconstructions from the Laptev Sea region inferred temperatures 4 °C warmer than today for the interval 11.5–8.4 cal. ka BP (Andreev et al. 2011), corresponding to the Holocene Thermal Maximum (HTM) at Lake Emanda at 11.5–9.0 cal. ka BP and at Lake El’gygytgyn at 11.4– 7.6 cal. ka BP (Swann et al. 2010).
Crump et al., 2021 Eastern Canadian Arctic 3-4°C warmer during the last interglacial, when CO2 peaked at 280 ppm
The DNA metabarcoding results provide compelling evidence that dwarf birch, a relatively cold-intolerant woody shrub that typifies the Low Arctic tundra and whose northern limit is currently ∼400 km south in the Eastern Canadian Arctic … The interval with these three taxa defines the peak vegetation community at CF8 and is characteristic of Bioclimate Subzone D, which has a mean July temperature range of 7 to 9 °C (2 to 4 °C warmer than present). This shift is consistent with peak LIG warmth of ∼3 °C above the late 20th century inferred from pollen (Fig. 3) and 4 to 5 °C above the late 20th century inferred from chironomid assemblages July air temperatures inferred from pollen assemblages … are highest in the LIG and ranged from ∼4 to 8 °C
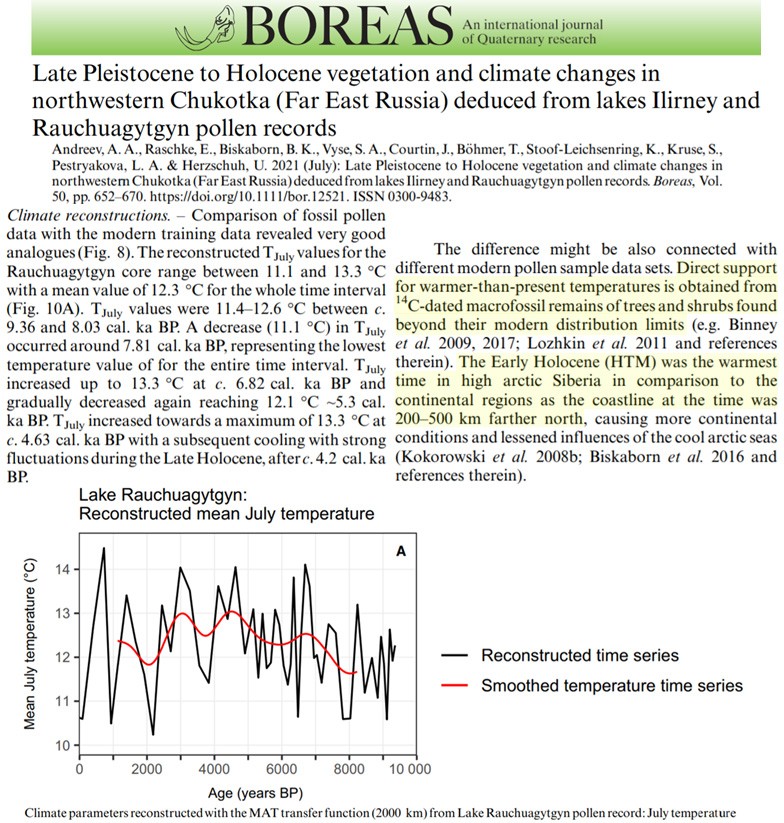
Andreev et al., 2021 Arctic Siberia “warmer-than-present” during Early Holocene, when coastline was 200-500 km farther north
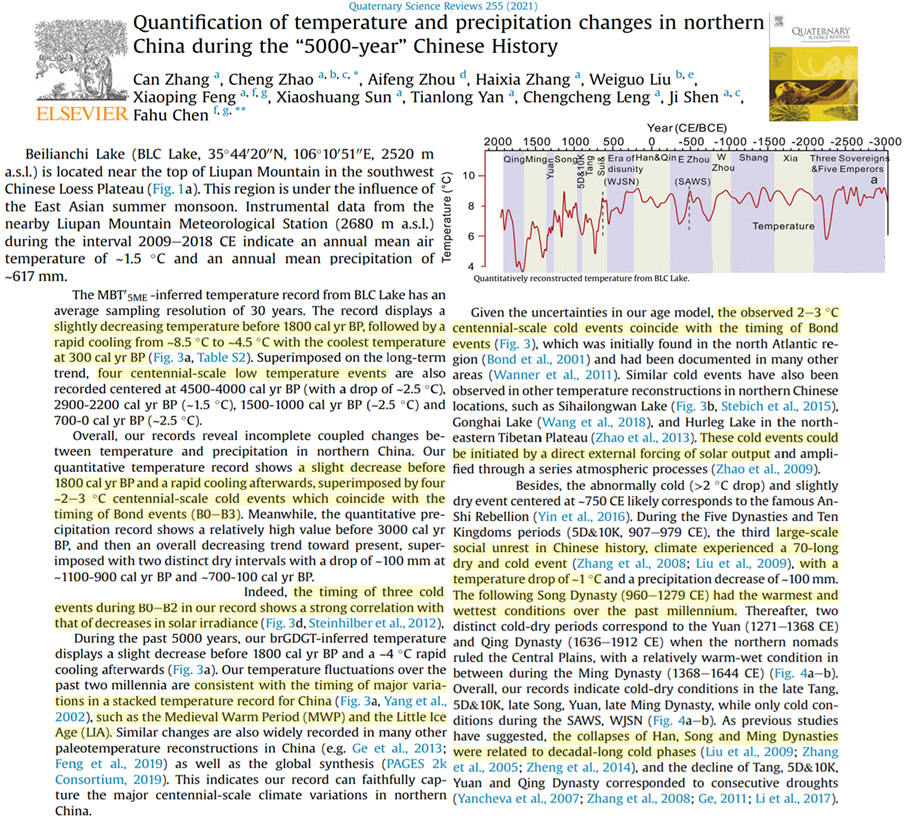
Zhang et al., 2021 Northern China temperature peaked 3°C higher than today in the last 5,000 years
Before reconstructing temperature over the past 5000 yr, we first compared the brGDGT-inferred core-top temperature (average of 9 surface sediments) with local instrumental data. The reconstructed core-top temperature of ~6.5 °C is higher than the instrumental mean air temperature of ~3 °C which is calculated using the nearby Liupan Mountain Meteorological Station data (2009-2018) with the consideration of elevational differences between the lake and the station.
Goto-Azuma e tal., 2021 Greenland Holocene temperatures 2–3 °C higher than today, and 8 °C higher during the last interglacial period
Variations in terrestrial environments over the past 130,000 years were reconstructed using ion data from the NEEM ice core (Schüpbach et al., 2018). Compared with the present day, temperature during the early Holocene was 2–3 °C higher and temperature during the last interglacial period was 8 °C higher.
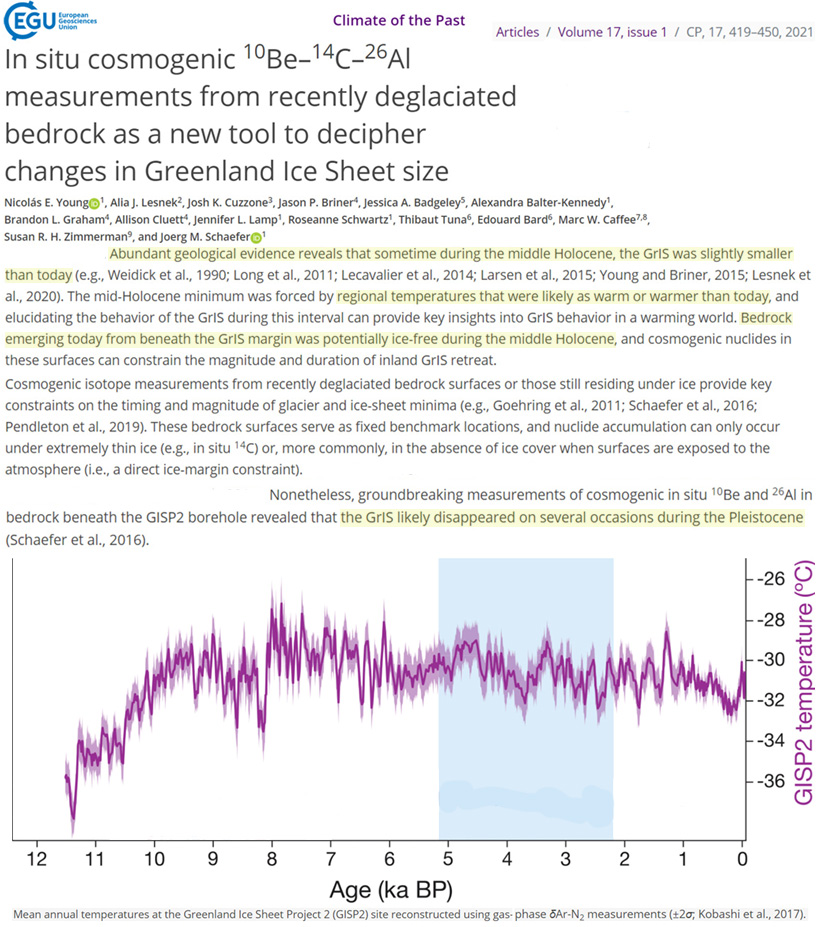
Young et al., 2021 Greenland had less ice during the middle Holocene (260 ppm CO2) and the ice sheet “likely disappeared” when CO2 peaked at only 280 ppm (Pleistocene interglacials)
Abundant geological evidence reveals that sometime during the middle Holocene, the GrIS was slightly smaller than today (e.g., Weidick et al., 1990; Long et al., 2011; Lecavalier et al., 2014; Larsen et al., 2015; Young and Briner, 2015; Lesnek et al., 2020). The mid-Holocene minimum was forced by regional temperatures that were likely as warm or warmer than today … These bedrock surfaces serve as fixed benchmark locations, and nuclide accumulation can only occur under extremely thin ice (e.g., in situ 14C) or, more commonly, in the absence of ice cover when surfaces are exposed to the atmosphere (i.e., a direct ice-margin constraint). … groundbreaking measurements of cosmogenic in situ 10Be and 26Al in bedrock beneath the GISP2 borehole revealed that the GrIS likely disappeared on several occasions during the Pleistocene (Schaefer et al., 2016).
Astakhov and Semionova, 2021 Russian Arctic had dense forests (tundra today) and sea floor temperatures were “4–8°C higher” when CO2 was 280 ppm (last interglacial)
The boreal mollusc fauna in the western Russian Arctic indicates sea floor temperatures by 4–8◦C higher than those of the present Kara Sea which is consistent with the warmest Eemian interglaciation of Western Europe … The terrestrial evidence poses a major problem: forest pollen association within thick peat layers in the Pechora Basin indicates environments much warmer than the present ones. As an example, the peat bog reconstructed from the inter-till deposits at the Seyda site (Fig. 10) suggests dense forest environment which is in great contrast with the present-day tundra, thus indicating a large shift of the vegetation zones to the north.
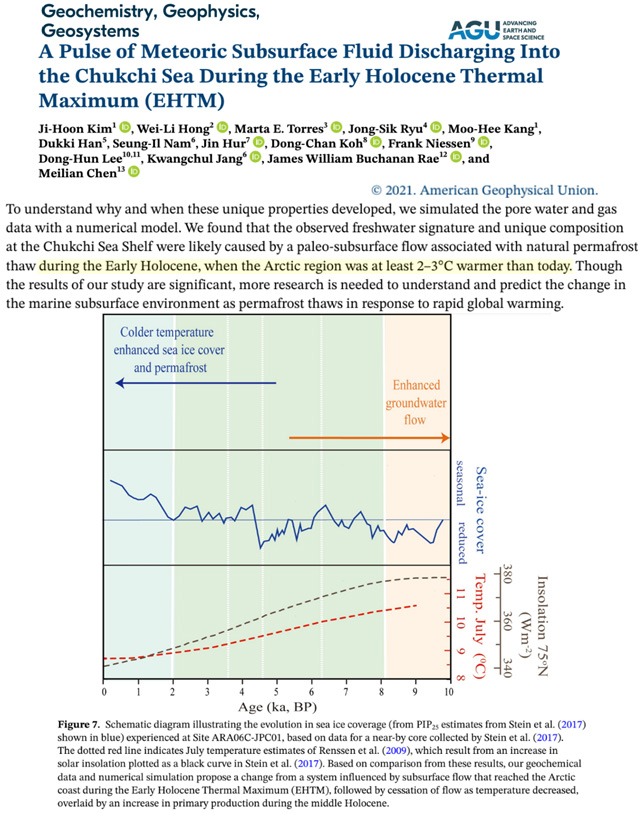
Kim et al., 2021 (full paper) The Arctic region 2–3°C warmer than today during the Early Holocene
We found that the observed freshwater signature and unique composition at the Chukchi Sea Shelf were likely caused by a paleo-subsurface flow associated with natural permafrost thaw during the Early Holocene, when the Arctic region was at least 2–3°C warmer than today.
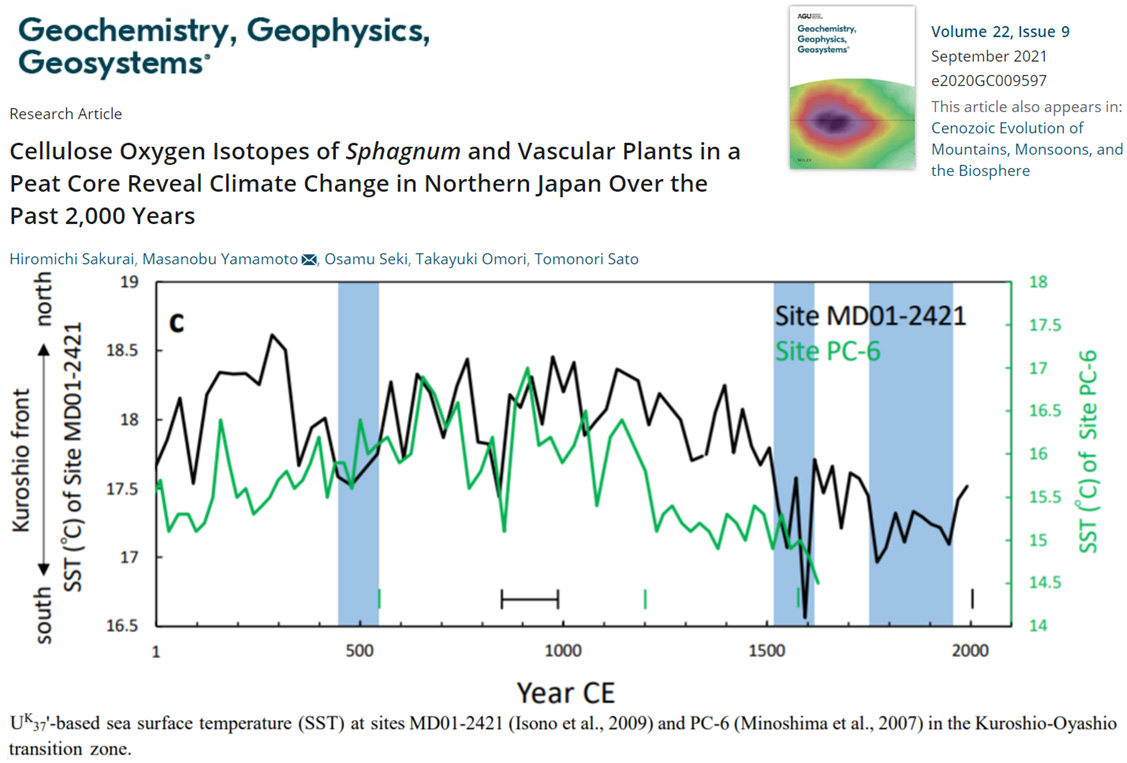
Sakurai et al., 2021 Northern Japan sea surface temperatures 1 – 1.5°C warmer than ~1990 during Medieval Warm Period
Sjögren, 2021 Northernmost Fennoscandia 1.5°C warmer than present 9,500 years ago
An overview of climate reconstructions considering summer air temperatures and effective precipitation is provided for northernmost Fennoscandia. During the earliest part of the Holocene (11,700–10,000 cal. BP), temperatures rose rapidly and were followed by mild, wet and variable conditions. An early major warming peaked around 9500 cal. BP, although many records indicate that the main Holocene warming first occurred about c. 8000 cal. BP. The sub-regional pattern of climate change suggests a defining influence of the westerlies and the North Cape Current. Non-analog climatic conditions and lags in vegetation responses to climate change may explain some of the discrepancies seen in the early Holocene between proxies. In contrast to the perceivable variable onset of the main Holocene warm period, maximum temperatures are relatively consistent between the records, indicating temperatures 1.5±0.5°C above present.
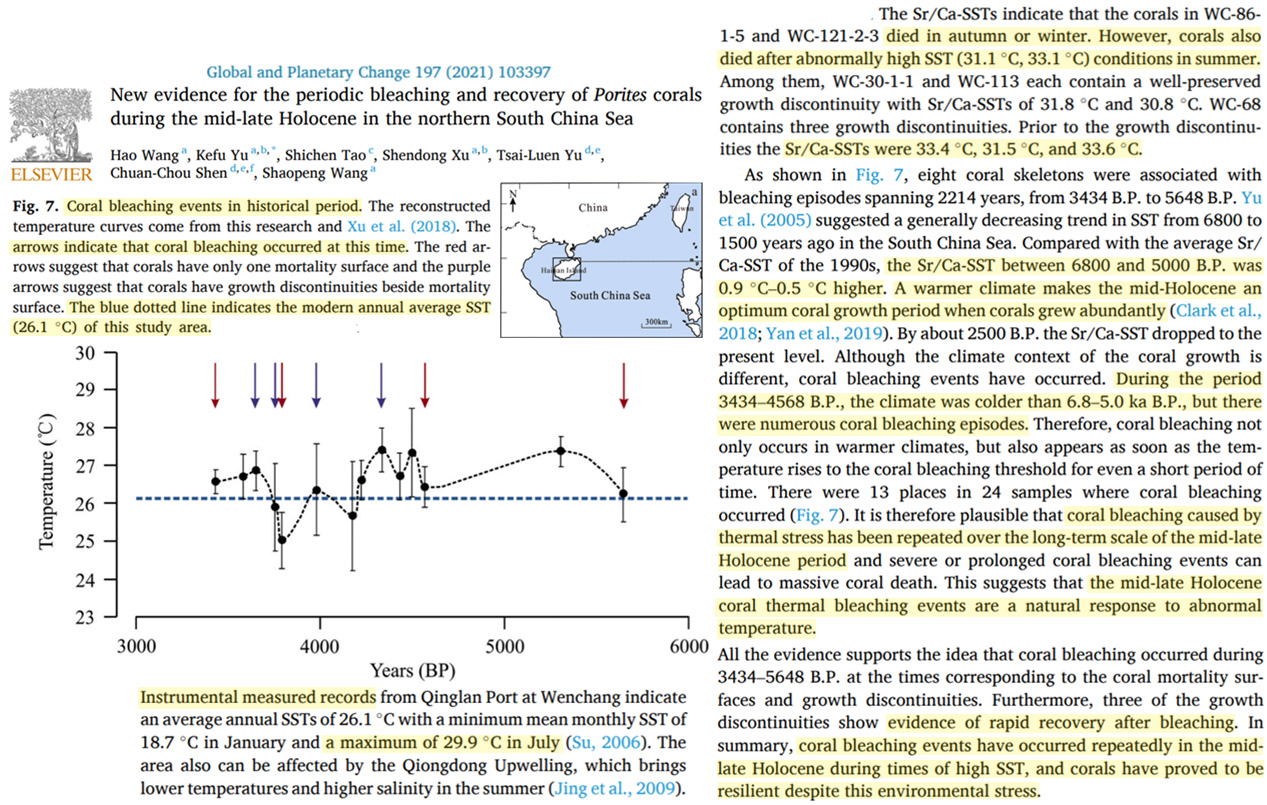
Wang et al., 2021 Northern South China Sea surface temperatures 0.9◦C–0.5◦C higher between 6,800 and 5,000 years before present
Compared with the average Sr/Ca-SST of the 1990s, the Sr/Ca-SST between 6800 and 5000 B.P. was 0.9◦C–0.5◦C higher. A warmer climate makes the mid-Holocene an optimum coral growth period when corals grew abundantly (Clark et al., 2018; Yan et al., 2019). … During the period 3434–4568 B.P., the climate was colder than 6.8–5.0 ka B.P., but there were numerous coral bleaching episodes. … It is therefore plausible that coral bleaching caused by thermal stress has been repeated over the long-term scale of the mid-late Holocene period and severe or prolonged coral bleaching events can lead to massive coral death. This suggests that the mid-late Holocene coral thermal bleaching events are a natural response to abnormal temperature.
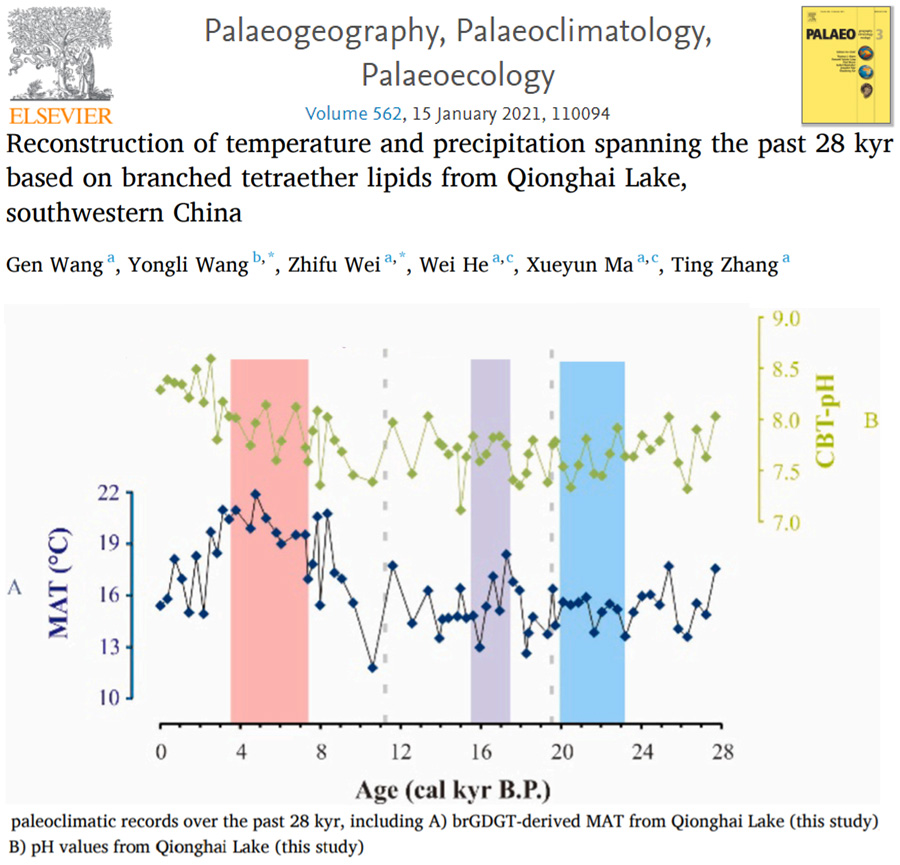
Wang et al., 2021 Southwestern China 2.5°C warmer than modern between 8,000 and 3,000 years ago
We found that the temperature of the Last Glacial Maximum and Holocene Climatic Optimum was ~3 °C cooler and ~ 2.5 °C warmer than present-day conditions, respectively, based on brGDGTs-reconstructed mean annual air temperatures (MATs).
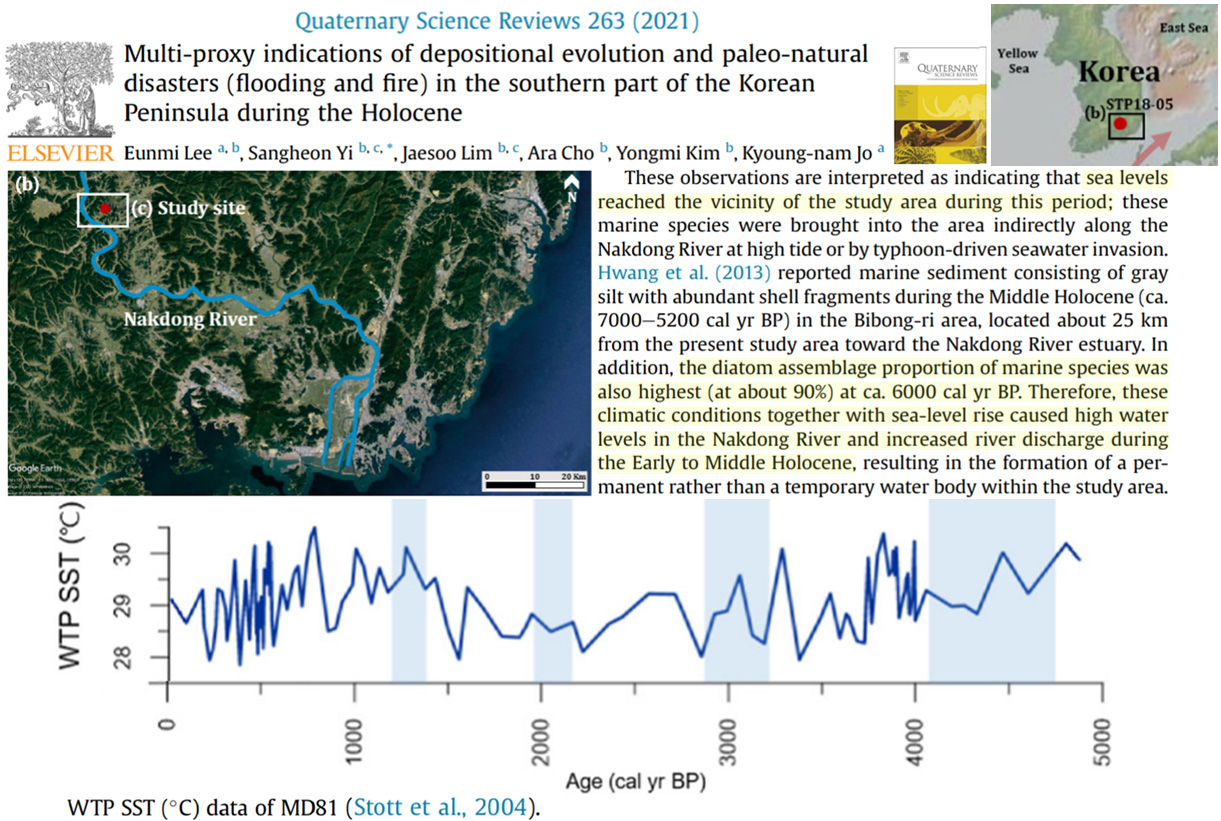
Lee et al., 2021 Korean sea surface temperatures as warm or warmer than today for much of the last 5,000 years
[S]ea levels reached the vicinity of the study area [today ~50 km inland] during this period. .. [T]he diatom assemblage proportion of marine species was also highest (at about 90%) at ca. 6000 cal yr BP.
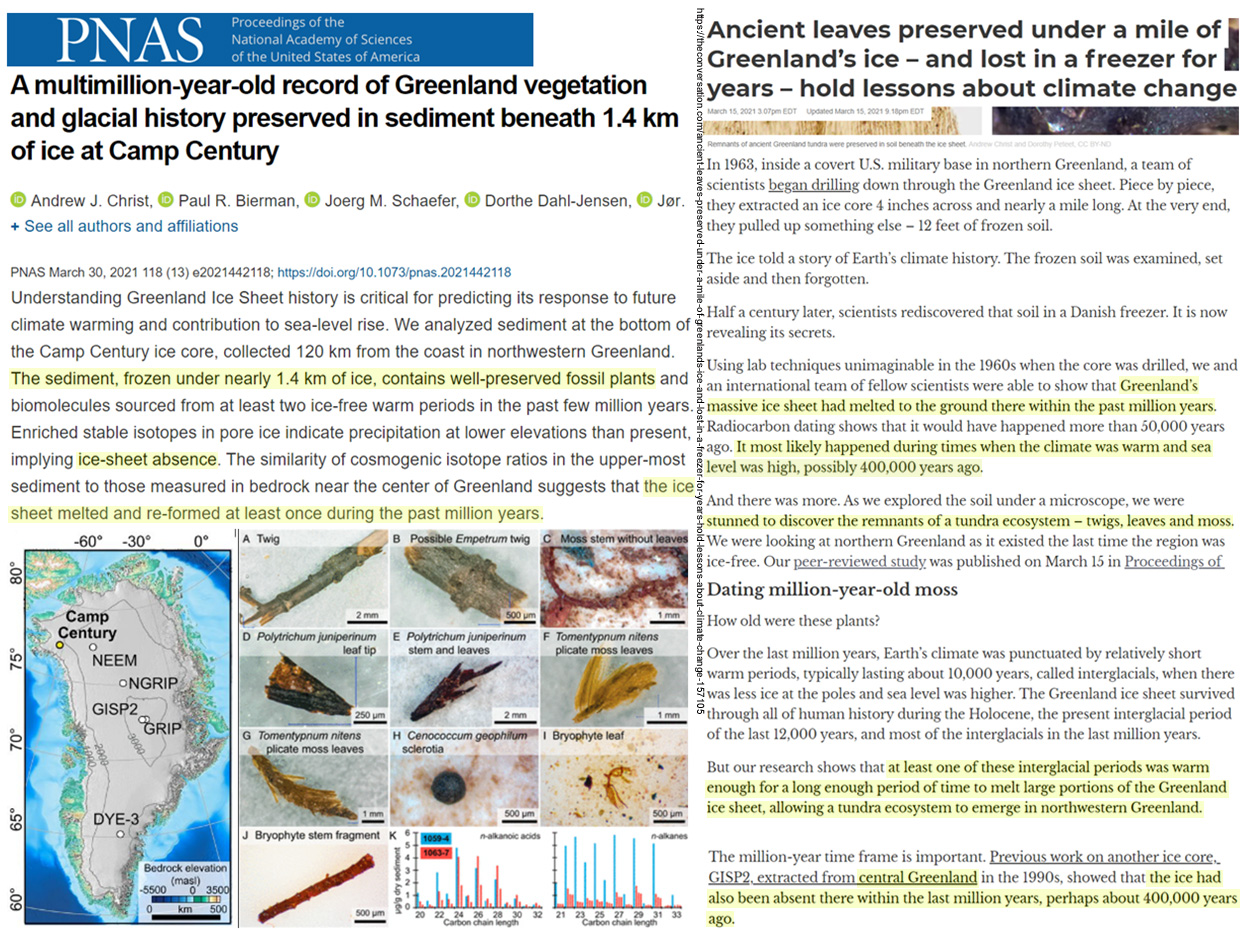
Christ et al., 2021 Northern Greenland ice sheet 1.4 km high today, but so warm it was ice free ~400,000 years ago – when CO2 at 280 ppm
We analyzed sediment at the bottom of the Camp Century ice core, collected 120 km from the coast in northwestern Greenland. The sediment, frozen under nearly 1.4 km of ice, contains well-preserved fossil plants and biomolecules sourced from at least two ice-free warm periods in the past few million years. Enriched stable isotopes in pore ice indicate precipitation at lower elevations than present, implying ice-sheet absence.
(press release) Greenland’s massive ice sheet had melted to the ground there within the past million years. Radiocarbon dating shows that it would have happened more than 50,000 years ago. It most likely happened during times when the climate was warm and sea level was high, possibly 400,000 years ago.
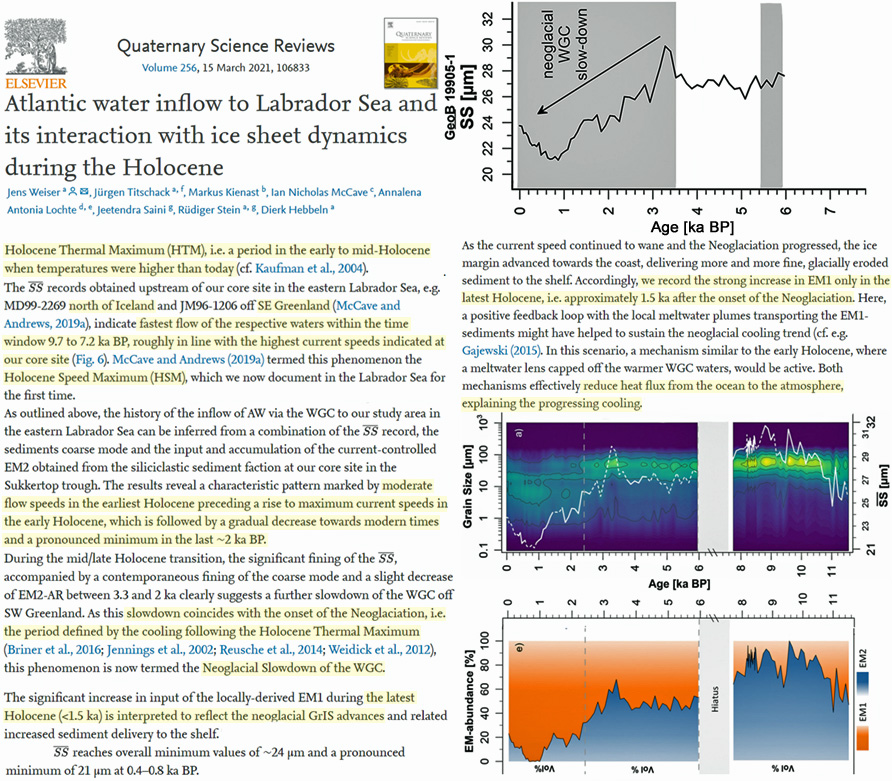
Weiser et al., 2021 Labrador Sea temperatures higher than today during the Holocene Thermal Maximum
Holocene Thermal Maximum (HTM), i.e. a period in the early to mid-Holocene when temperatures were higher than today (cf. Kaufman et al., 2004). … [M]oderate [meltwater] flow speeds in the earliest Holocene preceding a rise to maximum current speeds the early Holocene, which is followed by a gradual decrease towards modern times and a pronounced minimum during the last ~2 ka BP.
Zhang et al., 2021 China had temperature fluctuations of 2-3°C per century throughout the Holocene with the Medieval Warm Period (960-1279 CE) warmer than today
The record displays a slightly decreasing temperature before 1800 cal yr BP, followed by a rapid cooling from ~8.5°C to ~4.5°C with the coolest temperature at 300 cal yr BP … super imposed by four ~2-3°C centennial-scale cold events which coincide with the timing of Bond events … Indeed, the timing of three cold events during BO-B2 in our record shows a strong correlation with that of decreases in solar irradiance. … The following Song Dynasty (960-1279 CE) had the warmest and wettest conditions over the past millennium.
Lv et al., 2021 Central China ~3-5°C warmer than modern from ~11,000 to 6,000 years ago
Andreev et al., 2021 Canadian Arctic temperatures “at least 15° higher than modern” with pine and spruce forests (treeless today) when CO2 was 350 ppm (Pliocene)
Early Pliocene pollen and macrofossil records from central and northern Yukon and Alaska exhibit that mixed boreal forests with pine, fir, larch, spruce, birch, alder, larch, and Douglas fir dominated the local vegetation there (e.g., Schweger et al., 2011 and references therein). In the Canadian Arctic (Ellesmere Island), an early Pliocene record from Strathcona Fjord shows that forest with larch, spruce, pine, birch and alder dominated nowadays treeless area (Fletcher et al., 2019). … Based on pollen and macrofossil records from several sites in Chukotka, Glushkova and Smirnov (2007) assumed that the Pliocene climate was much warmer than today, with mean January temperatures estimated to be −13 to −17°C (at least 15° higher than modern) and mean July temperatures 14–17°C (ca. 8–10° higher than modern). These estimates are similar to biomarker-based average mean summer temperature estimates of 15.4 ± 0.8°C in the Canadian Arctic around that time (Fletcher et al., 2019).
Walker and Meijer, 2021 Norway “1.5–2.0°C warmer than present” from 7,300 to 4,800 years ago
In terms of climatic change, Dollsteinhola is of great interest, representing a mid-Holocene (7.3–4.8 BP) assemblage, a period where higher summer temperatures were around 1.5–2.0°C warmer than present [33–37]. According to the temperature curve for the west coast of Norway [37] the post-glacial warm period lasted until 4000 years BP. The younger material from Dollsteinhola dates to the late-Holocene (4.8 BP–present), a period of decreasing summer temperatures [33–35] and higher levels of precipitation [38]. This indicates that some of the later specimens from this site would have been from a colder and wetter period.
Toth et al., 2021 Carpathians 0.5°C warmer during the last glacial (16,300 to 16,000 and 13,400 years ago) when CO2 was ~220 ppm
The maximum chironomid-inferred July mean temperatures of GI-1 at Lake Saint Anne exceed the modern value (15°C) by about 0.5°C, but only for a short period between 16.3–16 ka and at 13.4 ka … This result partially supports the model-simulation-based inference of Renssen et al. (2002) that continental Europe summer temperature was slightly warmer during the Bølling interstadial (∼(GI-1e) than modern July temperatures.
Dong et al., 2021 Chinese Loess Plateau “~2 °C higher than today” from 8,000 to 3,000 years ago
During the interval of ~17–8 ka, in response to climatic warming, we observed marked increases in shell dimensions … from ~5–6 °C lower than today during the glacial period in the CLP [Chinese Loess Plateau], to ~2 °C higher than today during the Holocene Climatic Optimum
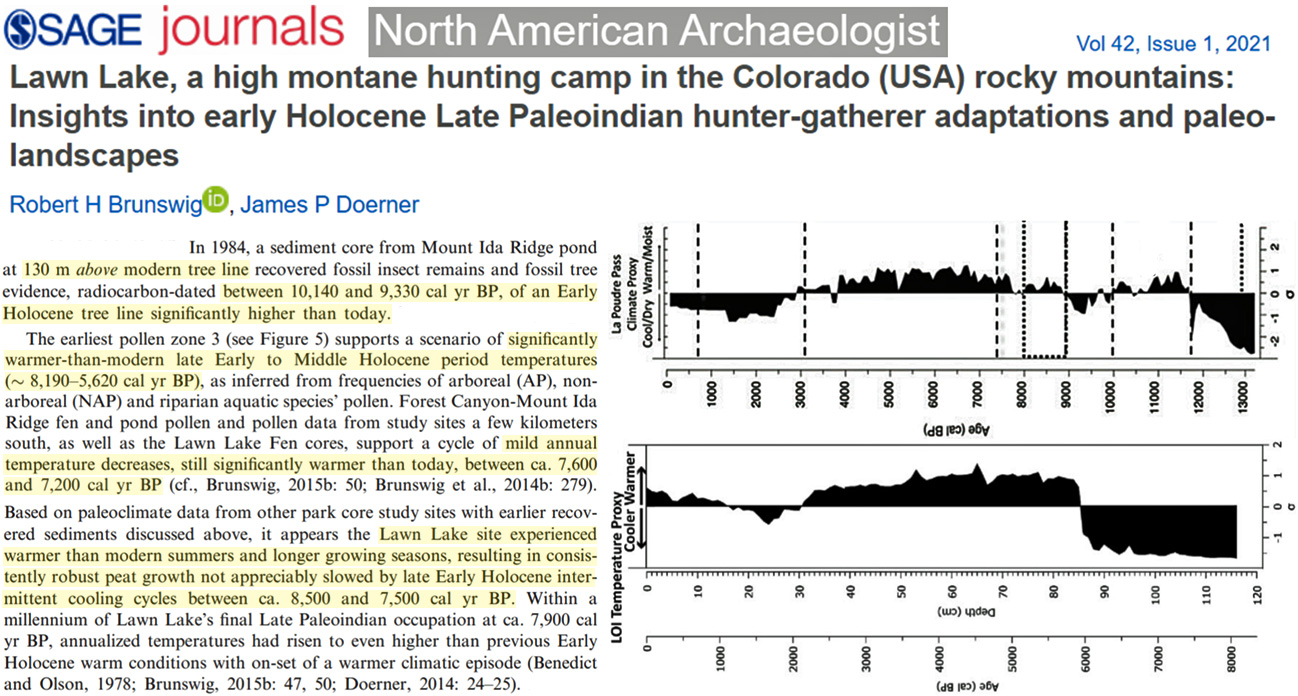
Brunswig and Doerner, 2021 Colorado (USA) “significantly warmer-than-modern late Early to Middle Holocene period temperatures (~ 8,190–5,620 cal yr BP)”
Mount Ida continental divide alpine ridgeline and mountain slope tree line reached ~130 m higher-than-modern levels between 10,140–9,330 cal yr BP, within a millennium of the end of Younger Dryas cold climate (Brunswig, 2014a: 103). Lawn Lake paleoclimate data (see below), correlated with La Poudre Pass, Sky Pond, and Loch Vail pollen and fossil insect studies and those applied to the Forest Canyon Pass-Mount Ida GIS paleoclimate model, support existence of an Early Holocene (post-Younger Dryas) climatic optimum and tree lines rising to or above modern-day levels between 10,300 and 9,700 cal BP (cf. Brunswig, 2014b: 103, 2015b: 50; Elias, 1985: 33, 35–36, 43–45). In 1984, a sediment core from Mount Ida Ridge pond at 130 m above modern tree line recovered fossil insect remains and fossil tree evidence, radiocarbon-dated between 10,140 and 9,330 cal yr BP, of an Early Holocene tree line significantly higher than today. … The earliest pollen zone 3 (see Figure 5) supports a scenario of significantly warmer-than-modern late Early to Middle Holocene period temperatures (~ 8,190–5,620 cal yr BP), as inferred from frequencies of arboreal (AP), nonarboreal (NAP) and riparian aquatic species’ pollen. Forest Canyon-Mount Ida Ridge fen and pond pollen and pollen data from study sites a few kilometers south, as well as the Lawn Lake Fen cores, support a cycle of mild annual temperature decreases, still significantly warmer than today, between ca. 7,600 and 7,200 cal yr BP (cf., Brunswig, 2015b: 50; Brunswig et al., 2014b: 279).
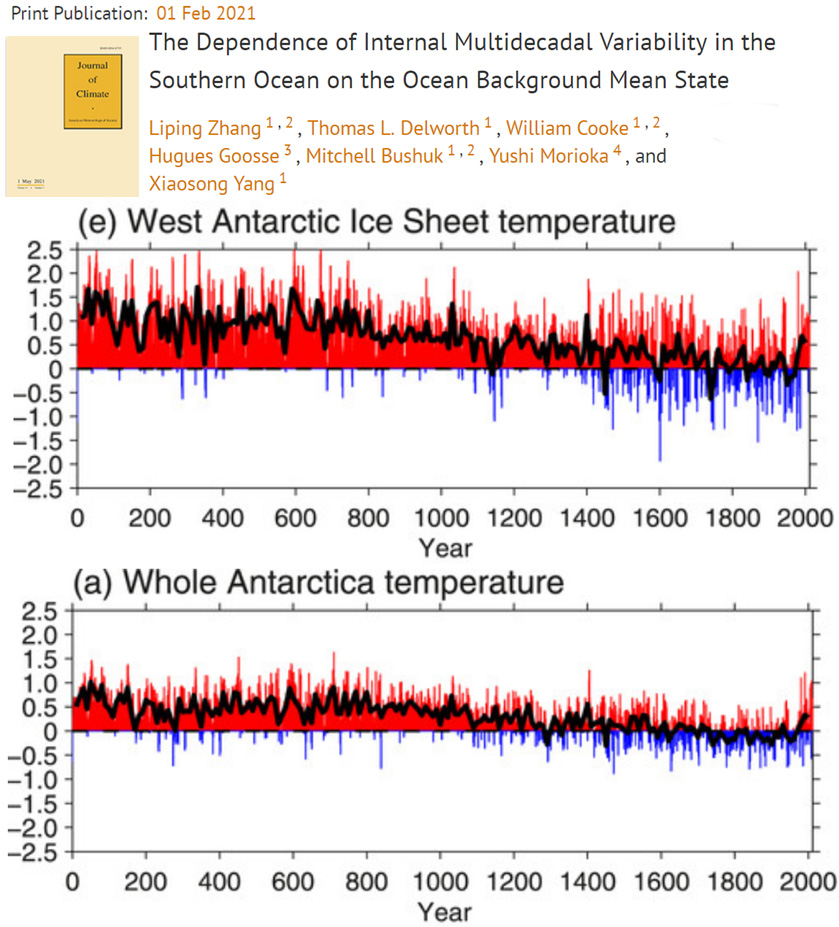
Zhang et al., 2021 Antarctica as-warm or warmer than today throughout the 1st millennium
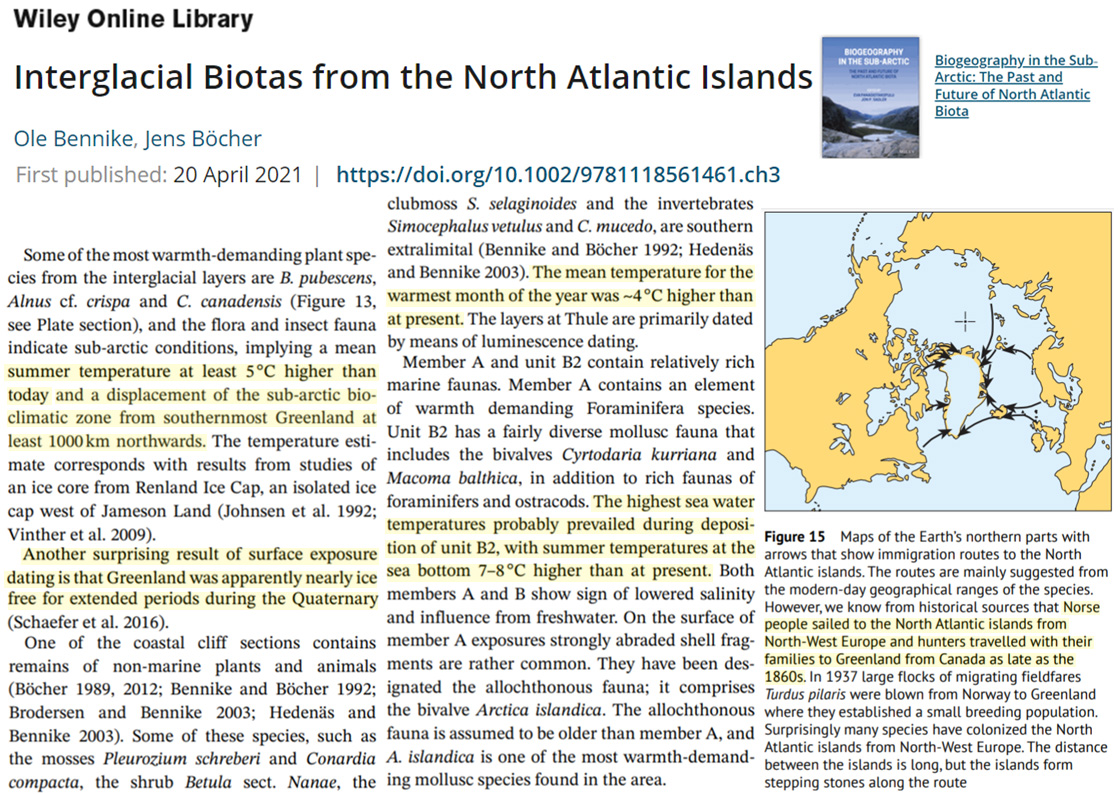
Bennike and Böcher, 2021 Greenland nearly ice-free, 5°C warmer (7–8 °C higher than at present bottom water temps) when CO2 was 280 ppm and lower (Quaternary interglacials)
Some of the most warmth-demanding plant species from the interglacial layers are B. pubescents, Alnus cf. crispa and C. canadensis, and the flora and insect fauna indicate sub-arctic conditions, implying a mean summer temperature at least 5°C higher than today and a displacement of the sub-arctic bioclimatic zone from southernmost Greenland [today] to at least 1000 km northwards. … Greenland was apparently nearly ice free for extended periods during the Quaternary [Pleistocene and Holocene, 2.6 million years ago to present]. … The highest sea water temperatures probably prevailed during deposition of unit B2, with summer temperatures at the sea bottom 7–8 °C higher than at present.
Babeshko et al., 2021 No changes in vegetation in the last 600 years in NE Fennoscandia (Russia)
Our data indicate that the peat deposits started accumulating before 9147 ± 182 cal. yr. BP. The vegetation cover in the area was mainly typical for the northern taiga zone, except for the period ~7800–5600 cal. yr. BP, when it generally resembled the middle taiga zone. The vegetation cover and peatland were greatly affected by reoccurring fires, which can be partly related to human activity. These events were associated with an increased proportion of birch in the vegetation cover (as a pioneer species) and/or water level decreases. By 600 cal. yr. BP, the peatland and the surrounding vegetation reached its current state and only minor changes had been recorded since that time. Overall, our results suggest a considerable and unexpected role of fires in the postglacial dynamics of subarctic peatlands.
Astakhov and Semionova, 2021 Northeast Europe climate “much warmer than today” when CO2 peaked at 280 ppm
Another line of evidence for this time span is inferred from inter-till terrestrial sequences in the European Northeast with forest pollen spectra suggesting a climate much warmer than today.
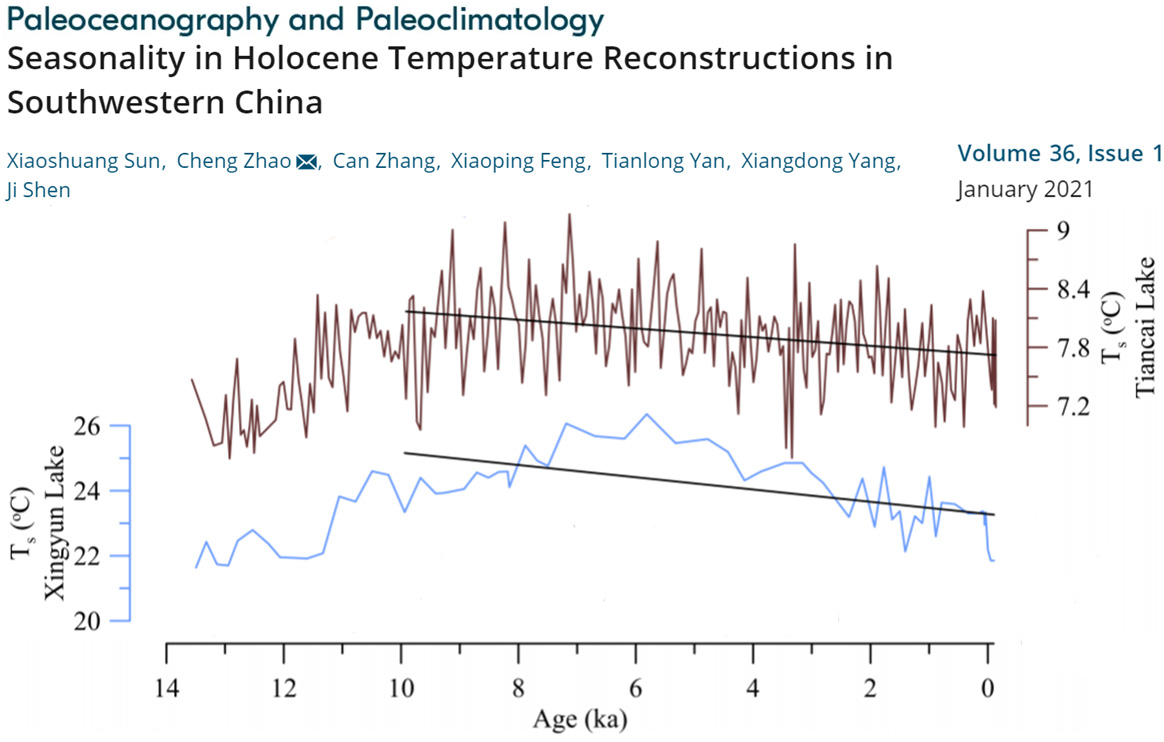
Sun et al., 2021 SW China lakes ~1-3°C warmer 5,000 to 8,000 years ago
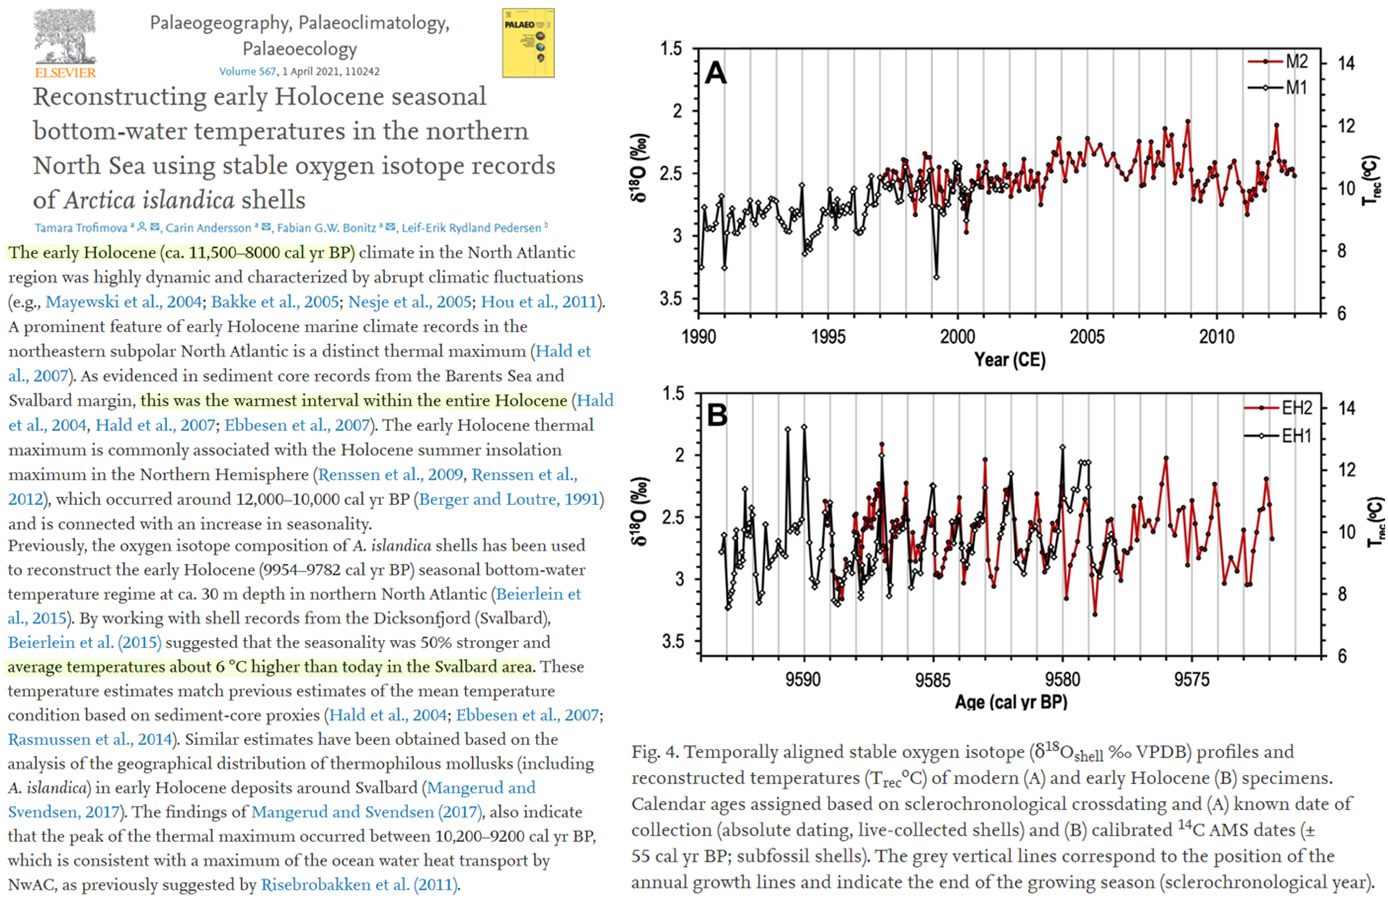
Trofimova et al., 2021 Svalbard region “average temperatures about 6 °C higher than today” during Early Holocene
The early Holocene (ca. 11,500–8000 cal yr BP) climate in the North Atlantic region was highly dynamic and characterized by abrupt climatic fluctuations (e.g., Mayewski et al., 2004; Bakke et al., 2005; Nesje et al., 2005; Hou et al., 2011). A prominent feature of early Holocene marine climate records in the northeastern subpolar North Atlantic is a distinct thermal maximum (Hald et al., 2007). As evidenced in sediment core records from the Barents Sea and Svalbard margin, this was the warmest interval within the entire Holocene (Hald et al., 2004, Hald et al., 2007; Ebbesen et al., 2007). … Previously, the oxygen isotope composition of A. islandica shells has been used to reconstruct the early Holocene (9954–9782 cal yr BP) seasonal bottom-water temperature regime at ca. 30 m depth in northern North Atlantic (Beierlein et al., 2015). By working with shell records from the Dicksonfjord (Svalbard), Beierlein et al. (2015) suggested that the seasonality was 50% stronger and average temperatures about 6 °C higher than today in the Svalbard area. These temperature estimates match previous estimates of the mean temperature condition based on sediment-core proxies (Hald et al., 2004; Ebbesen et al., 2007; Rasmussen et al., 2014). Similar estimates have been obtained based on the analysis of the geographical distribution of thermophilous mollusks (including A. islandica) in early Holocene deposits around Svalbard (Mangerud and Svendsen, 2017).
No Net Warming Since Mid/Late 20th Century
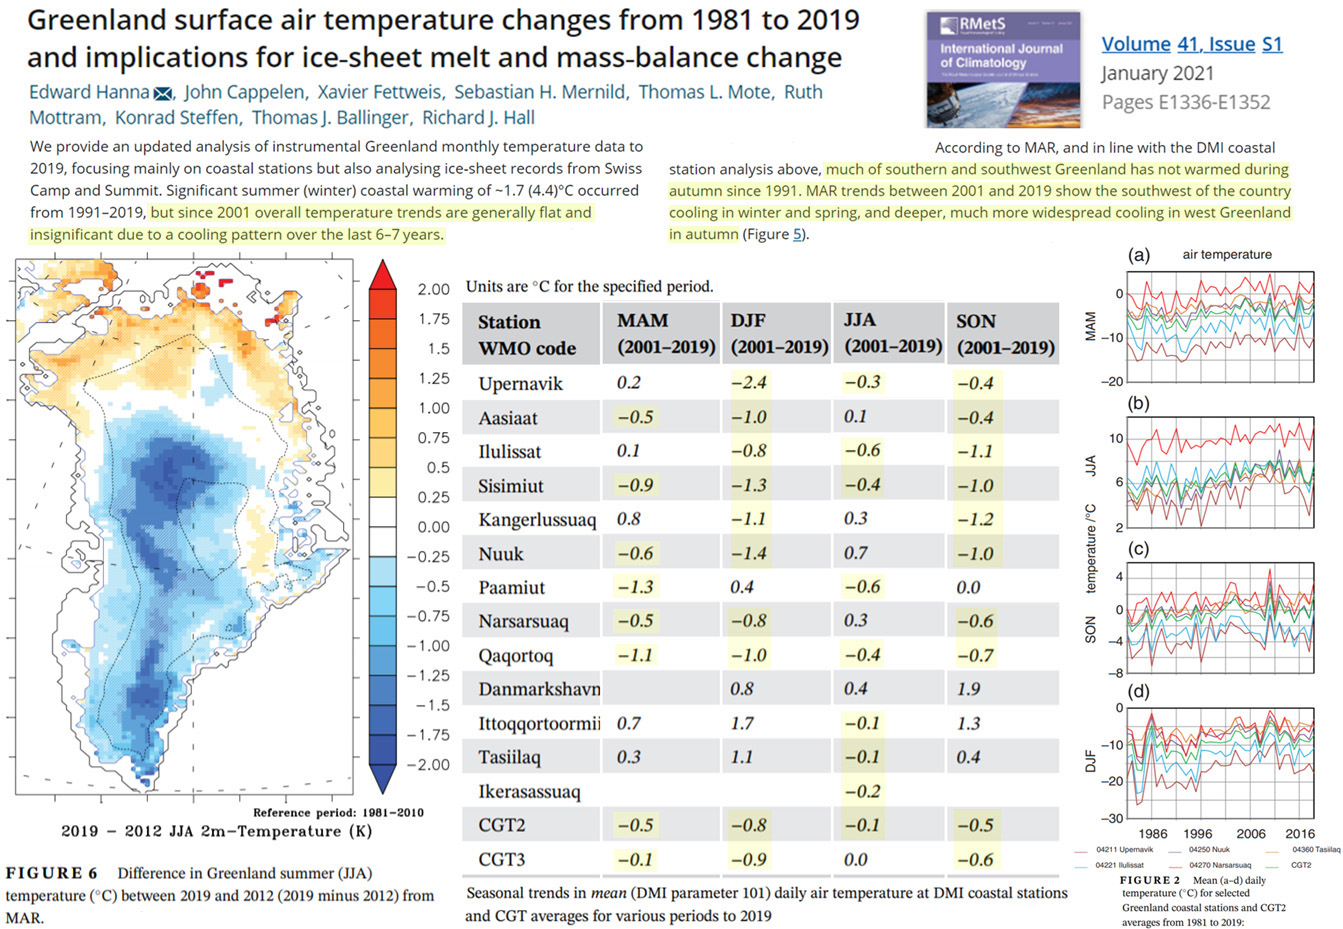
Hannah et al., 2021 Greenland has not warmed (net) since 2001 due to cooling trend since 2013
We provide an updated analysis of instrumental Greenland monthly temperature data to 2019, focusing mainly on coastal stations but also analysing ice‐sheet records from Swiss Camp and Summit. Significant summer (winter) coastal warming of ~1.7 (4.4)°C occurred from 1991–2019, but since 2001 overall temperature trends are generally flat and insignificant due to a cooling pattern over the last 6–7 years. … According to MAR, and in line with the DMI coastal station analysis above, much of southern and southwest Greenland has not warmed during autumn since 1991. MAR trends between 2001 and 2019 show the southwest of the country cooling in winter and spring, and deeper, much more widespread cooling in west Greenland in autumn
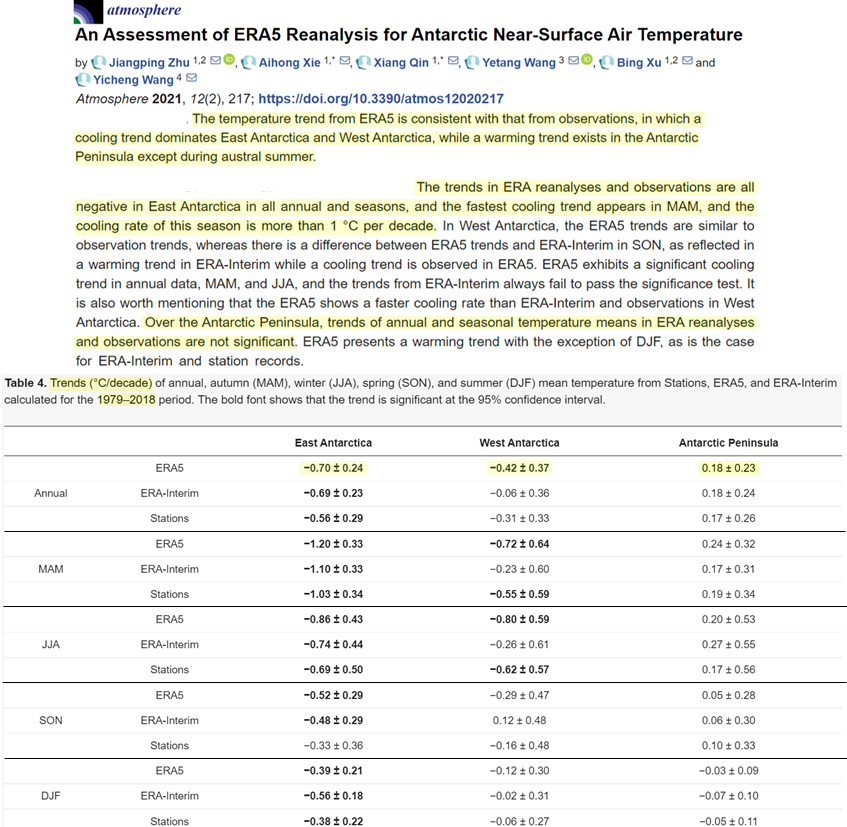
Zhu et al., 2021 E. Antarctica cooled -2.8°C, W. Antarctica cooled -1.68°C from 1979-2018
The temperature trend from ERA5 is consistent with that from observations, in which a cooling trend dominates East Antarctica and West Antarctica, while a warming trend exists in the Antarctic Peninsula except during austral summer. … The trends in ERA reanalyses and observations are all negative in East Antarctica in all annual and seasons, and the fastest cooling trend appears in MAM, and the cooling rate of this season is more than 1 °C per decade. In West Antarctica, the ERA5 trends are similar to observation trends, whereas there is a difference between ERA5 trends and ERA-Interim in SON, as reflected in a warming trend in ERA-Interim while a cooling trend is observed in ERA5. ERA5 exhibits a significant cooling trend in annual data, MAM, and JJA, and the trends from ERA-Interim always fail to pass the significance test. It is also worth mentioning that the ERA5 shows a faster cooling rate than ERA-Interim and observations in West Antarctica. Over the Antarctic Peninsula, trends of annual and seasonal temperature means in ERA reanalyses and observations are not significant. ERA5 presents a warming trend with the exception of DJF, as is the case for ERA-Interim and station records.
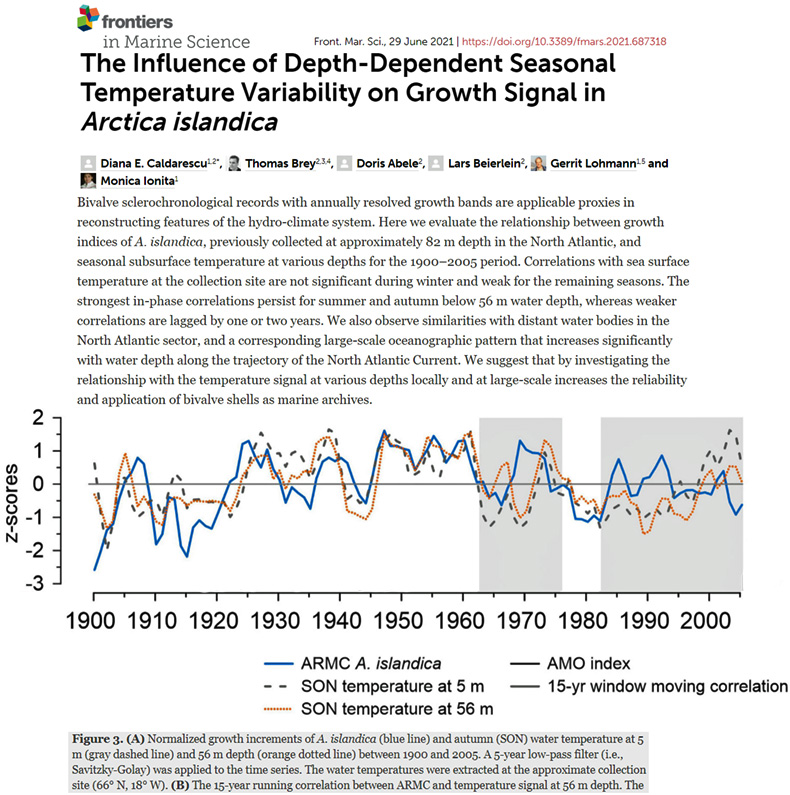
Caldarescu et al., 2021 Recent (1900-2005) North Atlantic non-warming
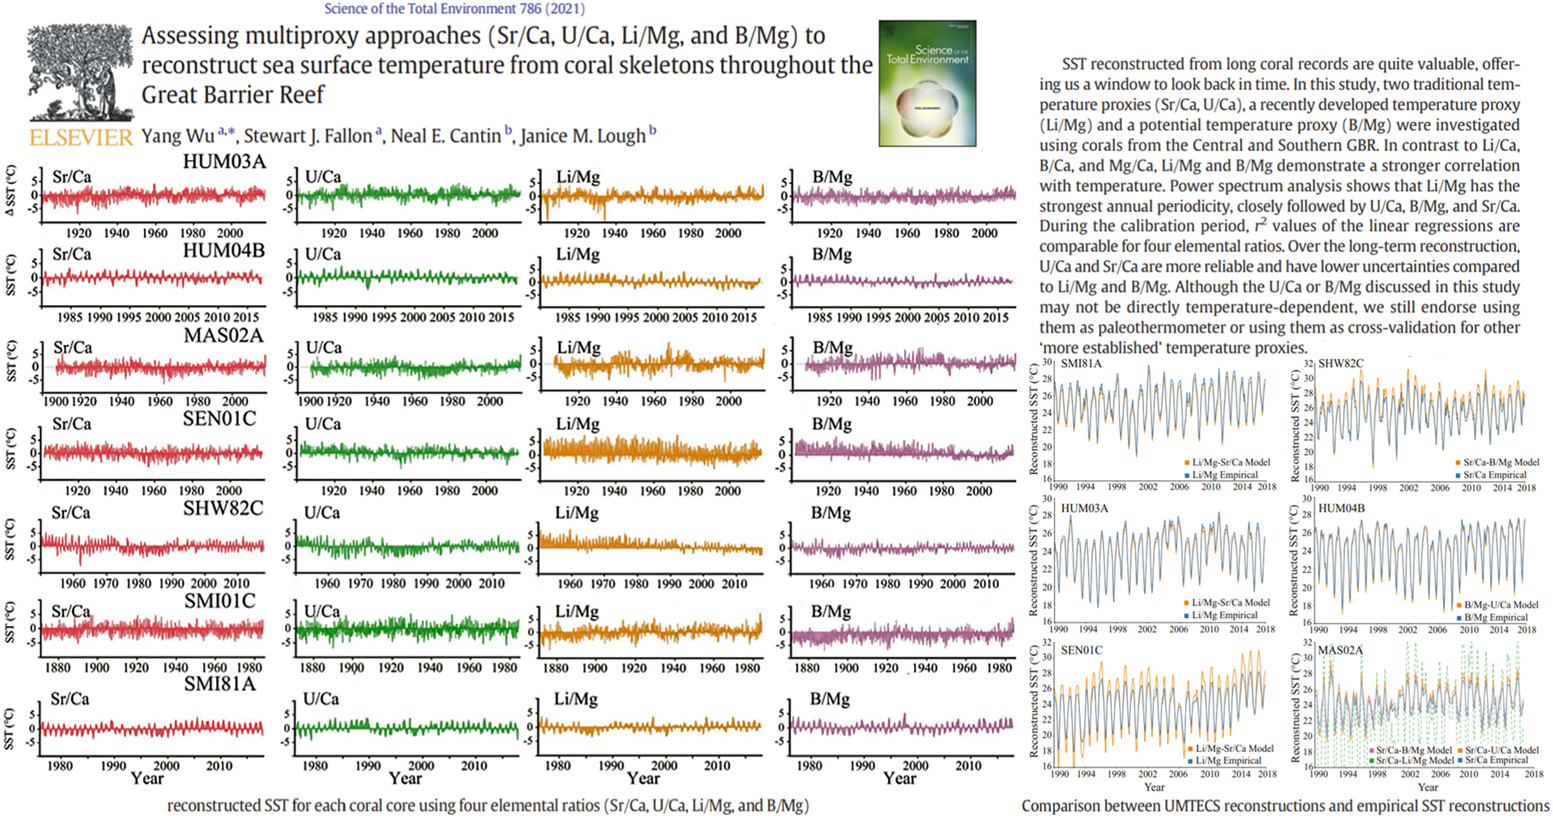
Wu et al., 2021 Recent (1900-) non-warming, Great Barrier Reef
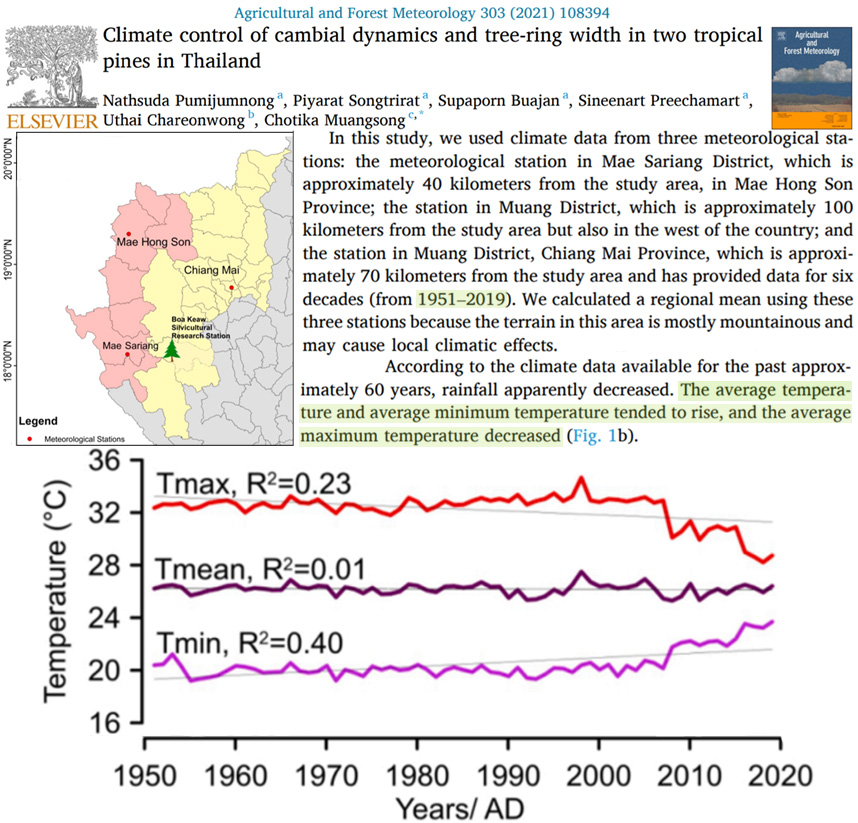
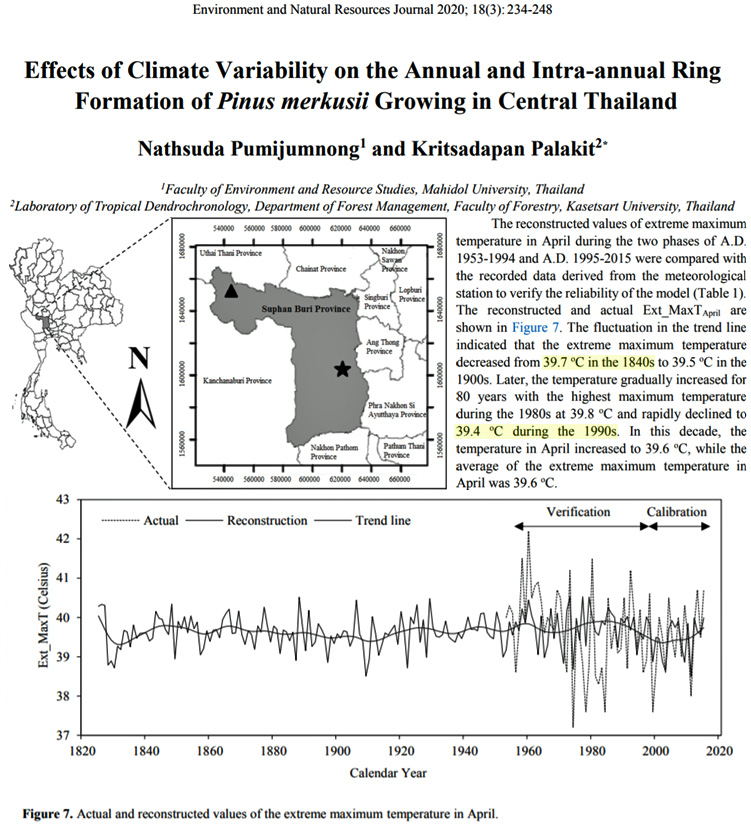
Pumijumnong et al., 2021 No net warming in Thailand since ~1960, “average maximum temperatures decreased”
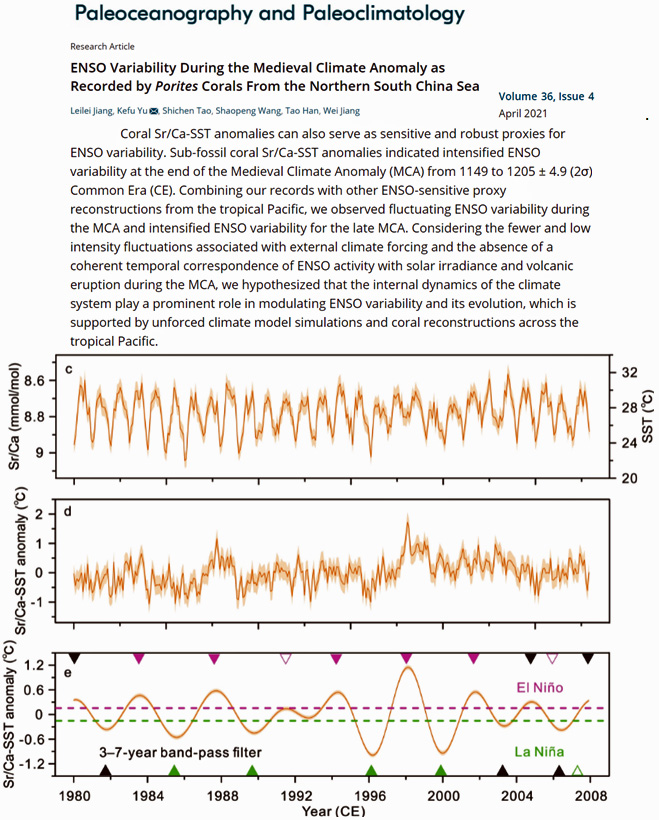
Jiang et al., 2021 No obvious net warming in Northern South China Sea since the 1980s
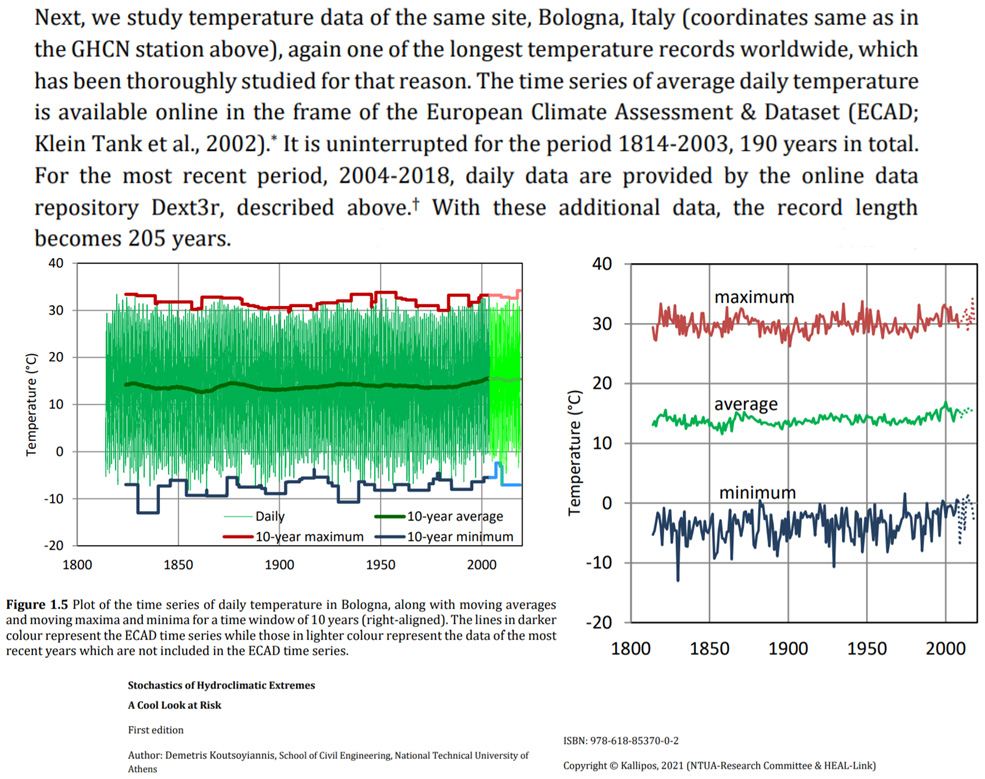
Koutsoyiannis, 2021 Bologna, Italy instrumental record 1814-2018 shows no net warming trend
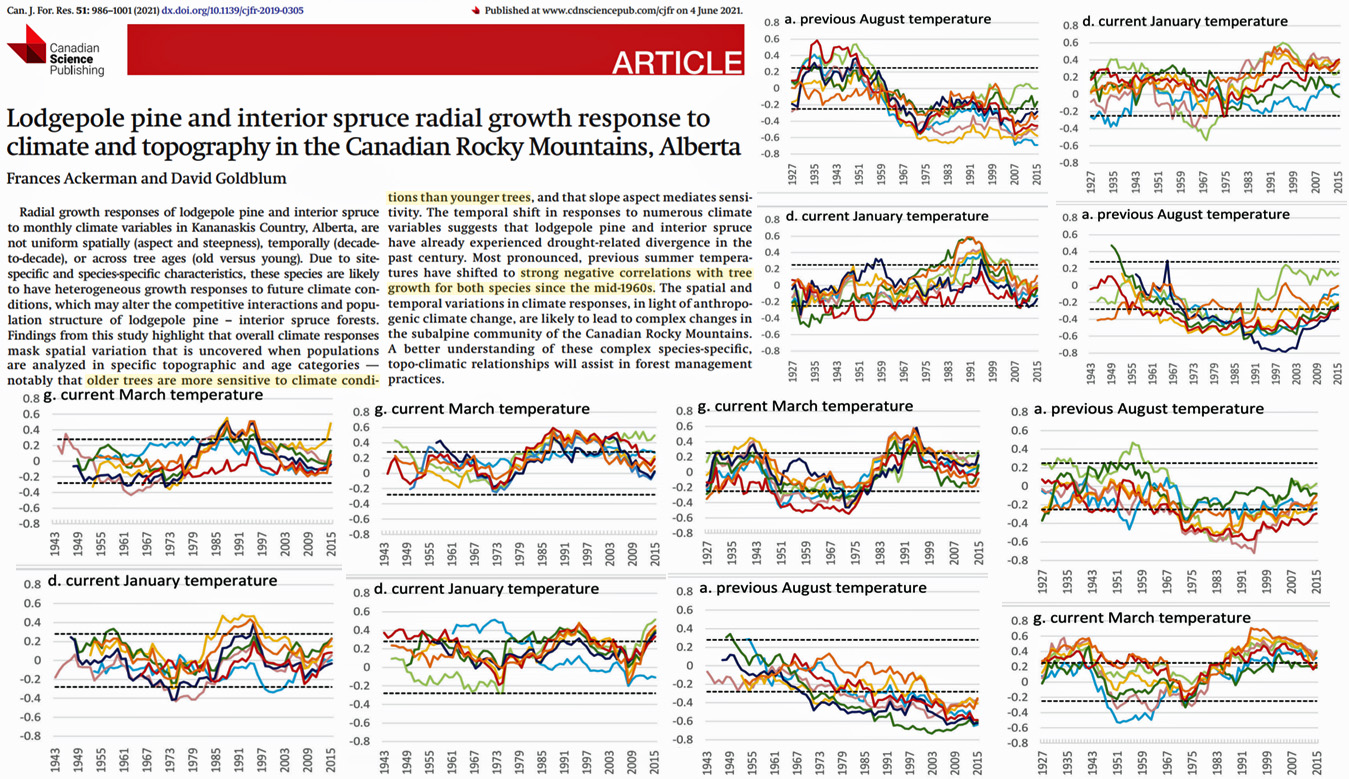
Ackerman and Goldblum, 2021 Canadian Rockies no net warming since early 20th century
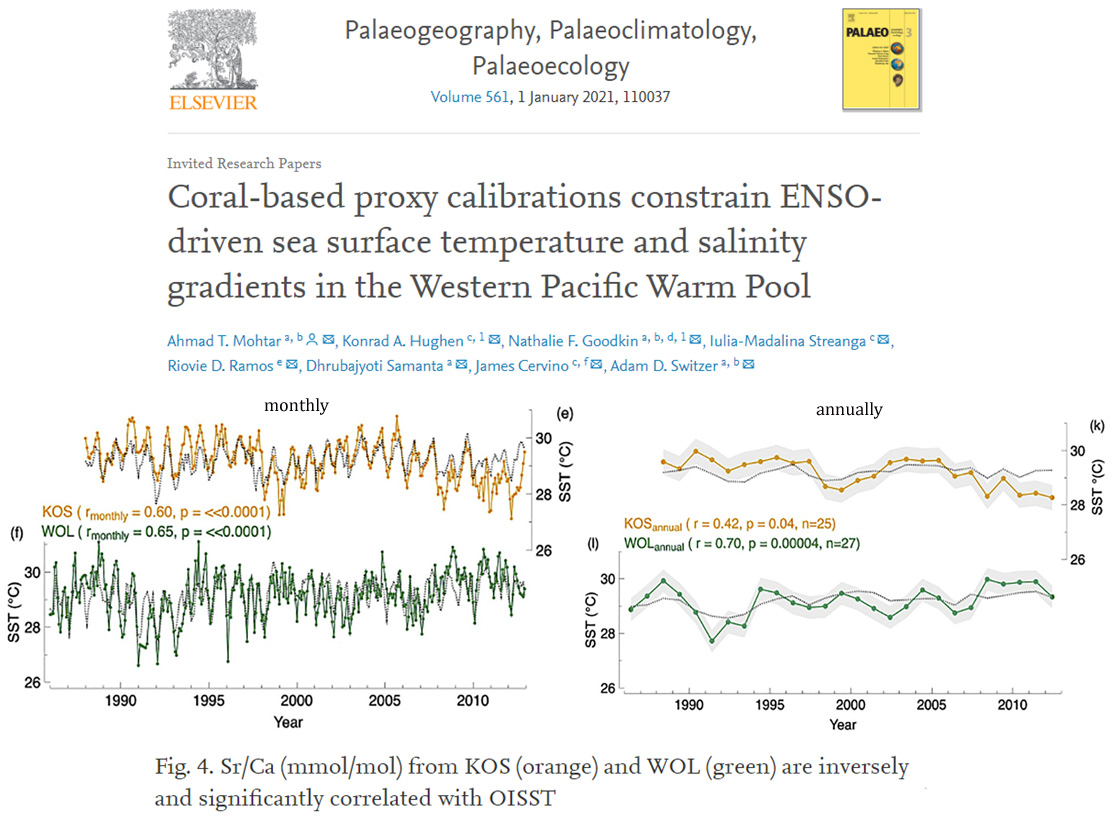
Mohtar et al., 2021 Tropical W. Pacific no net warming since 1980s
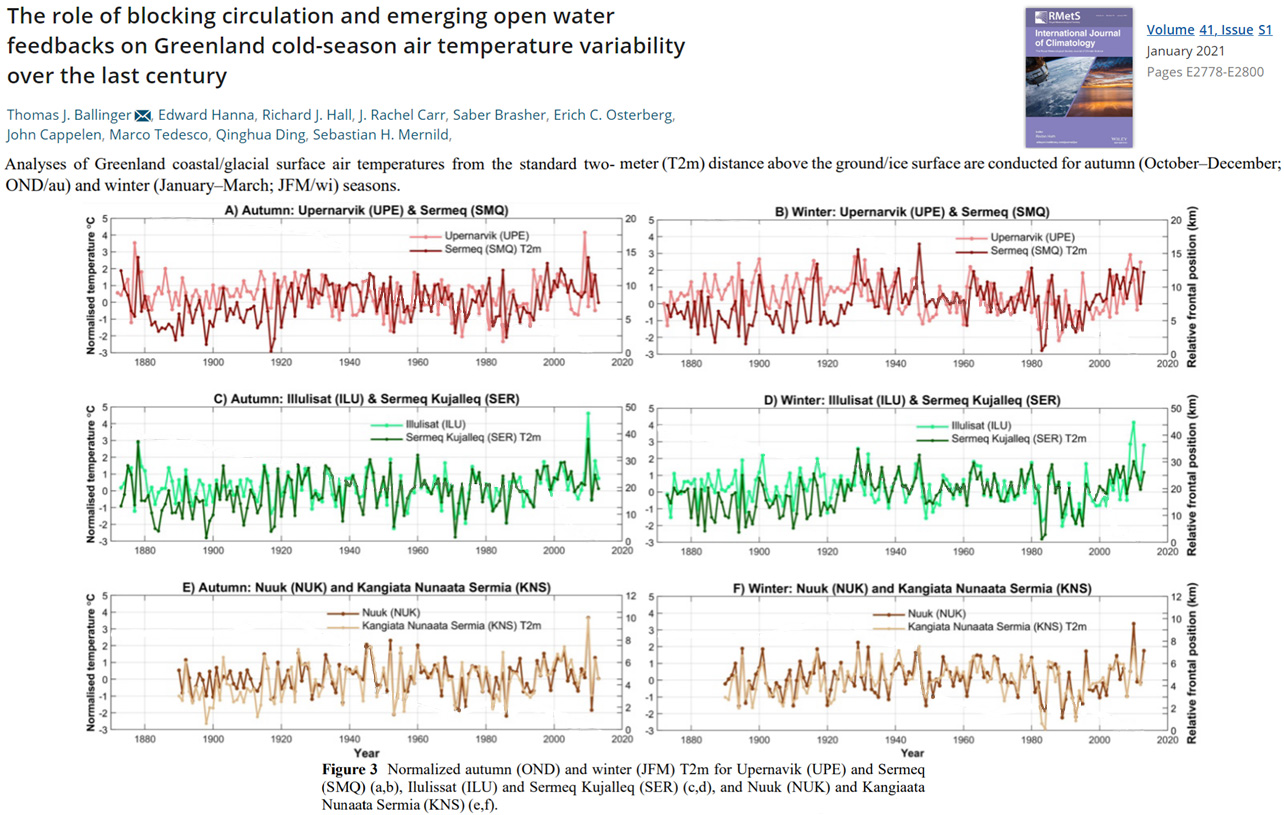
Ballinger et al., 2021 No net warming in Greenland since 1930s
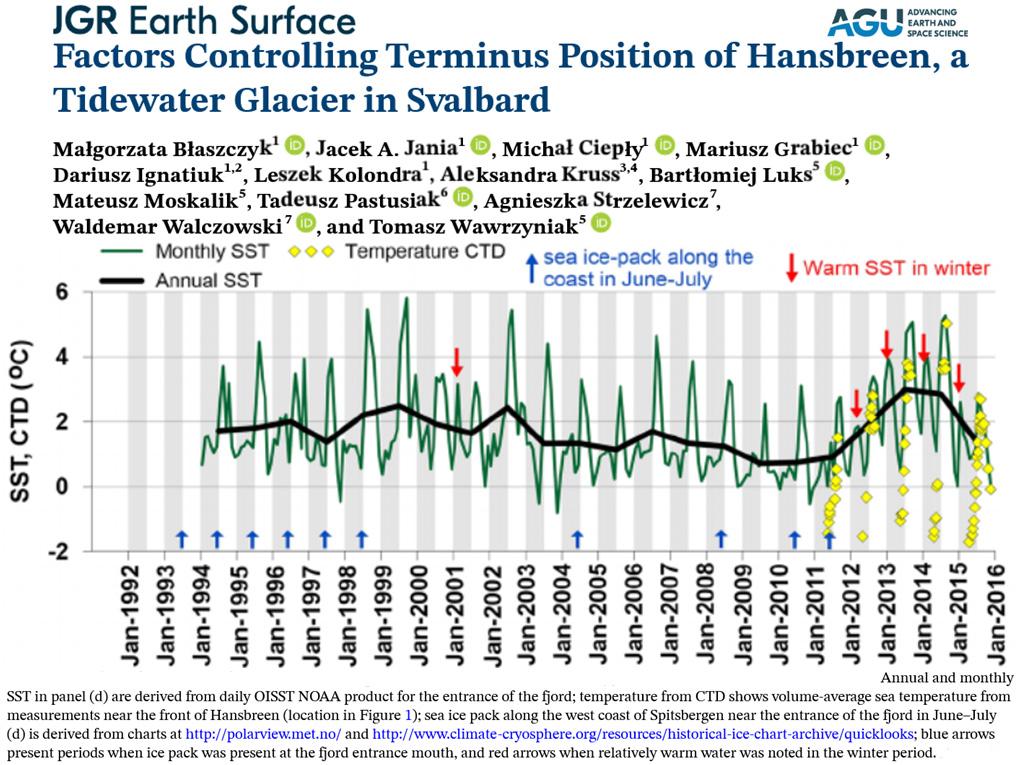
Blaszczyk et al., 2021 Svalbard has no obvious net warming since 1990s
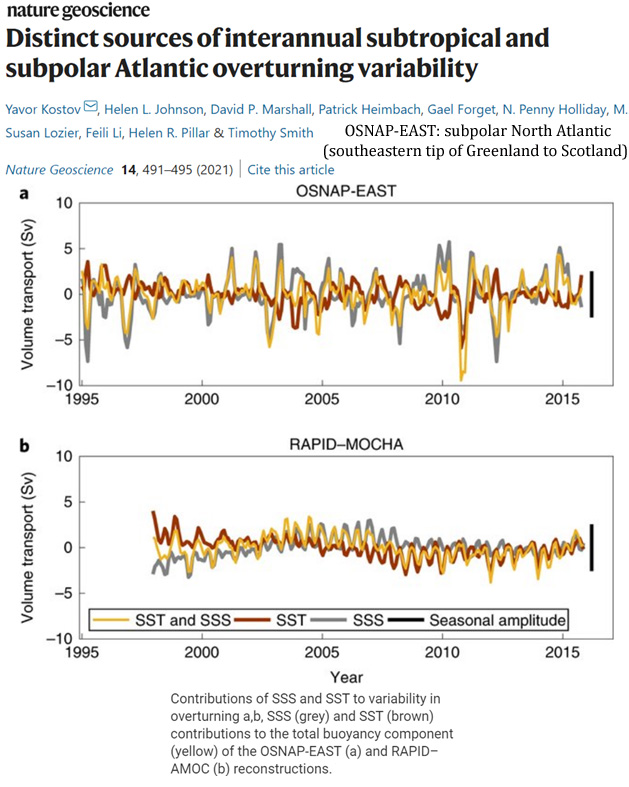
Kostov et al., 2021 Recent (1995-) non-warming, subpolar Atlantic
The Atlantic meridional overturning circulation (AMOC) is pivotal for regional and global climate due to its key role in the uptake and redistribution of heat and carbon. Establishing the causes of historical variability in AMOC strength on different timescales can tell us how the circulation may respond to natural and anthropogenic changes at the ocean surface. However, understanding observed AMOC variability is challenging because the circulation is influenced by multiple factors that co-vary and whose overlapping impacts persist for years. Here we reconstruct and unambiguously attribute intermonthly and interannual AMOC variability at two observational arrays to the recent history of surface wind stress, temperature and salinity.
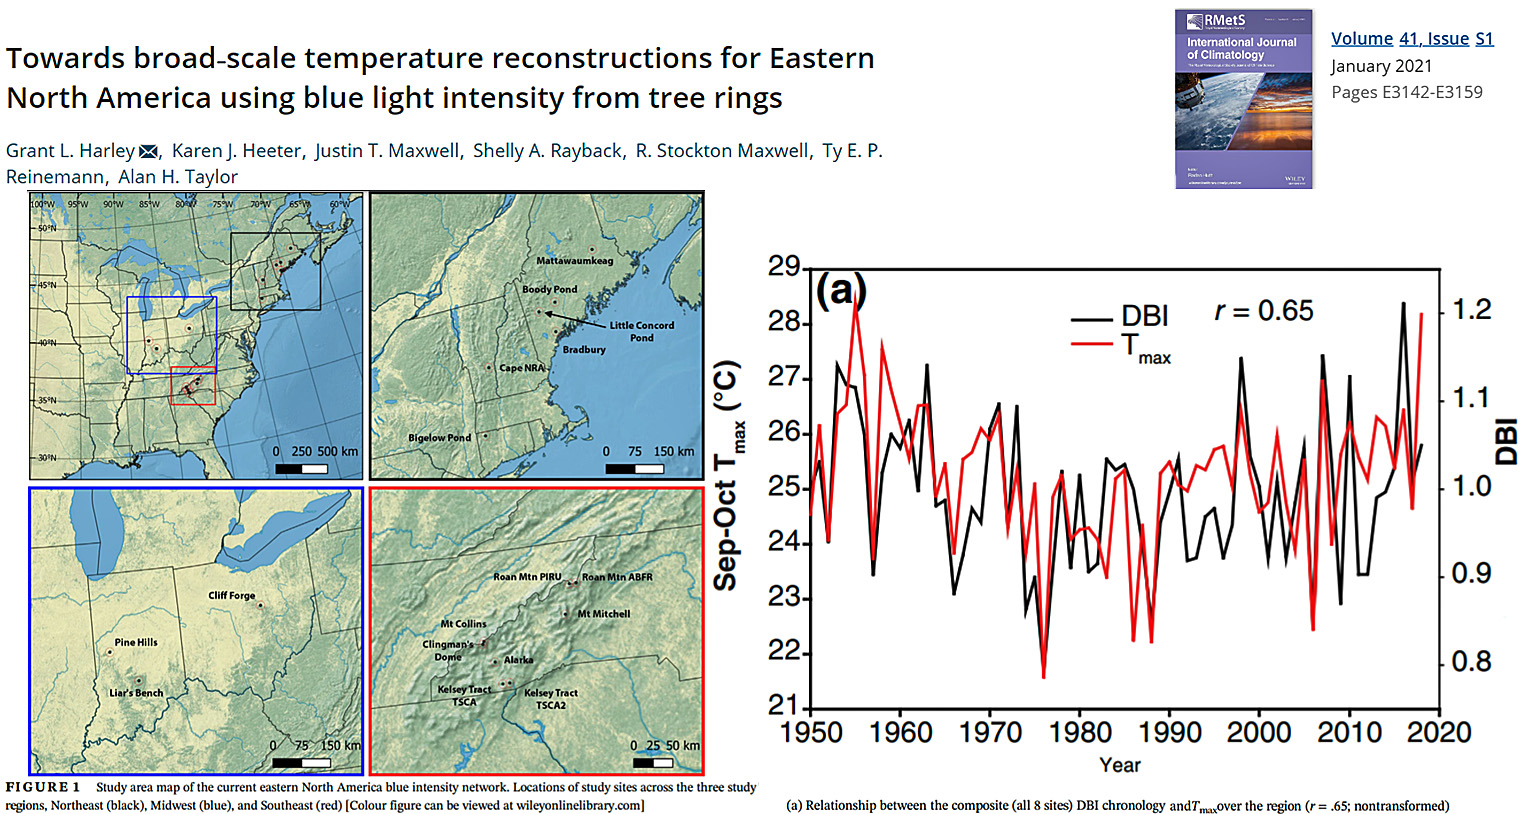
Harley et al., 2021 No net warming since 1950 in Eastern North America
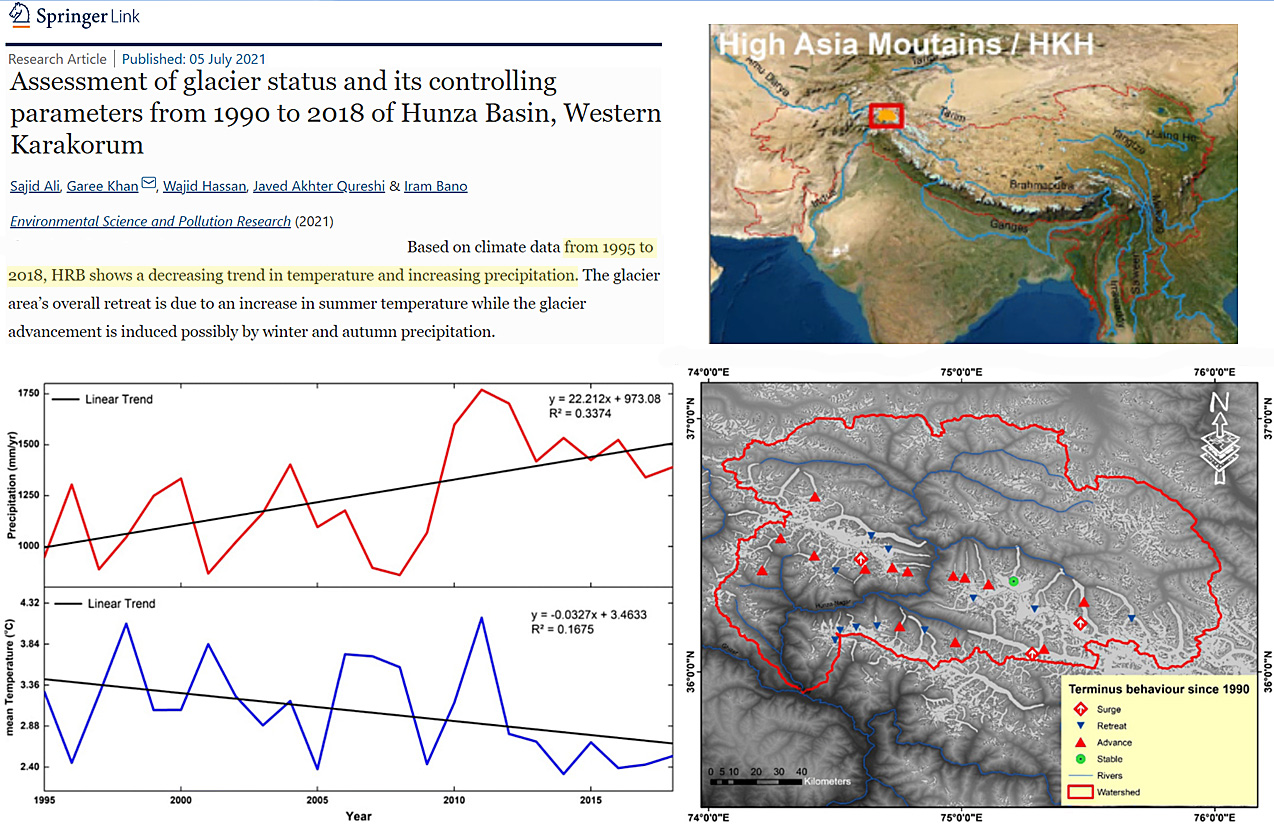
Ali et al., 2021 High Asia Mountains (Karakorum) “decreasing trend in temperature” 1995-2018
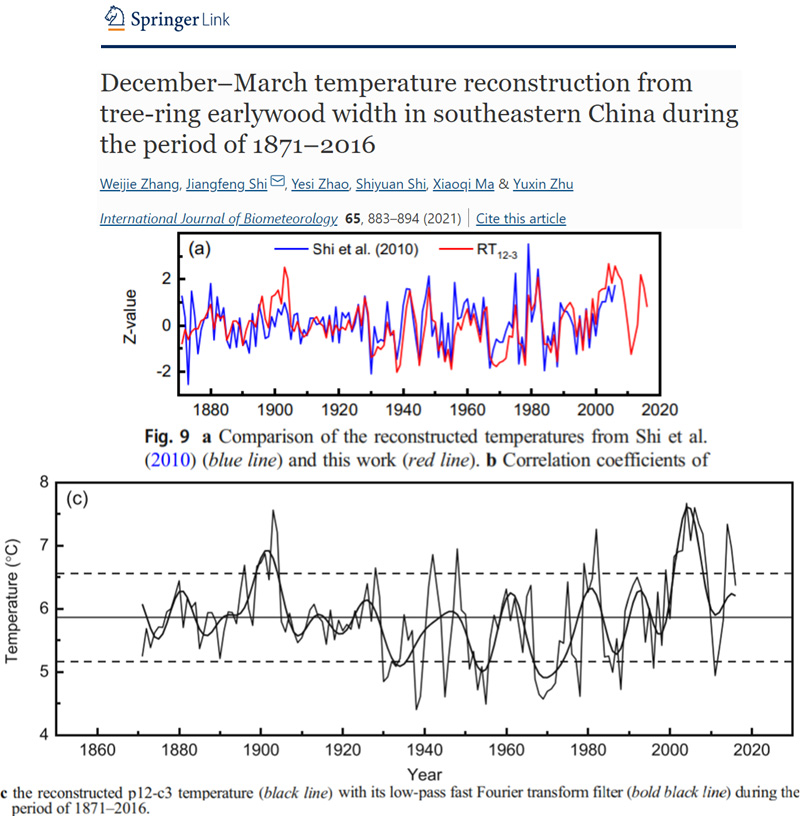
Zhang et al., 2021 Recent non-warming trend, SE China
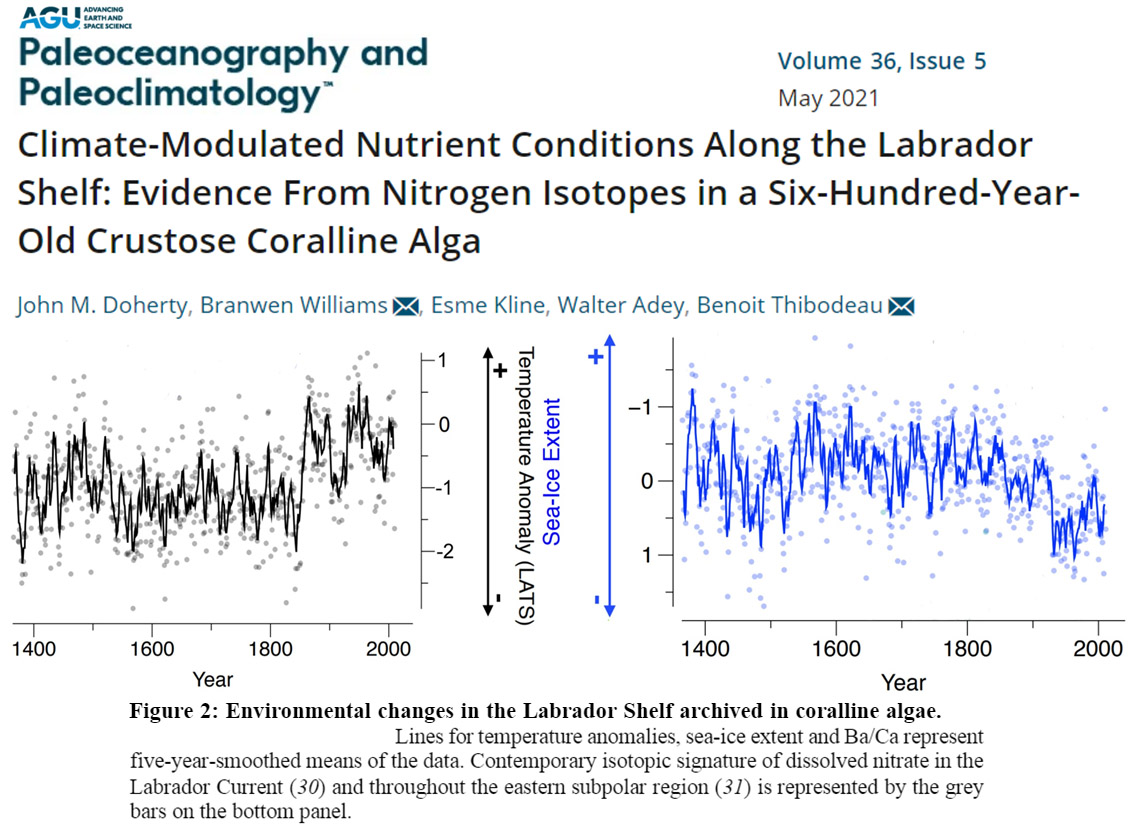
Doherty et al., 2021 Labrador Shelf sea surface temperatures and sea ice extent stable since 1950
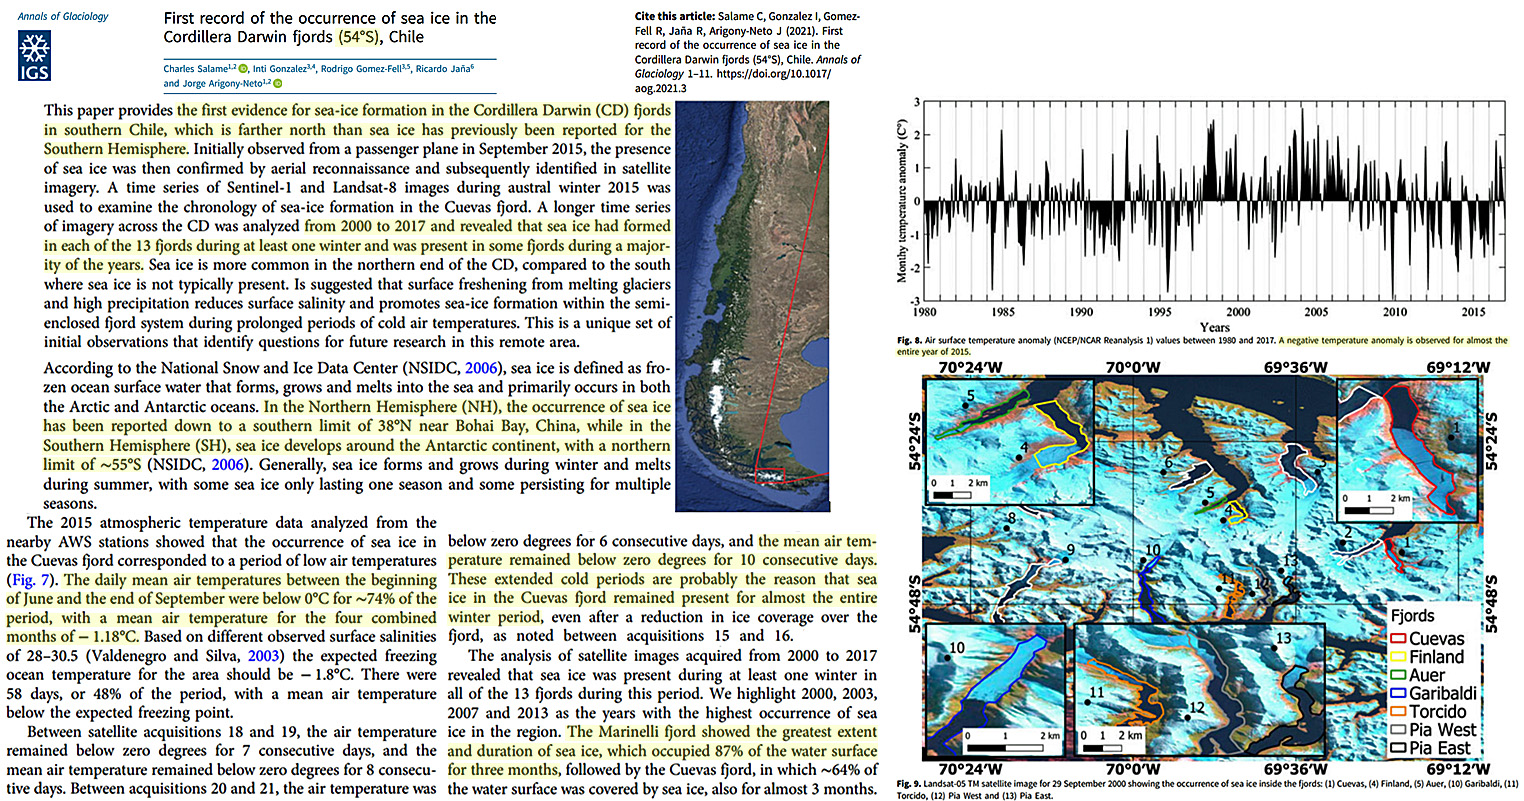
Salame et al., 2021 Southern Chile sea surface temperatures no net warming (and sea ice extent increasing) since 1980
This paper provides the first evidence for sea-ice formation in the Cordillera Darwin (CD) fjords in southern Chile, which is farther north than sea ice has previously been reported for the Southern Hemisphere. … A longer time series of imagery across the CD was analyzed from 2000 to 2017 and revealed that sea ice had formed in each of the 13 fjords during at least one winter and was present in some fjords during a majority of the years.
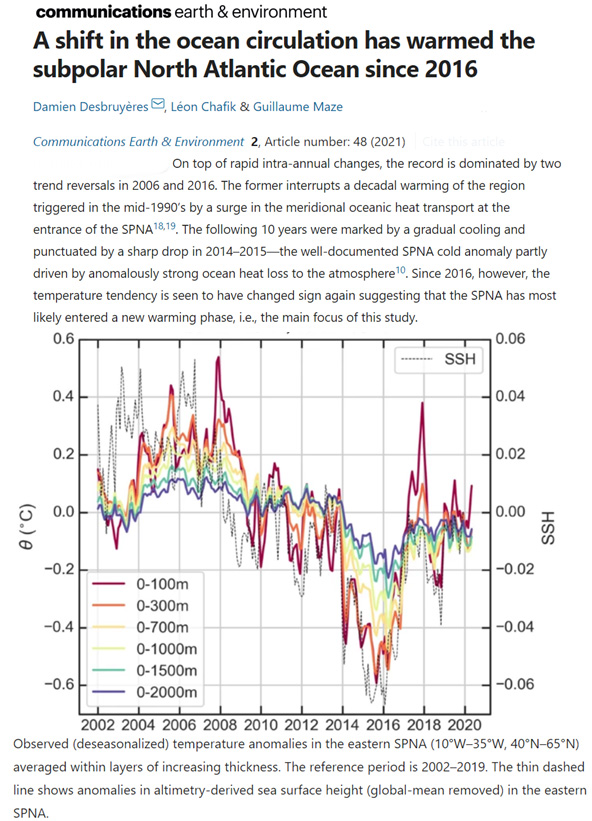
Desbruyères et al., 2021 Subpolar North Atlantic net cooling trend, 2002-2020
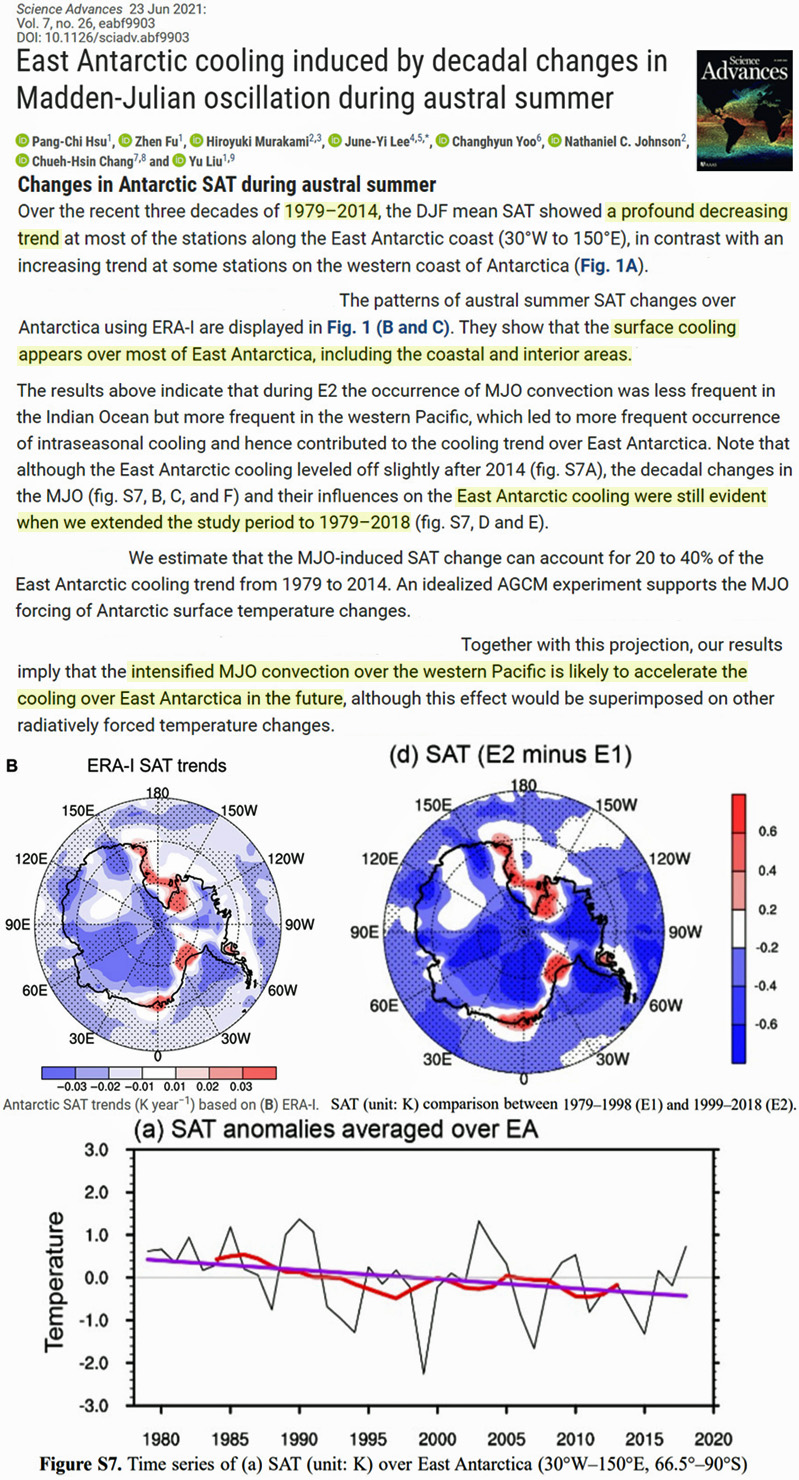
Hsu et al., 2021 East Antarctica “profound” cooling trend, 1979-2018
Over the recent three decades of 1979–2014, the DJF mean SAT showed a profound decreasing trend at most of the stations along the East Antarctic coast (30°W to 150°E), in contrast with an increasing trend at some stations on the western coast of Antarctica (Fig. 1A). … surface cooling appears over most of East Antarctica, including the coastal and interior areas. … East Antarctic cooling was still evident when we extended the study period to 2018.
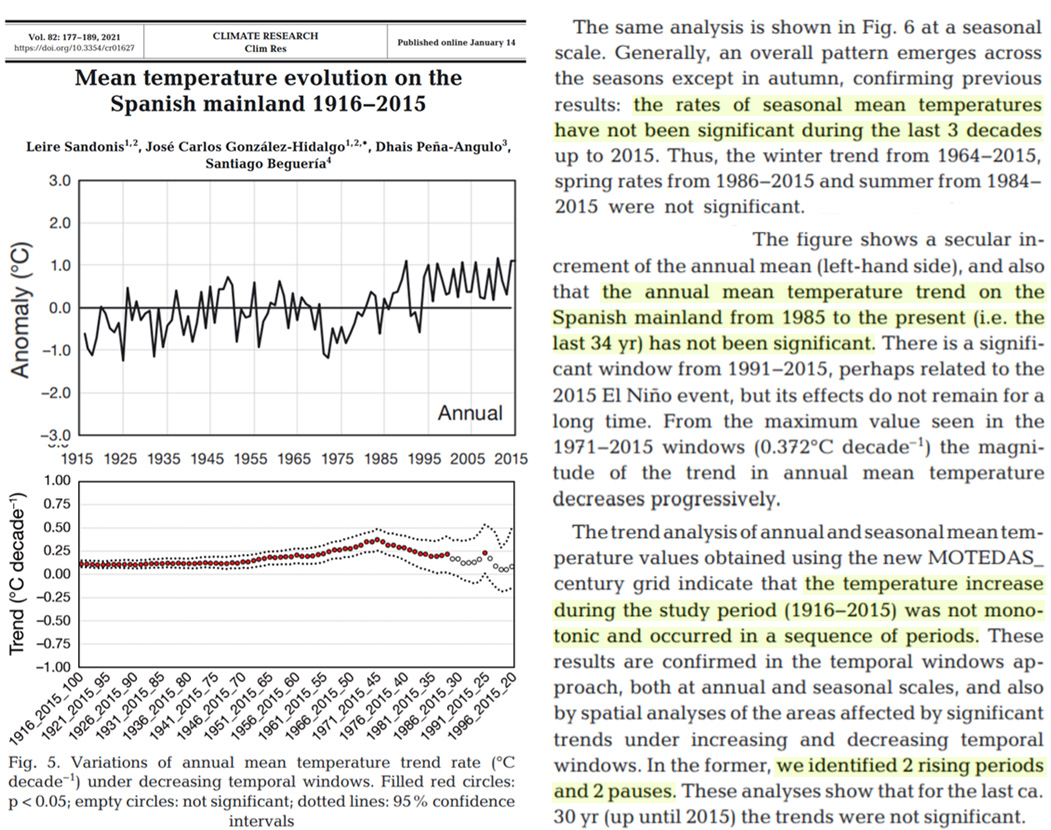
Sandonis et al., 2021 Temperature change rates “have not been significant during the last 3 decades” in Spanish mainland
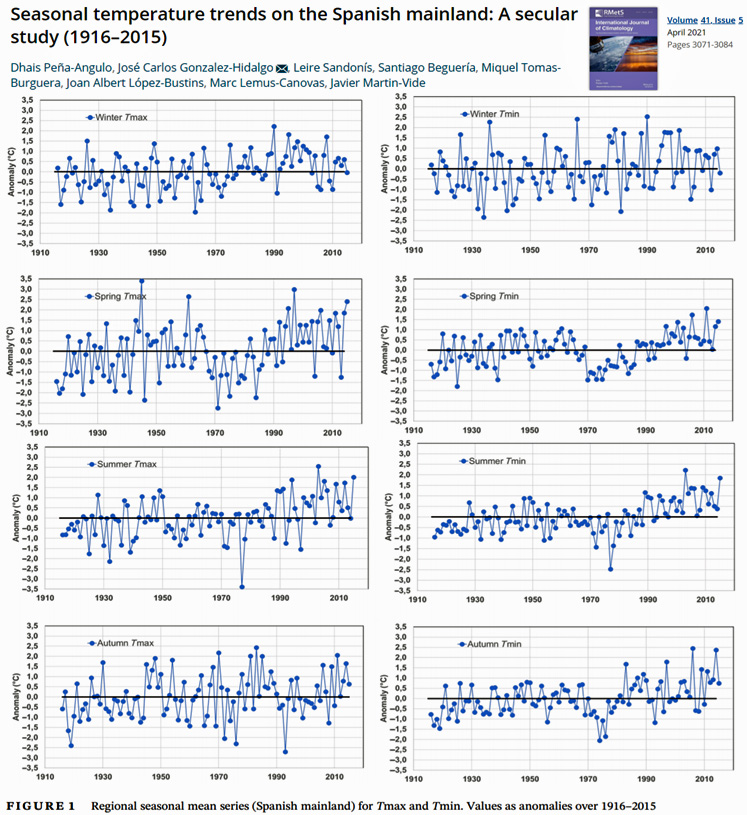
The trend analysis of annual and seasonal mean temperature values obtained using the new MOTEDAS_century grid indicate that the temperature increase during the study period (1916−2015) was not monotonic and occurred in a sequence of periods. These results are confirmed in the temporal windows approach, both at annual and seasonal scales, and also by spatial analyses of the areas affected by significant trends under increasing and decreasing temporal windows. In the former, we identified 2 rising periods and 2 pauses. These analyses show that for the last ca. 30 yr (up until 2015) the trends were not significant. … The same analysis is shown in Fig. 6 at a seasonal scale. Generally, an overall pattern emerges across the seasons except in autumn, confirming previous results: the rates of seasonal mean temperatures have not been significant during the last 3 decades up to 2015. Thus, the winter trend from 1964−2015, spring rates from 1986−2015 and summer from 1984− 2015 were not significant. The data for autumn is highly irregular, and shows a brief rise in recent decades, but has not been significant since the 1970s
Peña-Angulo et al., 2021 Recent (1916-) non-warming (or modest warming) in Spanish mainland
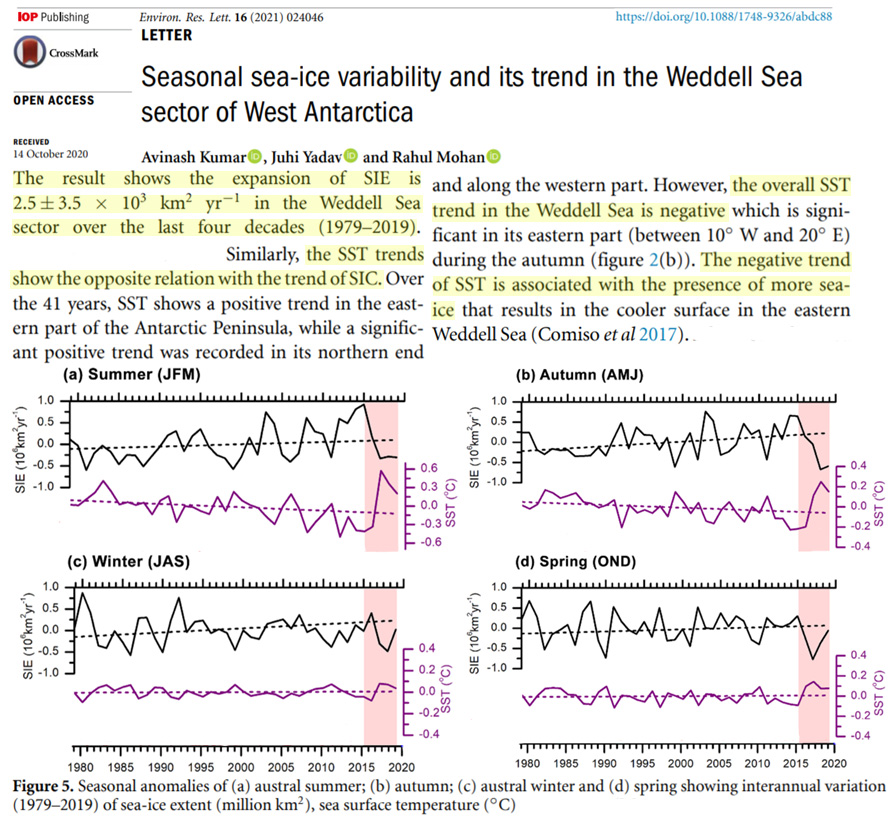
Kumar et al., 2021 Cooling trend in the Weddell Sea (1979-2019), W. Antarctica
The result shows the expansion of SIE [sea ice extent] … in the Weddell Sea sector over the last four decades (1979-2019). … The overall SST trend in the Weddell Sea is negative
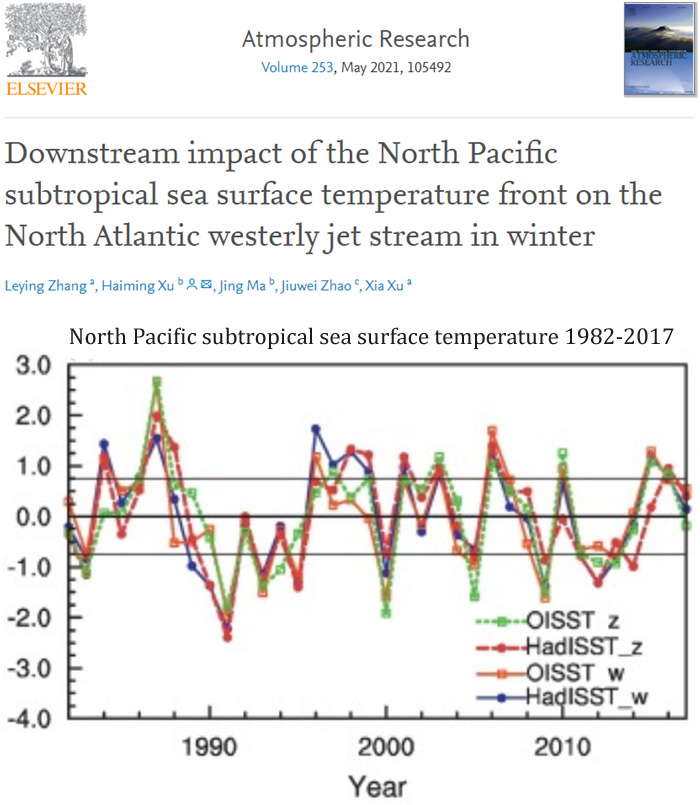
Zhang et al., 2021 Recent (1982-2017) non-warming, subtropical North Pacific
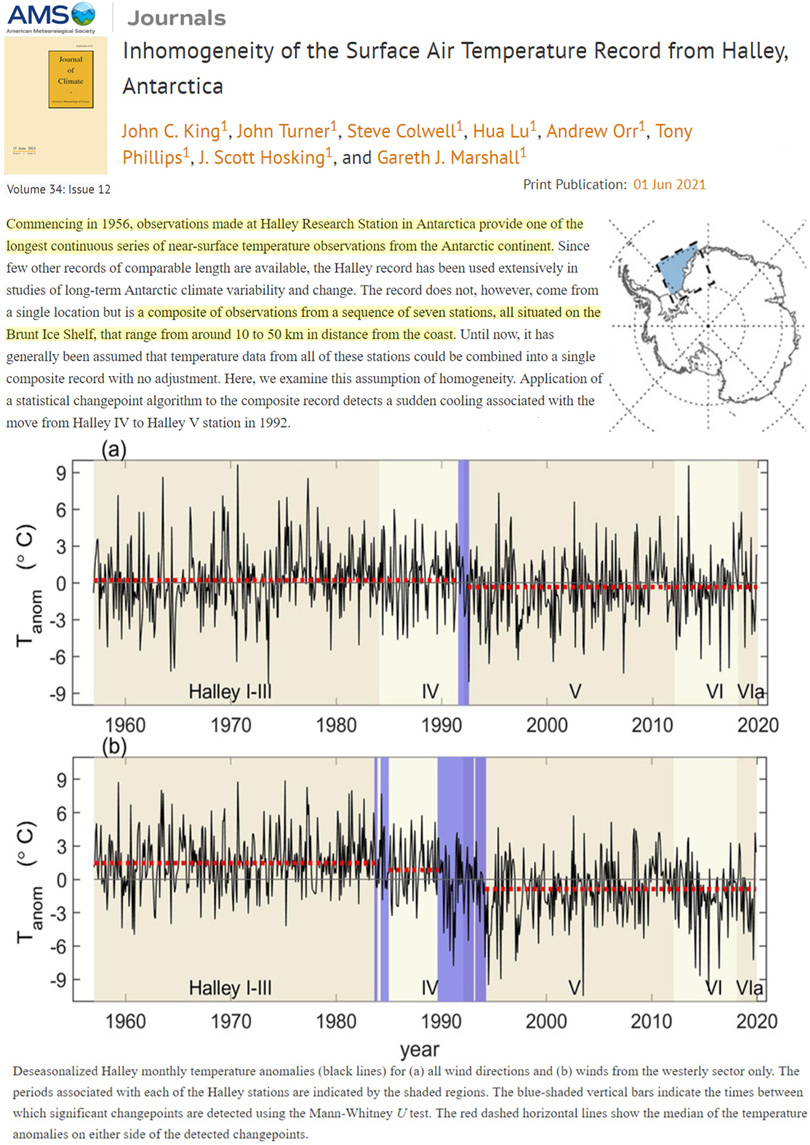
King et al., 2021 Antarctica instrumental record shows surface air temperature cooling since 1956
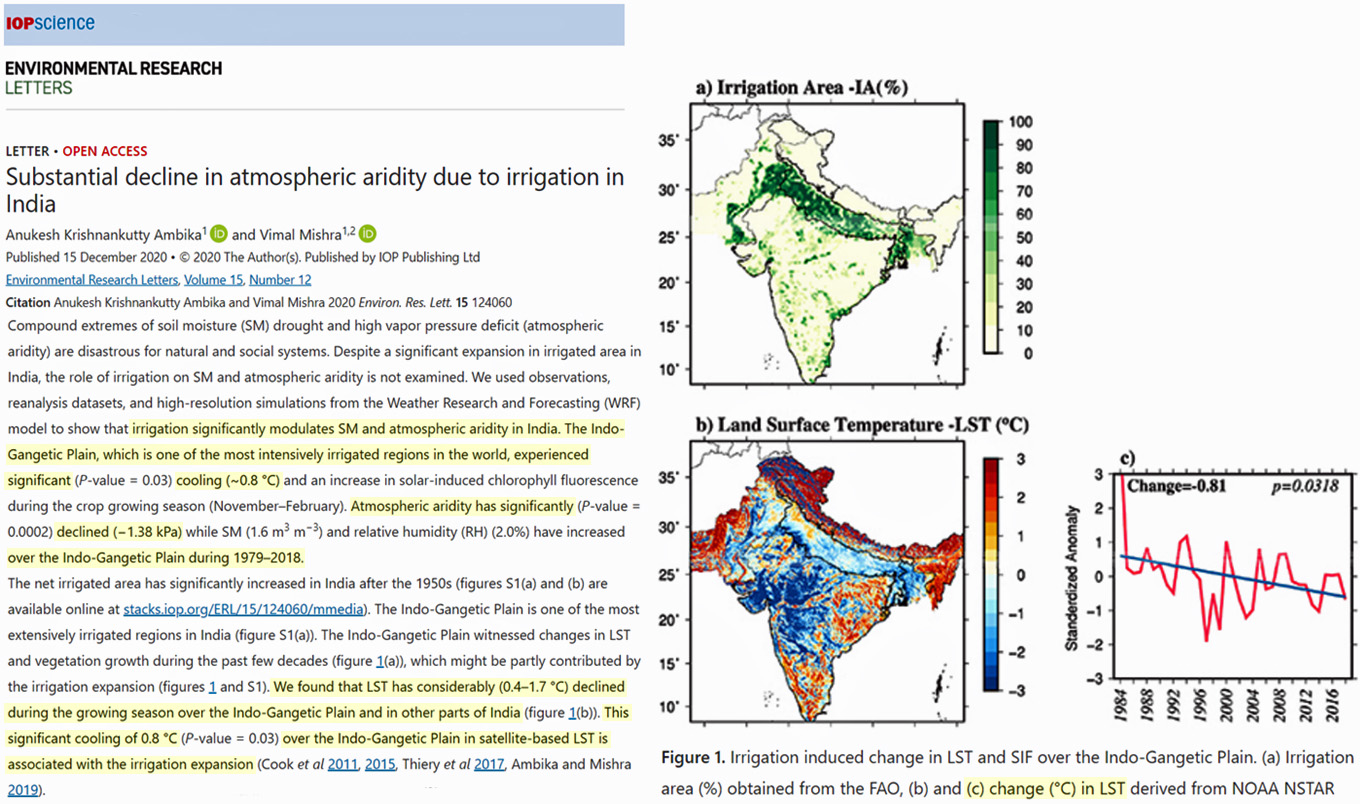
Krishnankutty Ambika and Mishra 2021 Northern India cooling -0.8°C 1979-2018 (due to water vapor/irrigation)
The Indo-Gangetic Plain, which is one of the most intensively irrigated regions in the world, experienced significant (P-value = 0.03) cooling (~0.8 °C)…during 1979–2018. … We found that LST has considerably (0.4–1.7 °C) declined during the growing season over the Indo-Gangetic Plain and in other parts of India (figure 1(b)). This significant cooling of 0.8 °C (P-value = 0.03) over the Indo-Gangetic Plain in satellite-based LST is associated with the irrigation expansion (Cook et al 2011, 2015, Thiery et al 2017, Ambika and Mishra 2019).
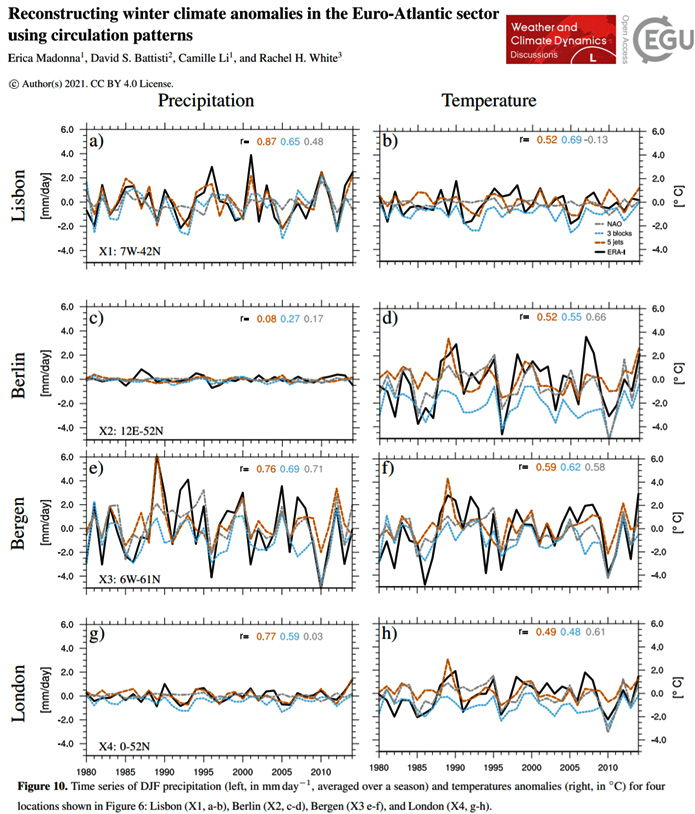
Madonna et al., 2021 Recent (1980-) cooling/non-warming in Lisbon, Berlin, Bergen, London
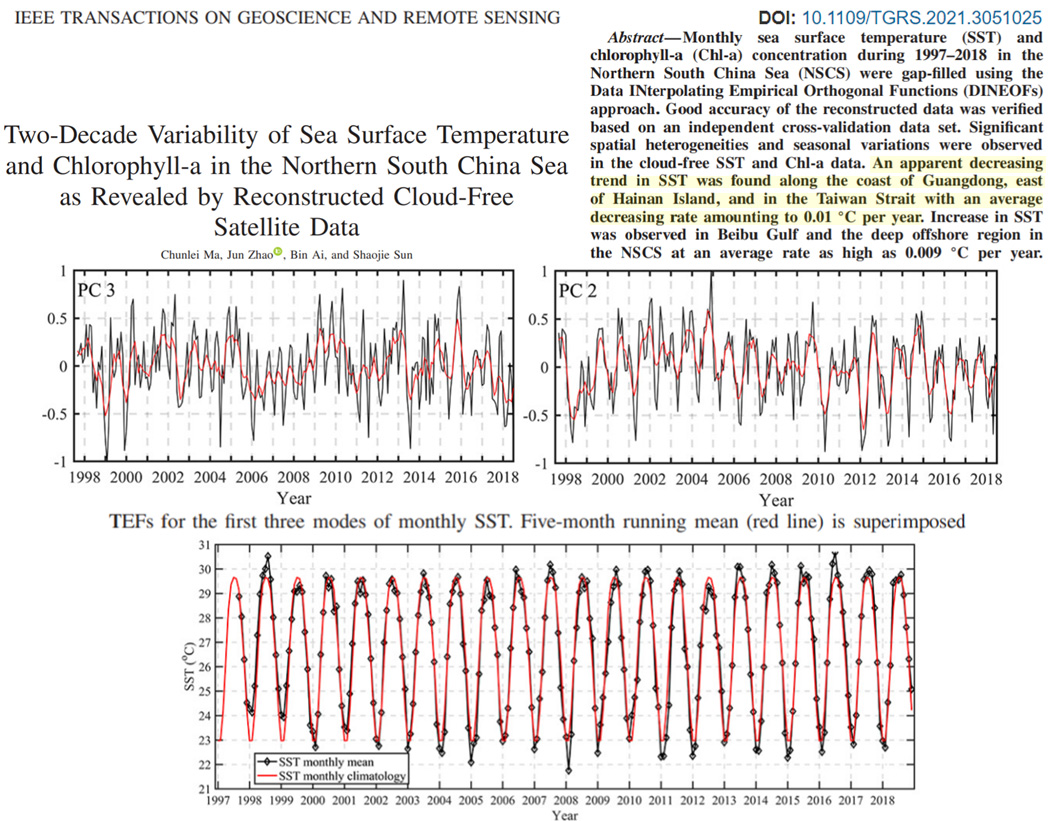
Ma et al., 2021 Recent (1997-) cooling (0.1°C per decade) in the South China Sea
Monthly sea surface temperature (SST) and chlorophyll-a (Chl-a) concentration during 1997-2018 in the Northern South China Sea (NSCS) were gap-filled using the Data INterpolating Empirical Orthogonal Functions (DINEOFs) approach. Good accuracy of the reconstructed data was verified based on an independent cross-validation data set. Significant spatial heterogeneities and seasonal variations were observed in the cloud-free SST and Chl-a data. An apparent decreasing trend in SST was found along the coast of Guangdong, east of Hainan Island, and in the Taiwan Strait with an average decreasing rate amounting to 0.01 °C per year. Increase in SST was observed in Beibu Gulf and the deep offshore region in the NSCS at an average rate as high as 0.009 °C per year.

Recent Decades/Centuries Cooling/Non-Warming
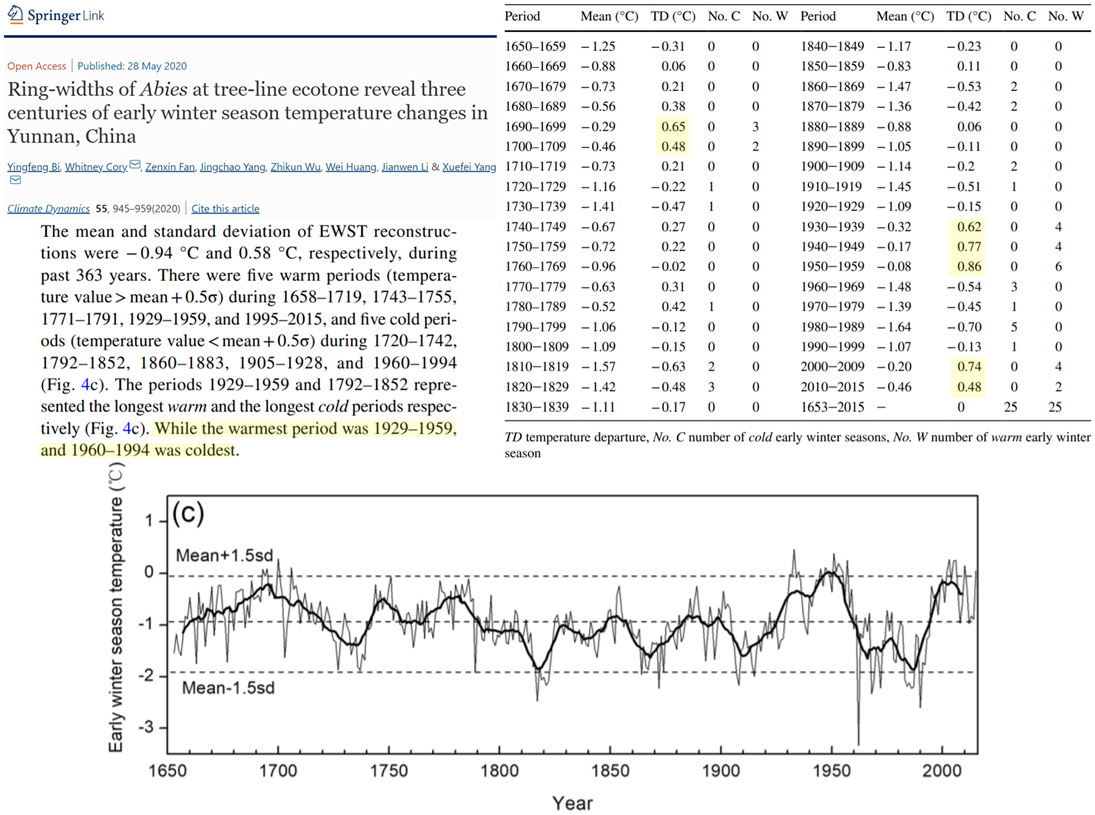
Yingfeng et al., 2020 SW China, 1960-1994 coldest of last 400 years, 2010-2015 same temps as 1700-1709
“The mean and standard deviation of EWST reconstructions were − 0.94 °C and 0.58 °C, respectively, during past 363 years. There were five warm periods (temperature value>mean+0.5σ) during 1658–1719, 1743–1755, 1771–1791, 1929–1959, and 1995–2015, and five cold periods (temperature value<mean+0.5σ) during 1720–1742, 1792–1852, 1860–1883, 1905–1928, and 1960–1994. The periods 1929–1959 and 1792–1852 represented the longest warm and the longest cold periods respectively (Fig. 4c). While the warmest period was 1929–1959, and 1960–1994 was coldest.”
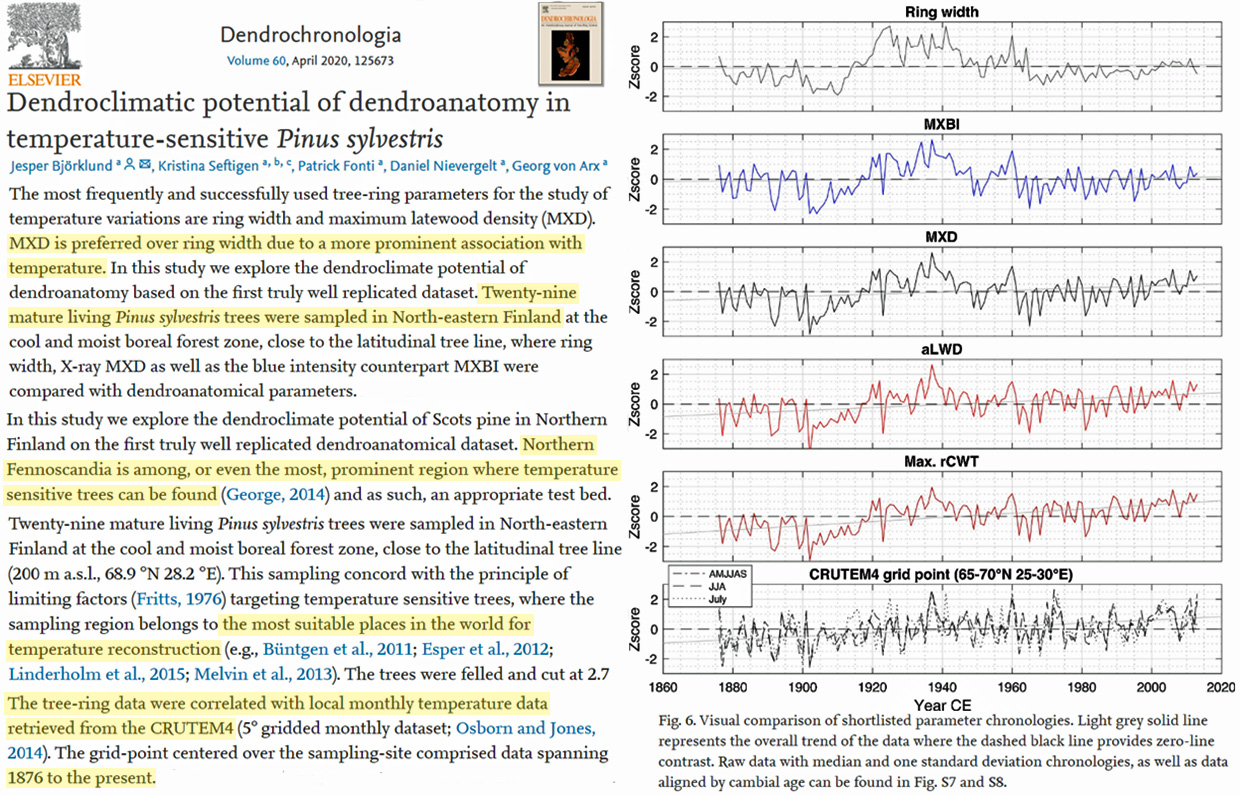
Björklund et al., 2020 Finland temps warmer than recent decades in the 1930-’40s
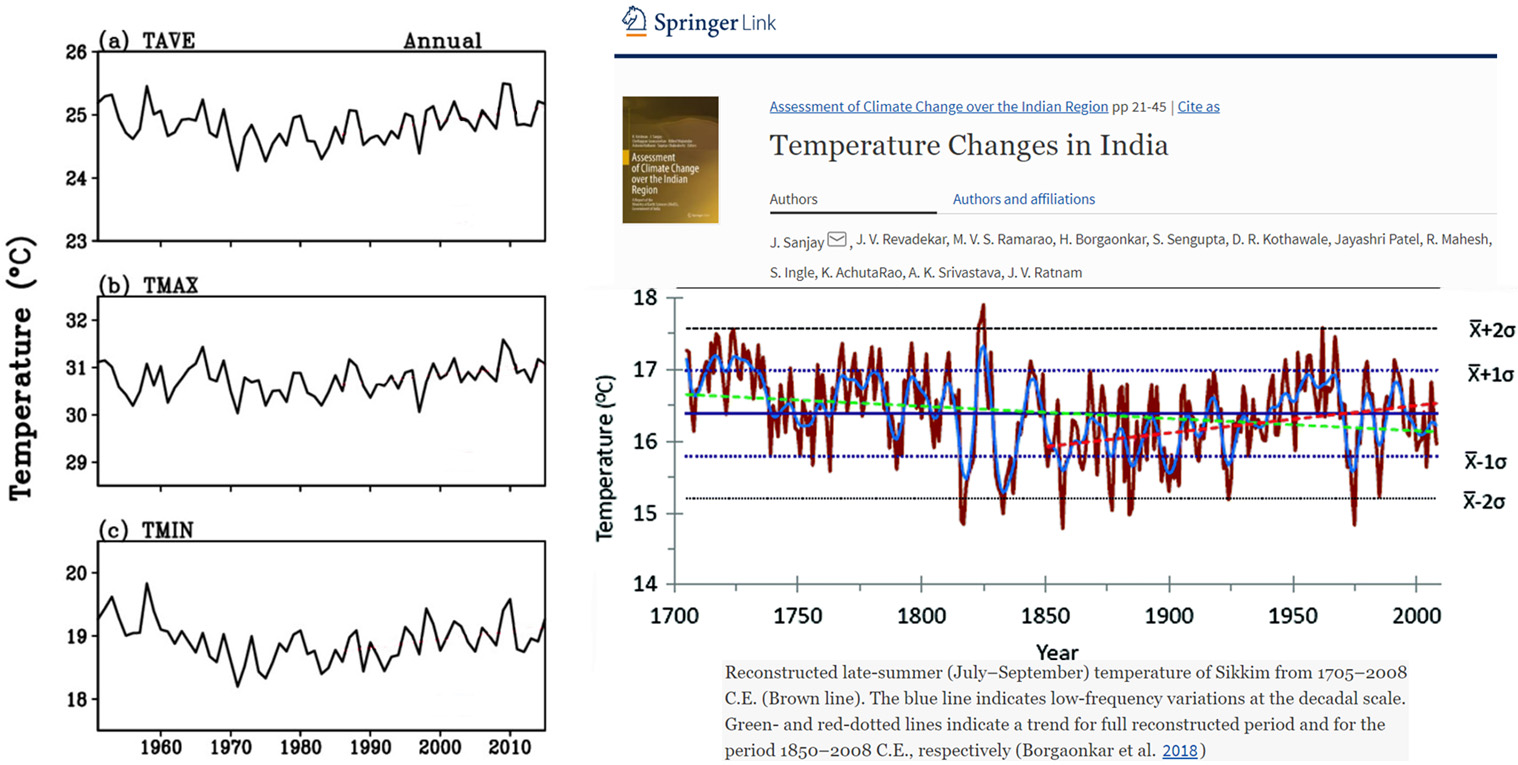
Sanjay et al., 2020 India warmer in the 1700s
Pumijumnong and Palakit, 2020 Thailand warmer in the 1840s than 1990s
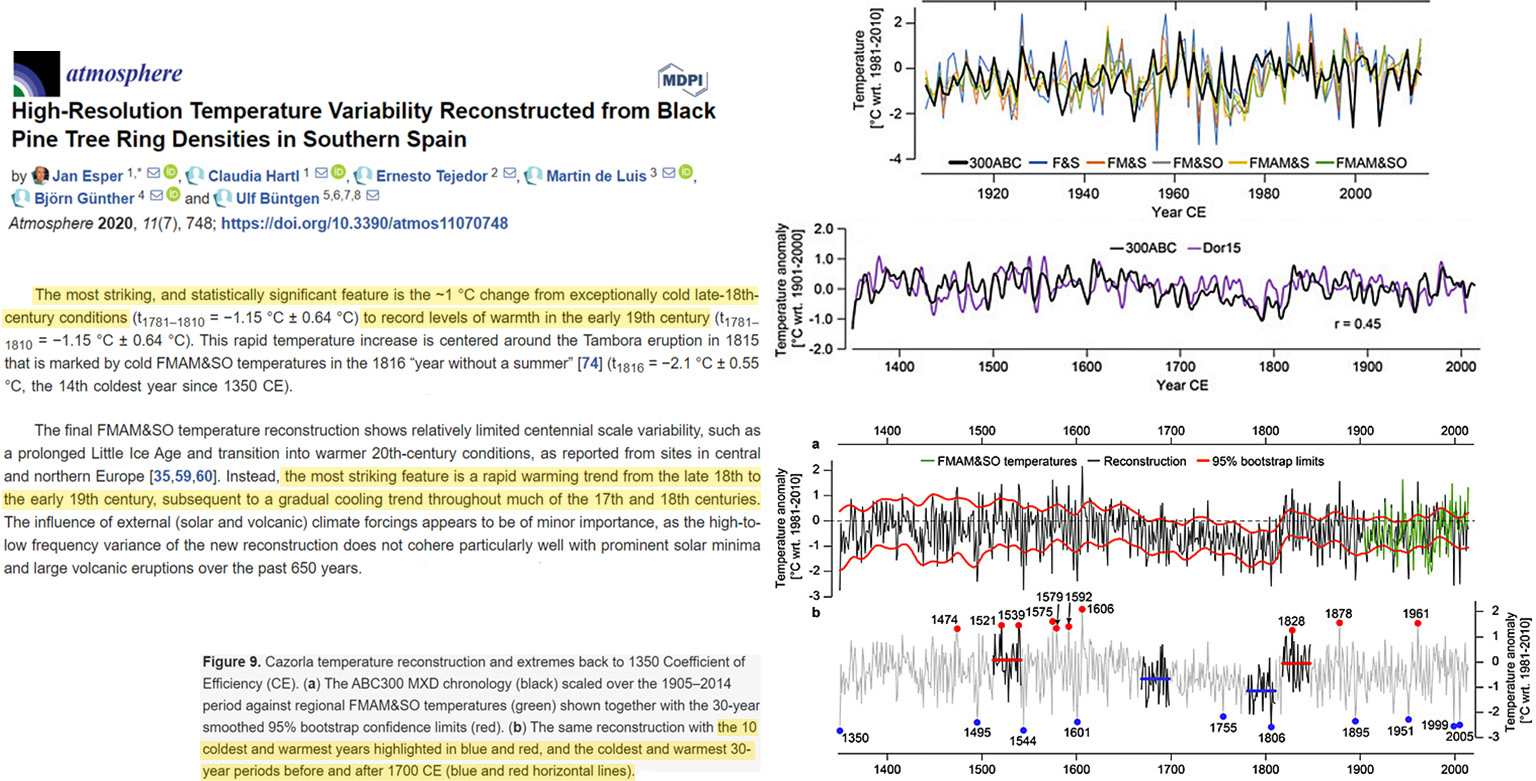
Esper et al., 2020 Spain warmer in 1600s, warmed 1°C from late 1700s to early 1800s
“The most striking, and statistically significant feature is the ~1 °C change from exceptionally cold late-18th-century conditions to record levels of warmth in the early 19th century. This rapid temperature increase is centered around the Tambora eruption in 1815 that is marked by cold FMAM&SO temperatures in the 1816 “year without a summer” [74] (t1816 = −2.1 °C ± 0.55 °C, the 14th coldest year since 1350 CE).”
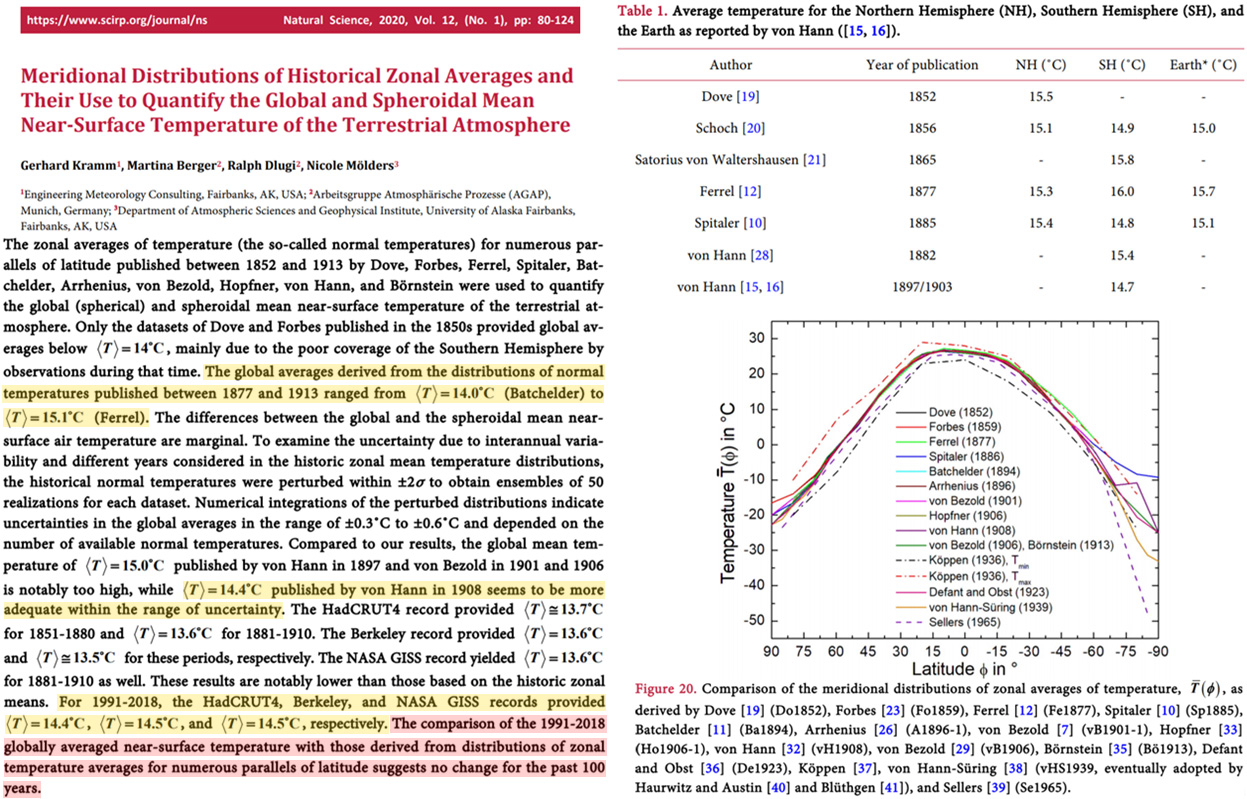
Kramm et al., 2020 Global temperature calculation the same today (14.5°C) as late 1800s
“…the results derived from the historical data suggest no change in the globally averaged near-surface temperature over the past 100 years.”
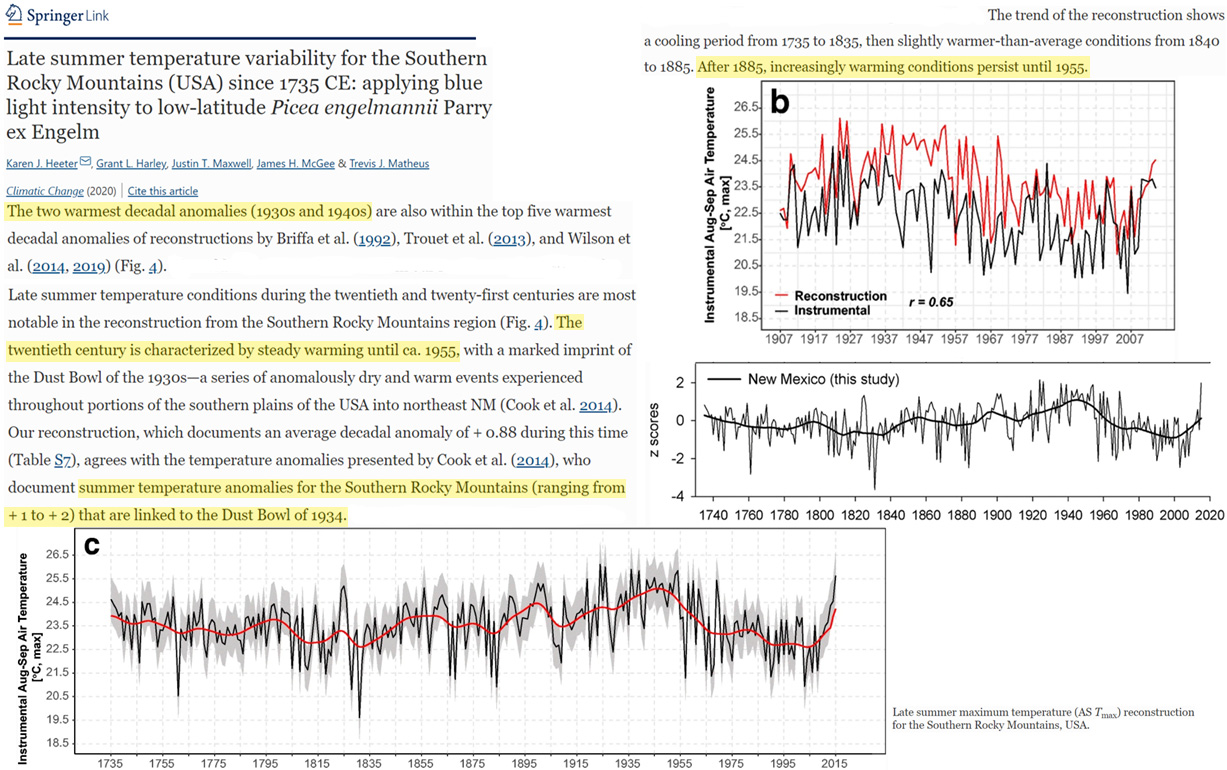
Heeter et al., 2020 Southern Rockies (USA) “After 1955, a cooling trend occurs for the next ca. 50 years”
“The two warmest decadal anomalies (1930s and 1940s) are also within the top five warmest decadal anomalies of reconstructions by Briffa et al. (1992), Trouet et al. (2013), and Wilson et al. (2014, 2019) … Late summer temperature conditions during the twentieth and twenty-first centuries are most notable in the reconstruction from the Southern Rocky Mountains region (Fig. 4). The twentieth century is characterized by steady warming until ca. 1955, with a marked imprint of the Dust Bowl of the 1930s—a series of anomalously dry and warm events experienced throughout portions of the southern plains of the USA into northeast NM (Cook et al. 2014). Our reconstruction, which documents an average decadal anomaly of + 0.88 during this time (Table S7), agrees with the temperature anomalies presented by Cook et al. (2014), who document summer temperature anomalies for the Southern Rocky Mountains (ranging from + 1 to + 2) that are linked to the Dust Bowl of 1934. The period of prolonged warming in the 1930s through the 1950s is consistent with other reconstructions in other areas of North America (Briffa et al. 1992; Trouet et al. 2013; Wiles et al. 2019). … After 1955, a cooling trend occurs for the next ca. 50 years until 2000.”
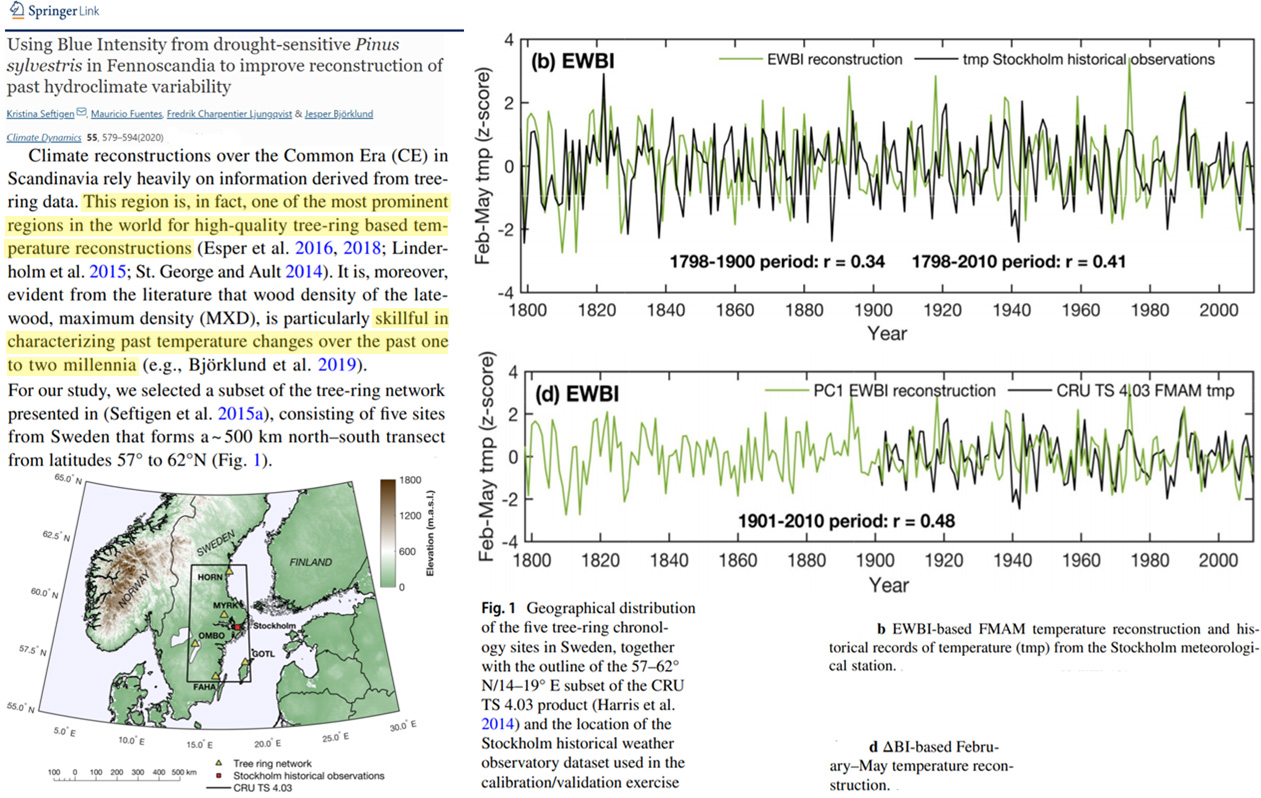
Seftigen et al., 2020 Sweden, no net warming 1800-2010
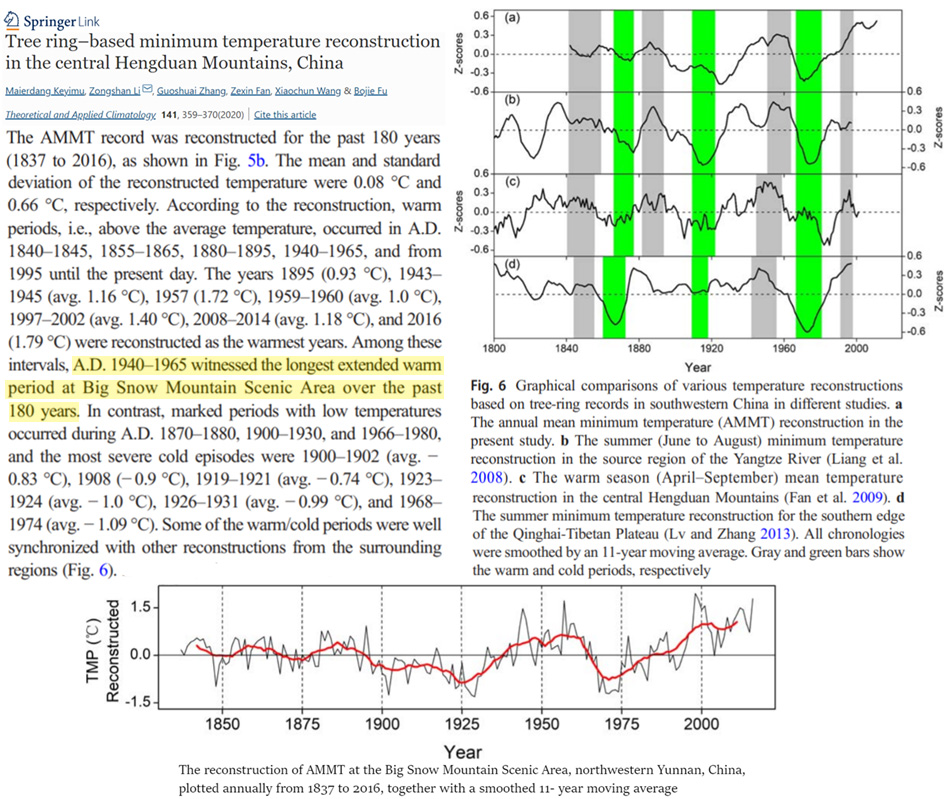
Keyimu et al., 2020 Hengduan Mtns, China longest extended warm period occurred in 1940-’65
“A.D. 1940–1965 witnessed the longest extended warm period at Big Snow Mountain Scenic Area over the past 180 years”
Wang et al., 2020 NE China cooling since the 1980s
“From 1957 to 2013, the average temperature was −3.9°C (Figure 1c). The mean annual temperature increased by 0.9°C per decade from 1957 to 1990, but thereafter, it was stable (Figure 1c). The annual temperature variation (average monthly temperature) was extreme, ranging from −28.1°C in January to 17.3°C in July (Figure 1b).”
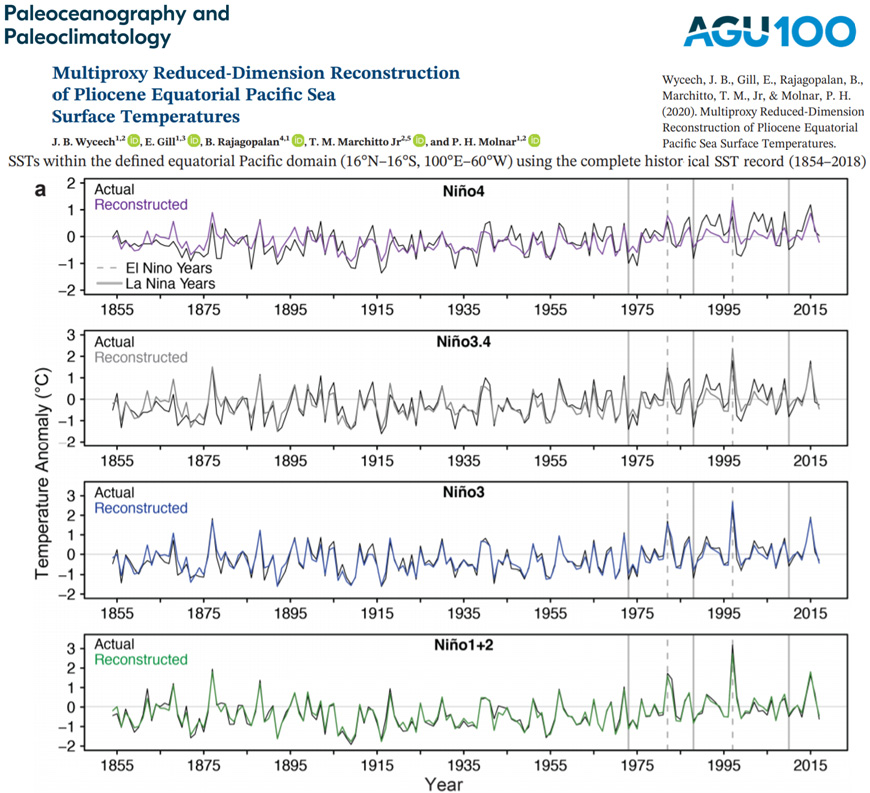
Wycech et al., 2020 Recent non-warming Eastern Equatorial Pacific SSTs
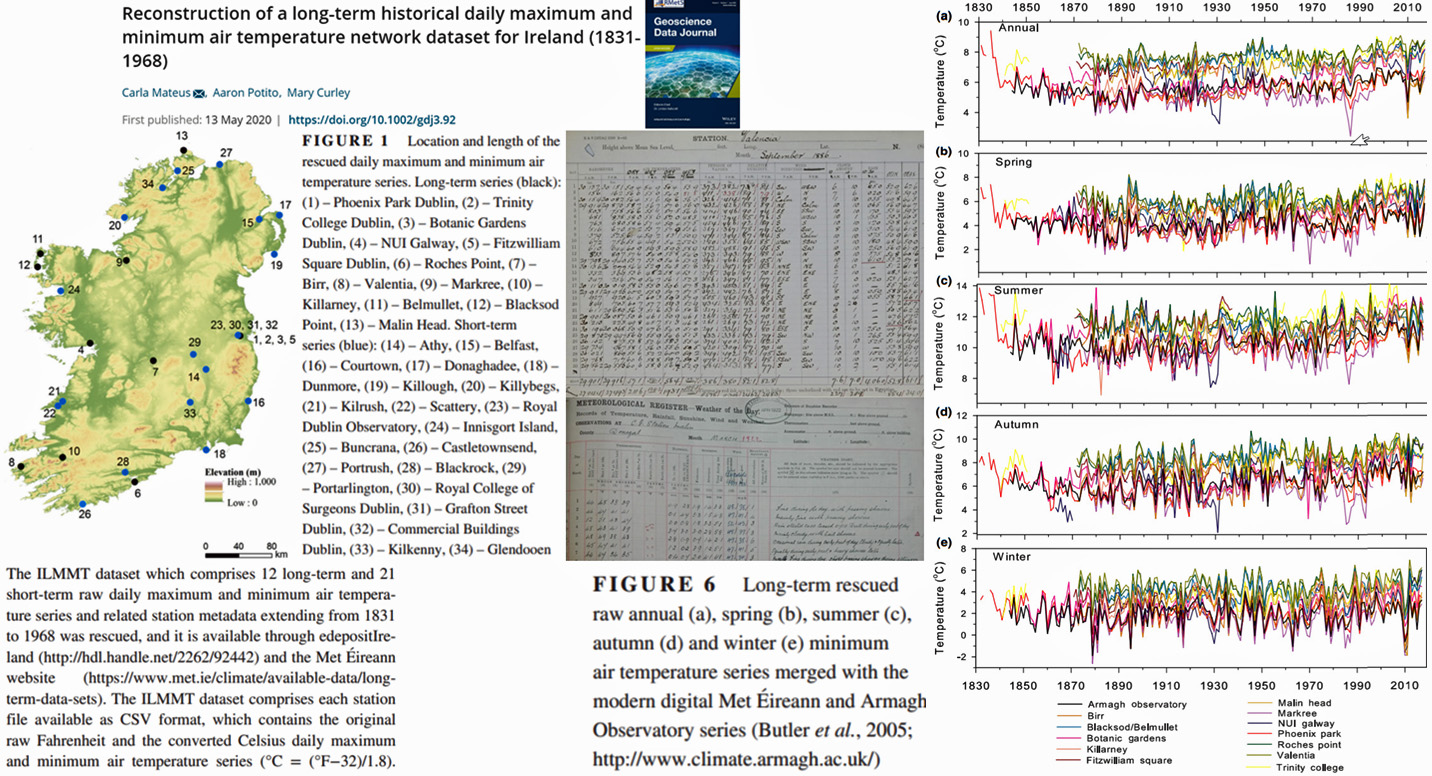
Mateus et al., 2020 Ireland, no apparent net warming since 1831
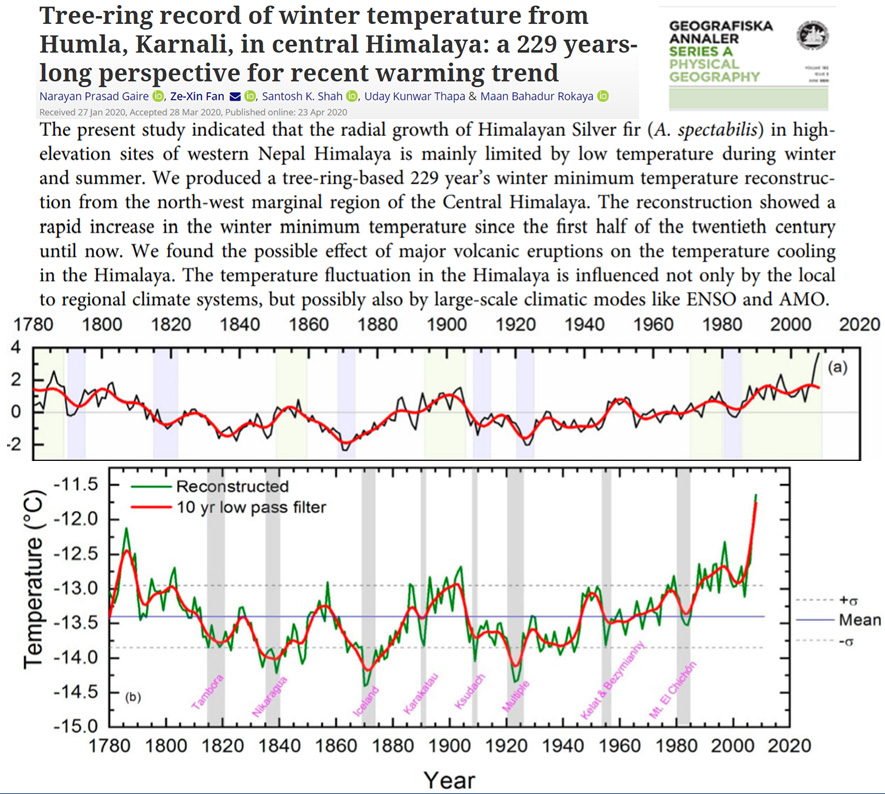
Gaire et al., 2020 Central Himalaya no net warming since 1780s
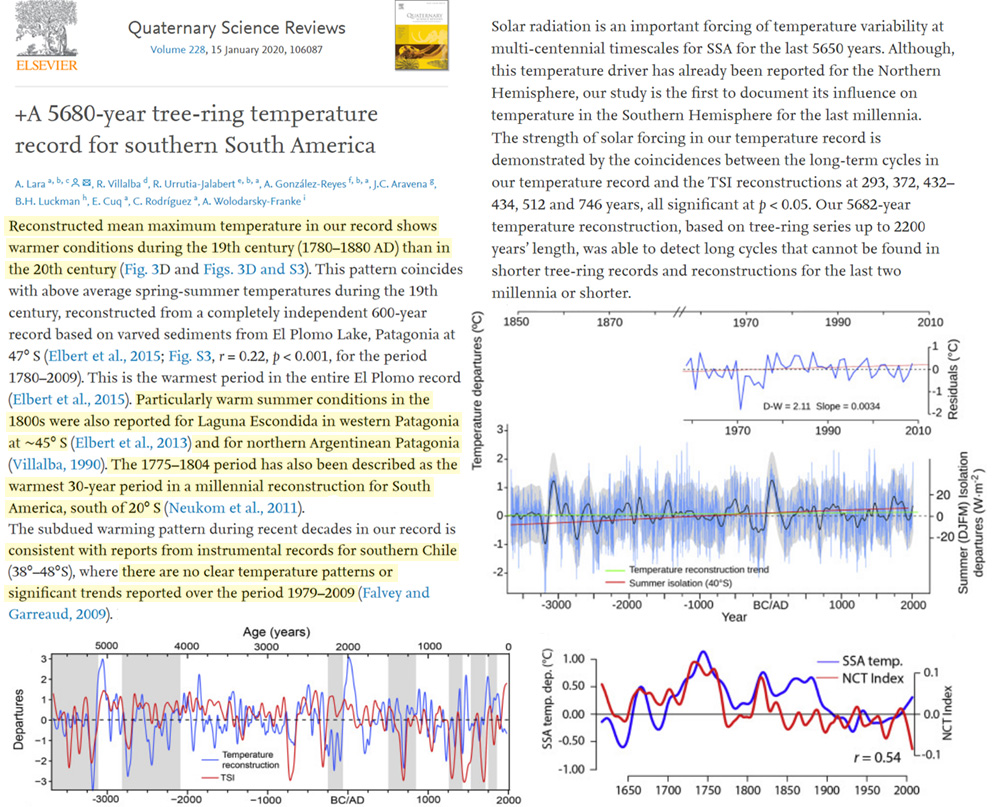
Lara et al., 2020 Southern South America warmer 1775-1884, no warming since 1979
“The most outstanding features in the reconstruction presented here are two major warm periods between 3140–2800 BC and 70 BC – 150 AD (5159–4819 and 2089–1869 years ago, respectively, counted from 2019 to facilitate comparisons with glacier records based on 10Be dated moraines). During these warm periods, no glacier advances have been reported for Patagonia (Aniya, 2013; Kaplan et al., 2016; Strelin et al., 2014, Fig. 5A). … Reconstructed mean maximum temperature in our record shows warmer conditions during the 19th century (1780–1880 AD) than in the 20th century (Fig. 3D and Figs. 3D and S3). The 1775–1804 period has also been described as the warmest 30-year period in a millennial reconstruction for South America, south of 20° S (Neukom et al., 2011). … The subdued warming pattern during recent decades in our record is consistent with reports from instrumental records for southern Chile (38°–48°S), where there are no clear temperature patterns or significant trends reported over the period 1979–2009 (Falvey and Garreaud, 2009).”
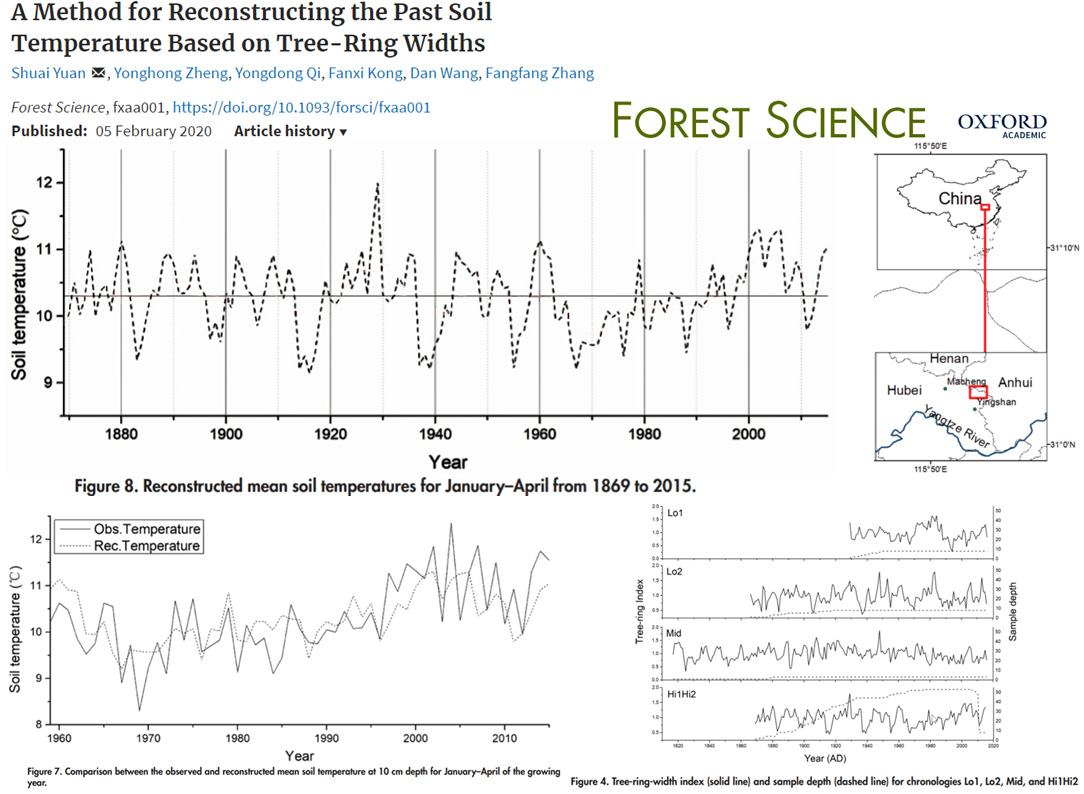
Yuan et al., 2020 SE China no warming since 1870
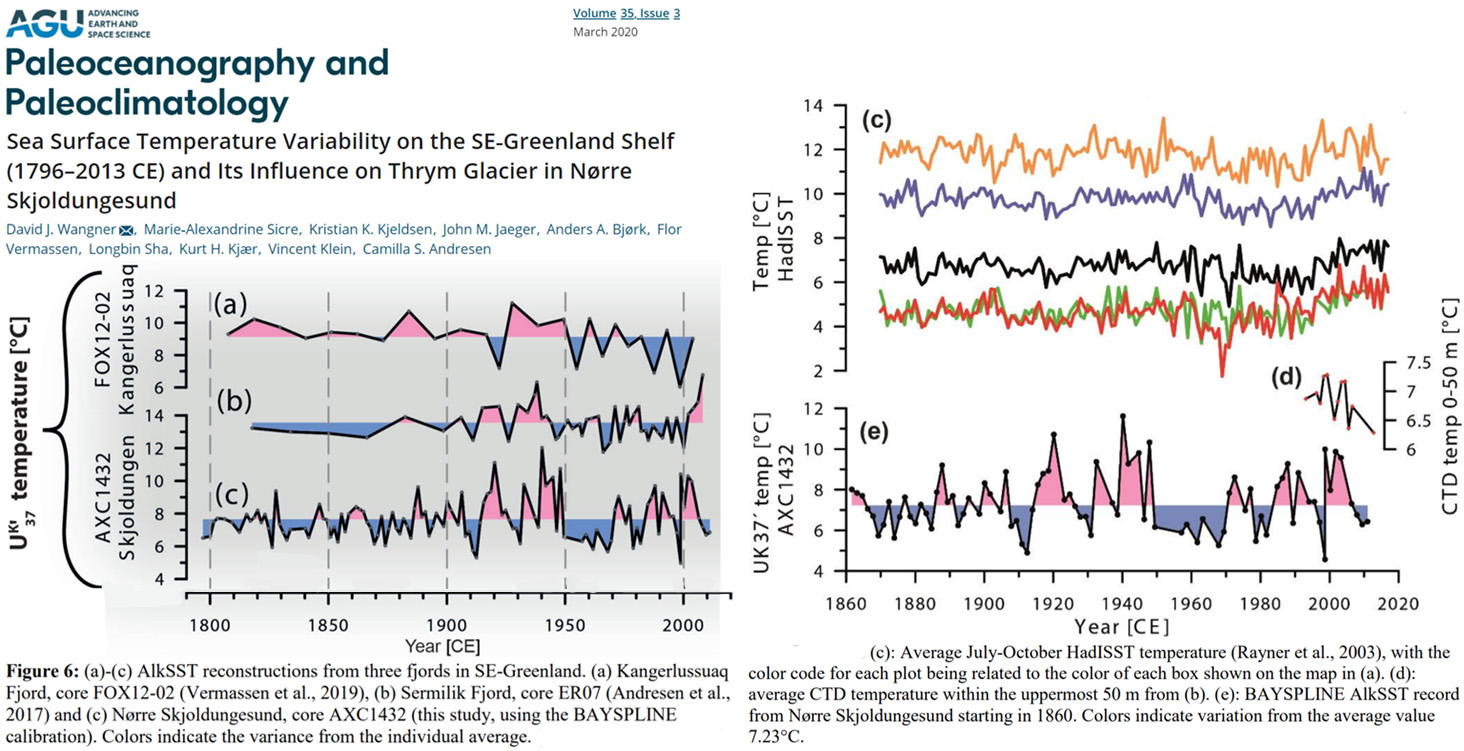
Wangner et al., 2020 SE Greenland warmer 1920s-1940s
“The cold decades after 1950 coincide with the Great Salinity Anomaly in the late 60s to early 70s, caused by the long-term decrease of the North Atlantic Oscillation (NAO) index favoring the export of freshwater and ice through Fram Strait into the EGC (Dickson et al., 1996). Within two or three years, the associated salinity anomaly reached the Labrador Sea causing a reduction of the convection and subsequent weakening of the Atlantic Meridional Overturning Circulation (AMOC). This mechanism explains the low temperature on the SE-Greenland shelf and the positive AMV during this time period (Ionita et al., 2016, Figure 6d). … Displayed in the alkSST record from Skjoldungen as well as in the CTD measurements off Skjoldungen (Figure 5d) is a return to lower temperatures post 2006, pointing out the exceptional high temperatures around 2000. … Our study shows that even though the meltwater production may have been influenced by climate, the glacier margin position and iceberg calving remained relatively constant in the 20th century. This may be due to the setting of the glacier with a limited ice-ocean interface and a 90° inflow angle acting as a pinning point in its current position. Our study illustrates that ocean heat may have a limited effect on some marine glaciers.”
Sun et al., 2020 NW China no warming since 1600s, cooling since 1950
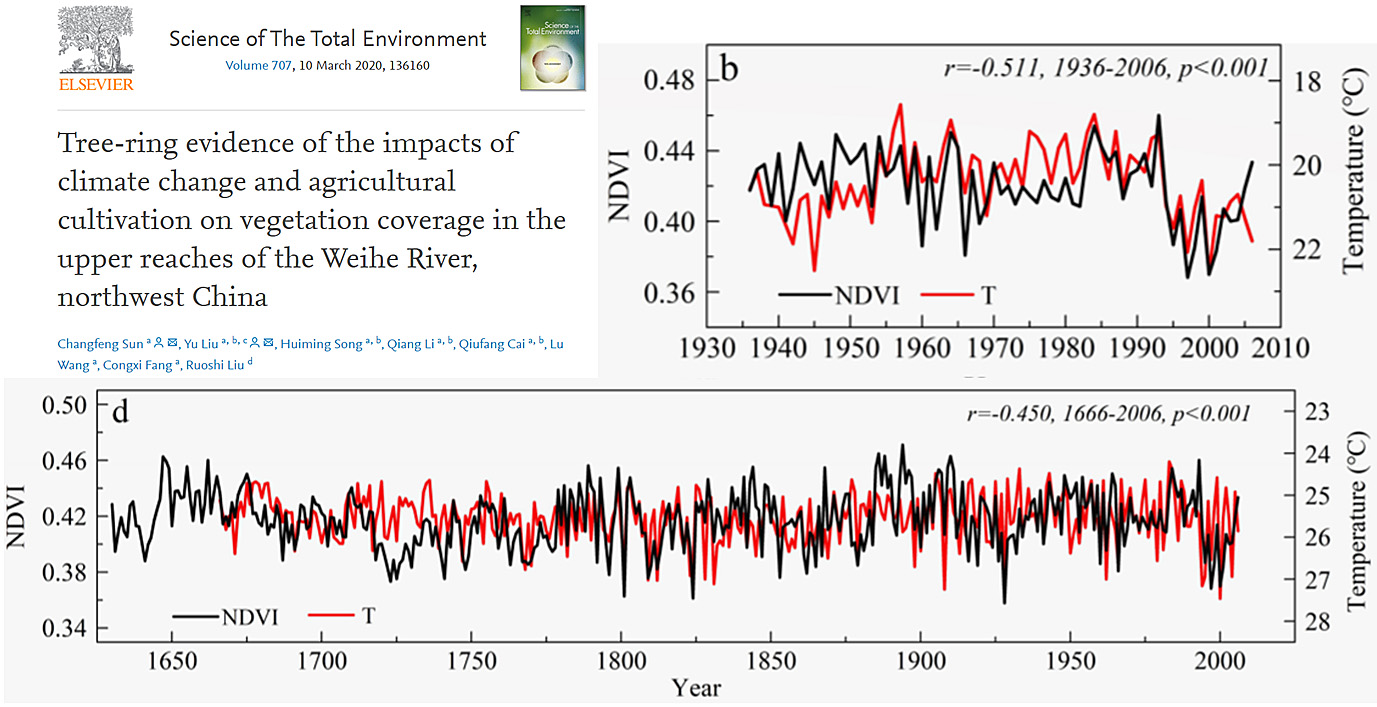
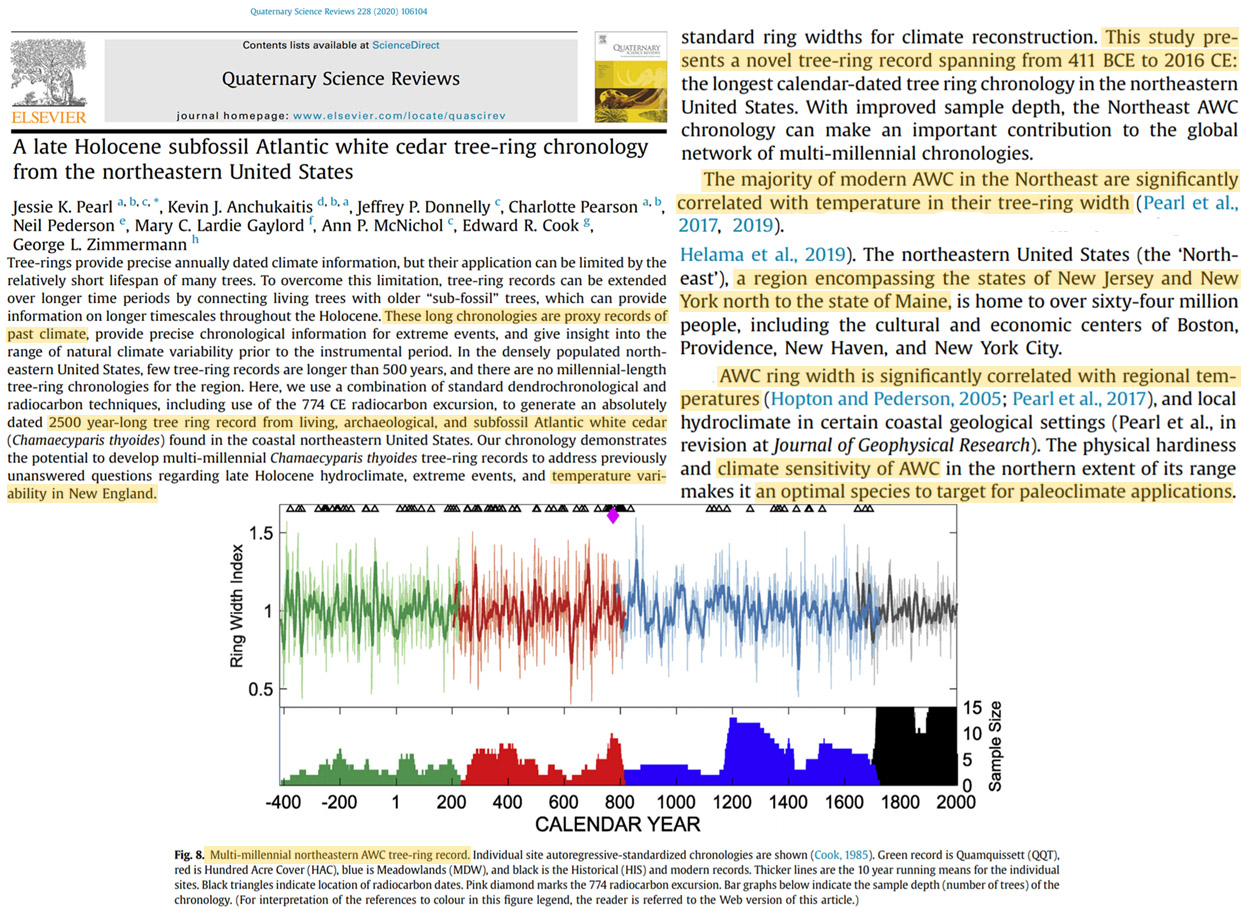
Pearl et al., 2020 NE USA no net warming from 411 BCE to 2016
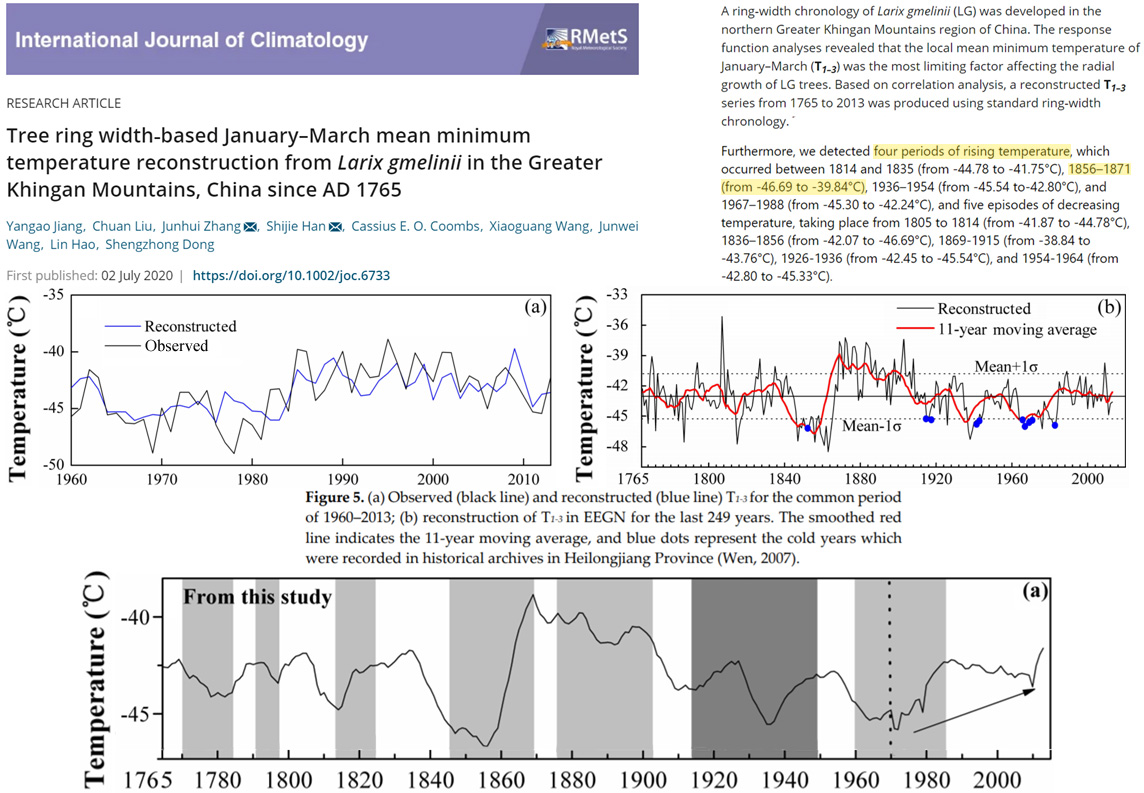
Jiang et al., 2020 Khingan Mountains (China) cooling since 1870s, 7°C warming 1856-’71
“…we detected four periods of rising temperature, which occurred between 1814 and 1835 (from -44.78 to -41.75°C), 1856-1871 (from -46.69 to -39.84°C)“
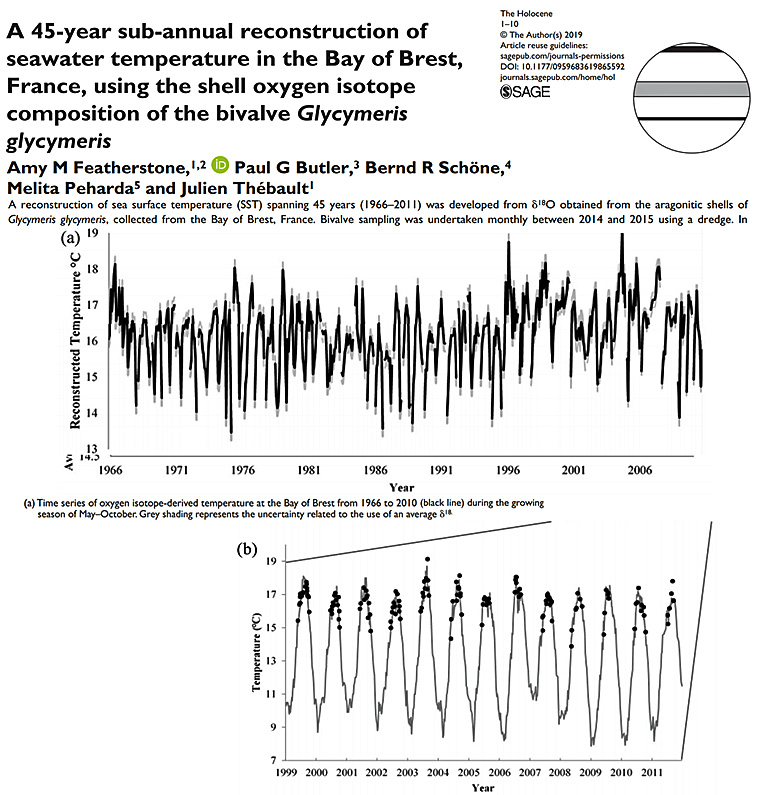
Featherstone et al., 2020 Recent non-warming, Bay of Brest, France
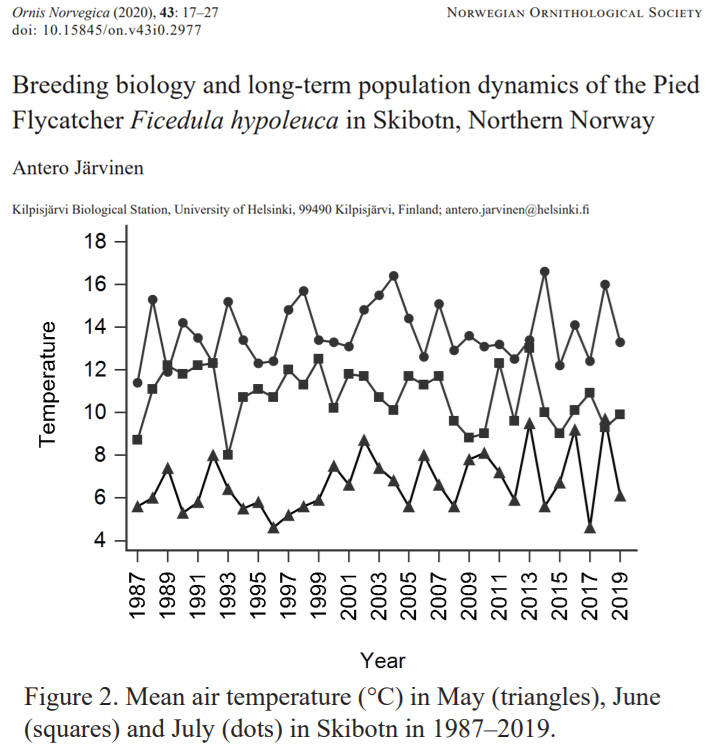
Järvinen, 2020 Recent non-warming, northern Norway
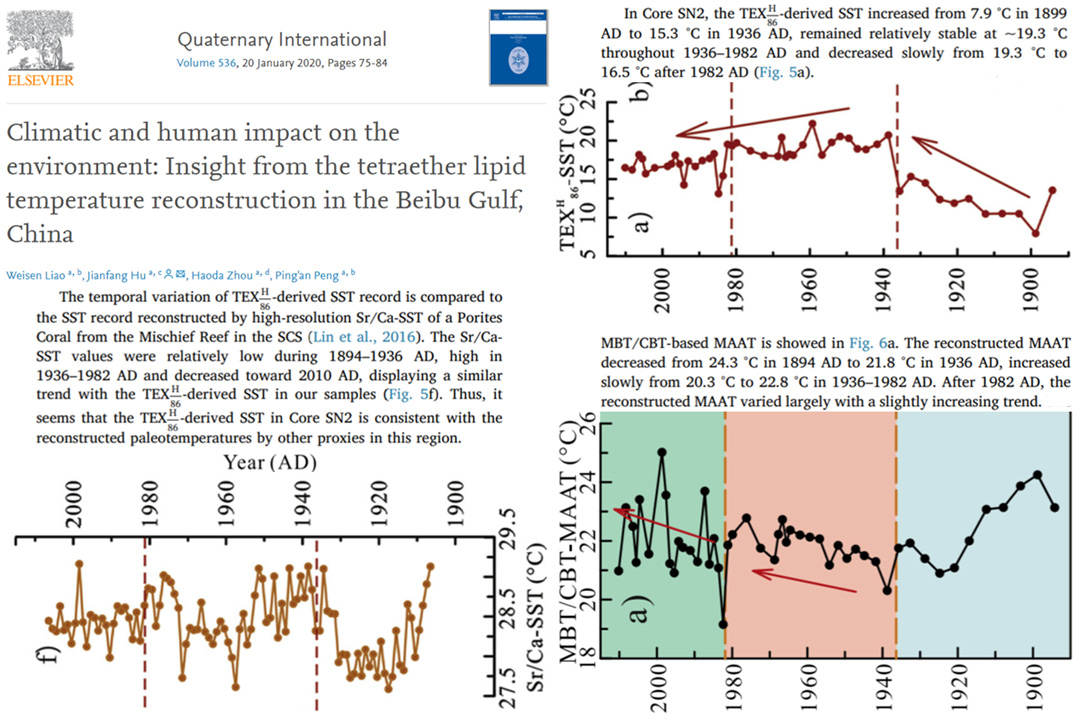
Liao et al., 2020 South China Sea recent (since 1940) non-warming/cooling
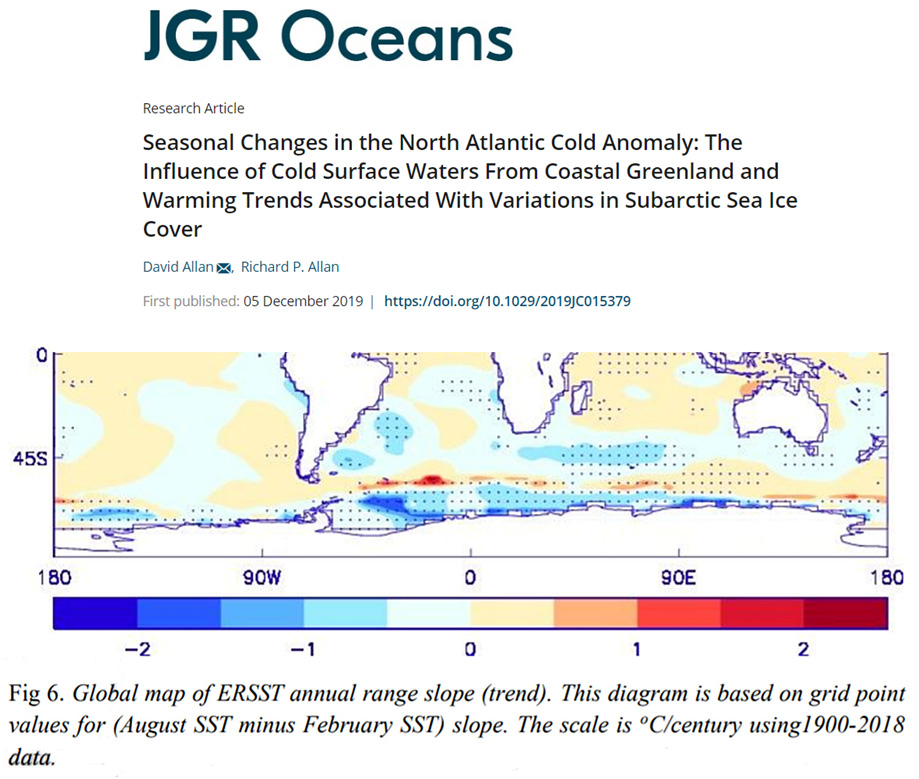
Allan and Allan, 2020 Southern Hemisphere: More cooling than warming from 1900-2018?
“Although it is well-established that mean global SST has increased by about 1°C since 1900 (Huang et al 2017), a sector of the SPG centred near 50°N, 40°W has experienced a pronounced relative cooling approaching 1°C over the same period (Drijfhout et al 2012, Rahmstorf et al. 2015; Josey et al 2018; Caesar et al 2018 and Fig 2a). This almost unique region of long term surface cooling is sometimes referred to colloquially as the ‘cold blob’ (CB) (Rahmstorf et al 2015) when mapped as the regression of local SST changes relative to global mean values.”
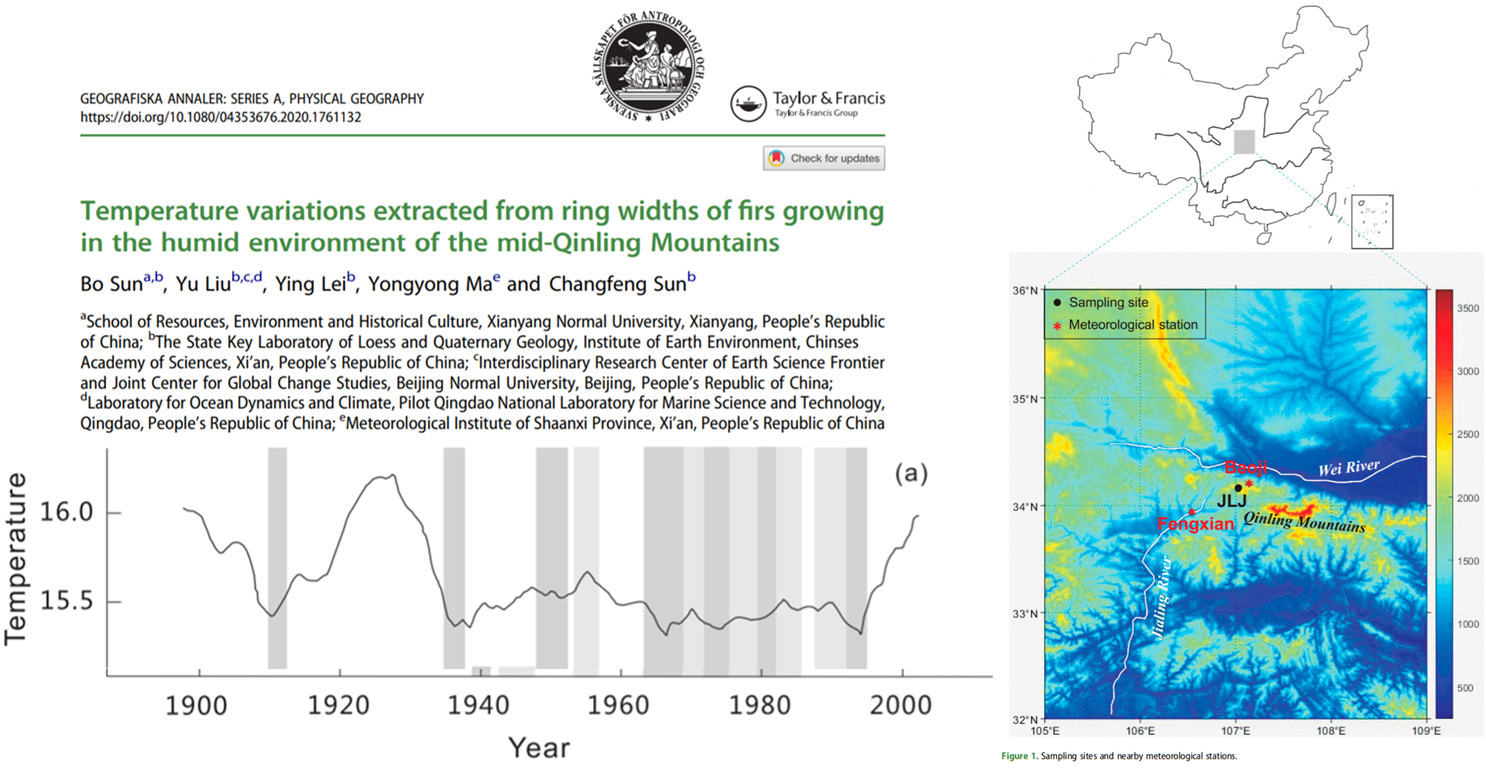
Sun et al., 2020 Central China (Qinling Mountains) warmer in the 1920s and 1930s
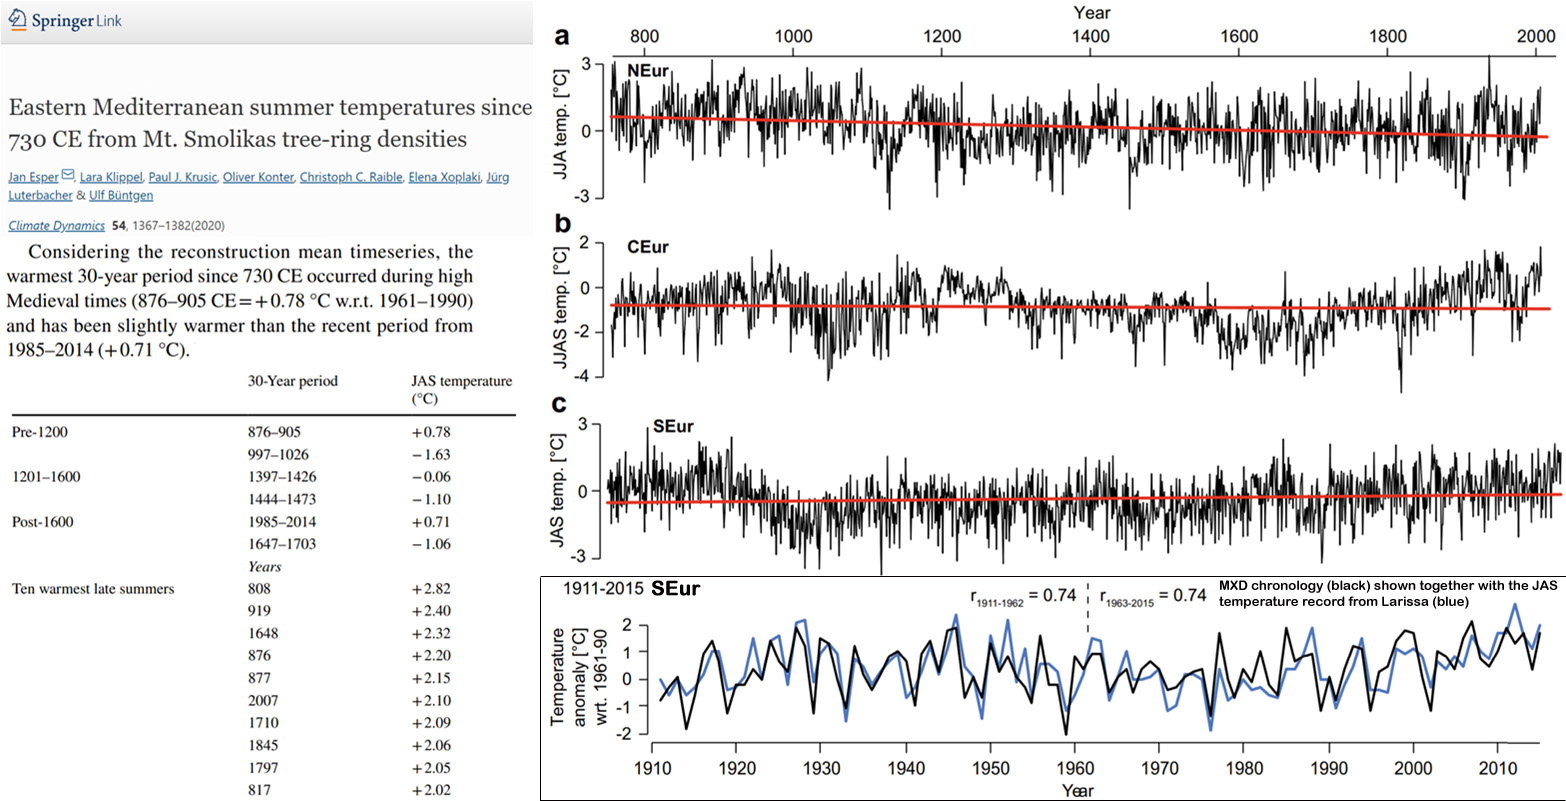
Esper et al., 2020 Warmest period in Europe “during high Medieval times” (876-905 CE)
“Considering the reconstruction mean timeseries, the warmest 30-year period since 730 CE occurred during high Medieval times (876–905 CE=+0.78 °C w.r.t. 1961–1990) and has been slightly warmer than the recent period from 1985–2014 (+0.71 °C).”
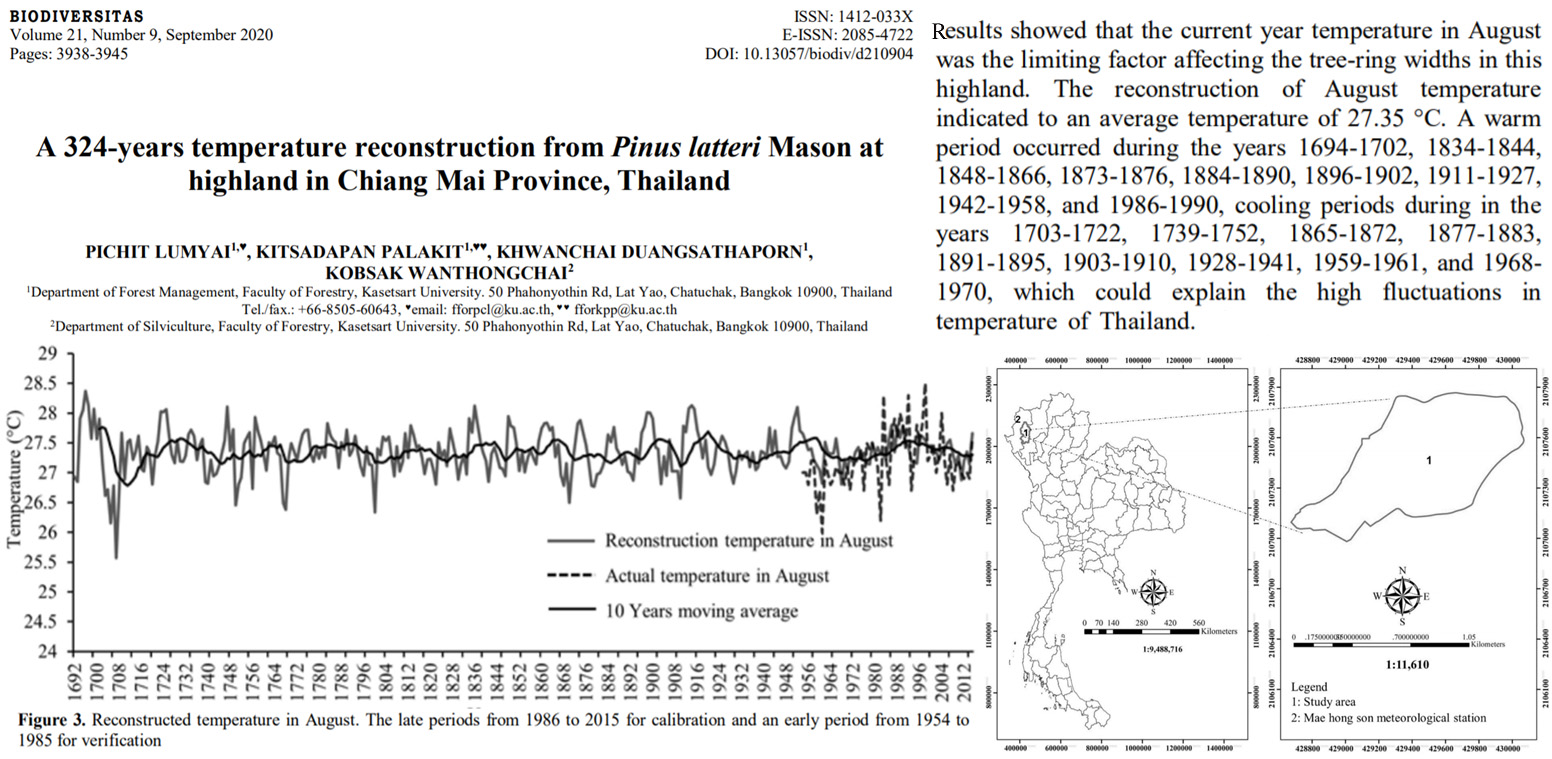
Lumyai et al., 2020 NW Thailand warmer in 1694-1702 than post-1990s
“The results showed that the current year temperature in August was the limiting factor affecting the tree-ring widths in this highland. The reconstruction of August temperature indicated to an average temperature of 27.35°C. A warm period occurred during the years 1694-1702, 1834-1844, 1848-1866, 1873-1876, 1884-1890, 1896-1902, 1911-1927, 1942-1958, and 1986-1990.”
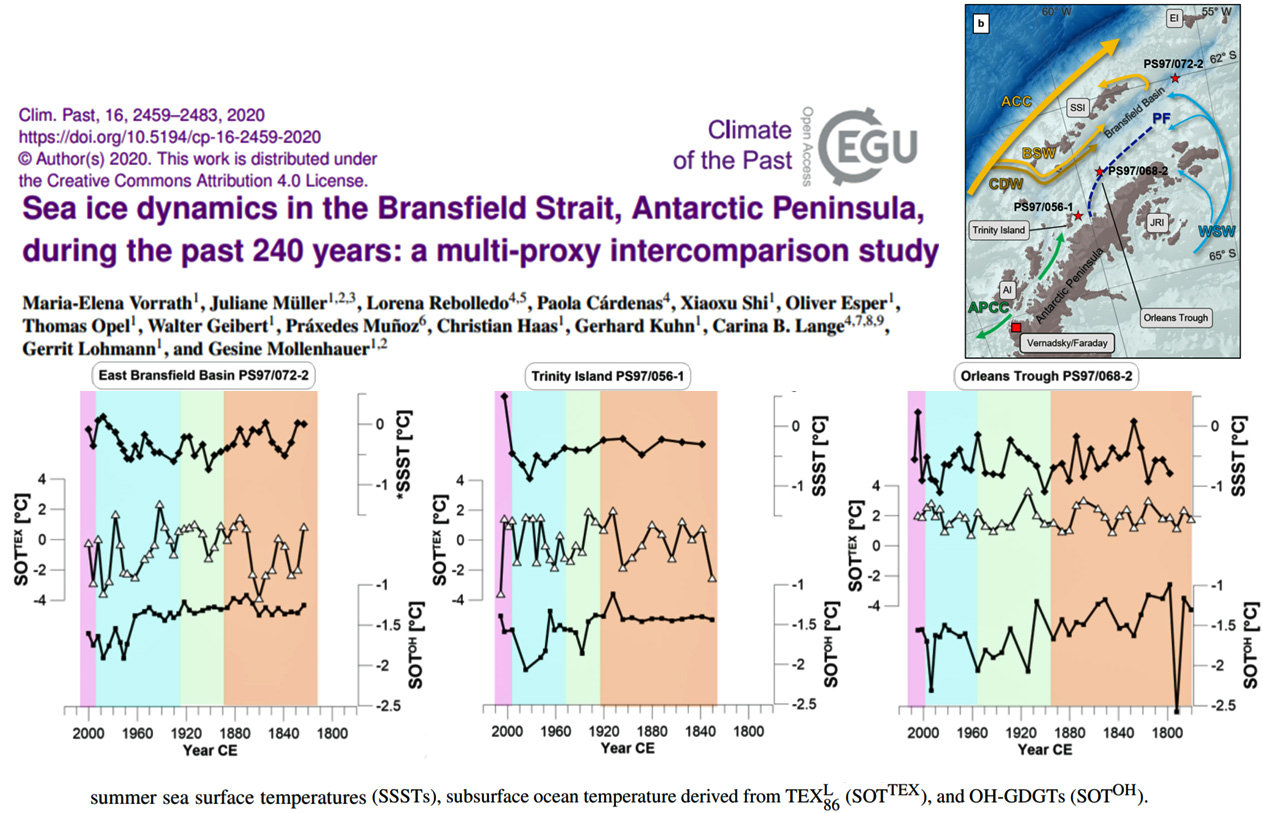
Vorrath et al., 2020 Antarctic Peninsula recent non-warming in 8 of 9 temp records
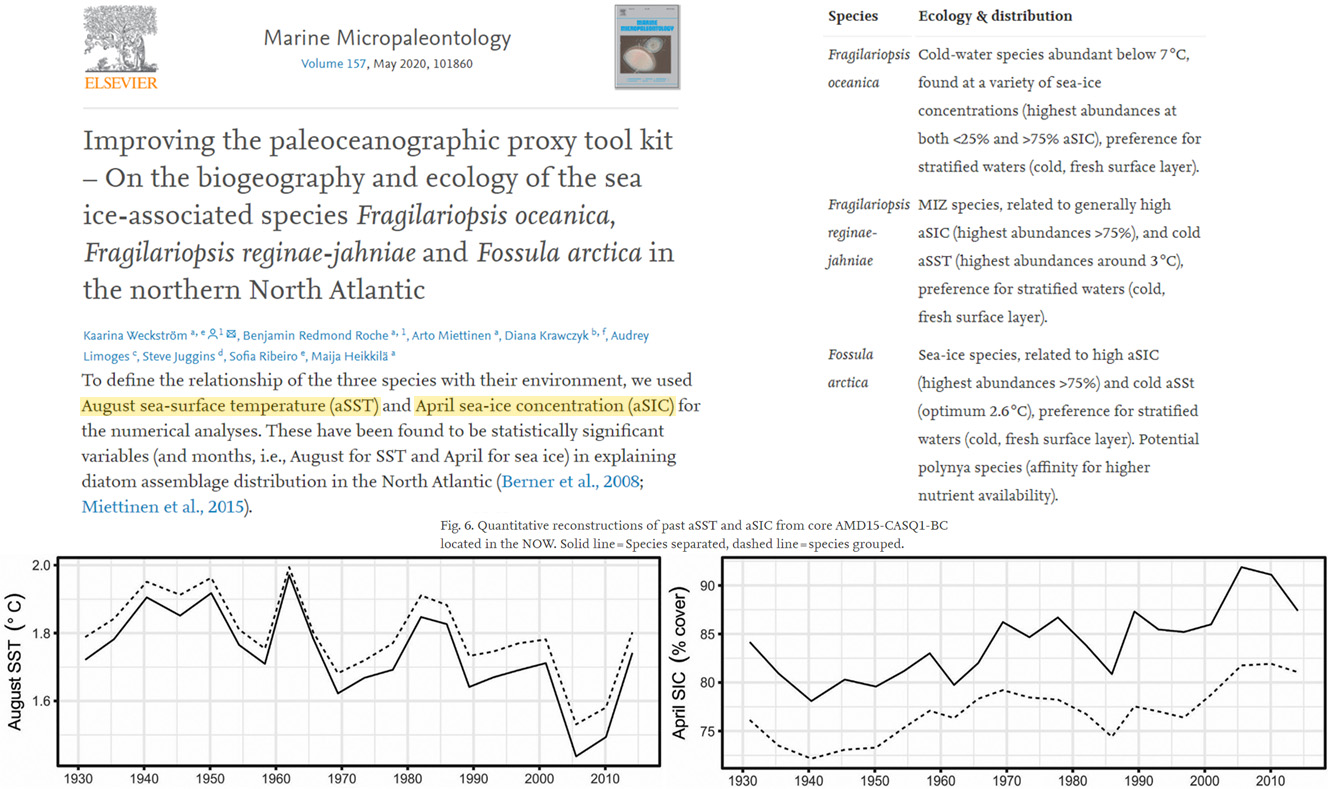
Weckstrom et al., 2020 Northern North Atlantic cooling and sea ice growing since 1930
Gao et al., 2020 Eurasian boreal forests summer cooling since 1997
“Greening Hiatus in Eurasian Boreal Forests Since 1997 Caused by a Wetting and Cooling Summer Climate … The Eurasian boreal forest ecosystem is a strong sink in the global carbon cycle. Satellite observations show significant change in the ecosystem in recent decades, specifically an increase in vegetation productivity since 1982 and a hiatus after 1997. Previous studies attributed this enhanced vegetation growth (also known as greening) to air temperature increases and a longer growing season, and the recent greening hiatus as a result of a warmer and drier climate. However, using satellite data, we found observational evidence that increases in summer peak growth dominated the overall greening trend and that a wetting and cooling climate during the peak growing season was the primary cause of the hiatus.”
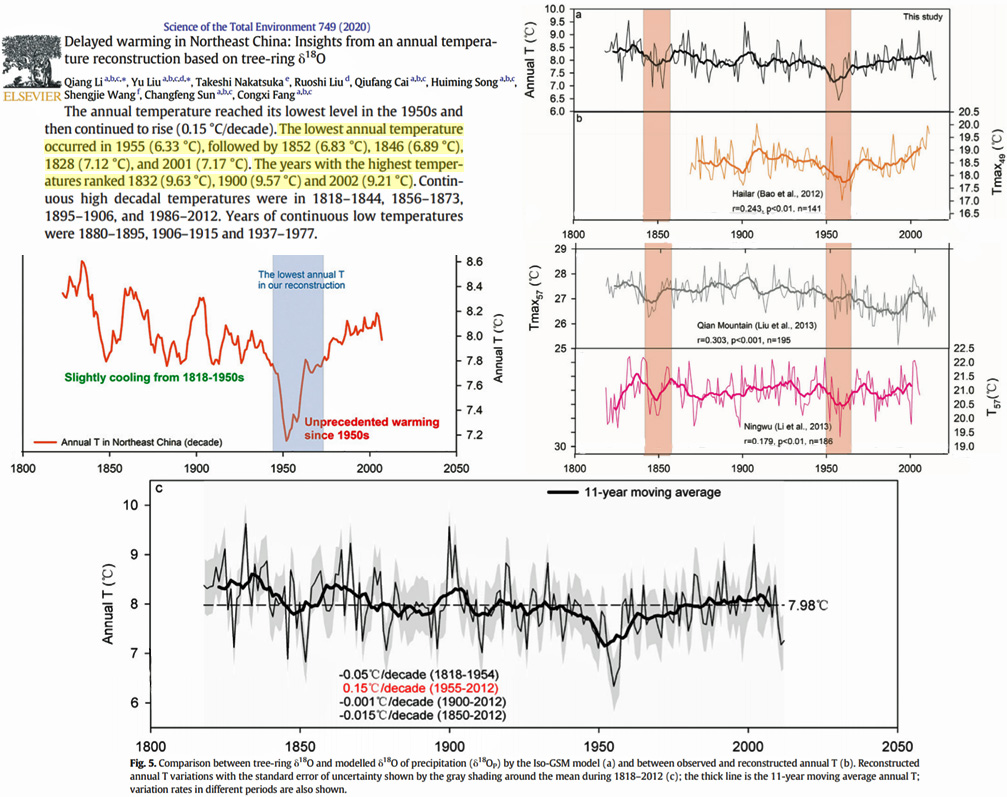
Li et al., 2020 NE China ~0.5°C warmer in the 1830s
“Annual T was regulated by the EASM and NAO during the past two centuries. … The annual temperature reached its lowest level in the 1950s and then continued to rise (0.15 °C/decade). The lowest annual temperature occurred in 1955 (6.33 °C), followed by 1852 (6.83 °C), 1846 (6.89 °C), 1828 (7.12 °C), and 2001 (7.17 °C). The years with the highest temperatures ranked 1832 (9.63 °C), 1900 (9.57 °C) and 2002 (9.21 °C). Continuous high decadal temperatures were in 1818–1844, 1856–1873, 1895–1906, and 1986–2012. Years of continuous low temperatures were 1880–1895, 1906–1915 and 1937–1977.”
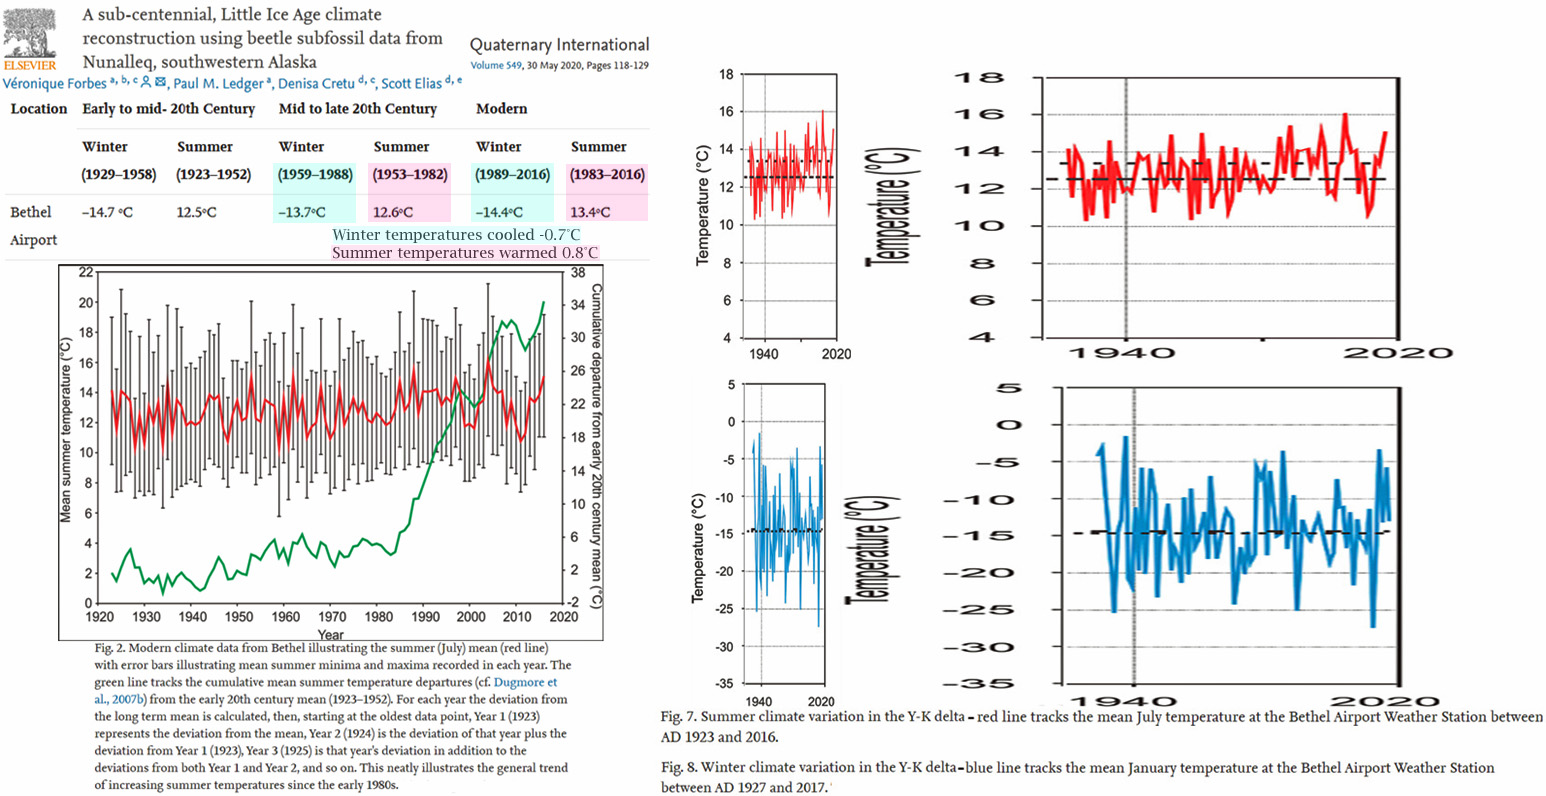
Forbes et al., 2020 SW Alaska winter temps cooled -0.7°C, summer temps warmed +0.8°C since 1950s
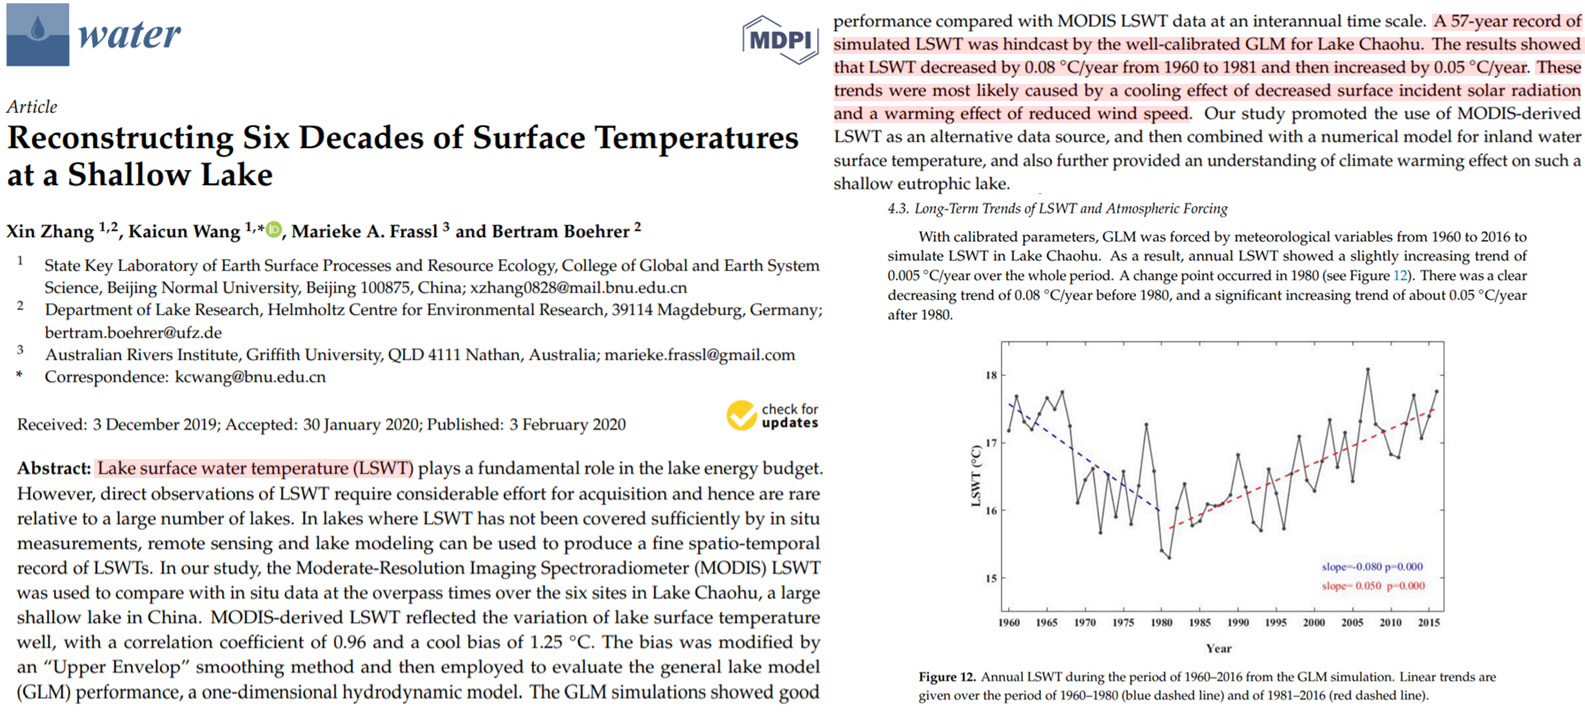
Zhang et al., 2020 China lake: -0.8°C per decade cooling 1960-1981 before +0.5°C/decade warming
“The results showed that LSWT decreased by 0.08°C/year from 1960 to 1981 and then increased by 0.05°C/year. These trends were most likely caused by a cooling effect of decreased surface incident solar radiation and a warming effect of reduced wind speed.”
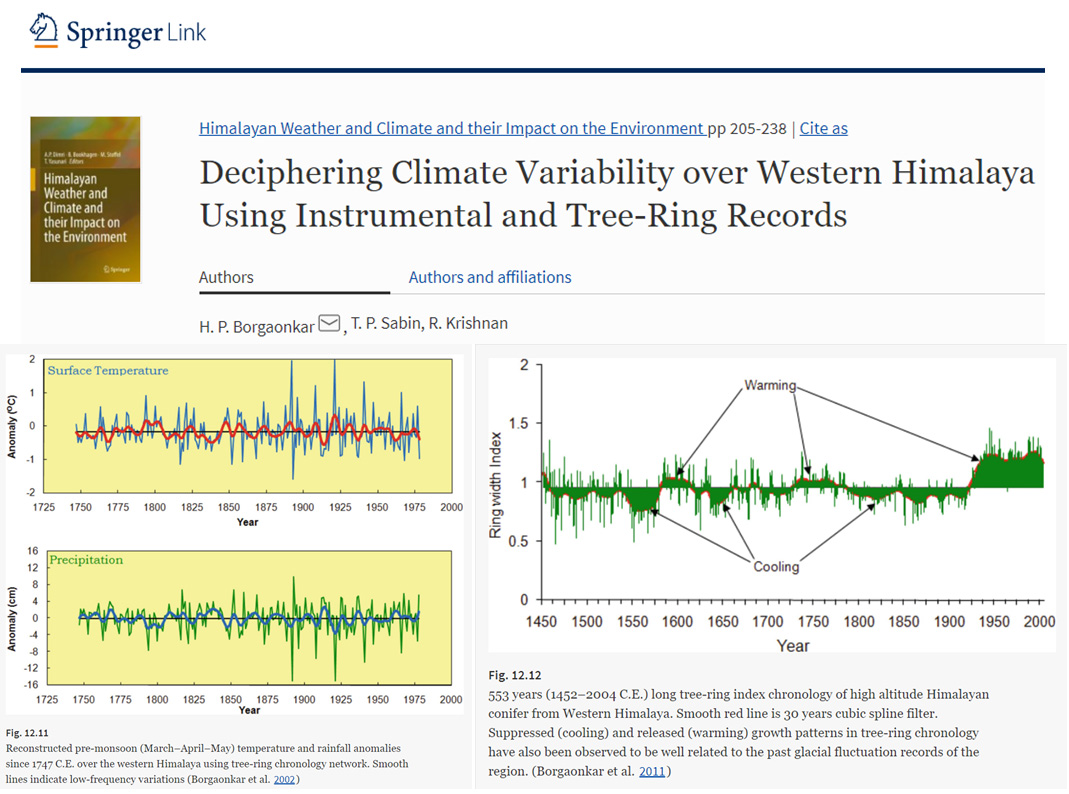
Borgaonkar et al., 2020 W. Himalaya no warming since ~1950s, “no…trend since past three centuries”
“(Yadav et al. 2017) indicated increasing precipitation pattern and glacier expansion associated with cooling over northwest Himalaya. Similarly, reconstructed pre-monsoon (March–April–May) temperature and rainfall anomalies since 1747 C.E. over the western Himalaya using wide tree-ring chronology network did not show any increasing or decreasing trend since past three centuries (Fig. 12.11) (Borgaonkar et al. 2002).”
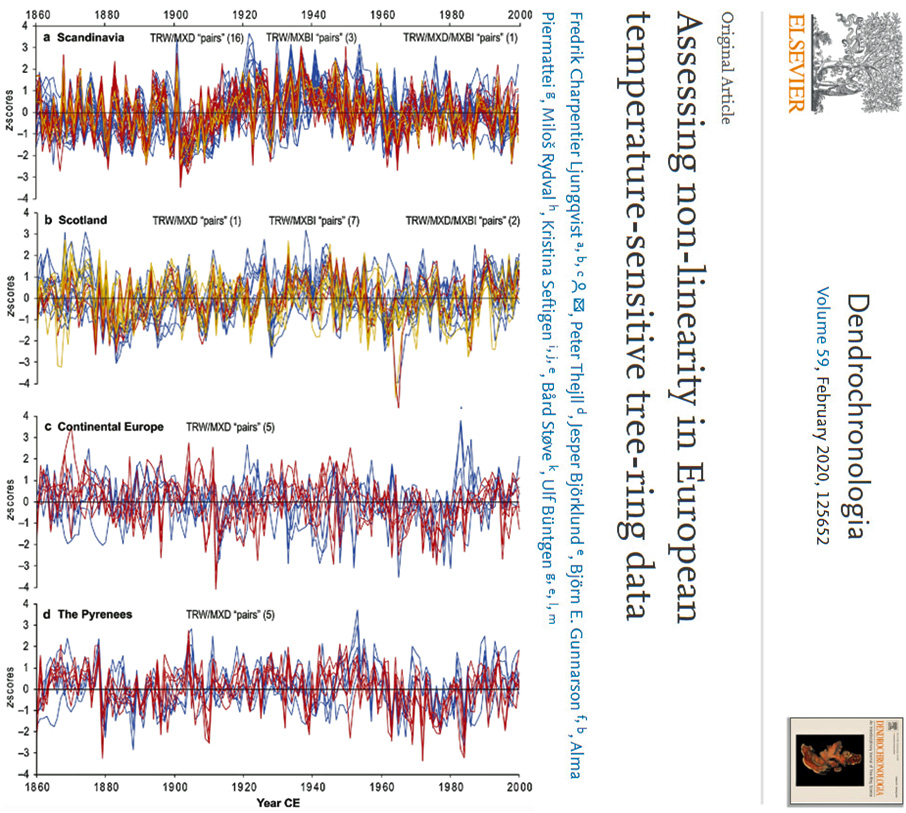
Ljungqvist et al., 2020 Scandinavia, Scotland, Europe, Pyrenees non-warming 1860-2000
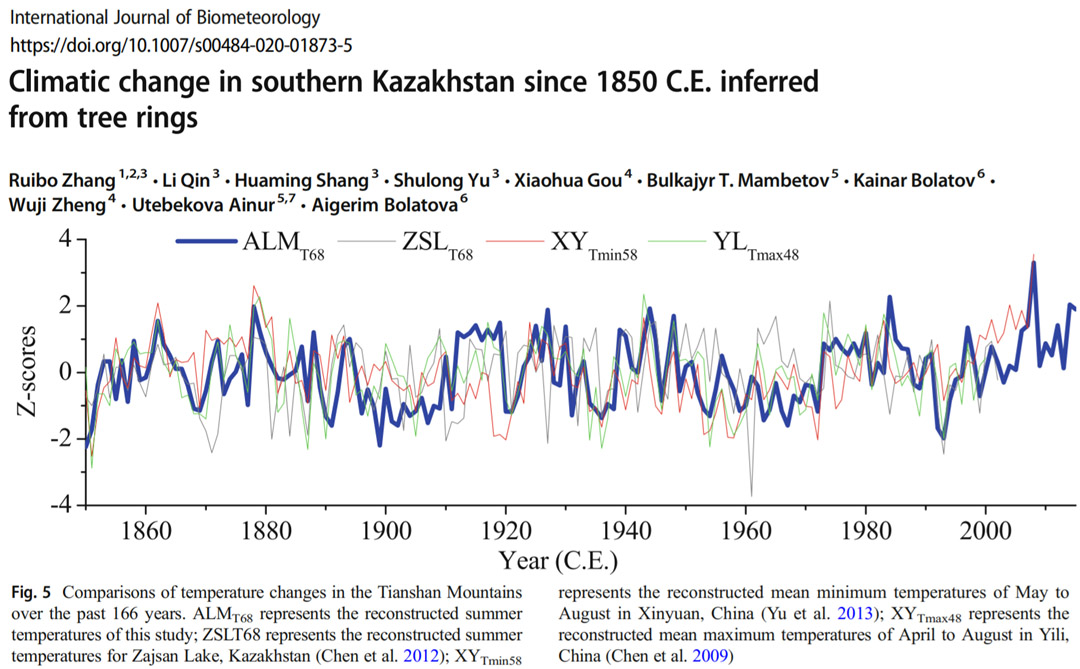
Zhang et al., 2020 Kazakhstan no net warming since 1850
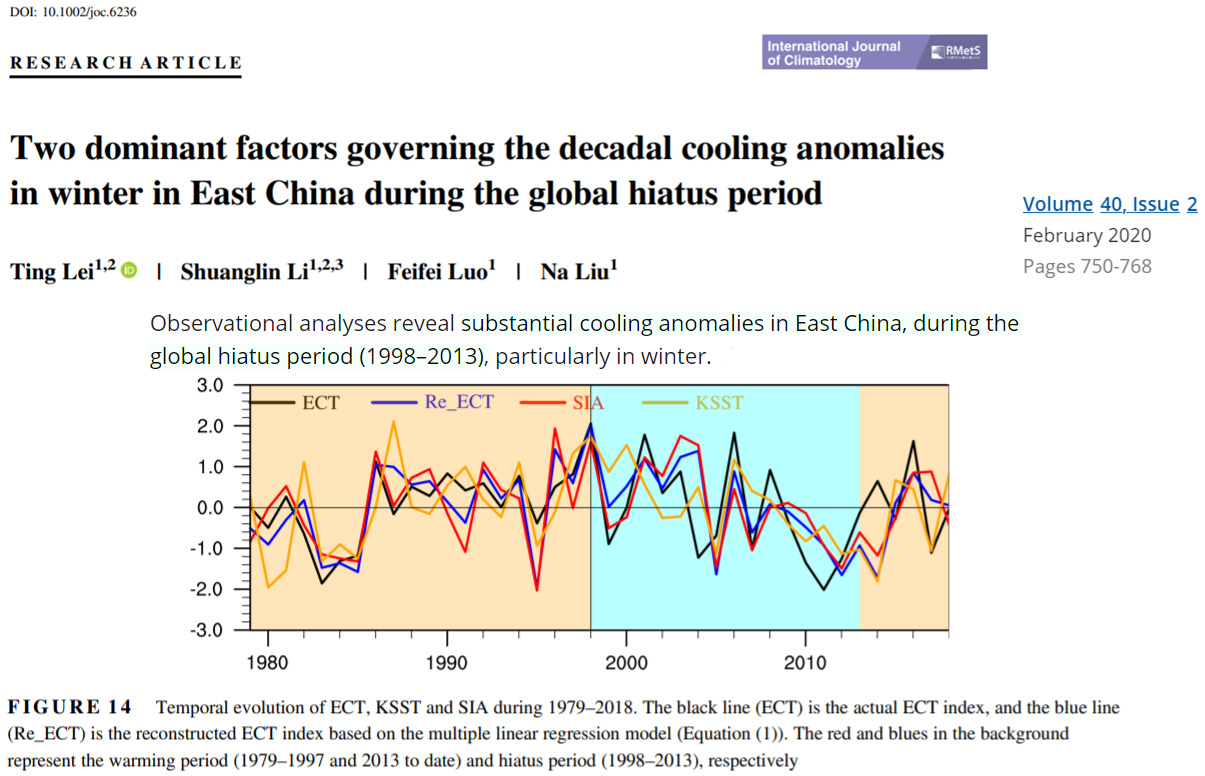
Lei et al., 2020 East China cooling during the global warming hiatus
“Observational analyses reveal substantial cooling anomalies in East China, during the global hiatus period (1998–2013), particularly in winter.”
Hua et al., 2020 Central China had two cold periods since 1853, including 1953-2000
“With linear regression analysis, we reconstructed the March-April mean maximum temperature of Zhen’an over 165 years from 1853 to 2017. … [T]he reconstruction function and results were credible and reliable. Warm years occurred 25 times and cold years occurred 29 times in the reconstruction sequence. The warm years were more accompanied by flood events, while the cold years were accompanied by more drought events. Temperature fluctuated obviously in the reconstruction sequence, with two cold periods (1902-1917 and 1953-2000) and four warm periods (1868-1892, 1917-1937, 1941-1953 and 2001-2012).”
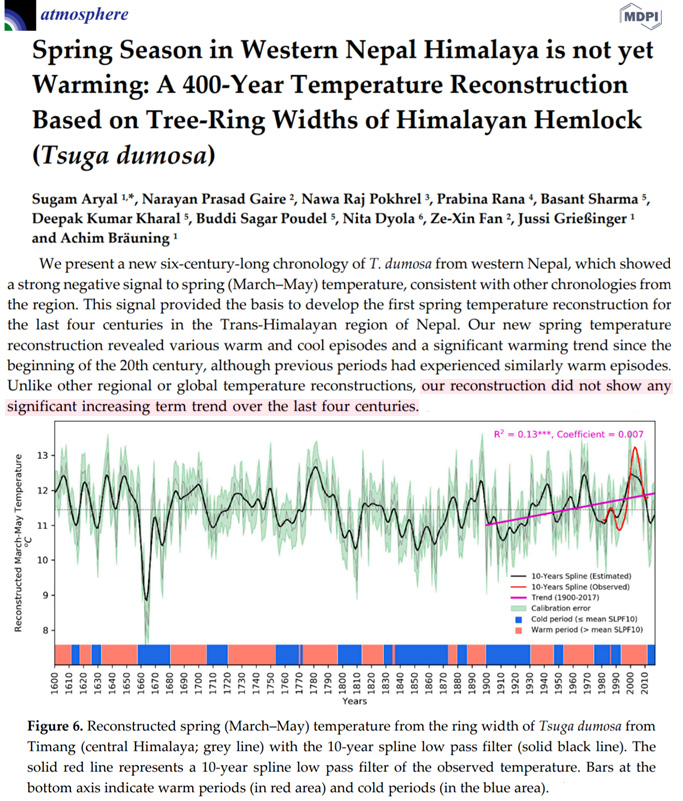
Aryal et al., 2020 Himalaya temps “did not show any significant increasing trend” in 400 yrs
“Our new spring temperature reconstruction revealed various warm and cool episodes and a significant warming trend since the beginning of the 20th century, although previous periods had experienced similarly warm episodes. Unlike other regional or global temperature reconstructions, our reconstruction did not show any significant increasing term trend over the last four centuries. … The reconstructed spring temperature series contained periodicities that coincide with the periodicity of broader scale climate modes, such as AMO, NAO, and ENSO. This implies that the temperature in our study area is also regulated by broad‐scale atmospheric circulation patterns.”
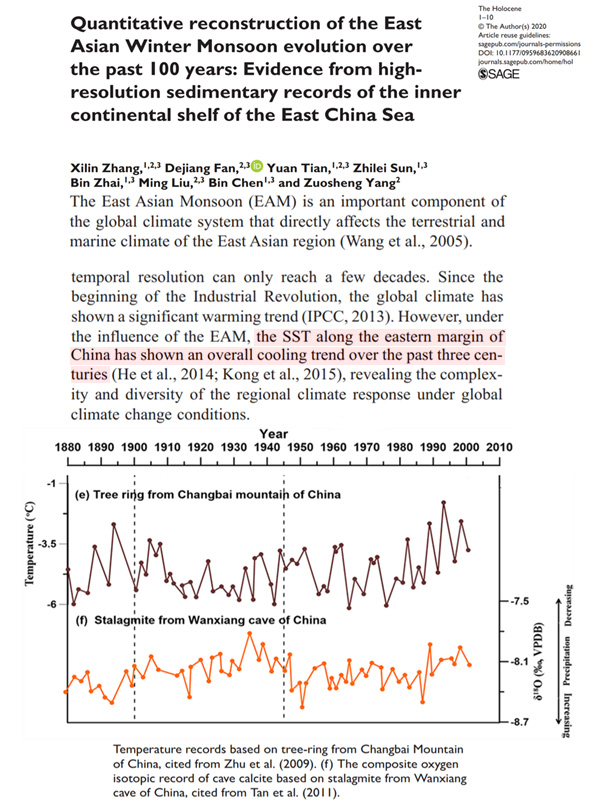
Zhang et al., 2020 East China Sea “an overall cooling trend over the past three centuries “
“The East Asian Monsoon (EAM) is an important component of the global climate system that directly affects the terrestrial and marine climate of the East Asian region (Wang et al., 2005). … Since the beginning of the Industrial Revolution, the global climate has shown a significant warming trend (IPCC, 2013). However, under the influence of the EAM, the SST along the eastern margin of China has shown an overall cooling trend over the past three centuries (He et al., 2014; Kong et al., 2015), revealing the complexity and diversity of the regional climate response under global climate change conditions.”
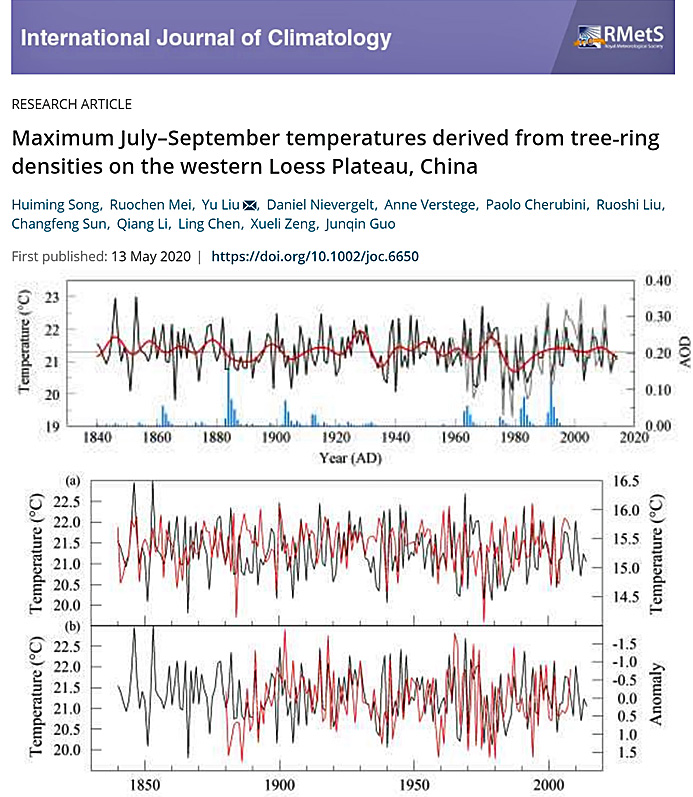
Song et al., 2020 Loess Plateau (China) cooling since 1840
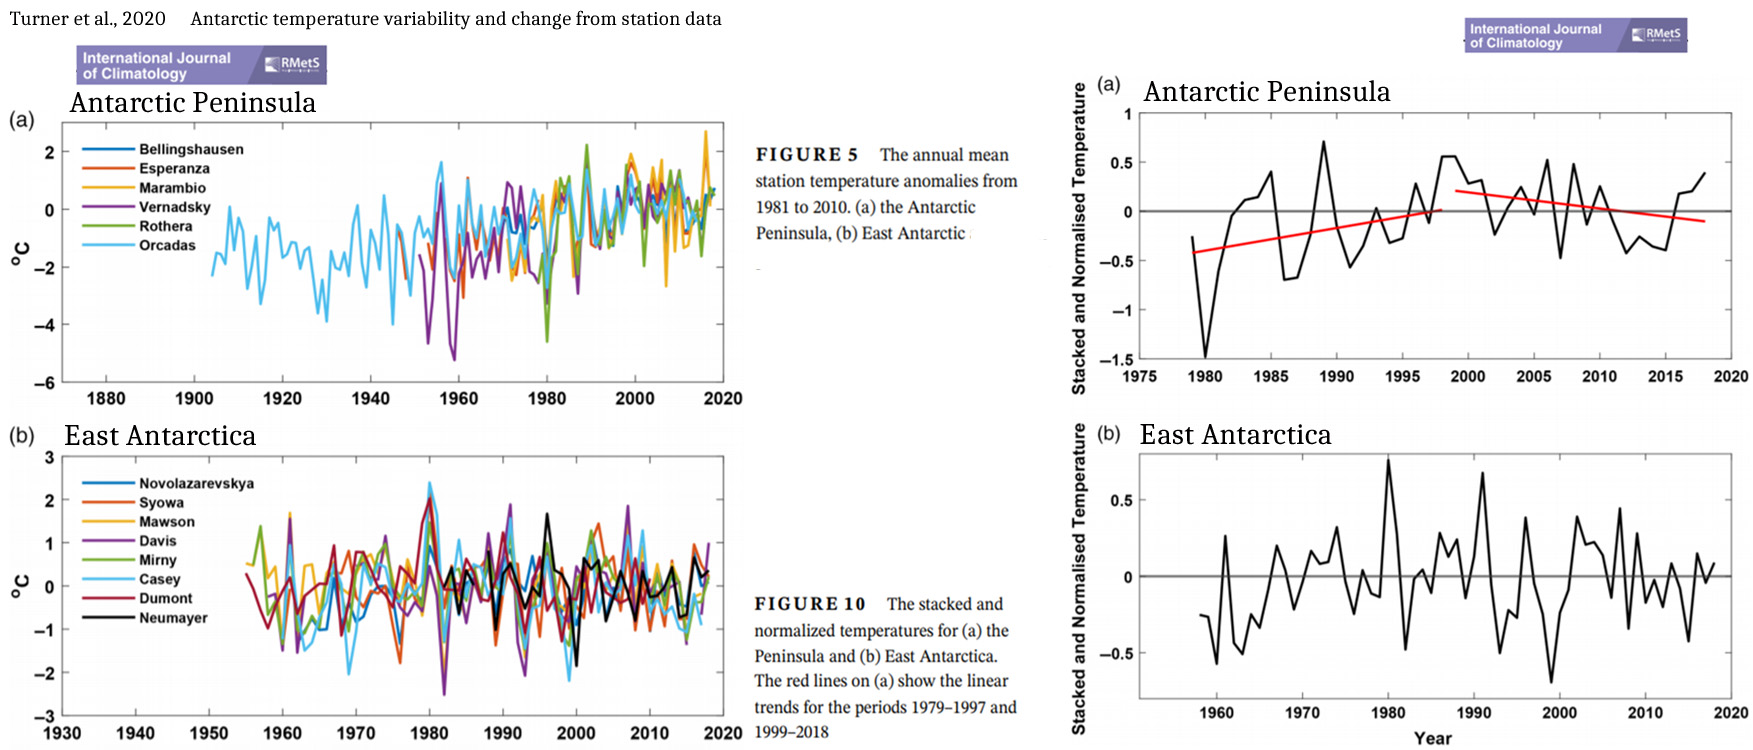
Turner et al., 2020 Antarctic Peninsula and East Antarctica recent cooling/non-warming
Haumann et al., 2020 Southern Ocean “unexpectedly” cooled -0.34°C from 1982-2011
“Much of the Southern Ocean surface south of 55° S cooled and freshened between at least the early 1980s and the early 2010s [observation‐derived cooling of −0.34 ± 0.15 °C and freshening of −0.09 ± 0.01 PSU between 1982 and 2011]. Many processes have been proposed to explain the unexpected cooling, including increased winds or freshwater fluxes. However, these mechanisms so far failed to fully explain the surface trends and the concurrent subsurface warming (100 to 500 m). Here, we argue that these trends are predominantly caused by an increased wind‐driven northward sea‐ice transport, enhancing th extraction of freshwater near Antarctica and releasing it in the open ocean. … Antarctic sea‐ice changes thereby may have contributed to the slowdown of global surface warming over this period. Our conclusions are robust across all considered sensitivity cases, although the trend magnitude is sensitive to forcing uncertainties and the model’s mean state. It remains unclear whether these sea‐ice induced changes are associated with natural variability or reflect a response to anthropogenic forcing.”
Johansson et al., 2020 West Greenland as warm in the 1930s as the 2000s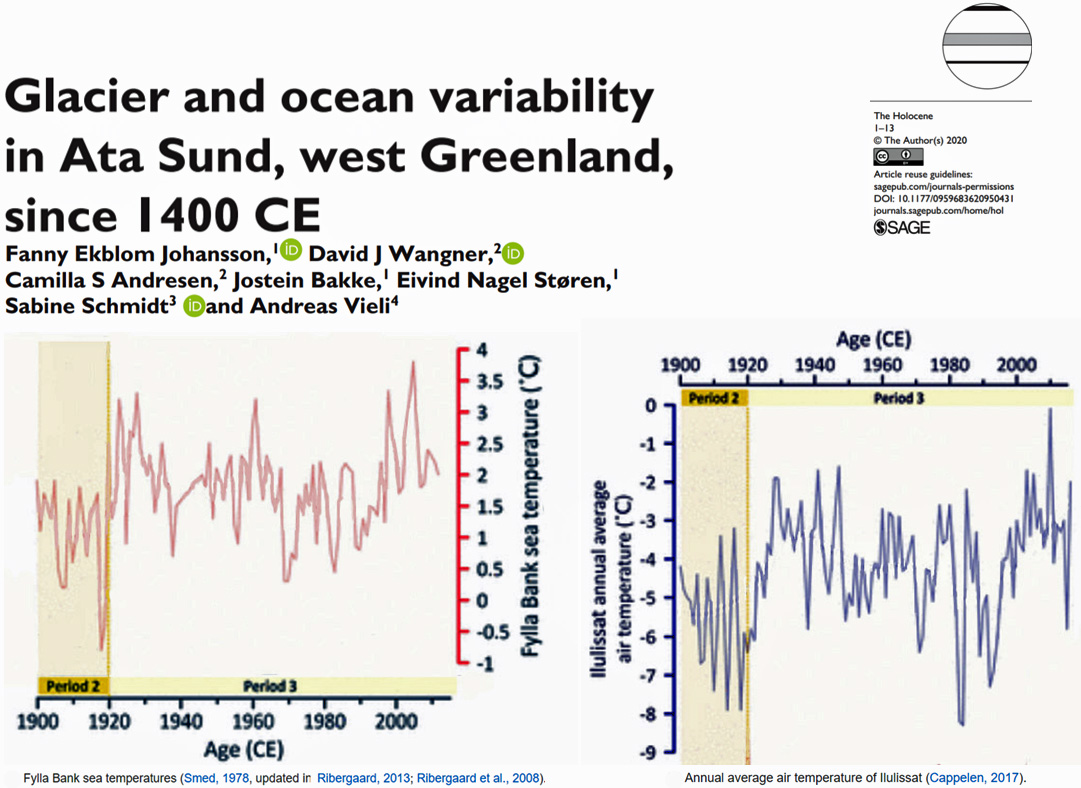
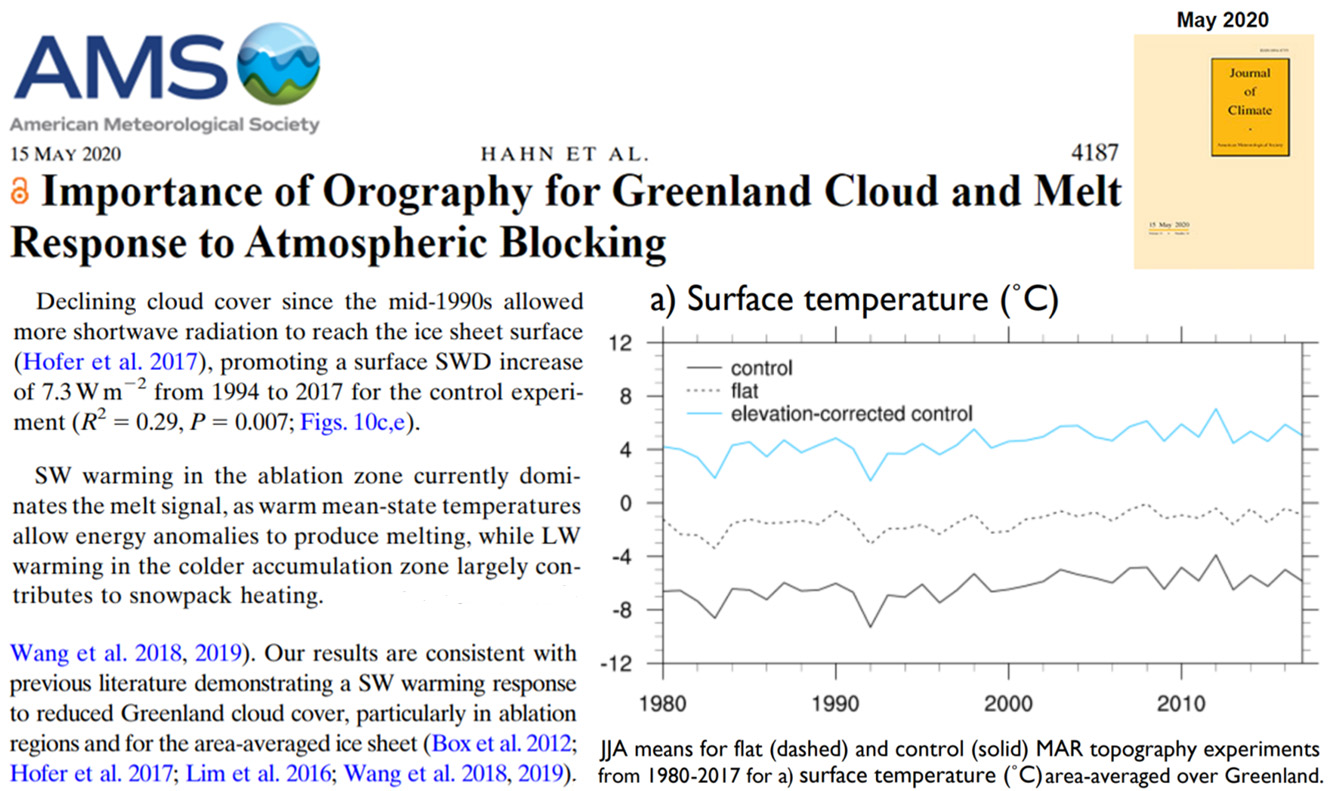
Hahn et al., 2020 Greenland non-warming since 2005
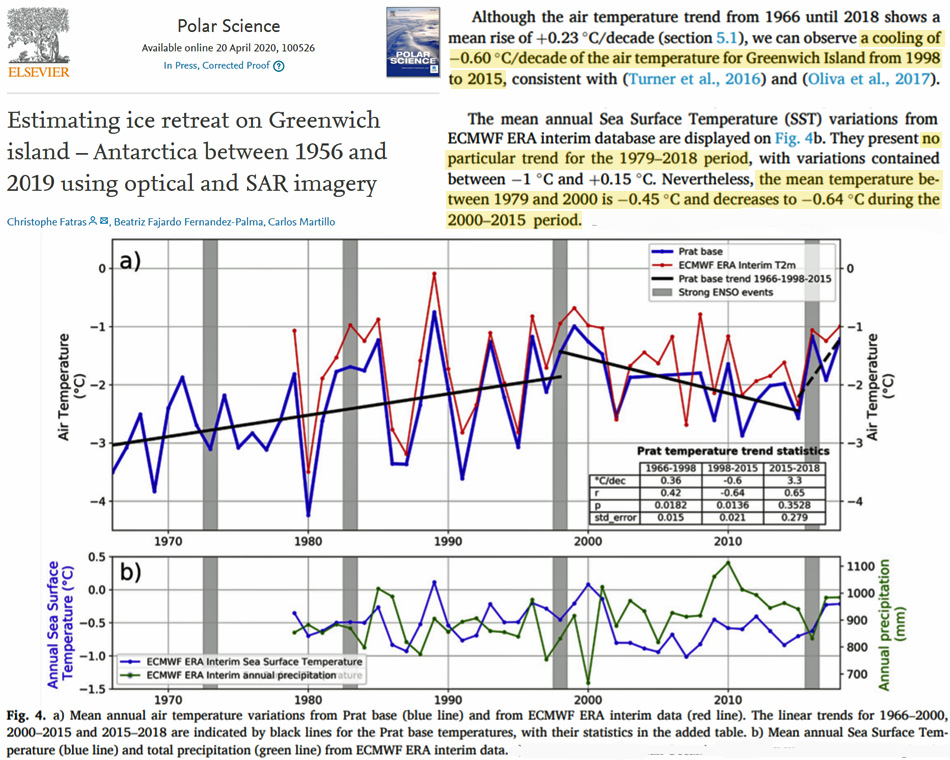
Fatras et al., 2020 Greenwich Island (Antarctica) cooling since 2000
“The mean annual Sea Surface Temperature (SST) variations from ECMWF ERA interim database are displayed on Fig. 4b. They present no particular trend for the 1979–2018 period, with variations contained between -1°C and +0.15°C. Nevertheless, the mean temperature between 1979 and 2000 is -0.45°C and decreases to -0.64°C during the 2000–2015 period.”
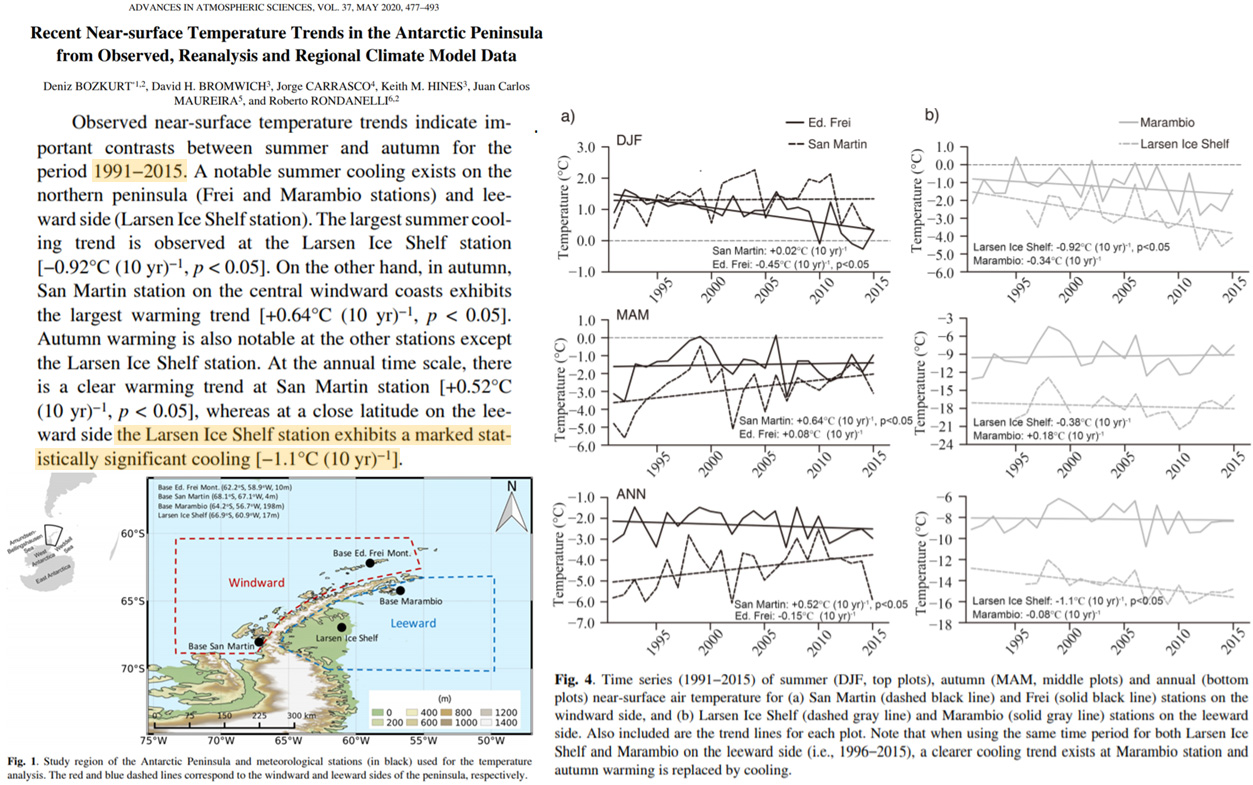
Bozkurt et al., 2020 Antarctic’s Larsen Ice Shelf cooling -1.1°C/decade since 1991
“Observed near-surface temperature trends indicate important contrasts between summer and autumn for the period 1991−2015. A notable summer cooling exists on the northern peninsula (Frei and Marambio stations) and leeward side (Larsen Ice Shelf station). The largest summer cooling trend is observed at the Larsen Ice Shelf station [−0.92°C (10 yr)−1, p < 0.05]. On the other hand, in autumn, San Martin station on the central windward coasts exhibits the largest warming trend [+0.64°C (10 yr)−1 , p < 0.05]. Autumn warming is also notable at the other stations except the Larsen Ice Shelf station. At the annual time scale, there is a clear warming trend at San Martin station [+0.52°C (10 yr)−1 , p < 0.05], whereas at a close latitude on the leeward side the Larsen Ice Shelf station exhibits a marked statistically significant cooling [−1.1°C (10 yr)−1].”
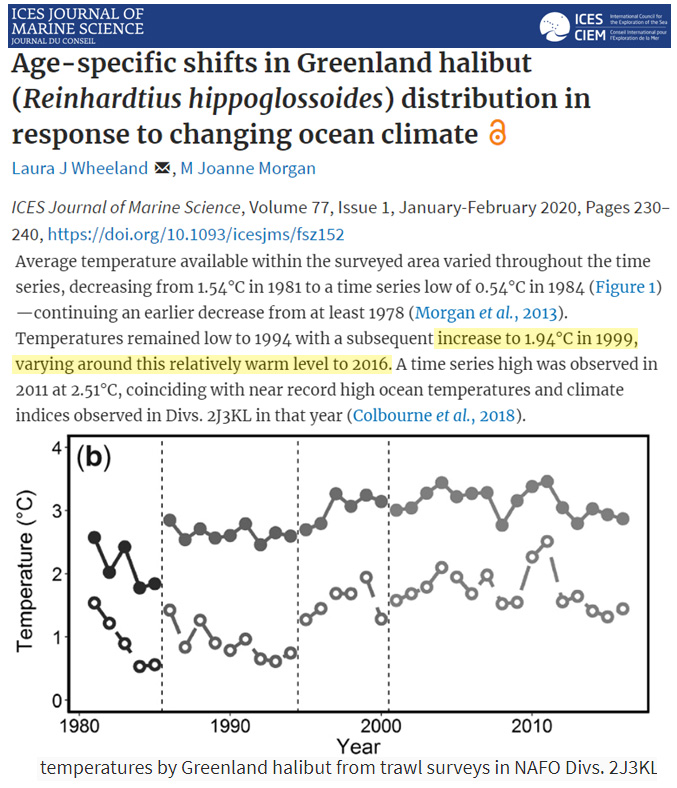
Wheeland and Morgan, 2020 Greenland no increasing temp trend 1999-2016
Huang et al., 2020 Some warming hiatuses (1989-2013) in China still ongoing
“After five to 15 years of temperature increases (decreases) following the abrupt changes, warming (cooling) hiatuses occurred in some areas of China, with the hiatus years occurring between 1989 and 2013. These hiatuses mainly occurred in 1998 and 2007, and in terms of proximity, the stations without warming (cooling) hiatuses were concentrated south of 40° N. After nine to 17 years of warming (cooling) hiatuses, the hiatuses ended at some stations between 2013 and 2017, after which the temperatures again increased rapidly. The periods of warming (cooling) hiatuses were longer in northern China than in southern China. Currently, there are some stations where the hiatuses have not ended, suggesting that the hiatus period is apparently longer than 17 years. The years of abrupt change, no abrupt change, hiatus, no hiatus, end of hiatus, and no end of hiatus, as well as their variation trends before and after these years, have shown strong spatial variability.”
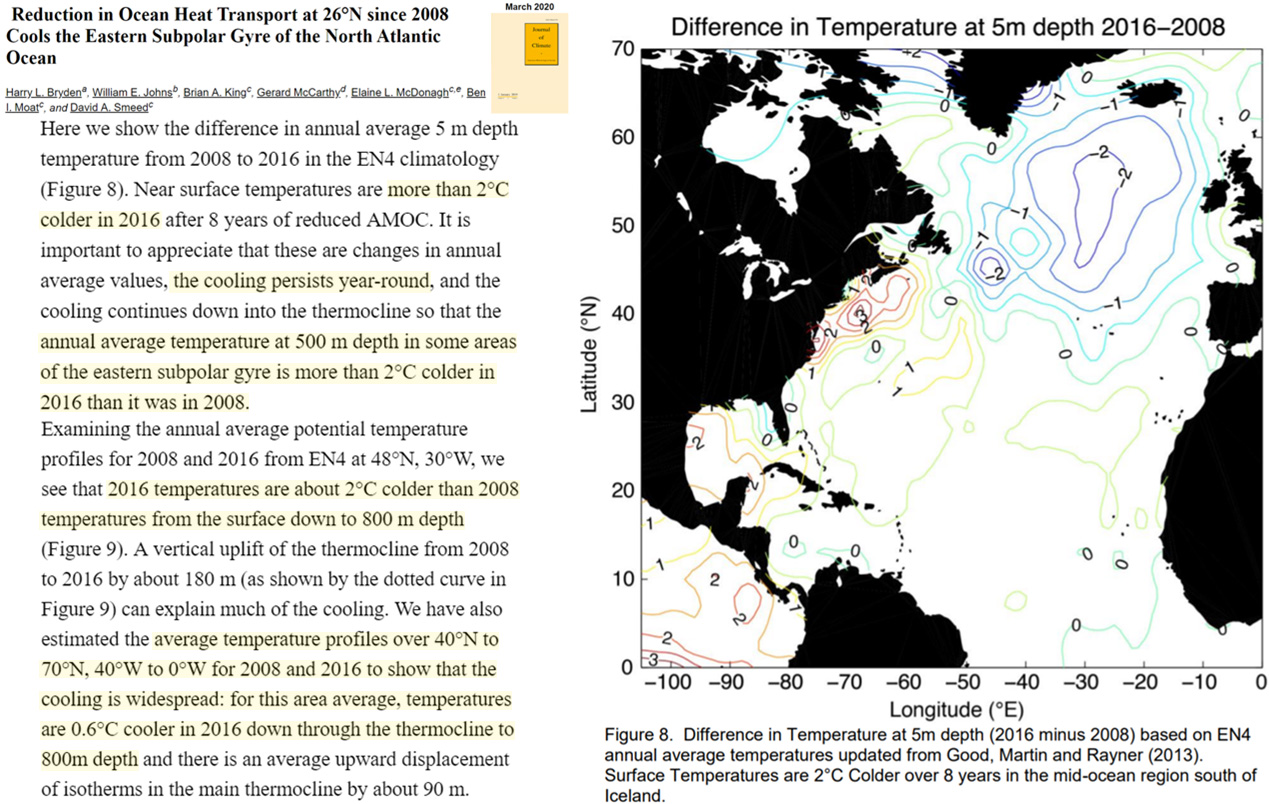
Bryden et al., 2020 North Atlantic cooled 2°C from 2008 to 2016
“Here we show the difference in annual average 5 m depth temperature from 2008 to 2016 in the EN4 climatology (Figure 8). Near surface temperatures are more than 2°C colder in 2016 after 8 years of reduced AMOC. It is important to appreciate that these are changes in annual average values, the cooling persists year-round, and the cooling continues down into the thermocline so that the annual average temperature at 500 m depth in some areas of the eastern subpolar gyre is more than 2°C colder in 2016 than it was in 2008. … Examining the annual average potential temperature profiles for 2008 and 2016 from EN4 at 48°N, 30°W, we see that 2016 temperatures are about 2°C colder than 2008 temperatures from the surface down to 800 m depth (Figure 9). A vertical uplift of the thermocline from 2008 to 2016 by about 180 m (as shown by the dotted curve in Figure 9) can explain much of the cooling. We have also estimated the average temperature profiles over 40°N to 70°N, 40°W to 0°W for 2008 and 2016 to show that the cooling is widespread: for this area average, temperatures are 0.6°C cooler in 2016 down through the thermocline to 800m depth and there is an average upward displacement of isotherms in the main thermocline by about 90 m. (Figure 10). … There is a broad region of decreased net ocean heat loss extending southwest to northeast from the Bahamas toward Iceland with differences as large as 20 W m¯². Error maps for 5-year average NOC heat fluxes indicate uncertainties of order 5 W m¯² in this region well sampled by ships of opportunity (Berry and Kent, 2011, updated to 2015) so we consider these decreased ocean heat losses to be significant.”
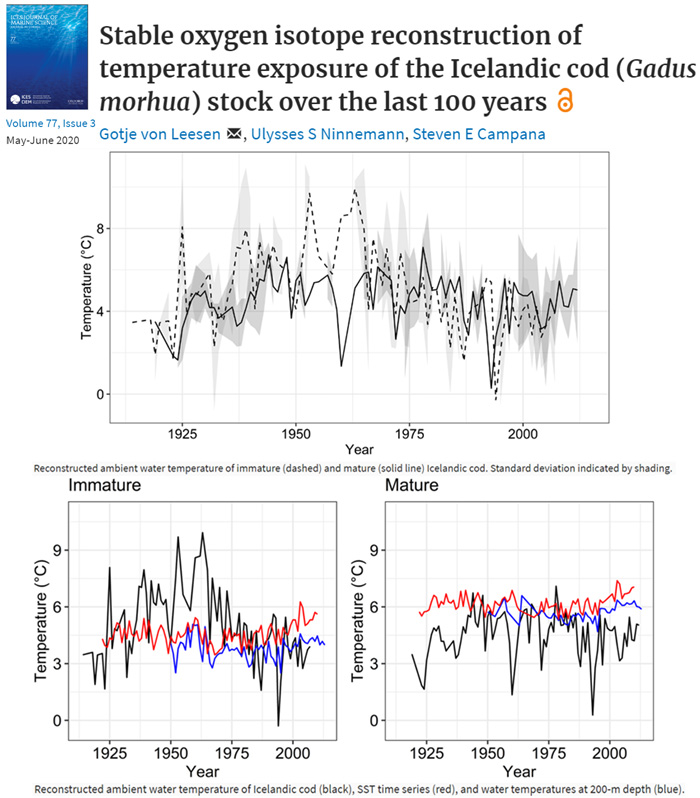
von Leesen et al., 2020 Iceland fishing waters cooling since the 1940s, 1950s
“Cod were exposed to changing temperatures during the last 100 years … The overall trend over time was the same for both life stages, but immature cod were exposed to warmer temperatures than mature cod until 1980, when the ambient temperature of juveniles decreased. Since then, mature and immature cod have experienced similar water temperatures. The mean ambient temperature of all samples was 4.8°C: 4.9°C (−0.8 to 11.7°C) for juveniles and 4.6°C (−1.7 to 10.6°C) for adults.”
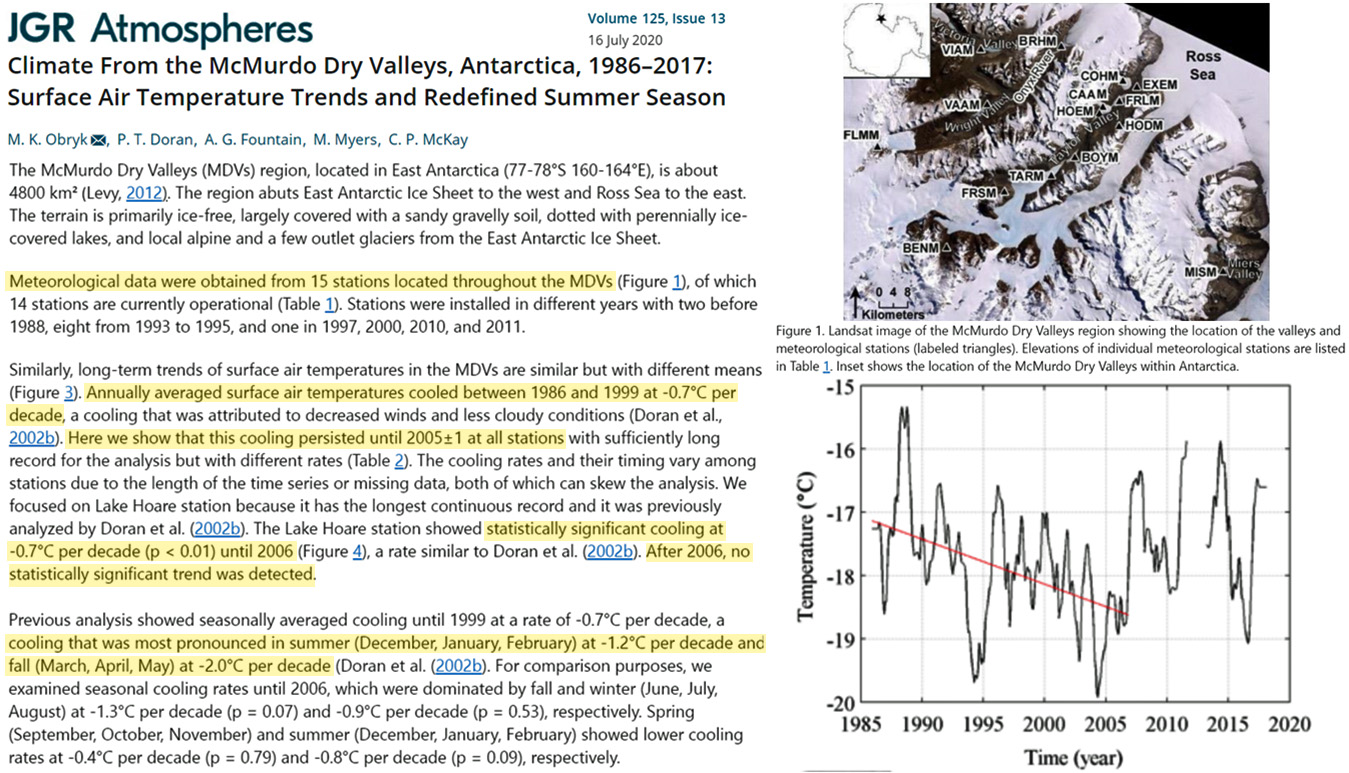
Obryk et al., 2020 East Antarctica cooling since 1986
“The McMurdo Dry Valleys (MDVs) region, located in East Antarctica (77-78°S 160-164°E), is about 4800 km2 [Levy, 2012]. … Annually averaged surface air temperatures cooled between 1986 and 1999 at -0.7°C per decade, a cooling that was attributed to decreased winds and less cloudy conditions [Doran et al., 2002b]. Here we show that this cooling persisted until 2005±1 at all stations with sufficiently long record for the analysis but with different rates (Table 2). The cooling rates and their timing vary among stations due to the length of the time series or missing data, both of which can skew the analysis. We focused on Lake Hoare station because it has the longest continuous record and it was previously analyzed by Doran et al. [2002b]. The Lake Hoare station showed statistically significant cooling at -0.7°C per decade (p < 0.01) until 2006 (Figure 4), a rate similar to Doran et al. [2002b]. After 2006, no statistically significant trend was detected. … Previous analysis showed seasonally averaged cooling until 1999 at a rate of -0.7°C per decade, a cooling that was most pronounced in summer (December, January, February) at -1.2°C per decade and fall (March, April, May) at -2.0°C per decade [Doran et al., 2002b]. For comparison purposes, we examined seasonal cooling rates until 2006, which were dominated by fall and winter (June, July, August) at -1.3°C per decade (p = 0.07) and -0.9°C per decade (p = 0.53), respectively. Spring (September, October, November) and summer (December, January, February) showed lower cooling rates at -0.4°C per decade (p = 0.79) and -0.8°C per decade (p = 0.09), respectively.”
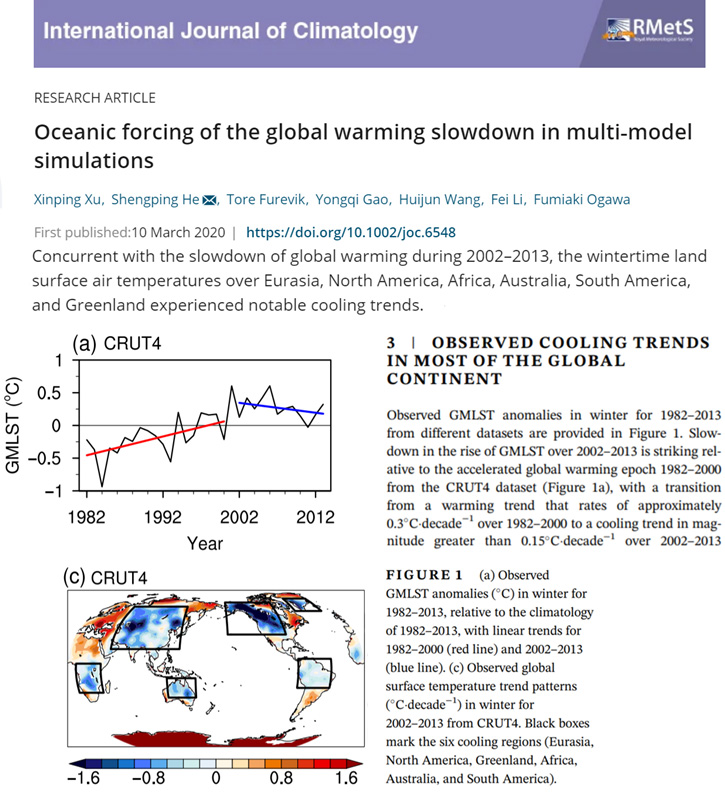
Xu et al., 2020 “Observed cooling trends in most of the global continent”
“Concurrent with the slowdown of global warming during 2002–2013, the wintertime land surface air temperatures over Eurasia, North America, Africa, Australia, South America, and Greenland experienced notable cooling trends. … The slowdown concurs with a negative phase of the Pacific Decadal Oscillation (PDO), indicating that PDO plays an important role in modulating the global warming signal. Not all ensemble members capture the cooling trends over the continents, suggesting additional contribution from internal atmospheric variability.”
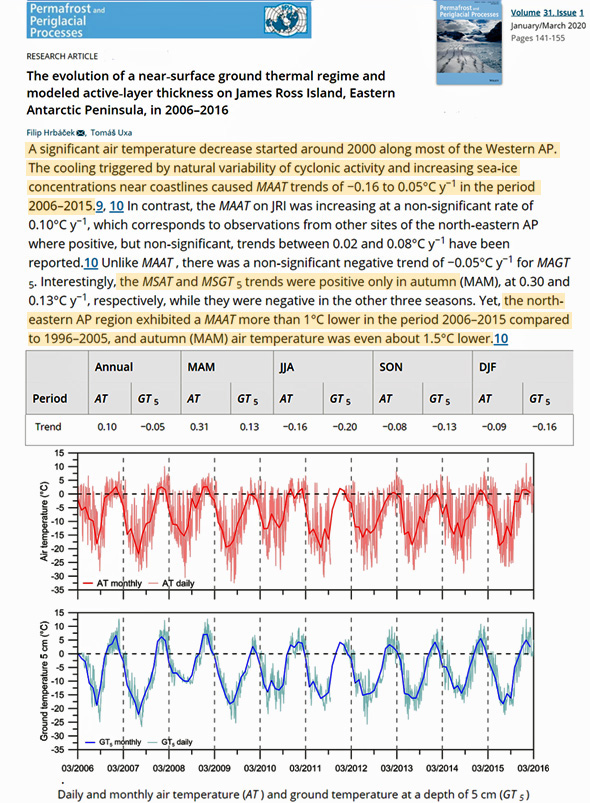
Hrbáček and Uxa, 2020 Eastern Antarctic Peninsula temps “1°C lower” in 2006-2015 vs. 1996-2005
“A significant air temperature decrease started around 2000 along most of the Western AP. The cooling triggered by natural variability of cyclonic activity and increasing sea‐ice concentrations near coastlines caused MAAT trends of −0.16 to 0.05°C y−1 in the period 2006–2015. In contrast, the MAAT on JRI was increasing at a non‐significant rate of 0.10°C y−1, which corresponds to observations from other sites of the north‐eastern AP where positive, but non‐significant, trends between 0.02 and 0.08°C y−1 have been reported.10 Unlike MAAT , there was a non‐significant negative trend of −0.05°C y−1 for MAGT 5. Interestingly, the MSAT and MSGT 5 trends were positive only in autumn (MAM), at 0.30 and 0.13°C y−1, respectively, while they were negative in the other three seasons. Yet, the north‐eastern AP region exhibited a MAAT more than 1°C lower in the period 2006–2015 compared to 1996–2005, and autumn (MAM) air temperature was even about 1.5°C lower.”
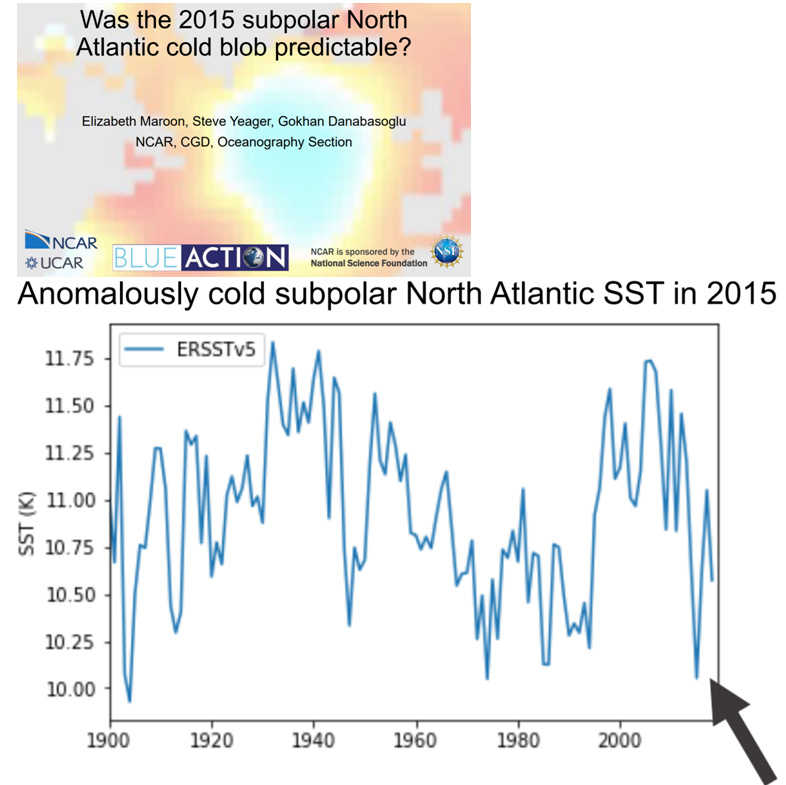
Maroon et al., 2020 Recent cooling subpolar North Atlantic – no net warming since 1900
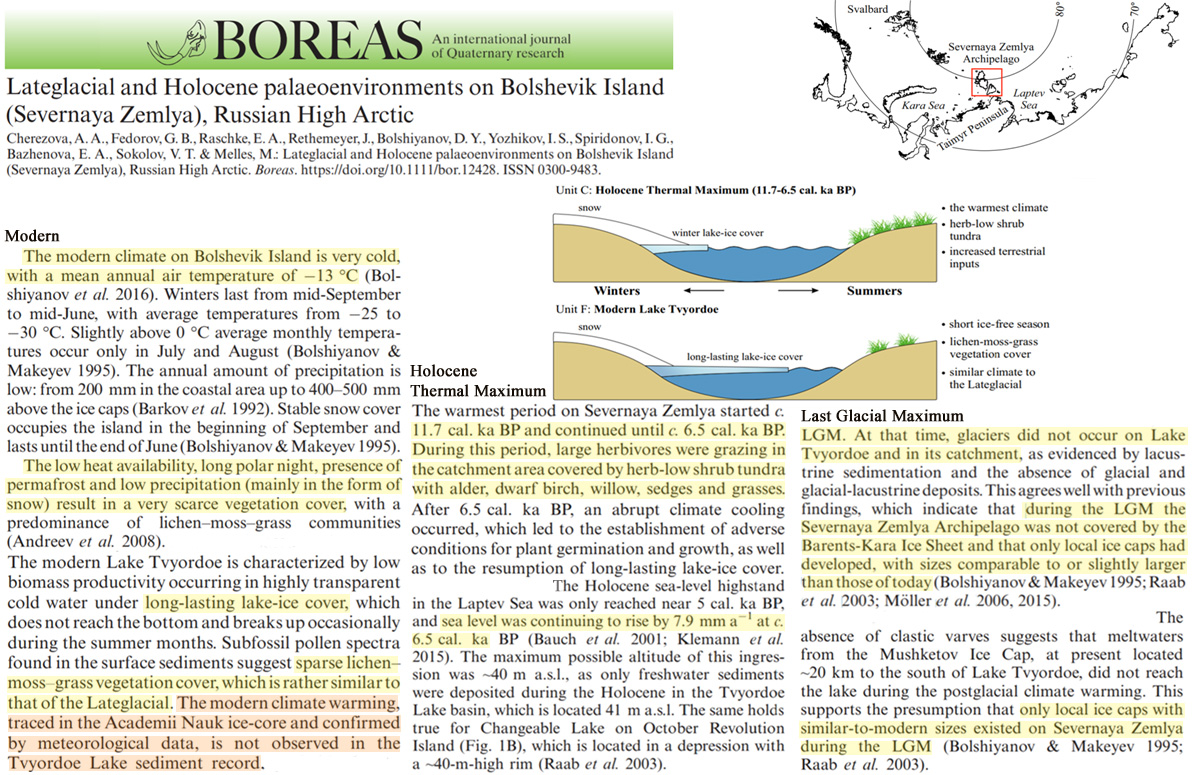
Cherezova et al., 2020 Russian High Arctic ice caps same size now as the last glacial, “modern climate warming…not observed”
“[L]ocal ice caps with similar-to-modern sizes existed on Severnaya Zemblya during the LGM [Last Glacial Maximum]. … The modern climate warming, traced in the Academii Naauk ice-core and confirmed by meteorological data, is not observed in the Tvyordoe Lake sediment record. … The pollen spectra in these deposits are characterized by the predominance of Poaceae and Cyperaceae pollen, with high amounts of shrub birch and willow pollen. This supports the suggestion of Bolshiyanov & Makeyev (1995) that the warmest and most humid environmental conditions occurred on the archipelago during the Early Holocene.”
Williams et al., 2020 “Recent cooling” in Greenland, stability in mass balance since 2012
“Dynamic response of the Greenland ice sheet to recent cooling … From 2013 to 2019 however, we observe an acceleration in ice motion coincident with atmospheric cooling and a ~15% reduction in mean surface melt production relative to 2003–2012. … Since the record surface melt in 2012, a period of relative stability in mass balance has been observed across Greenland, with 2017 having the lowest maximum surface melt extent since 1996. This stability is coincident with positive Arctic and North Atlantic Oscillations, promoting cyclonic conditions thereby reducing incoming solar radiation and enhancing precipitation.”
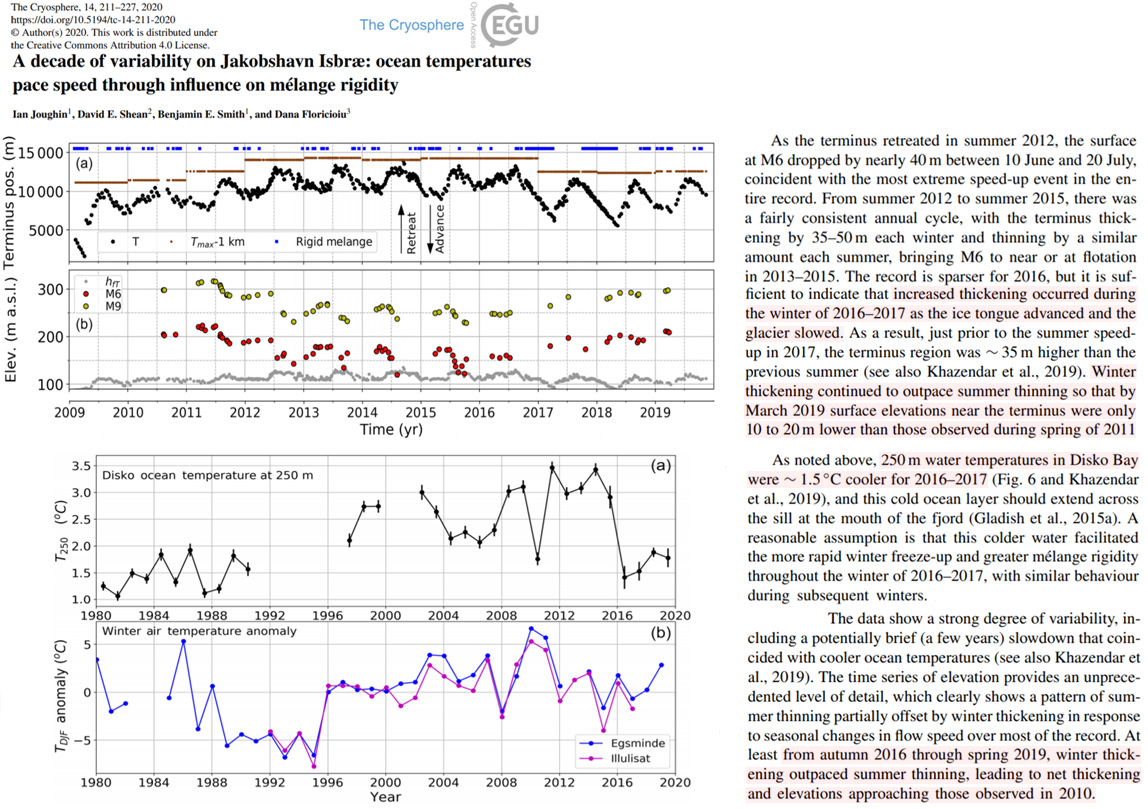
Joughin et al., 2020 Recent cooling where Jakobshavn glacier (Greenland) advancing, thickening
“With this slowdown, the terminus region transitioned from net annual thinning to net annual thickening (Khazendar et al., 2019). This slowdown coincided with a period of increased surface mass balance and cooler atmospheric and ocean temperatures (Joughin et al., 2018; Khazendar et al., 2019; Mouginot et al., 2019). … The record is sparser for 2016, but it is sufficient to indicate that increased thickening occurred during the winter of 2016–2017 as the ice tongue advanced and the glacier slowed. As a result, just prior to the summer speedup in 2017, the terminus region was ∼ 35 m higher than the previous summer (see also Khazendar et al., 2019). Winter thickening continued to outpace summer thinning so that by March 2019 surface elevations near the terminus were only 10 to 20 m lower than those observed during spring of 2011 (Fig. 2b). … The time series of elevation provides an unprecedented level of detail, which clearly shows a pattern of summer thinning partially offset by winter thickening in response to seasonal changes in flow speed over most of the record. At least from autumn 2016 through spring 2019, winter thickening outpaced summer thinning, leading to net thickening and elevations approaching those observed in 2010.”
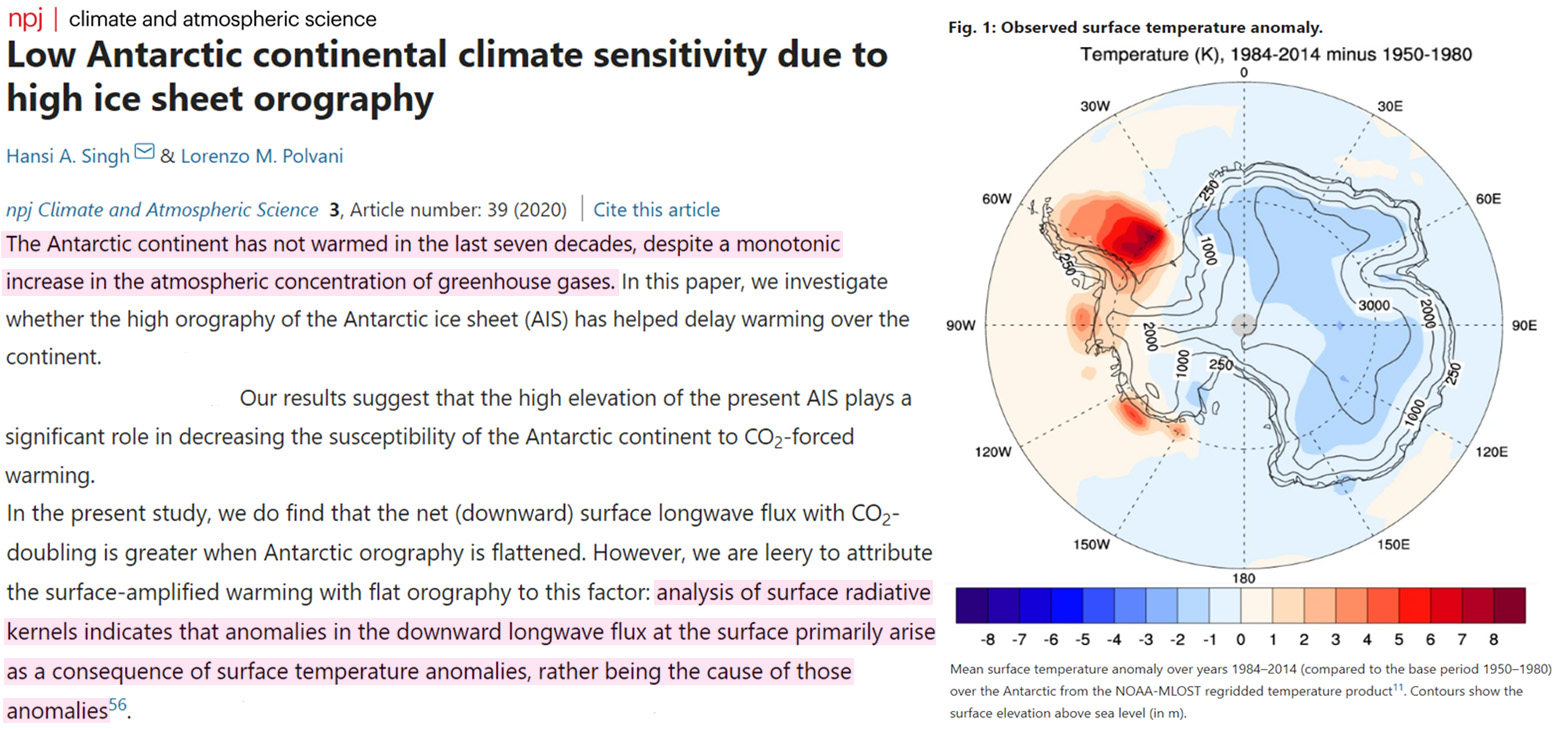
Singh et al., 2020 “The Antarctic continent has not warmed in the last seven decades”
“Low Antarctic continental climate sensitivity due to high ice sheet orography … The Antarctic continent has not warmed in the last seven decades, despite a monotonic increase in the atmospheric concentration of greenhouse gases.”
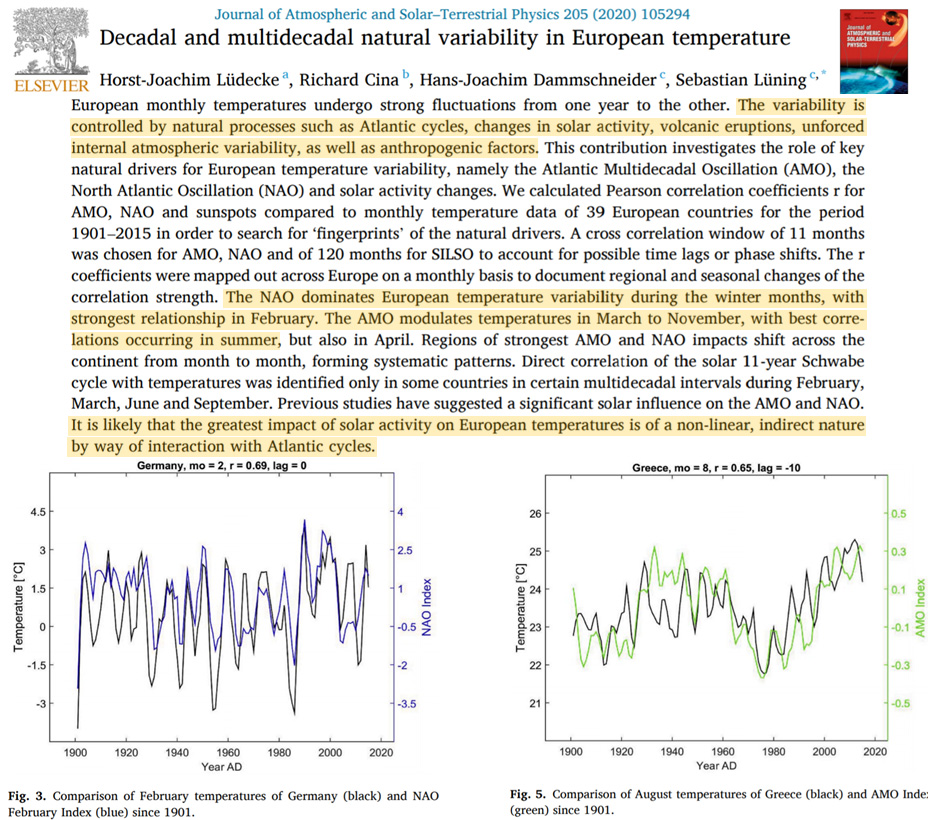
Lüdecke et al., 2020 No net warming in Germany, Greece since 1900
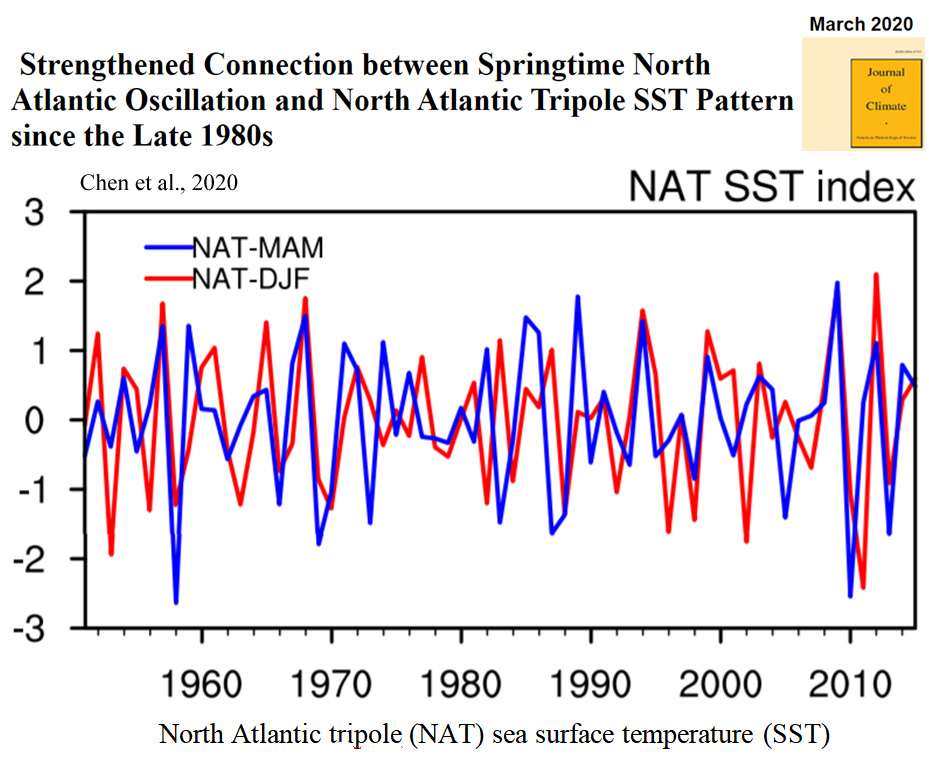
Chen et al., 2020 No net SST spring/winter warming, North Atlantic, since 1960s
“This study reveals a marked enhancement in the relationship between the North Atlantic Oscillation (NAO) and North Atlantic tripole (NAT) sea surface temperature (SST) anomaly pattern during boreal spring since the late 1980s. A comparative analysis is conducted for two periods before and after the late 1980s to understand the reasons for the above interdecadal change. During both periods, SST cooling in the northern tropical Atlantic during the positive phase of the NAT SST pattern results in an anomalous anticyclone over the subtropical western North Atlantic via a Rossby wave–type atmospheric response.”
Holocene Temperatures Degrees Warmer Than Today
Martin et al., 2020 France max Holocene temps (14°C) were 7°C warmer than the modern value (7°C)
“Modern climatic parameters were obtained from the instrumental database of Meteo-France at the nearby station of Mazet-Volamont (1130 m) located 11 km distant, for the period 2009-2017 … Temperature values were corrected using a lapse rate of 0.6°C/ 100 m. Mean annual temperatures vary between 6 and 9°C with a mean value of 7°C. … The mean annual temperature for the entire Holocene was 11.3°C, i.e. 4.1°C above the modern value. The maximum of 14°C and a minimum of 7.6°C were reached, respectively, at 7.8 and 1.7 kyr cal BP. … The last 200 years display an opposite trend … MAAT decreased by 3.1 and 3.3°C for the lake calibrations, Sun et al. (2011) and Russell et al. (2018), respectively, and 2.1°C for the soil calibration.”
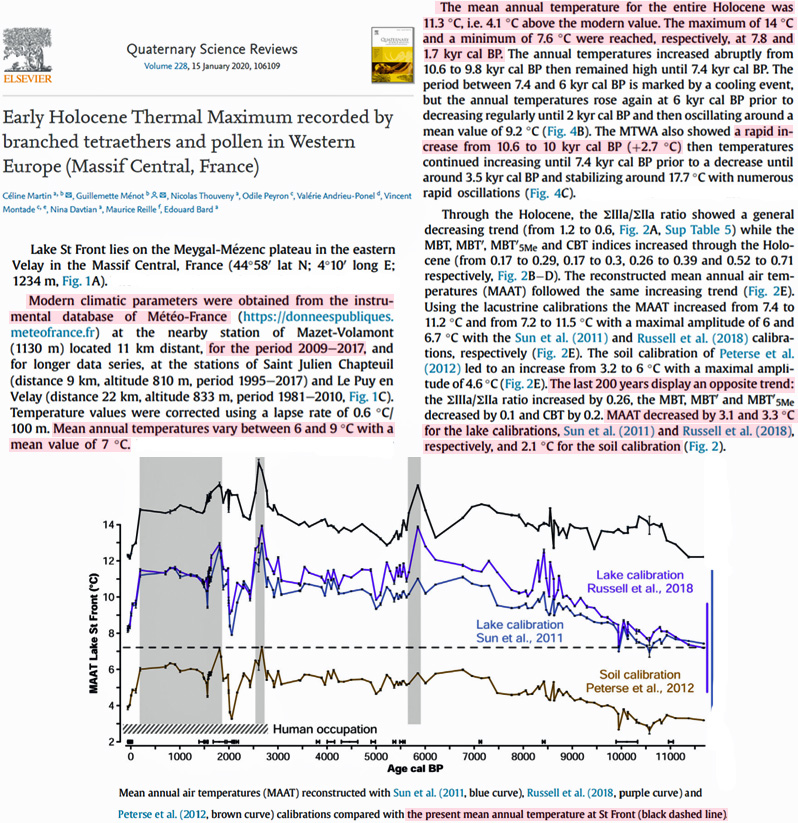
Bas et al., 2020 Southern South America SSTs 4-5°C “warmer than today”
“According to a diversity of proxies, climate and SST during the Middle Holocene in the southernmost tip of South America were warmer than today (Bujalesky 2007; Shevenell et al. 2011; Caniupán et al. 2014). Currently, annual average SST of Tierra del Fuego is 7 °C (Rivas 2010), but was as high as 11–12 °C at 53 °S during the Middle Holocene (Caniupán et al. 2014).”
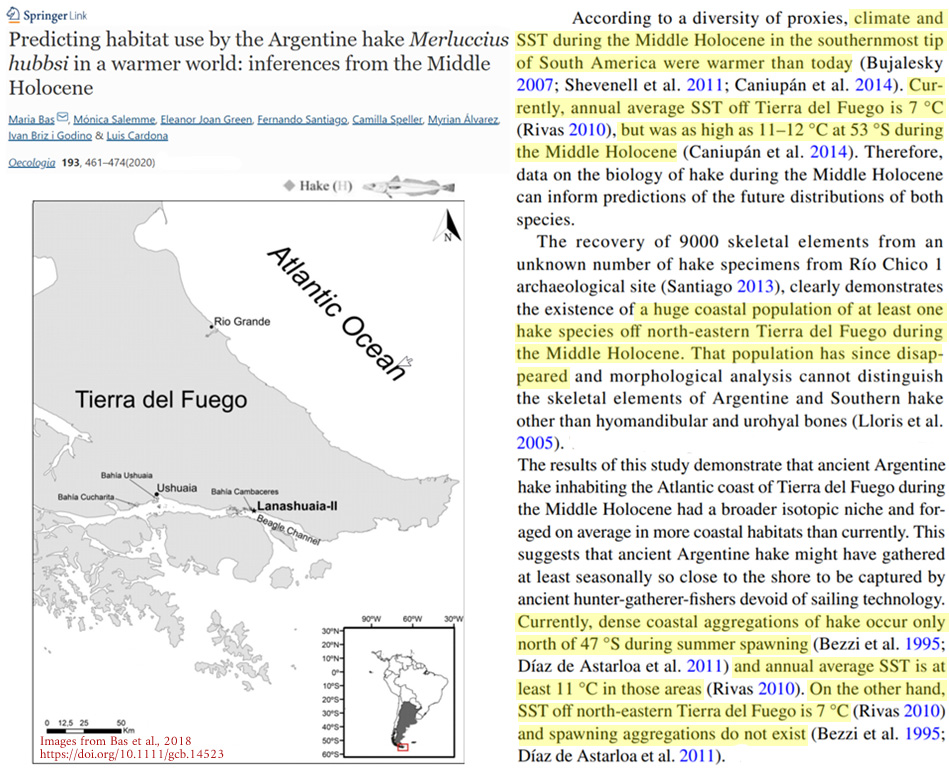
Lopez-Saez et al., 2020 Spain temps “even higher than the current ones” when Holocene began
“The early Holocene ~11.7-11.45 ka cal BP is characterized at Navamuno by a rise in the Tann [mean annual temperature] values compared to the previous ~ Younger Dryas stadial (Fig. 6), clearly showing the progressive warming that occurred at the onset of the Holocene with values even higher than the current ones.”
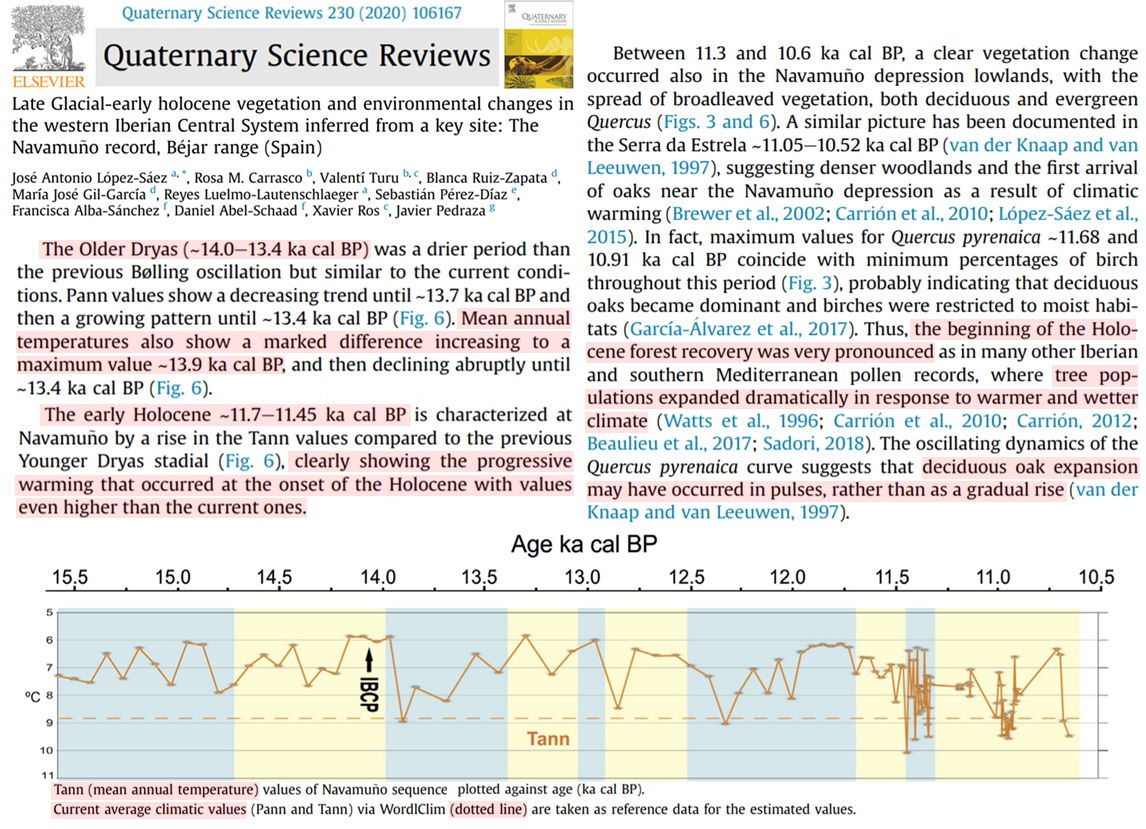
Geirsdóttir et al., 2020 Iceland “~3-4°C above modern”
“Quantitative temperature reconstructions derived from lake sediment proxies and glacier modeling simulations place peak HTM summer warmth at ∼3–4 °C above modern in Iceland (Flowers et al., 2008; Anderson et al., 2018; Harning et al., 2020b)”
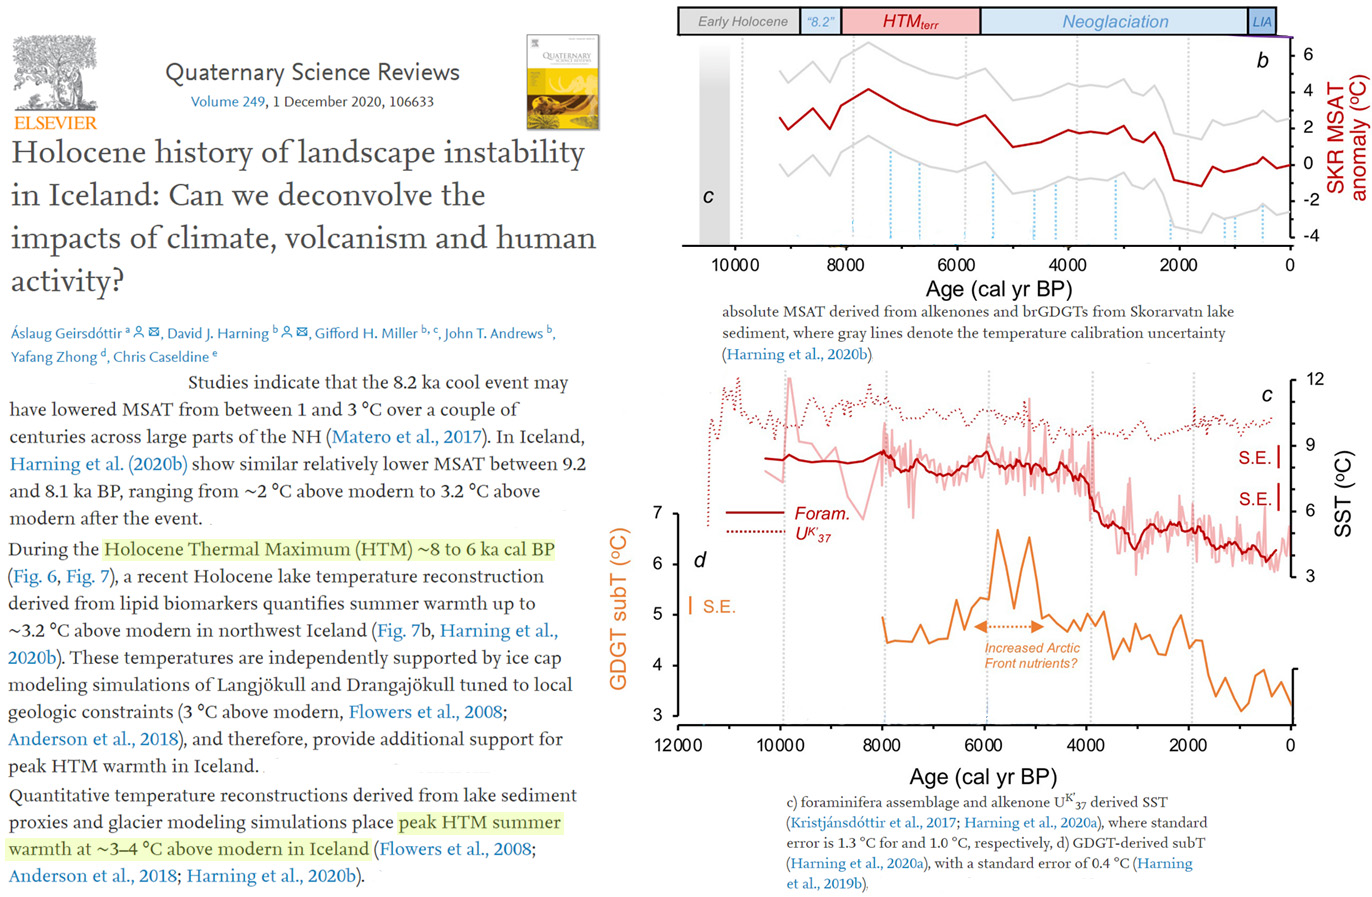
Bayat et al., 2020 Iran peak warming 5.7°C higher than present (19.9 vs. 14.2°C)
“Application of a regression model, yielded from data of Holocene carbonates in the soils of North America, for these carbonates show formation temperatures between 12.7 and 15.7 ˚C with a dominant around 15˚C (Table 3). These temperatures are close to present temperature of Shahrekord (~12.7 ˚C) to maximum 3 ˚C warmer than present temperatures. … The results of palaeotemperature estimation reveal the Holocene temperatures between 13.06 and 19.93 ˚C. According to present temperature of the region (~14.2 ˚C), it is likely that at least some of the carbonates have not formed in thermal equilibrium with environment and oxygen isotopes have enriched.”
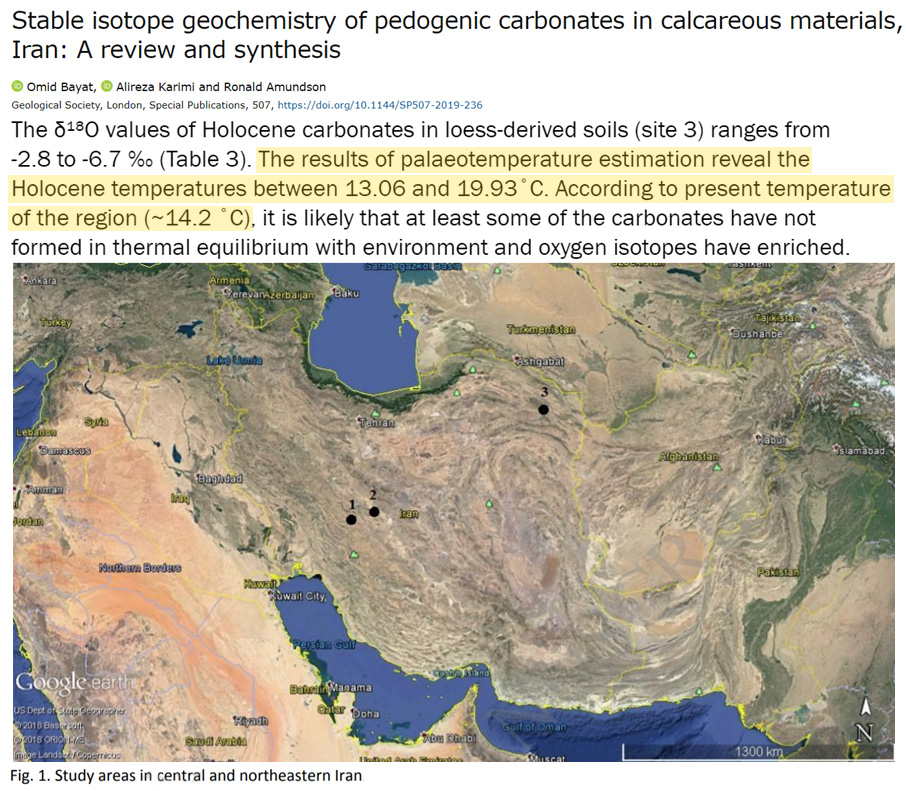
Lasher et al., 2020 NW Greenland temps “7°C higher than preindustrial”
“[P]eak temperatures during the Holocene Thermal Maximum (HTM) differed in both timing and magnitude. HTM temperatures up to 7°C higher than pre-industrial averages near northwest Greenland appear to have occurred early (Axford et al., 2019; Lecavalier et al., 2017; McFarlin et al., 2018), causing significant thinning of the ice sheet in the early Holocene (Vinther et al., 2009).”
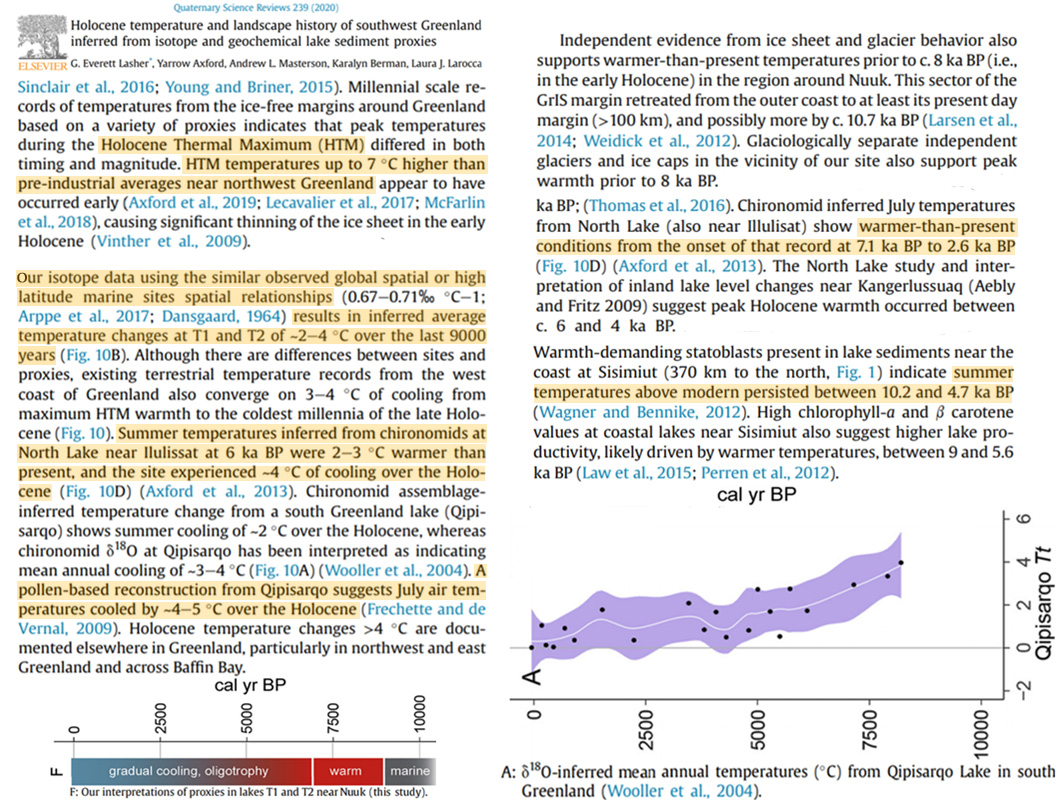
Wu et al., 2020 Beaufort Sea 4°C warmer, “dominantly ice-free” Early Holocene
“In the early Holocene, i.e., prior to the first HBI-III peak, it was nearly ice free throughout the year, reflected in very low PIP25 values < 0.2 and variable SSTs (Fig. 7a, c). Then, a general trend toward an increasing sea-ice cover is coinciding with weakened insolation. … Higher values of HBI TR25 may point to enhanced occurrence of spring blooms between 8 and 5 kyr BP, indicating that the core site was relatively ice free in spring. … During the early Holocene … both the foraminifera study and our biomarker records (Fig. 7c) display more open-water conditions in comparison to the modern Beaufort Sea. … During the deglaciation and the early Holocene (~14–8 kyr BP), minimum concentrations of IP25 (close to the detection limit) and low PIP25 values point to dominantly ice-free conditions.”
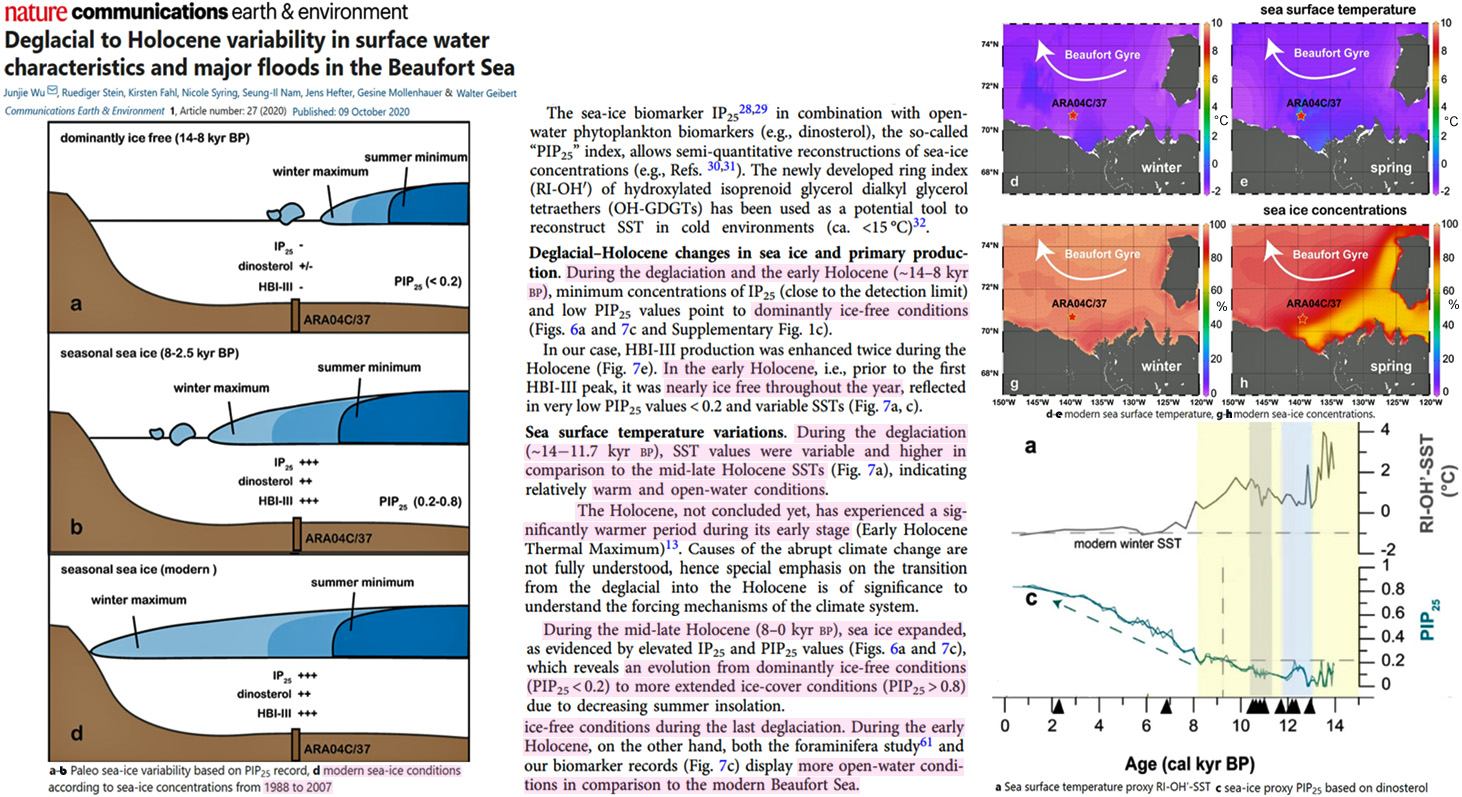
Gebbie, 2020 Modern global ocean heat 1/3rd of what’s required to reach Medieval levels
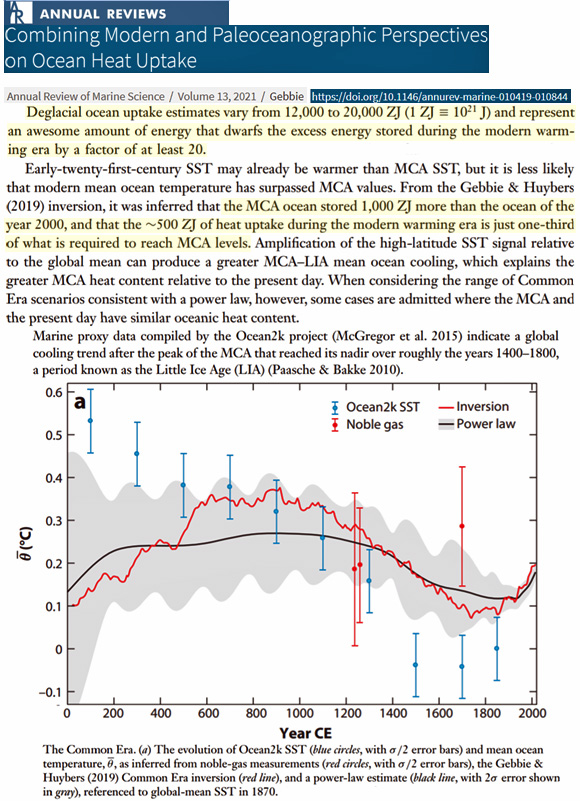
Ilyashuk et al., 2020 NW Germany ~3°C warmer 80,000 yrs ago (MIS 5a, glacial)
“A subdivision of the MIS 5a interstadial into two very different climatic regimes is evident in the beetle (Coleoptera) record from Oerel, northwest Germany (Behre et al., 2005). Mild climate conditions with both summer (ca. 19 °C) and winter (2–4 °C) temperatures above present-day values (ca. 16 °C and ca. 1 °C for July and January, respectively) are recorded during the early part of the interstadial.”
Găinuşă-Bogdan et al., 2020 Northern high latitudes “considerably warmer than today”
“The mid-Holocene (MH: 6000 years Before Present) is a period for which reconstructions suggest a mean climate of the northern high latitudes that was considerably warmer than today in summer (Fischer et al. 2018), due to a different insolation forcing (Fig. 1). This is an interesting climate period, when the Sahara is suspected to have been greener than today (Claussen and Gayler 1997). … The mid-Holocene (6000 years before present) was a warmer period than today in summer in most of the Northern Hemisphere.”
Wang et al., 2020 Japan temps warmer than present (22°C) for last 5500 years (CO2 ~280-380 ppm)
“Results of palaeo-CO2 concentration reconstructed from the stomatal analysis indicate palaeo-CO2 fluctuation between 317 and 352 ppmv during the Middle–Late Holocene, which was more variable and higher than Greenland and Antarctic ice-core records … Fluctuation is generally consistent with alkenone-based sea surface temperature (SST) of Mutsu Bay situated at ~300 km north of Mt. Kurikoma, which was higher than the present temperature (22 °C) in the Middle and early Late Holocene.”
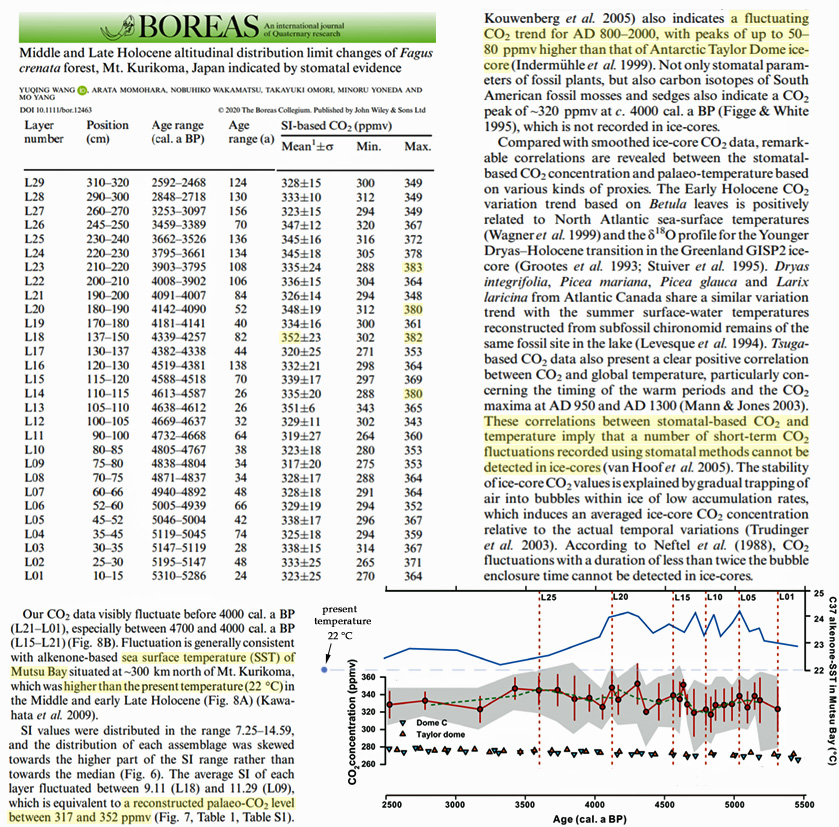
Gomes et al., 2020 Iberian SSTs 8°C warming in <100 years, Early Holocene 5°C warmer
“A sudden warming episode (in <100 years), of ~8 °C in core D13882 marks the onset of the Holocene. The maximum Holocene sea surface temperature of 19.5 °C is observed at around 11,400 cal yr BP. The sea surface conditions on the southwest Iberian shelf along the Holocene are fairly stable during the Holocene (Fig. 4a). However, a long-term and gradual decrease of SST is detected across the Holocene (~5 °C), with a maximum (~19.5 °C) during the Early Holocene and a minimum of 14.6 °C at 640 cal yr BP.”
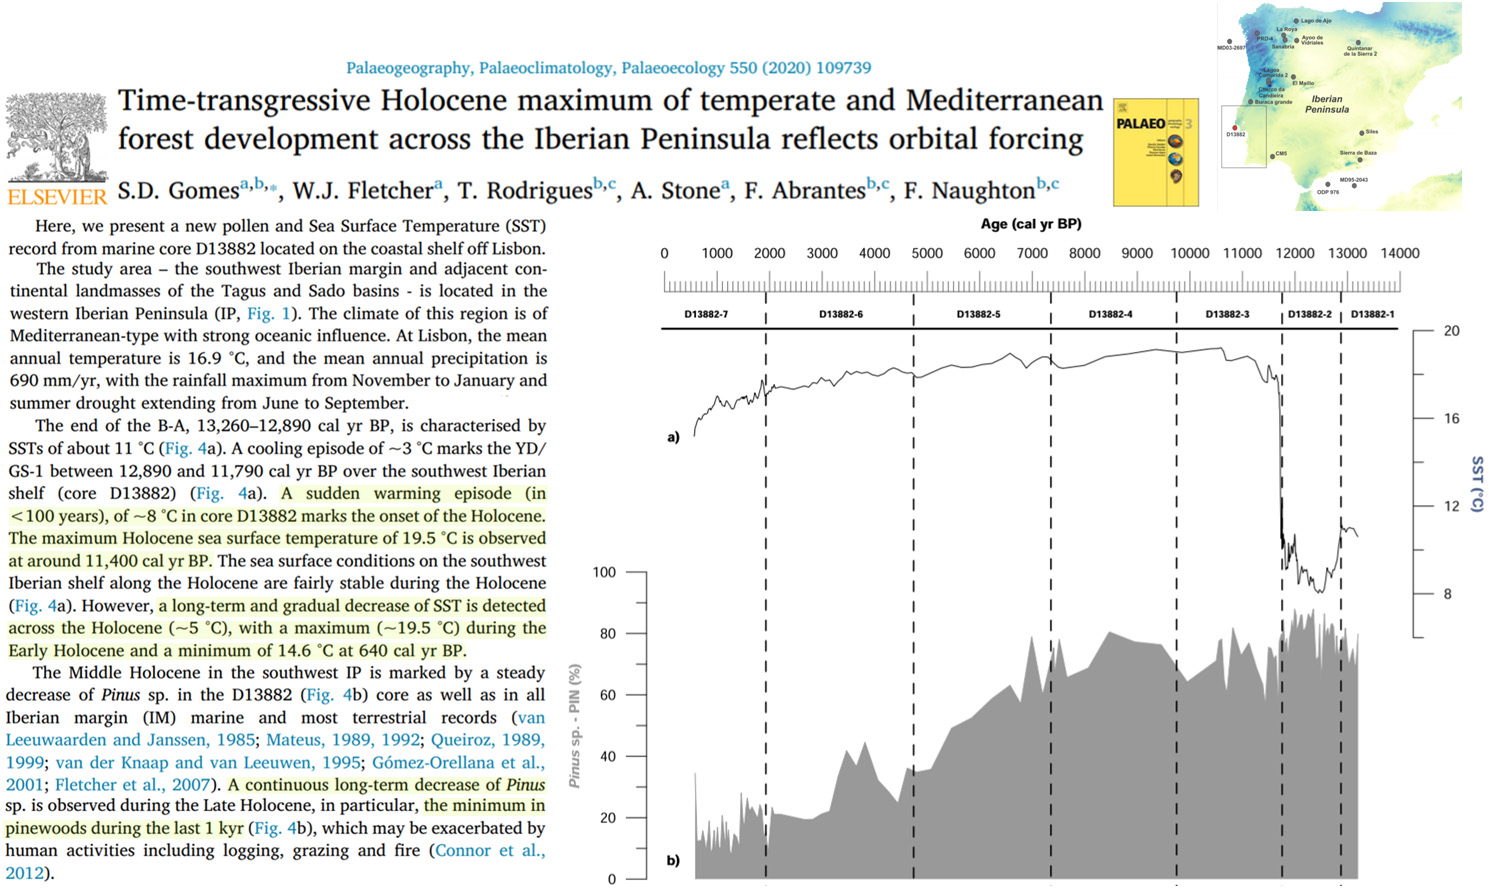
Davis et al., 2020 Western North Pacific peak SSTs up to 6°C warmer (23°C vs. 17°C)
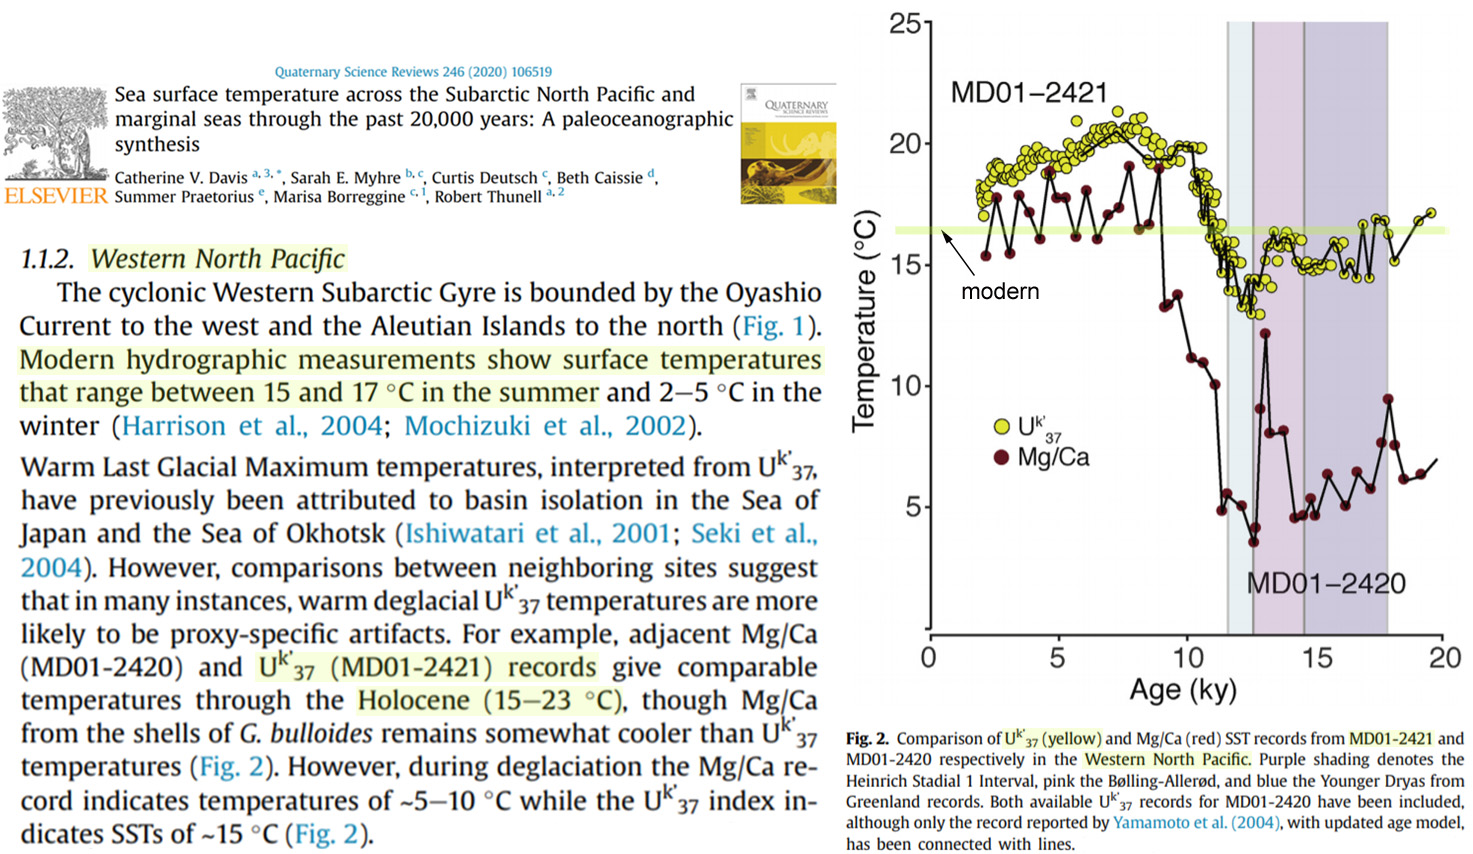
Pearson et al., 2020 West Coast New Zealand SSTs “1.5 – 3°C warmer than today”
“The Holocene climatic optimum (HCO) was characterised by mean annual temperatures of between 1.5–3 °C warmer than today (Wilmshurst et al., 2007). A sea surface temperature reconstruction off the west coast of New Zealand in the Tasman Sea (Figure 5.7 g) (Barrows et al., 2007) shows a peak of 17.3 °C at 11,220 years BP, the highest temperature observed through the entire record, for comparison, at 50 years BP, Tasman Sea surface temperature was 15 °C (Barrows et al., 2007).”
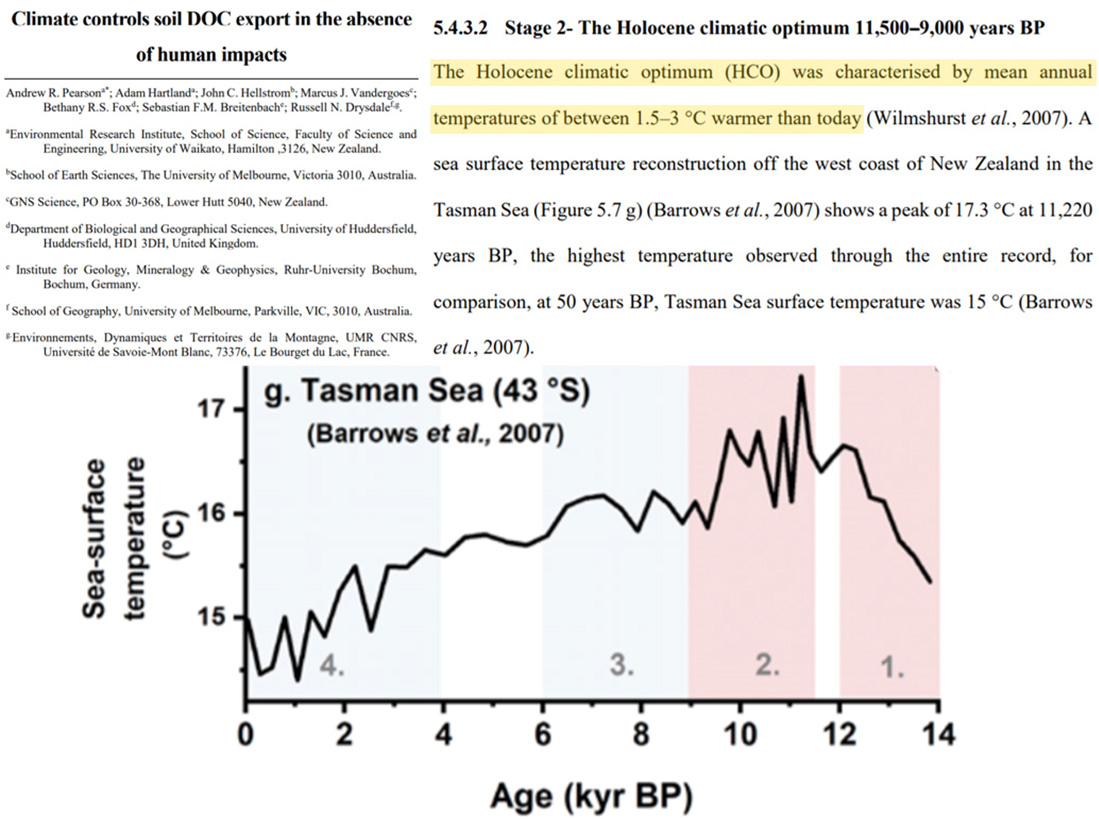
Conti et al., 2020 Scotland lake summer temps 6.8°C warmer (~20°C vs. 13.2°C) 5600-5900 yrs ago
“Notably, in this setting where the proxy should be most accurate, SSTs are remarkably similar to the present‐day average SST of Orkney, ranging from 7.1 °C in March to 13.2 °C in August, giving an average yearly temperature of 10.1 °C (https://www.seatemperature.org/europe/united-kingdom/orkney.htm). A proxy developed for freshwater lake sediments based on brGDGTs (Pearson et al., 2011; Table S4) was applied to the freshwater samples (from 197 to 118 cm). The results show a reconstructed summer lake temperature of 18.6–21.4 °C [~5939–5612 BP]. … The proxy‐calculated SST suggests a cooling trend towards values close to present‐day water temperatures at 77, 38 and 14 cm (13.1–10.5 °C, ± 4 °C).”
Liu et al., 2020 Central China 3-4°C warmer (Mid-Holocene)
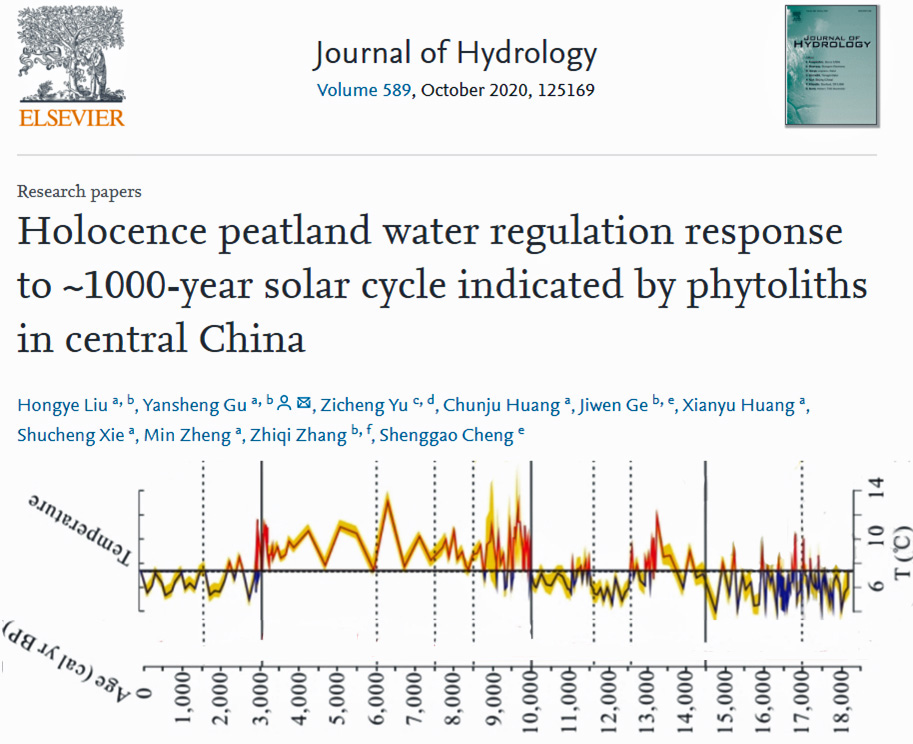
Kraaij et al., 2020 S. Africa “3-4°C higher than present in summer”, 10x more fire during last ice age (190 ppm CO2)
“We found that the severity of fire weather during the LGM [last glacial maximum, 19-26 ka BP] across the PAP was significantly higher than present … [T]he number of days per annum with high or higher fire danger scores was almost an order of magnitude larger during the LGM [last glacial maximum, 19-26 ka BP] than under contemporary conditions along the coast … Our analyses showed that LGM [last glacial maximum, 19-26 ka BP] daily maximum temperatures were 3-4°C higher than present in summer (and 2-4°C lower than present in winter), which would have contributed to the high severity of fire weather during LGM summers”
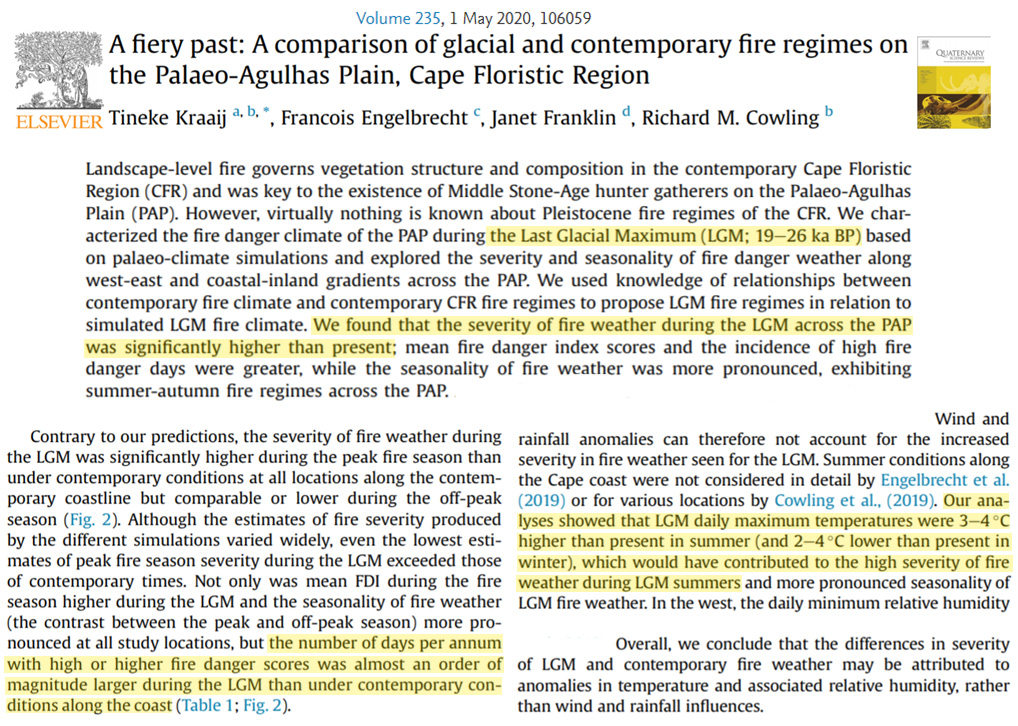
Baumer et al., 2020 Laptev Sea (Arctic) “4°C warmer than today” Early Holocene
“Pollen-based climate reconstructions from the Laptev Sea region inferred temperatures 4 °C warmer than today for the interval 11.5–8.4 cal. ka BP (Andreev et al. 2011), corresponding to the Holocene Thermal Maximum (HTM) at Lake Emanda at 11.5–9.0 cal. ka BP and at Lake El’gygytgyn at 11.4–7.6 cal. ka BP (Swann et al. 2010).”
Hou et al., 2020 W. Tropical Atlantic 1-5°C warmer throughout last ice age (190 ppm CO2)
“Our results indicate a lack of pronounced glacial-interglacial variability in the SST record, prompting us to exclude atmospheric pCO2 as a direct driver of SST variations in the southern WTA [western tropical Atlantic].”
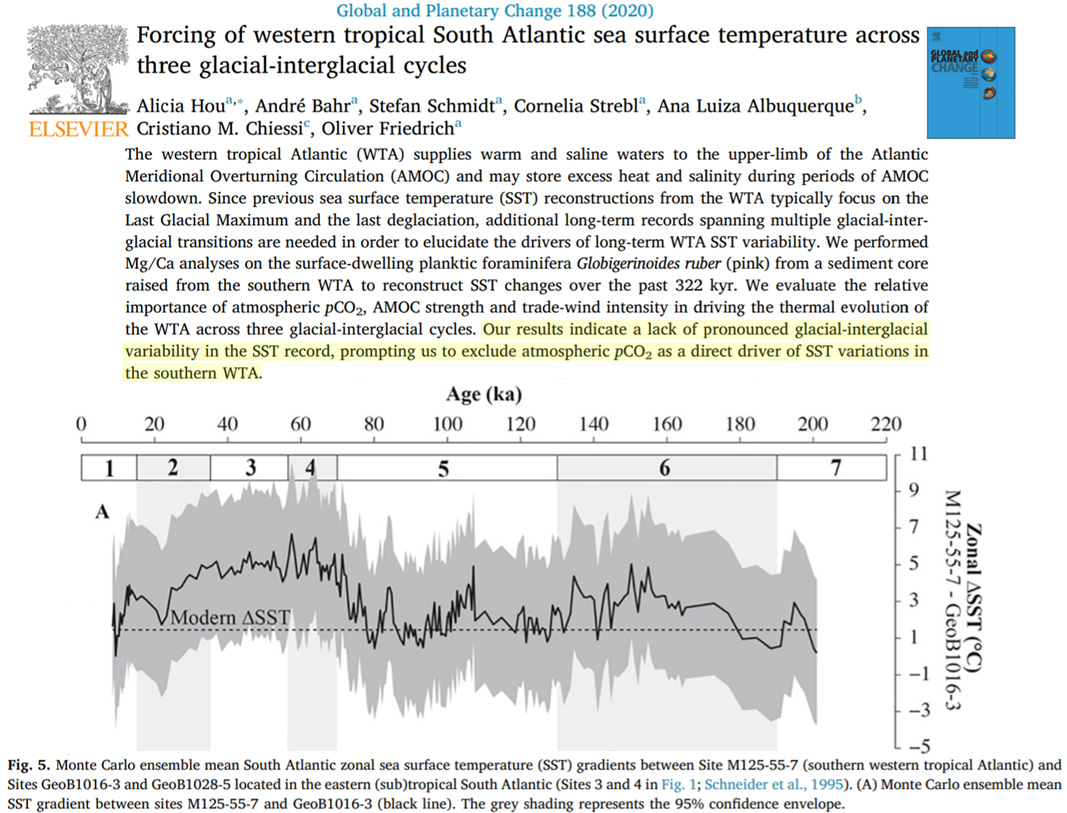
Schaney et al., 2020 Appalachian Mountains “considerably warmer than today” during the Mid Holocene
“Eastern North America generally experienced a rise in temperature culminating with mid-Holocene Climatic Optimum, during which temperatures were considerably warmer than today (Beget, 1983; Driese et al., 2005; Fairbridge, 1982; Mullins et al., 2011; Springer et al., 2009; Wanner et al., 2015). The exact timing of the Climatic Optimum varied from region to region as did the coinciding abundance of available moisture (Barber et al., 1999; Clarke et al., 2003; Shuman and Marsicek, 2016; Viau et al., 2006; Zhao et al., 2010).”
Voldstad et al., 2020 Svalbard (Arctic) 4-6°C warmer than today 9000-65000 yrs ago
“The majority of paleoecological and geological records indicates that the Early-Mid Holocene period in Svalbard was warmer than today (c. 9000-5000 years ago; Hyvarinen, 1970; Birks, 1991; Birks et al., 1994; Salvigsen and Høgvard, 2006; Miller et al., 2010; Alsos et al., 2016; Farnsworth, 2018). According to Mangerud and Svendsen (2018), the August sea-surface temperature was possibly as much as 6°C higher than today. Based on present-day distributions, clone sizes, and genetic patterns, it is assumed that the most thermophilous plants in Svalbard had a broader distribution during the Early Holocene (Alsos et al., 2002; Engelskjøn et al., 2003; Birkeland et al., 2017). … The August sea-surface temperatures are suggested to have been about 4°C higher than present from c. 8000 to 6500 cal. yr BP, followed by a gradual decrease in temperature until present day levels around 3500 cal. yr BP (Mangerud and Svendsen, 2018).”
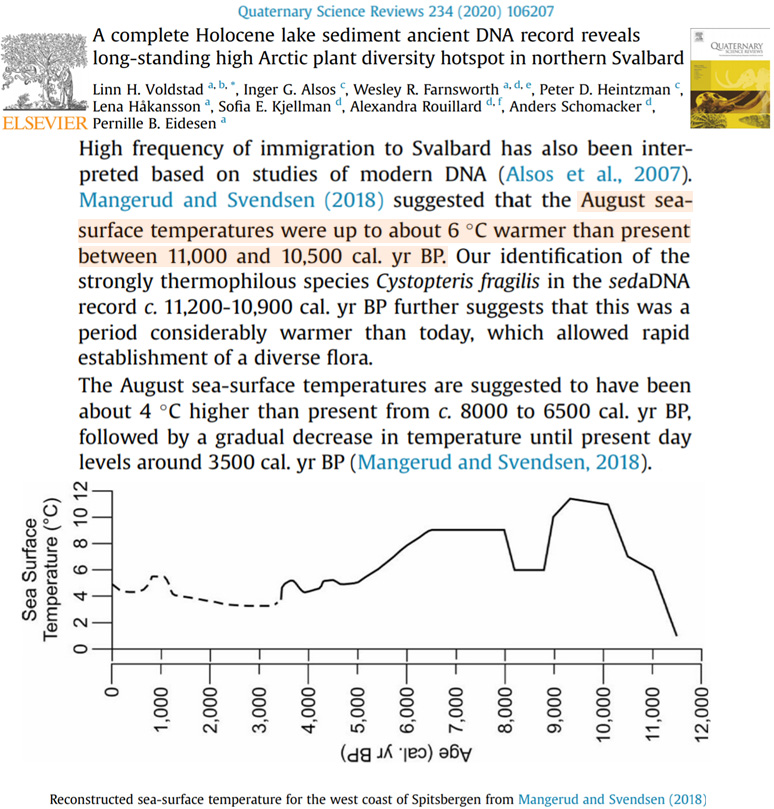
Azuara et al., 2020 Gulf of Lion SSTs mean annual temps 12-16°C (1981-2010), ~18°C Mid-Holocene
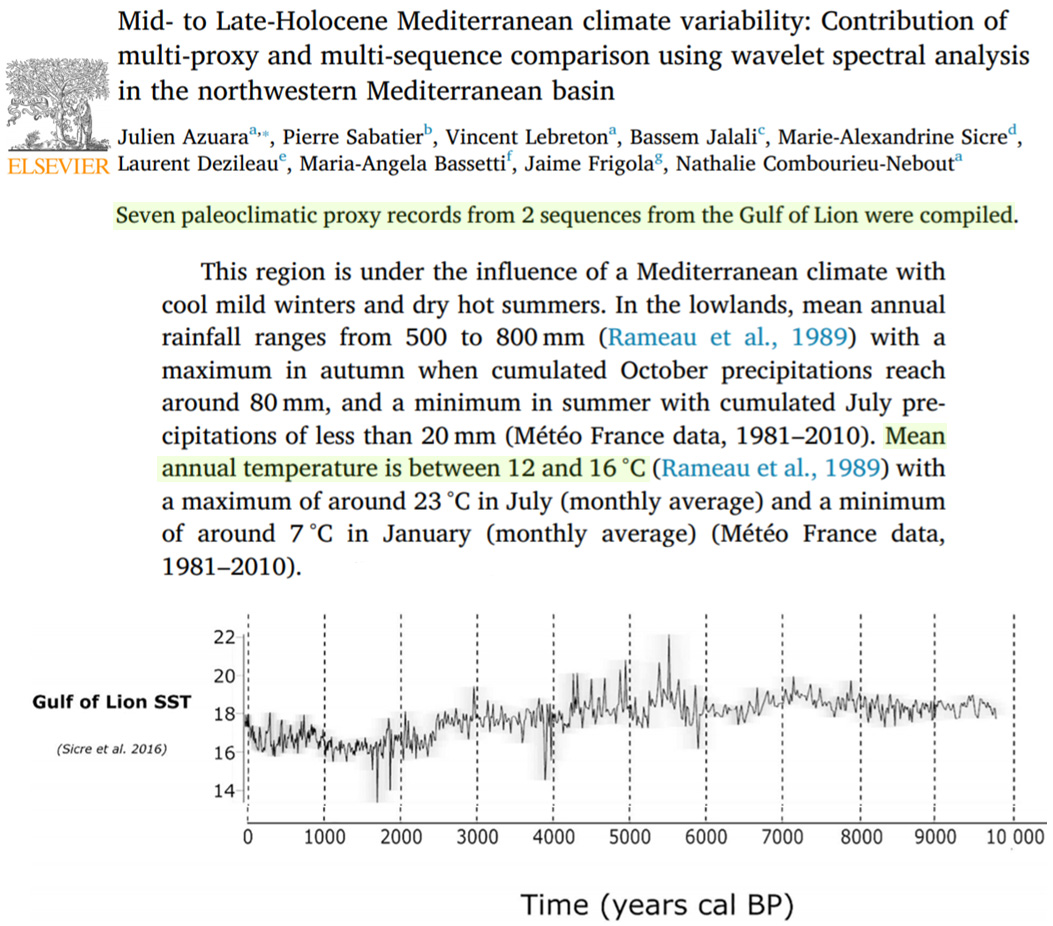
Downs et al., 2020 Greenland 2.5°C warmer than present from 7000-4000 yrs ago
“Records of HTM warming can be found in Greenland ice core records. For example, temperatures measured in the Dye-3 borehole show a pronounced HTM signal occurring from 7 to 4 ka and having values 2.5◦C above present temperatures (Dahl-Jensen et al., 1998; Miller et al., 2010)”
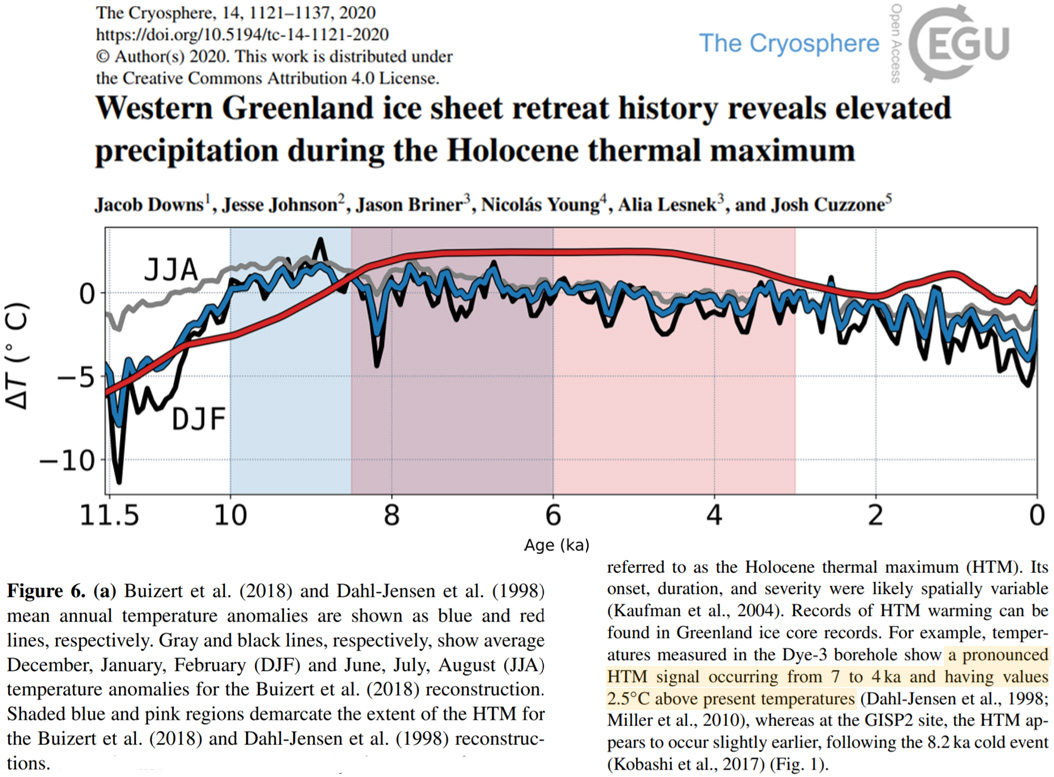
Paus, 2020 Scandes July temps today as cold as they were Late Glacial (CO2 190 ppm)
“The regional climate is continental with July and January mean temperatures of ca. 7.5–8 ◦C and − 11 ◦C, respectively and an annual precipitation of 450 mm. … In LG [Late Glacial, 18 to 16 thousand years ago, CO2 ~200 ppm], July mean temperatures reached at least 7–8 ◦C locally (see 5.4.).”
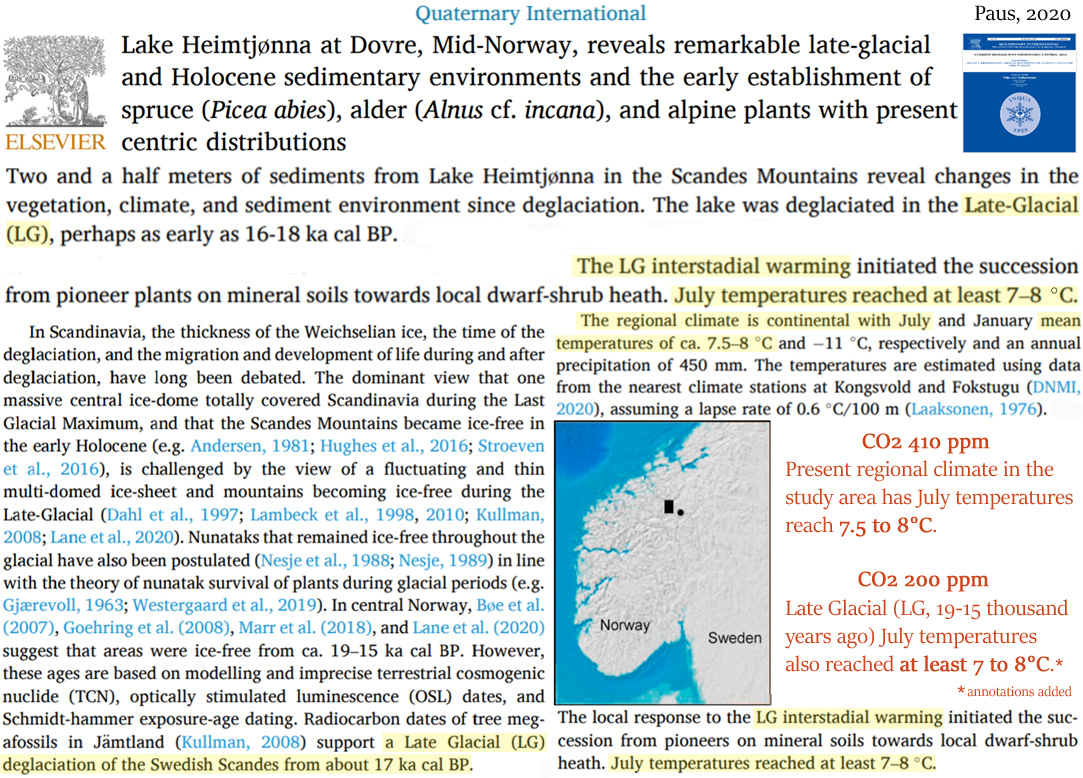
Matthews et al., 2020 Norway “warmer climate than today” smaller glaciers, higher tree lines
“Landscape stabilization and hence reduced paraglacial aggradation on the fans are likely to have been accentuated by the spread of a dense tree cover onto the lower-altitude slopes of the catchments in the Early to Middle Holocene as a result of a warmer climate than today during the Holocene Thermal Maximum (HTM). Present-day tree lines attain altitudes of 850–1000 m at favourable locations within the four catchments (https://www.norgeskart.no/) and, based on pollen analyses from the valleys around Jostedalsbreen, would have been at least 200 m higher during the HTM (Nesje & Kvamme 1991; Nesje et al. 1991; see also Wilford et al. 2005; Marston 2010; Pawlik 2013). … The Jostedalsbreenice cap, along with theKvitekollice cap and the other glaciers that directly affected the catchments of the alluvial fans, are inferred to have melted away completely by ~7.3 ka (Nesje & Kvamme 1991; Nesje et al. 1991, 2000, 2001).”
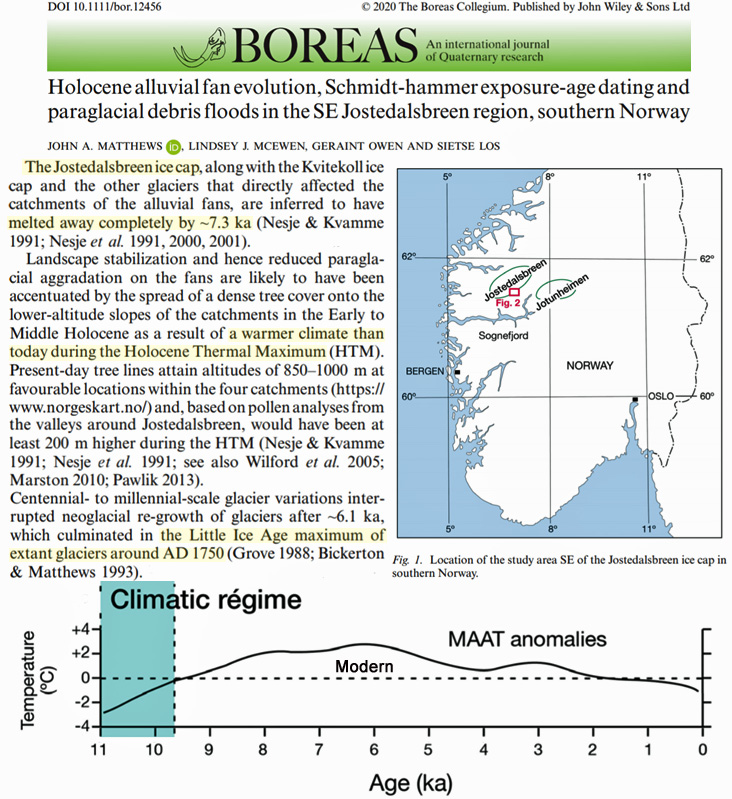
Hellstrom et al., 2020 New Zealand “at least 0.8–2.1 °C warmer”
“The current upper surface altitude limit for flowstone growth seems likely to be in the 1000–1100 m range, which would require a minimum 100–200 m tree line altitude increase and at least 0.4–1.4 °C temperature increase for NB8 to grow during the Holocene optimum and earlier interglacials. Recently discovered passages linked to Nettlebed Cave include a section with flowstone beneath alpine terrain similar to that in Fig. 2 with a surface altitude of 1390 m asl, meaning it would have grown with a tree line at least 200–300 m higher than present under conditions at least 0.8–2.1 °C warmer. Reaching this site with drilling equipment will be a non-trivial task and the age of this growth event remains unknown for now.”
Morales-Molino et al., 2020 Mediterranean mountains 1-2°C warmer than today
“Species-rich mixed Abies alba (silver fir) forests dominated about 10,500—5500 years ago, under rather dry and warmer-than-today conditions (+ 1—2 °C).”
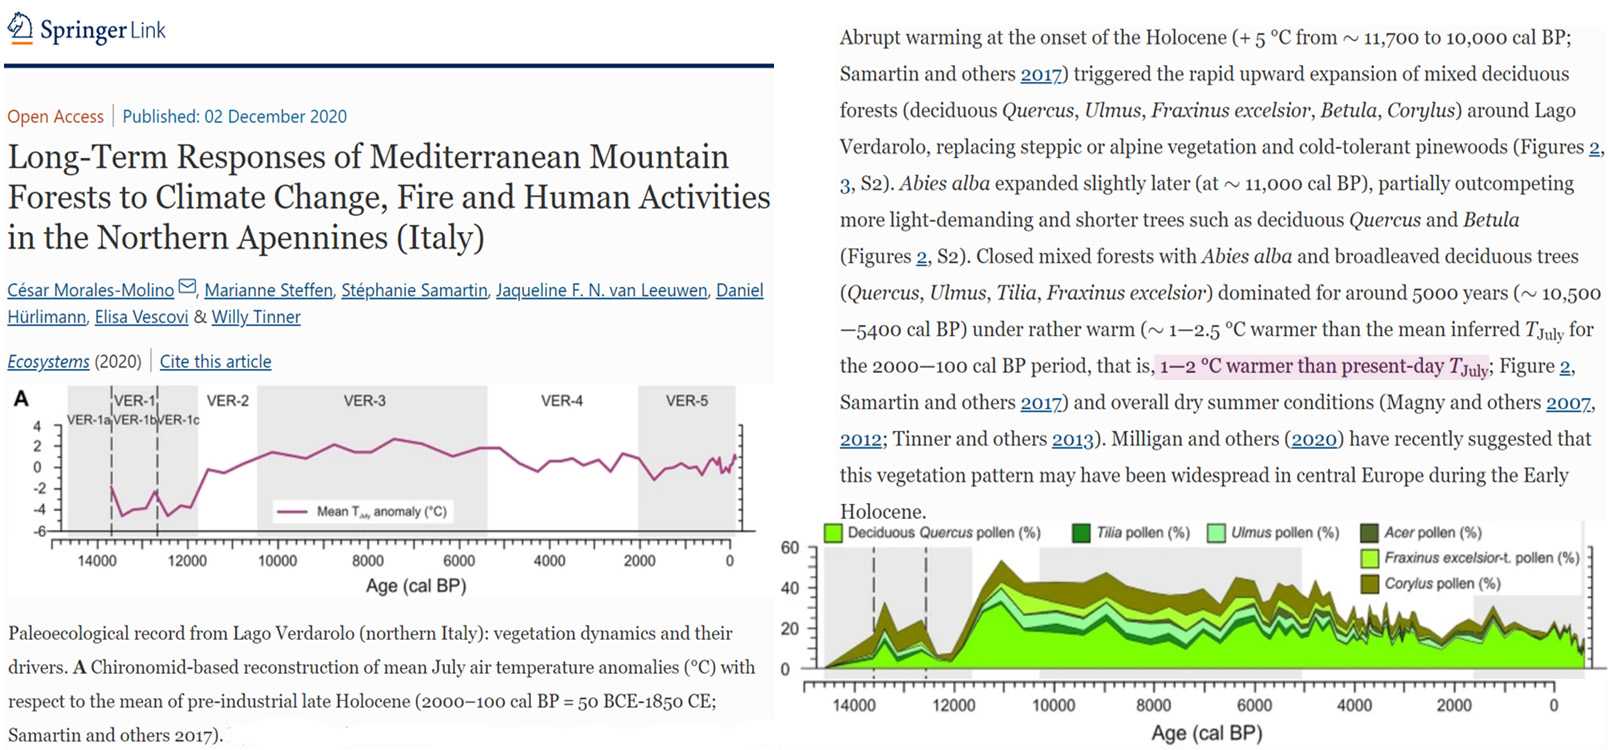
Allaart et al., 2020 Early Holocene N. Spitsbergen warmer, fewer glaciers, less sea ice; max sea ice in “modern” times
“The conditions in northern Spitsbergen are thus comparable to central western Spitsbergen during the Early to Middle Holocene, where some of the smaller ice caps disappeared and tidewater glaciers retreated to positions several kilometres farther back than their modern margins (Mangerud & Svendsen 1990; Svendsen & Mangerud 1997; Hald et al. 2004; Forwick & Vorren 2009; Baeten et al. 2010). … In Wijdefjorden the few modern tidewater glaciers are located tens of kilometres (up to 100 km) away from the study area (Fig. 1C). The very low sediment accumulation rate after 7.1±1.0 cal. ka BP could indicate a Holocene glacier minimum in the Wijdefjorden area (Figs 7, 10C), where glaciers had retreated onto land and innermost fjord positions. … The almost synchronous increase in IP25 concentrations after c. 0.7±0.2 cal. ka BP, with a maximum in the modern sediments, indicates more sea ice towards the Late Holocene.”
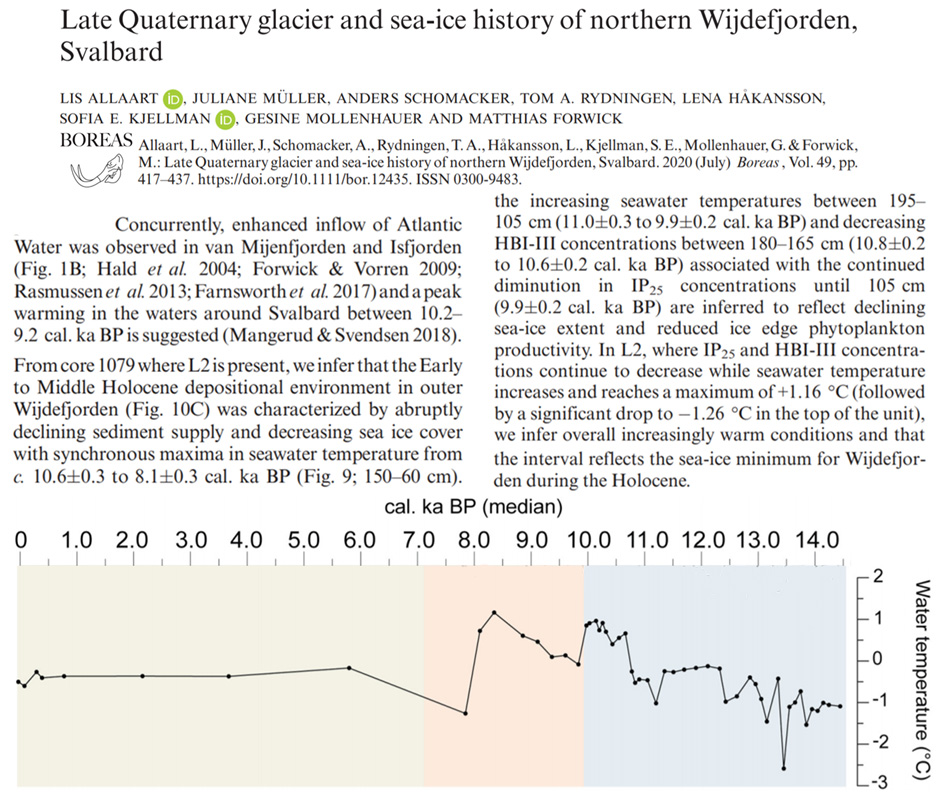
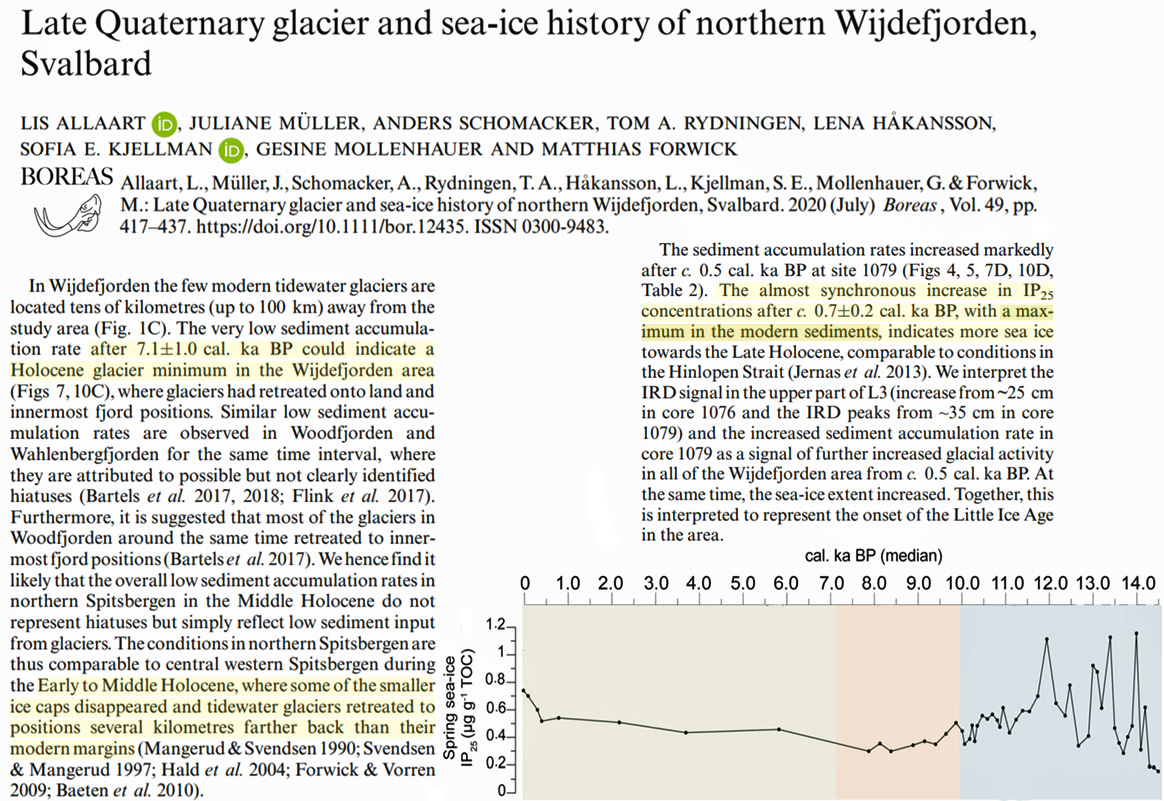
Farnsworth et al., 2020 Iceland temperatures “2.5–3.2 °C greater than present”
“Glaciers in Iceland exhibited their minimum extent sometime during the Holocene thermal maximum (HTM) between 7.9 and 5.5 ka BP (Striberger et al., 2012; Geirsdóttir et al., 2013). Synchronous with elevated northern hemisphere summer insolation, terrestrial and lacustrine proxy records suggest summer temperatures during this period were on the order of 2.5–3.2 °C greater than present (Caseldine et al., 2006; Harning et al., 2020). Models project Holocene glaciers in Iceland were non-existent or greatly reduced through the Middle Holocene (Flowers et al., 2008; Anderson et al., 2019).”
Leonard et al., 2020 Great Barrier Reef “~1-2 °C warmer than present at ~6200 yr. BP”
“Coral Sr/Ca proxy sea surface temperature (SST) reconstructions suggest the Central GBR was ~1-2 °C warmer than present at ~6200 yr. BP (Gagan et al., 1998; recalibrated age by Sadler et al., 2016), a trend reinforced by coral derived SST reconstructions from the wider Indo-Pacific (Fig. 5a). Relative sea level was also 0.7-1.0 m higher than present between 6200 and 5500 yr. BP (Chappell, 1983; Leonard et al., 2016b, 2018; Lewis et al., 2008, 2013) which would have allowed these reefs to accrete uninhibited in a “catch-up” mode of growth (Neumann and Macintyre, 1985).”
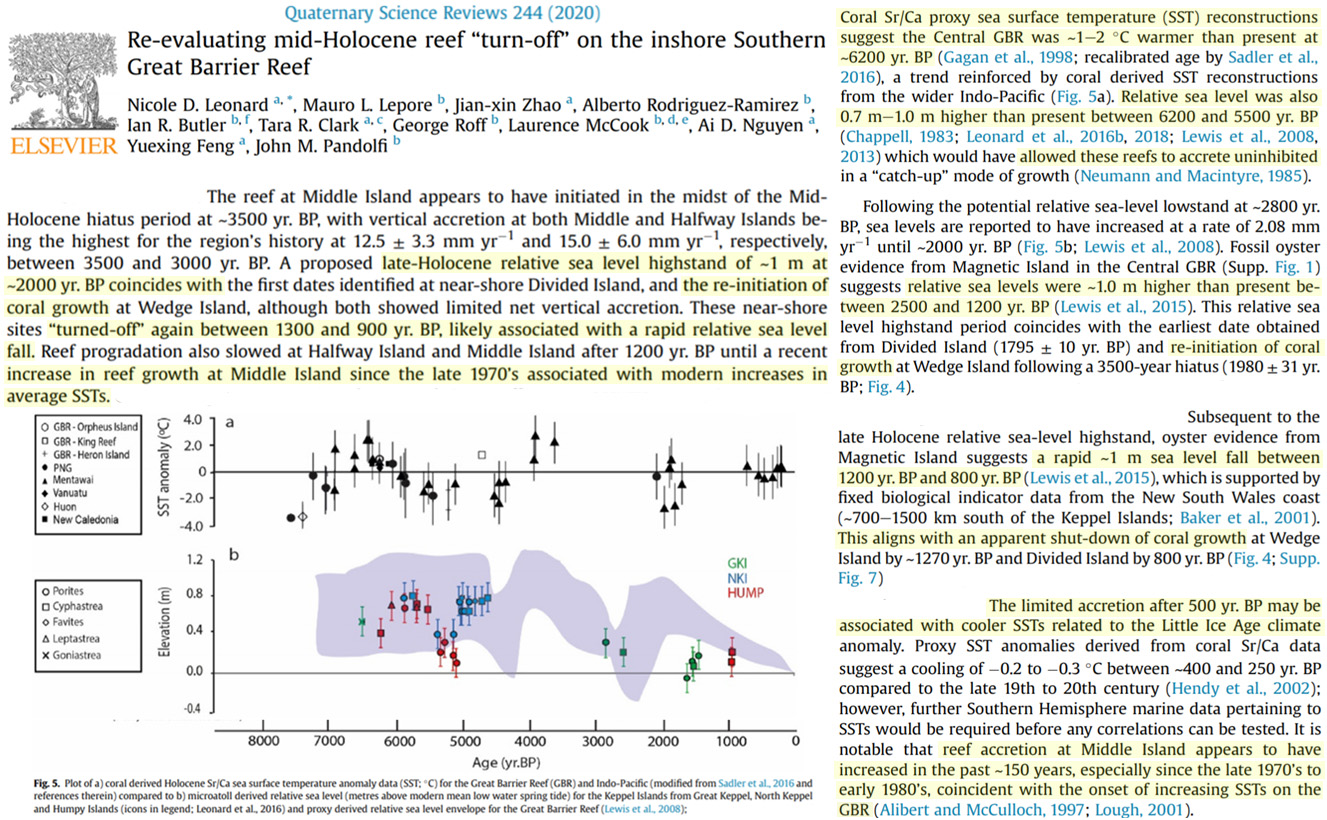
Harning eta l., 2020 Iceland “2.5 to 3 °C above the late 20th century average”
“Theoretical modeling simulations for Drangajökull, using regional ice core and marine temperature proxy records tuned to local instrumental datasets, require HTM temperatures 2.5 to 3 °C above the late 20th century average to match the geologic record (Anderson et al., 2018) (Figure 3b). Our brGDGT record is the first to independently confirm local early Holocene warmth in Iceland with MSAT up to 3.2°C above modern (Figure 3b). The relatively lower brGDGT MSAT between 9.2 and 8.1 ka BP (average 2.0 °C above modern) compared to 7.6 ka BP (3.2 °C above modern) may result from a combination of effects. These include freshwater discharge events from the waning Laurentide ice sheet (e.g. 8.2 ka BP Event), prolonged atmospheric sulfate injection from northern hemisphere volcanic eruptions (see Geirsdóttir, Miller, Axford, & Ólafsdóttir, 2009, 2013; Larsen et al., 2012; Harning, Geirsdóttir, & Miller, 2018), and/or potentially altered redox conditions that may result in subdued bottom water temperature estimates. However, despite these potential climate/proxy modulators, our average early Holocene brGDGT MSAT of 2.2 °C above modern falls within the range of those based on the local glacier models (Anderson et al., 2018) (Figure 3b). The marked consistency between glacier models relying on regional proxy datasets and our independent brGDGT MSAT record provide firm evidence that the early Holocene demise of Drangajökull required summer temperatures at least 2.2 °C above modern.”
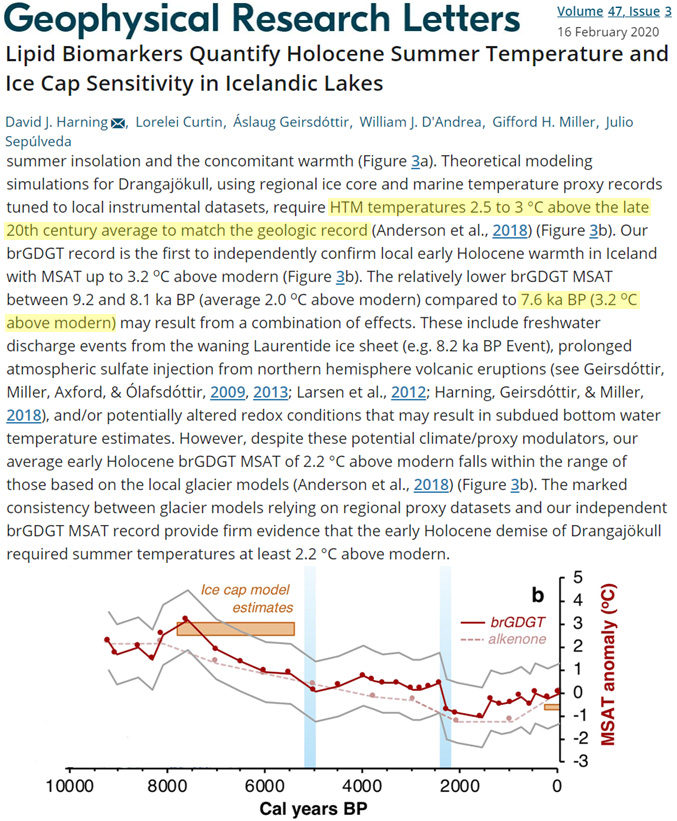
Li et al., 2020 Tibetan Plateau “recent warming…not unprecedented and…slightly colder than [Medieval]”
“The average temperature of the MCA was 0.14°C above the 2000-year average value (Figure 3b). For the “Standardization” composite reconstruction (Figure 3a), the LIA was the coldest period, and the MCA was the warmest interval during the Common Era (Figure 3a). The recent warming century was not unprecedented and was slightly colder than the MCA. … The “MST anomaly” composite record (Figure 3c) reveals three warm periods during 0–185 CE, 575–1415 CE, and 1775–1925 CE. The temperatures of these three warm periods were 0.22, 0.12, and 0.17°C higher than the average value in the past 2000 years, respectively (Figure 3c). The cold periods occurred between 185 and 575 CE, between 1415 and 1775 CE, and during the past century“
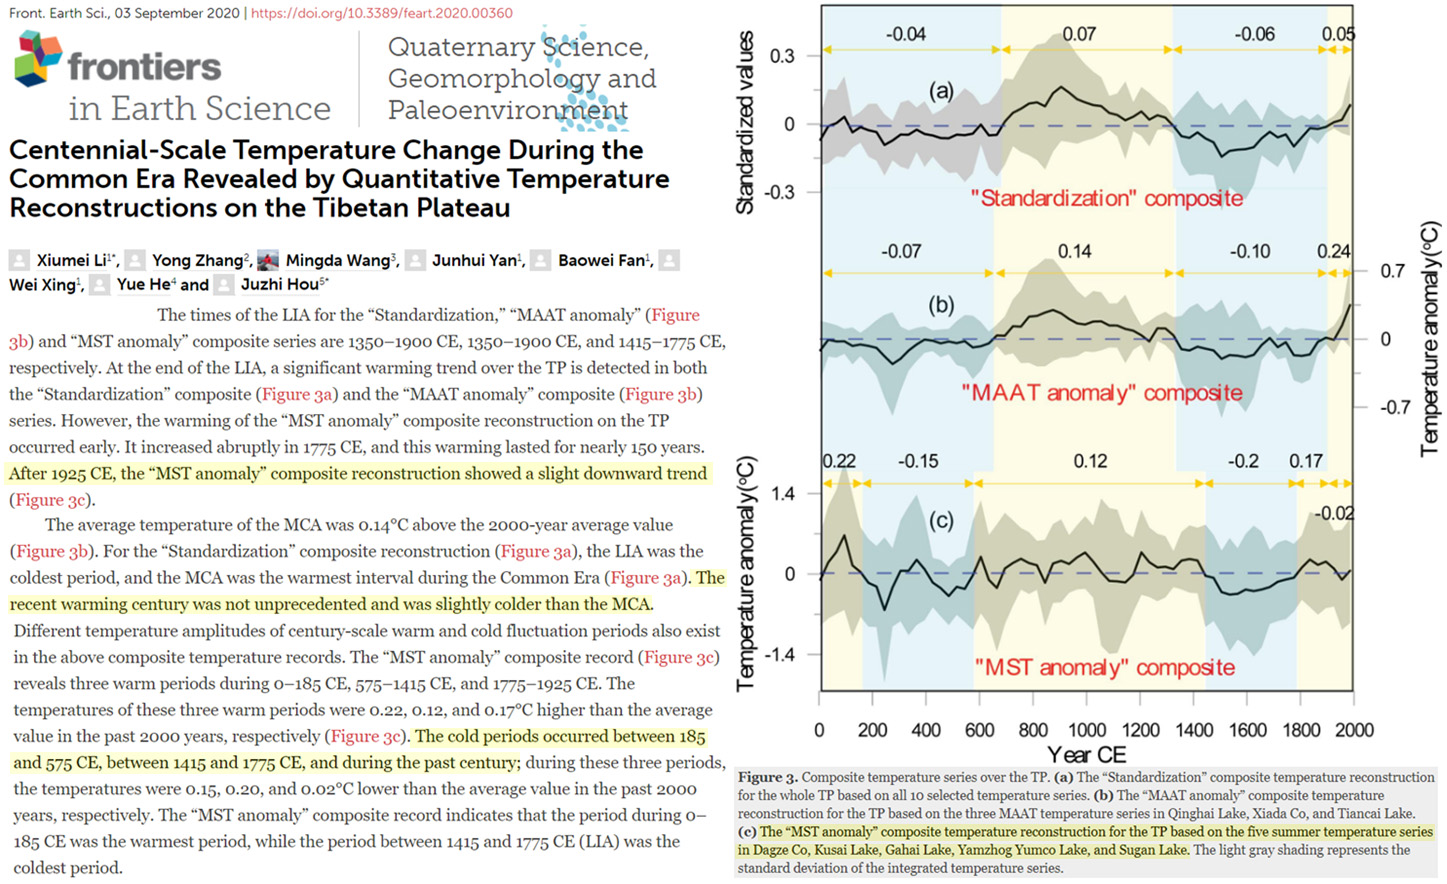
Liu et al., 2020 Northern Asia “~2-3°C warmer than today”
“During the Holocene Megathermal (8000-3000 cal yr BP), the climate of Northern Asia was a Holocene thermal and humidity maximum by other proxy data (Stebich et al., 2015), with summer temperatures ~2–3℃ warmer than today (Blinnikov et al., 2002; Valiranta et al., 2006). … In addition, the phytolith records suggests a significant climatic change from cool and dry conditions to warm and humid conditions during ~1600~300 cal yr BP, corresponding to the Medieval Warm Period (~1600~900 cal yr BP). Similarly, during ~1500~1100 cal yr BP, thermophilous Quercus, Juglans and Ulmus expanded obviously in the northwest Liaoning region (Zhang et al., 2004).”
Margaritelli et al., 2020 Mediterranean Sea “about 2°C warmer” during the Roman Warm Period
“This record comparison consistently shows the Roman as the warmest period of the last 2 kyr, about 2 °C warmer than average values for the late centuries for the Sicily and Western Mediterranean regions. After the Roman Period a general cooling trend developed in the region with several minor oscillations.”
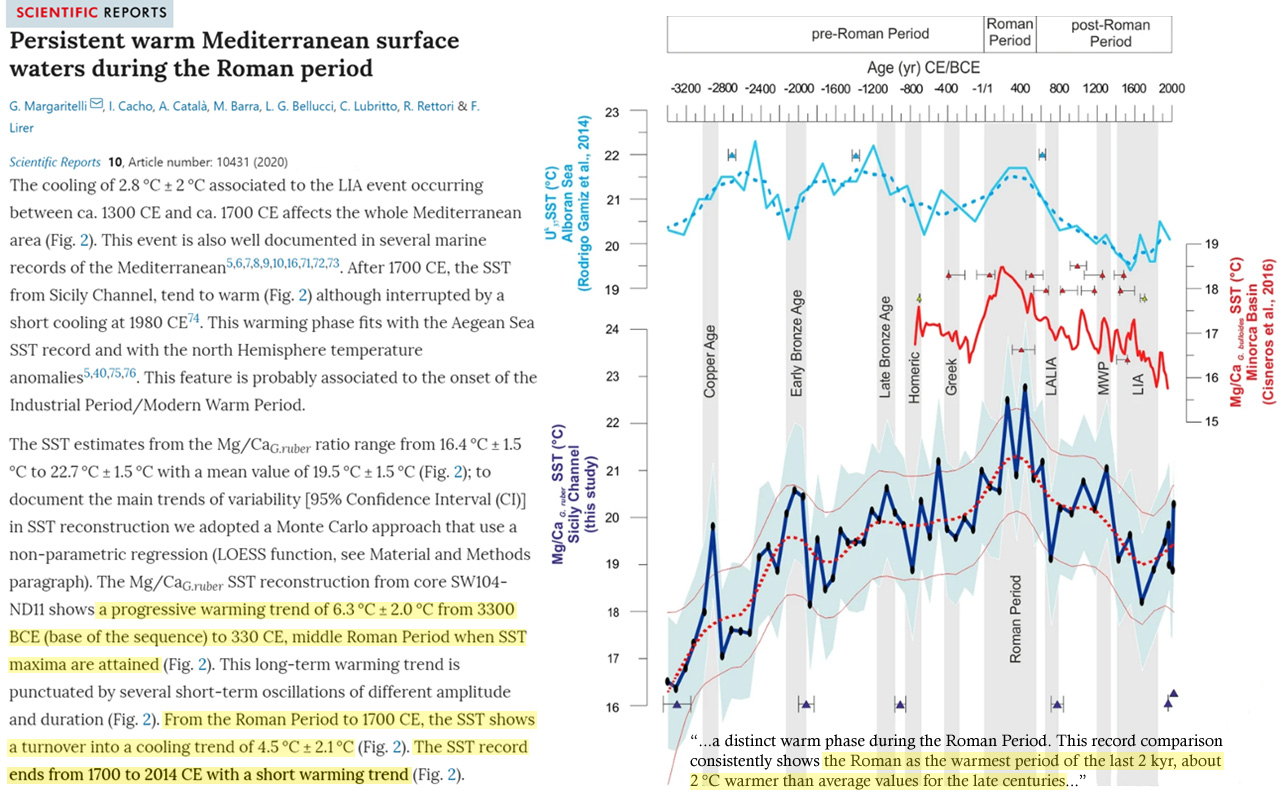
Elmslie et al., 2020 N. Ontario “~2-3°C warmer than the modern climate”
“Modern Analog Technique (MAT) based on pollen was used to reconstruct average temperature over the Holocene record of Charland Lake and showed average temperature was ~2 °C warmer than present conditions ~7800–4500 cal yr BP, a time period which we define as the Holocene Thermal Maximum (HTM). … Atmosphere-ocean vegetation models have suggested that the HTM in northern Ontario was ~2–3 °C warmer than the modern climate (Renssen et al., 2009, 2012).”
Xia et al., 2020 Subantarctic Georgia “summer temperature between 10°C and 5°C higher than present”
“Although the biomarker-based paleotemperature proxy has been calibrated for modern temperature data of regional lakes, summer temperatures as high as 14°C reconstructed from Fan Lake are outside the range of their modern calibration dataset in which the warmest site has a summer temperature of only 10°C (Foster et al., 2016) … The CARs increased to as high as 140 g C m² yr¹ at 4000-3500 cal yr BP and 70 g C m² yr¹ at 3200-2700 cal yr BP when summer temperature was around 10°C and 5°C higher than present, respectively “
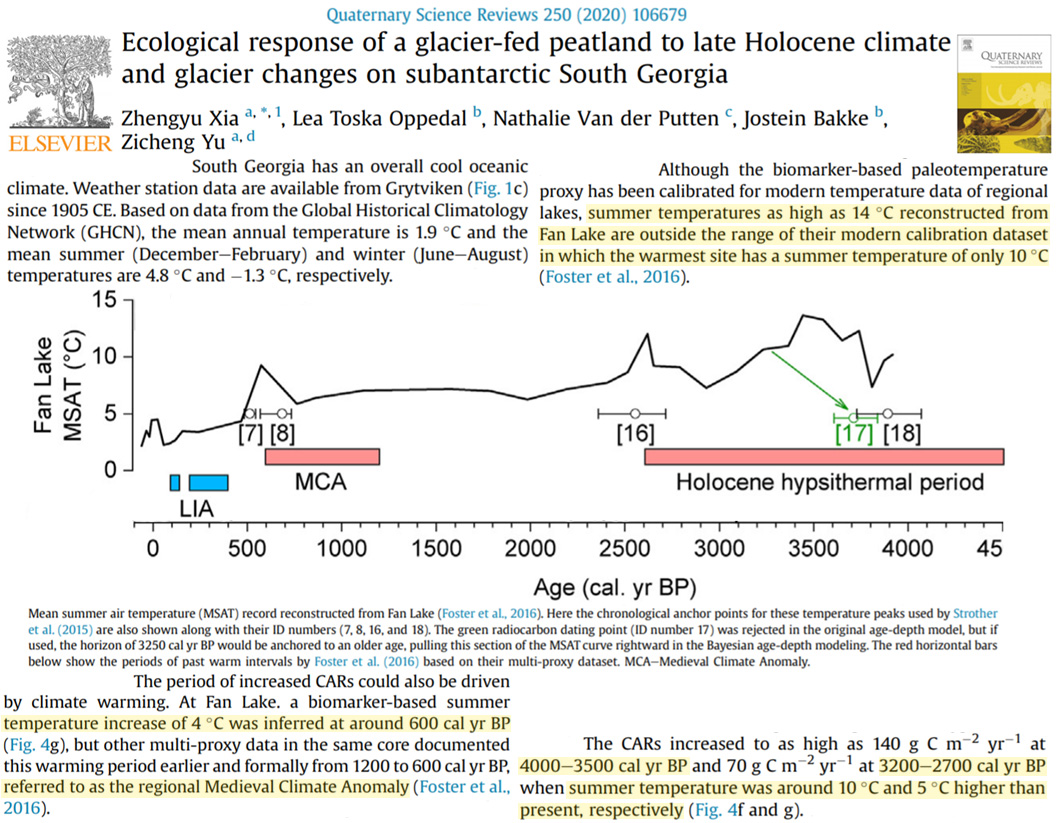
Harning et al., 2020 N. Iceland SSTs 7°C cooling trend (from ~10°C to ~3°C) last 8,000 yrs
“In terms of foraminifera-reconstructed SST there is an overall trend of cooling throughout the last 8 ka from ~10 °C to ~3 °C, although SST from 8 to ~4 ka BP and from ~3 ka BP to present are relatively more stable than between 4 and 3 ka BP (Fig. 4b).”
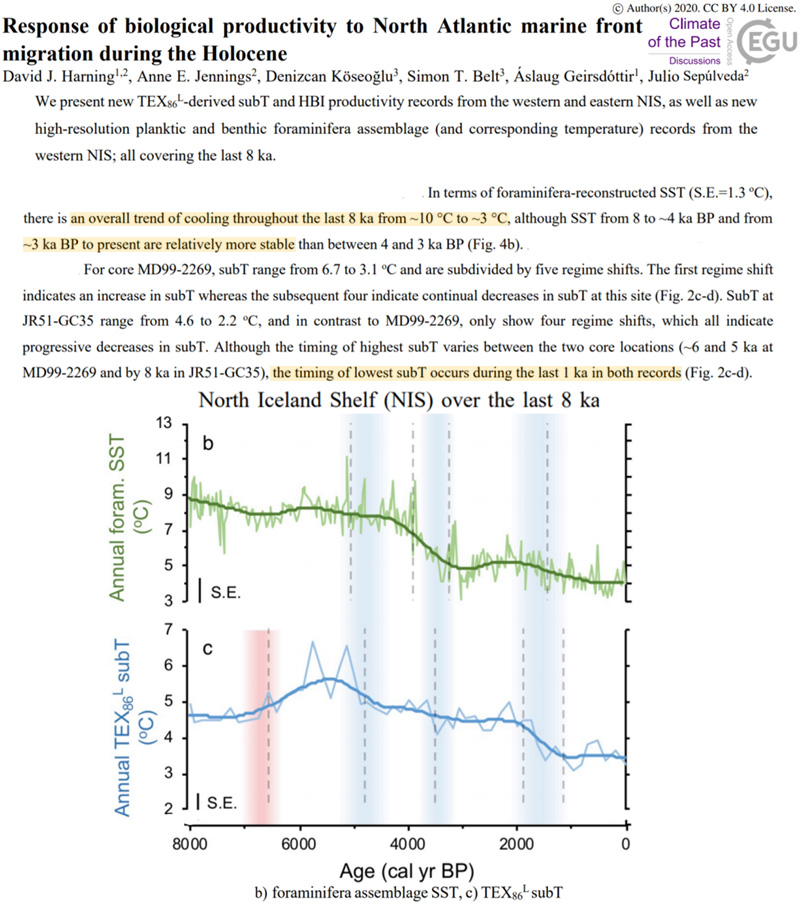

Max et al., 2020 N. Pacific SSTs ~14°C 20-25,000 yrs ago (glacial), 9.1°C today
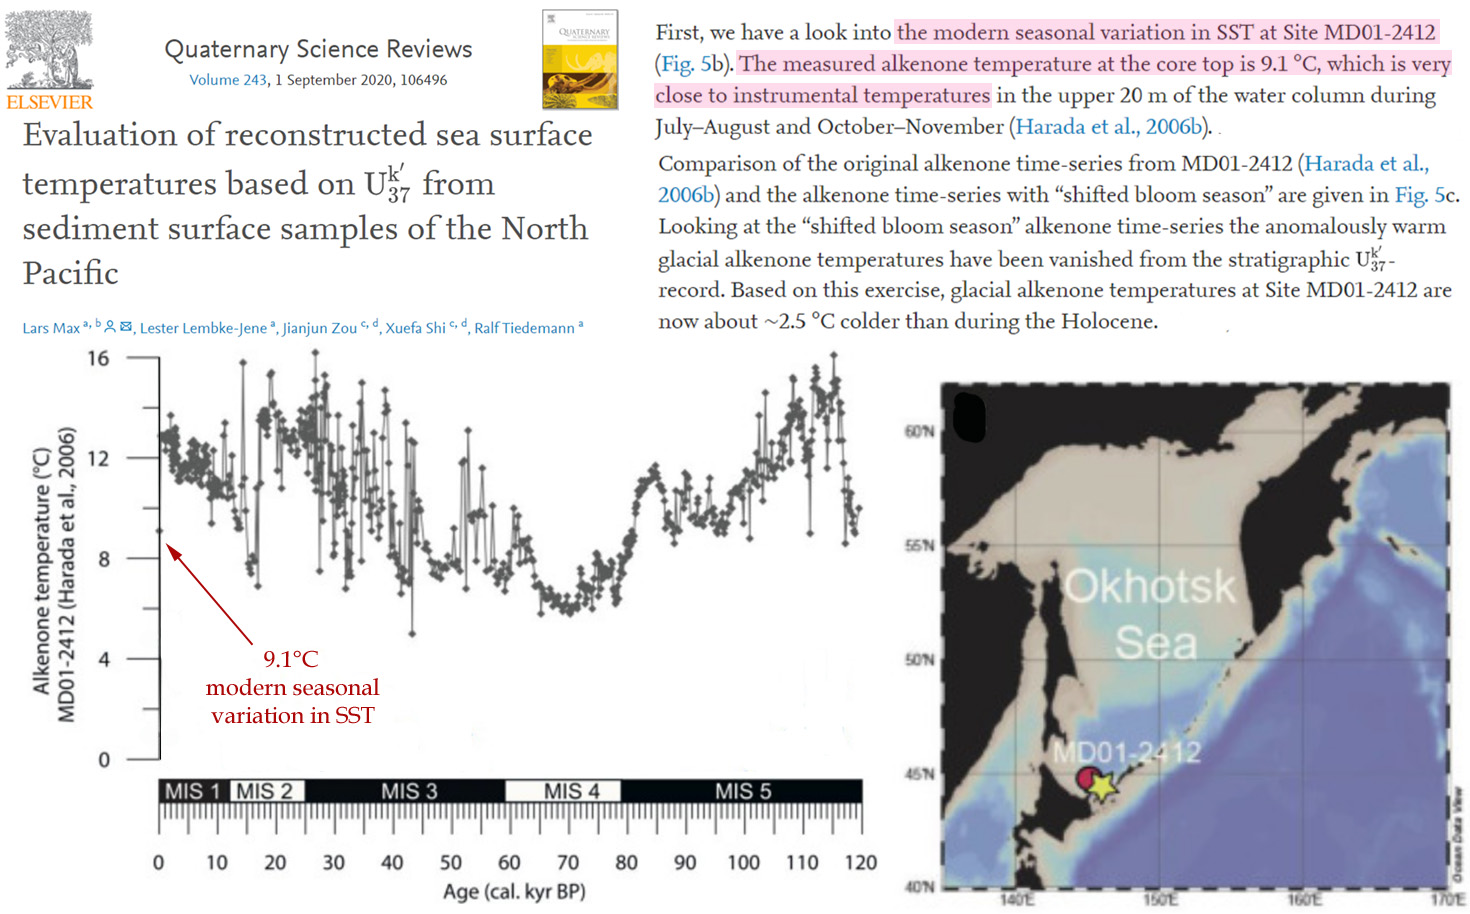
Brice et al., 2020 Svalbard <0°C today/11 mos. sea ice cover vs. 4°C/2 mos. sea ice cover ~4100 yrs ago
“The surface water at our study site is presently under the dominant influence of the Arctic Water with SST <0°C and salinity between 34.3 and 34.7 psu in summer (Fig. 2; Pfirman et al., 1994). … The reconstruction from MAT revealed important changes in sea-surface conditions (Fig. 6). From ca. 11,300 to 8700 cal yr BP, very cold conditions with an average of 8 months/yr of sea-ice cover, summer SST around 1–2°C and SSS fluctuating between 28 and 33.5 psu are reconstructed. Such conditions indicate polar climate and episodic meltwater discharge. A warming trend is observed after ca. 8700 cal yr BP. Summer SST and SSS increased progressively to a maximum of 3.5°C and 33.5 psu, respectively, whereas seasonal sea ice cover decreased to a minimum of 2–4 months/yr, which is much lower than the modern range of values. … MAT led to reconstruct a gradual increase of SSTs and salinity and decrease of sea-ice cover (Fig. 6), with optimal conditions in surface waters being attained around 4100 ± 1500 yr BP, with low sea-ice cover for a couple of months per yr and summer temperatures reaching up to 4°C, which is warmer than modern conditions.”
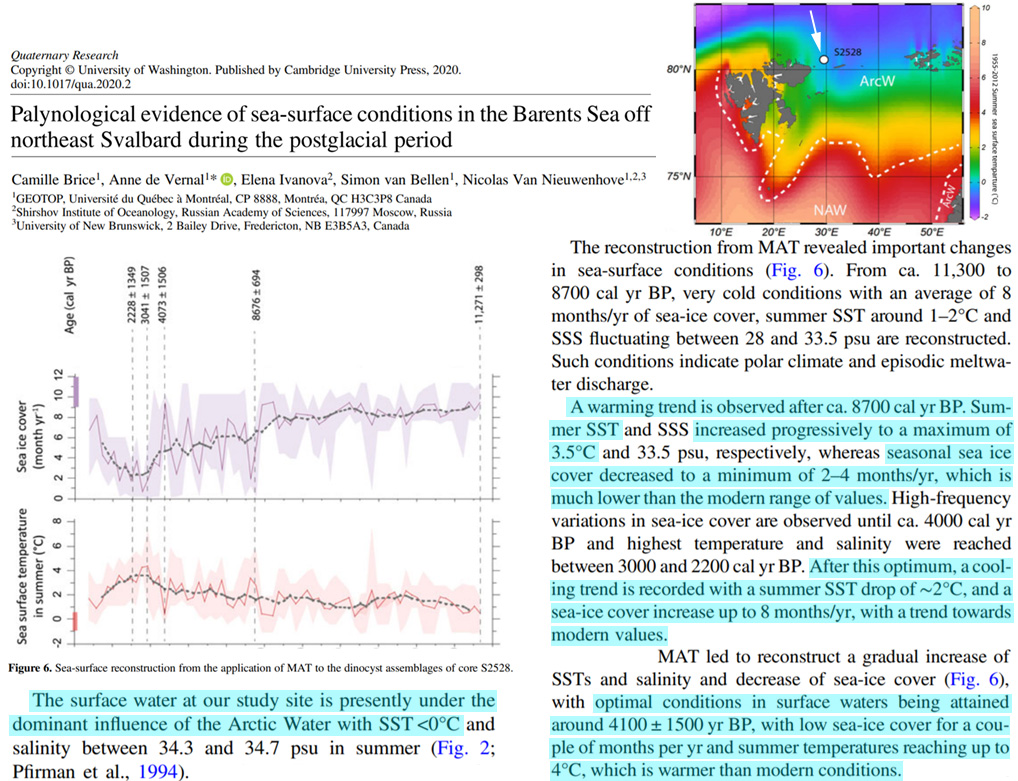
Syring et al., 2020 Early Holocene N. Greenland “4–5 °C warmer than today” with much less sea ice
“Warmer sea-surface conditions were also reconstructed for the Nordic Seas and the East Greenland shelf based on foraminifers and diatoms (Bauch et al., 2001; Andersen et al., 2004a, 2004b). The appearance of Armeria scabra and the sub-arctic mussel Mytilus edulis, both species are well-known for their occurrence in eastern North Greenland, further support warmer summer temperatures than today during the early Holocene between 10 and 8.5 ka (Hjort and Funder, 1974; Bennike and Weidick, 2001). … In summary, our data of Core PS93/025 and multiproxy records (e.g., IRD, δ18O, δ13C, benthic and planktic foraminifera abundances) from other nearby cores (Telesiński et al., 2014) relate the phase between 10.2 and 9.3 ka to be linked to the Holocene Thermal Maximum (HTM), where increased mean local summer insolation led to summer temperatures 4–5 °C warmer than today in northern Greenland (Kaufman et al., 2004; Laskar et al., 2004; Reeh, 2004; Lecavalier et al., 2017). … Spectral analysis reveals significant power at frequencies exceeding the 90% confidence level and corresponding to periodicities of 110–130, 170, 220 and 500 years in the proxy records of IP25, HBI III and brassicasterol throughout the Holocene (Fig. 9). Such short-term cycles of 110–130 year periods have been observed in the oxygen isotope record of the NGRIP (NGRIP-Members, 2004) and are likely linked to variations in solar activity (Vonmoos et al., 2006).”
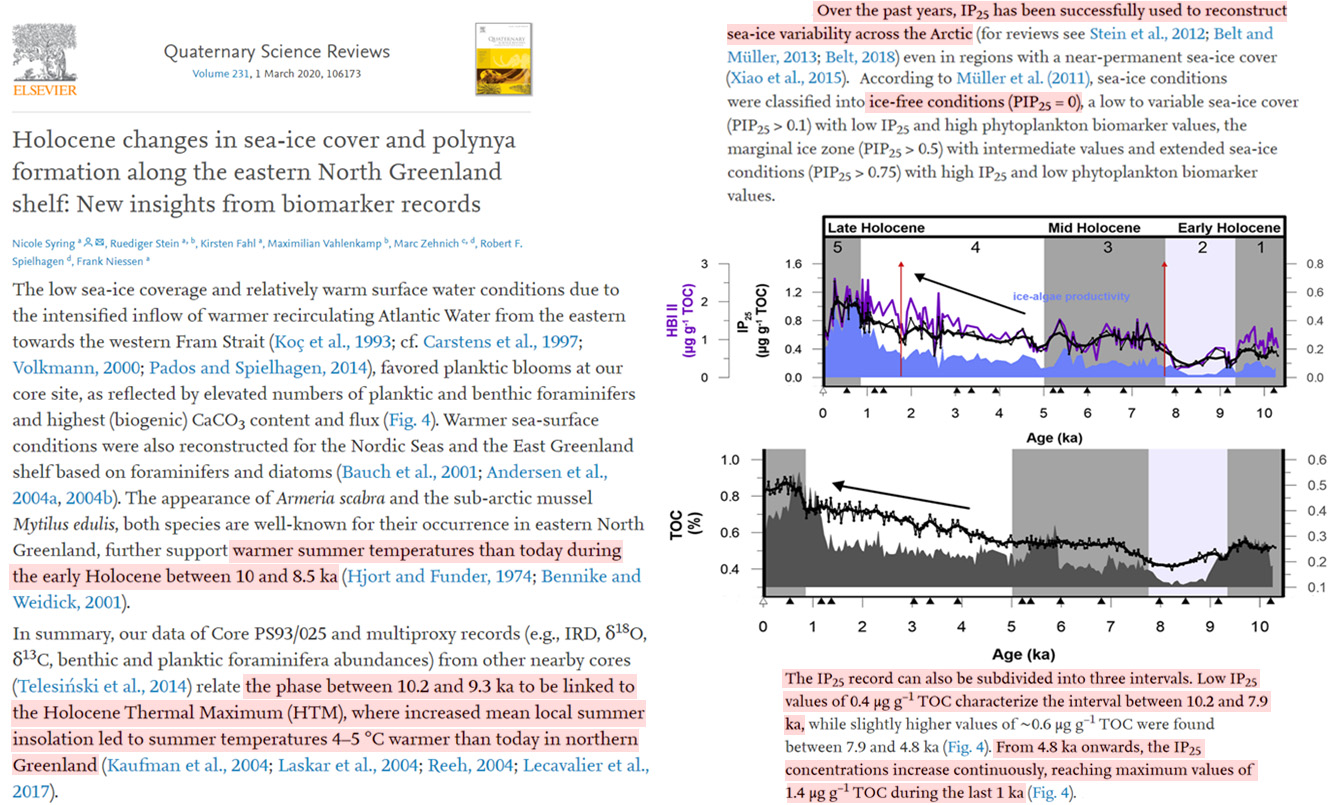
Birks, 2020 Denmark 2-3°C “warmer than today”
“From fossil pollen occurrences, Iversen (1944) applied his modern climate envelopes (attributes) to infer that mid-Holocene summers were 2–3°C warmer and winters were 1–2°C warmer than today in Denmark. … Andersson proposed that mean July temperature in the early- and mid-Holocene was 2–2.5°C warmer than today.”
Myers et al., 2020 East Antarctica “6°C above modern temperatures” between 1-2 thousand yrs ago
“Resistivity data suggests that active permafrost formation has been ongoing since the onset of lake drainage, and that as recently as 1,000 – 1,500 yr BP, lake levels were over 60 m higher than present. This coincides with a warmer than modern paleoclimate throughout the Holocene inferred by the nearby Taylor Dome ice core record. … Between 12,000–6,000 yr BP, Taylor Dome ice core record indicates that regional temperatures were up to 5 °C warmer than modern conditions (Fig. 2) (Steig et al., 2000). … Taylor Dome ice core records show a highly variable Holocene, with short lived peaks up to + 6 °C above modern temperatures between 1-2 ka BP (Steig et al., 2000). … Lake levels were higher potentially during and after the LGM when an ice dam blocked the mouth of TV, allowing for lake levels to increase by over 280 m compared to modern level. Taylor Dome ice core records indicate an abrupt warming of >15 °C from 15 – 12 ka BP, (Steig et al., 2000), which may have coincided with the maximum lake level of GLW.”
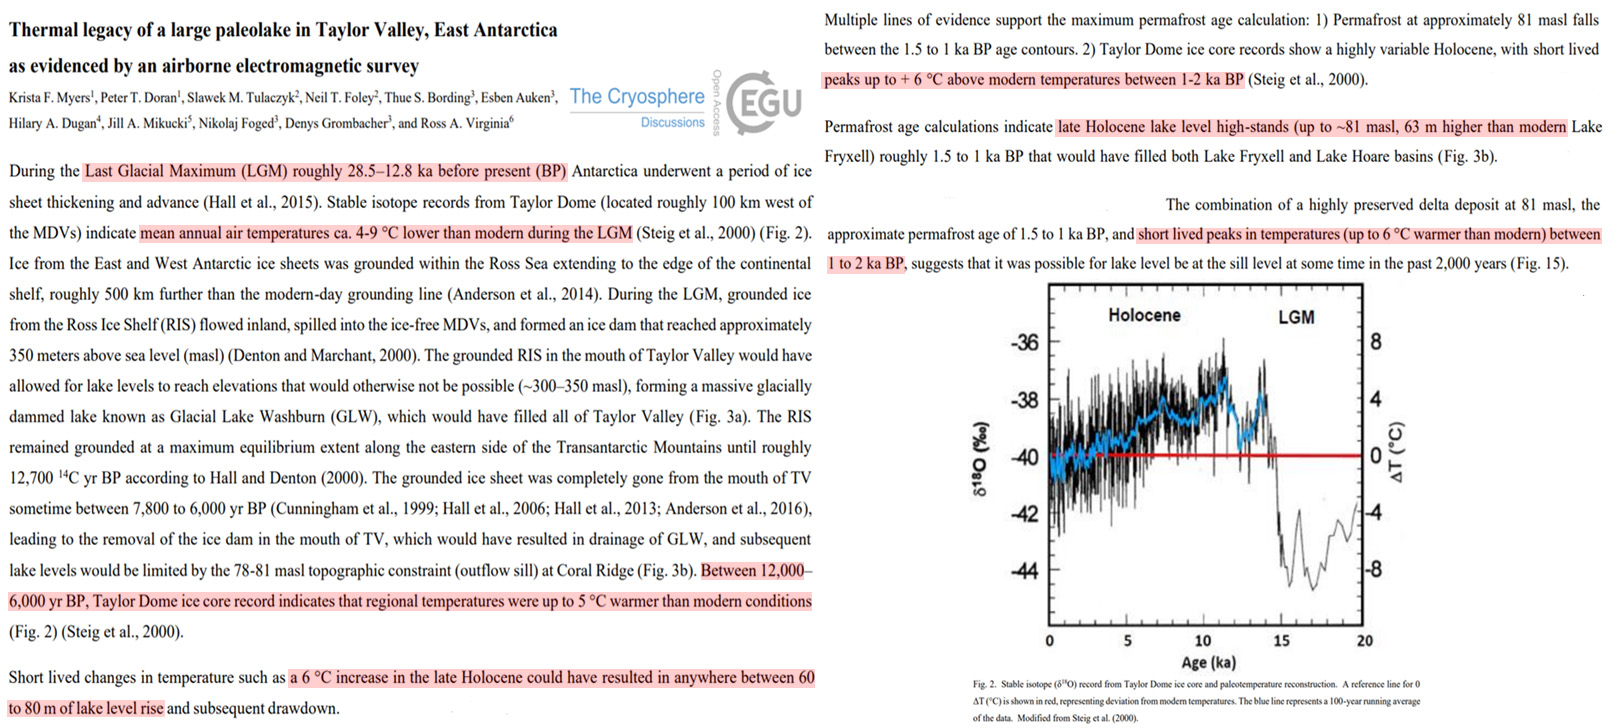
Wang et al., 2020 SW China “~2.5°C warmer than present-day”
“We found that the temperature of the Last Glacial Maximum and Holocene Climatic Optimum was ~3 ◦C cooler and ~ 2.5 ◦C warmer than present-day conditions, respectively, based on brGDGTs-reconstructed mean annual air temperatures (MATs).”
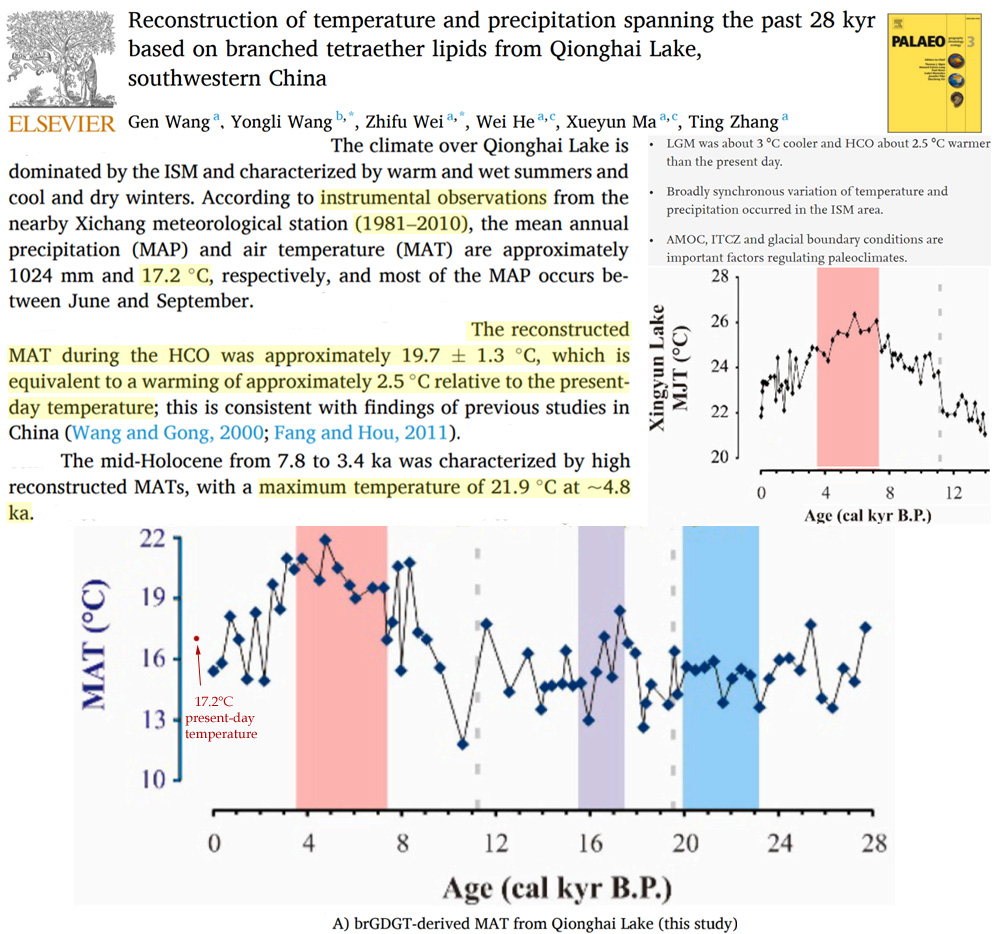
Farnsworth et al., 2020 Svalbard “7°C warmer than today” and ice free 10,000 yrs ago
“Recent Early Holocene studies targeting ice-free terrestrial and lacustrine archives suggest the terrestrial environment is in phase with marine temperature reconstructions. Alkenone and hydrogen isotope records from low-altitude coastal lakes suggest early warm and moist conditions with peak Holocene temperatures reaching 7 °C warmer than today, c. 10 ka BP (Balascio et al., 2018; Gjerde et al., 2017; van der Bilt et al., 2018, van der Bilt et al., 2019). … [T]he occurrence of Zirfaea crispata and Arctica islandica around Svalbard has been used to suggest shallow ocean temperatures peak between 10.0 – 9.2 ka BP and were at least 6°C warmer than present, framing the marine Holocene thermal maximum (HTM; Mangerud and Svendsen, 2017 and references therein).”
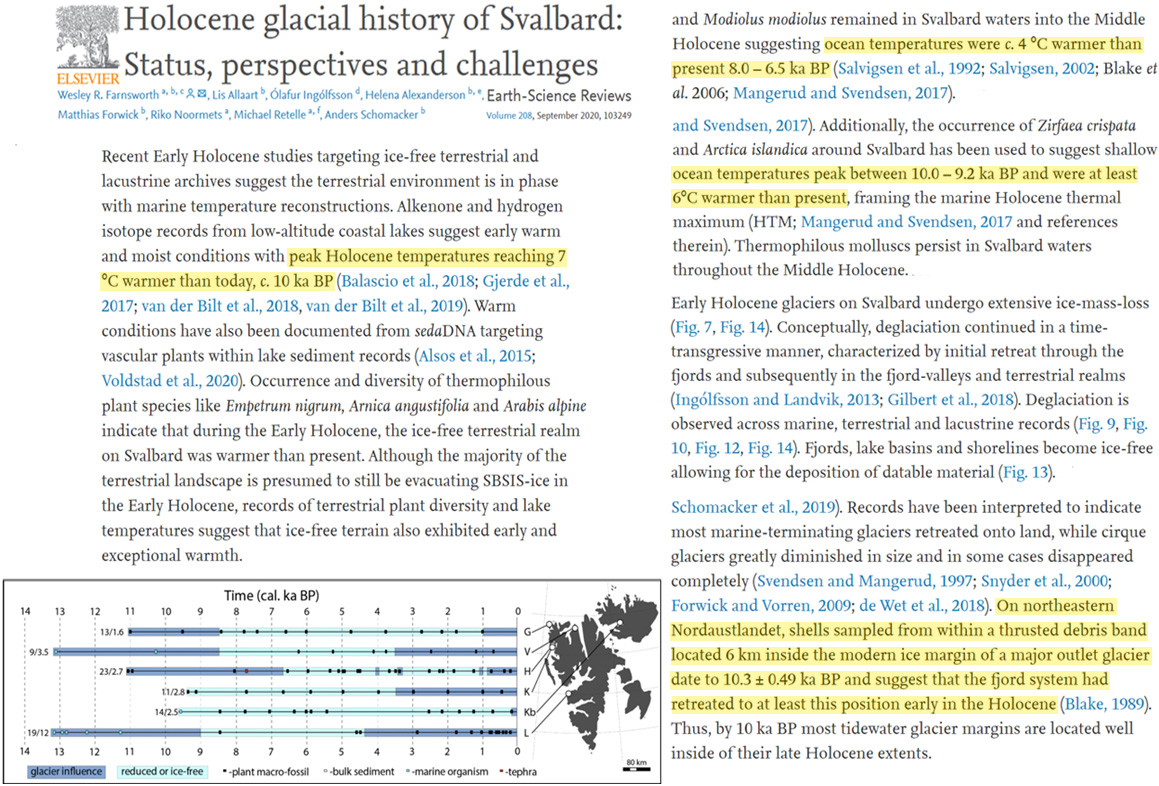
Lachniet et al., 2020 Western North America “2°C warming above modern levels, lowest sea ice extent”
“The peak δ18Oivc value of ~−9.5‰ VPDB in the Middle Holocene corresponds to a drip water δ18O value of −12.4‰ VSMOW at modern temperature of 8.32°C or −11.9 ‰ VSMOW with 2°C warming above modern levels using the most‐recent calcite‐water fractionation factor for slow‐growing speleothems (Daëron et al., 2019). … Most prominently, the δ18Oivc data show a gradual increase, reflecting warming or a change to a more southerly moisture source after 11,700 yr B2k to reach peak warmth at 8,380 yr B2k (Figure 3). The 2,180 yr interval between 9,850 and 7,670 yr B2k coincided with high δ18Oivc, high δ13C, and slow growth rates, reflecting the warmest and driest Holocene period. … [T]he timing of Middle Holocene dry winter conditions in the Southwest coincided with a warmer Arctic, reduced sea ice extent“
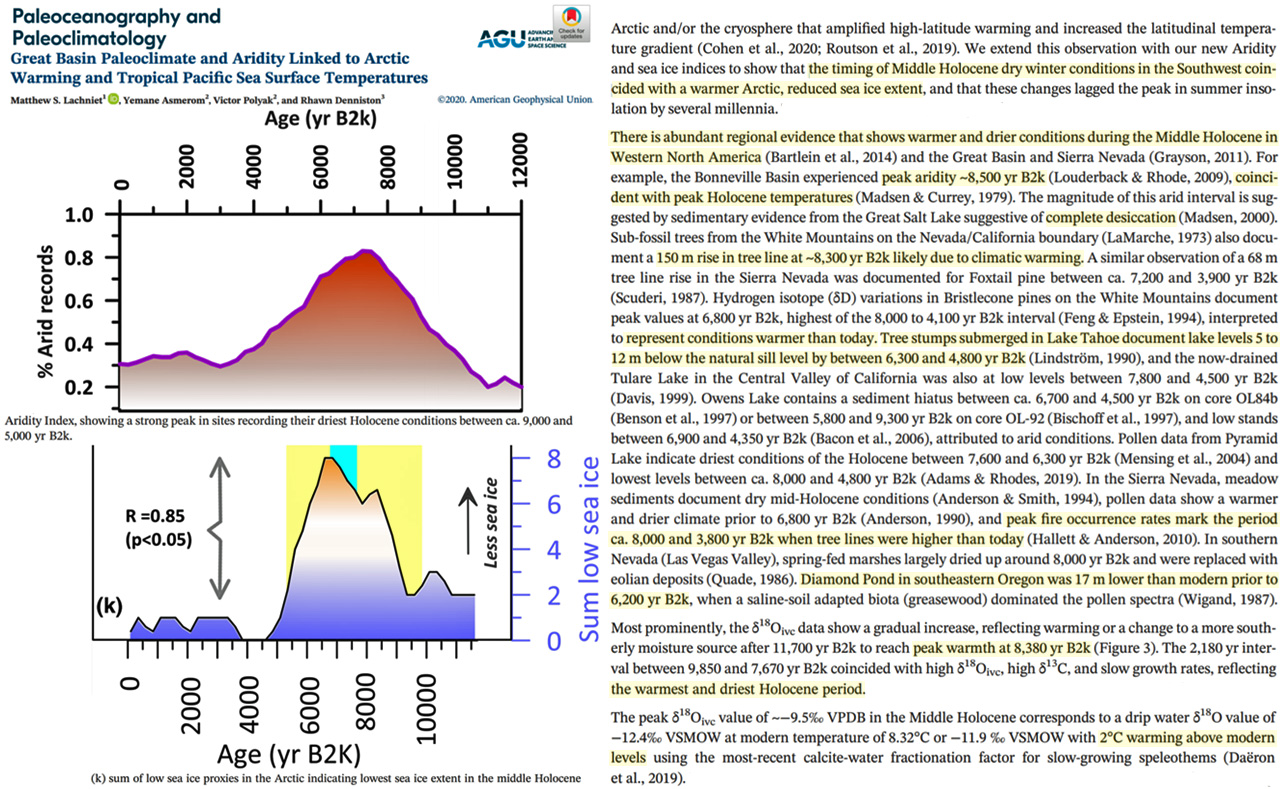
Larocca et al., 2020 South Greenland at least 1.2-1.8°C warmer
“Early Holocene summer temperatures in South Greenland were relatively cool and did not warm well beyond 1.2 °C above present. Peak warmth occurred in the mid-Holocene, between ∼7.1-5.5 ka BP, with summer temperatures at least 1.2–1.8 °C above present. Regrowth of local glaciers at ∼3.1, ∼1.3, and ∼1.2 ka BP reflect a broad, gradual pattern of cooling summer air temperatures. LIA historical moraines suggest summer air temperatures at least 0.4–0.9 °C cooler than present.”
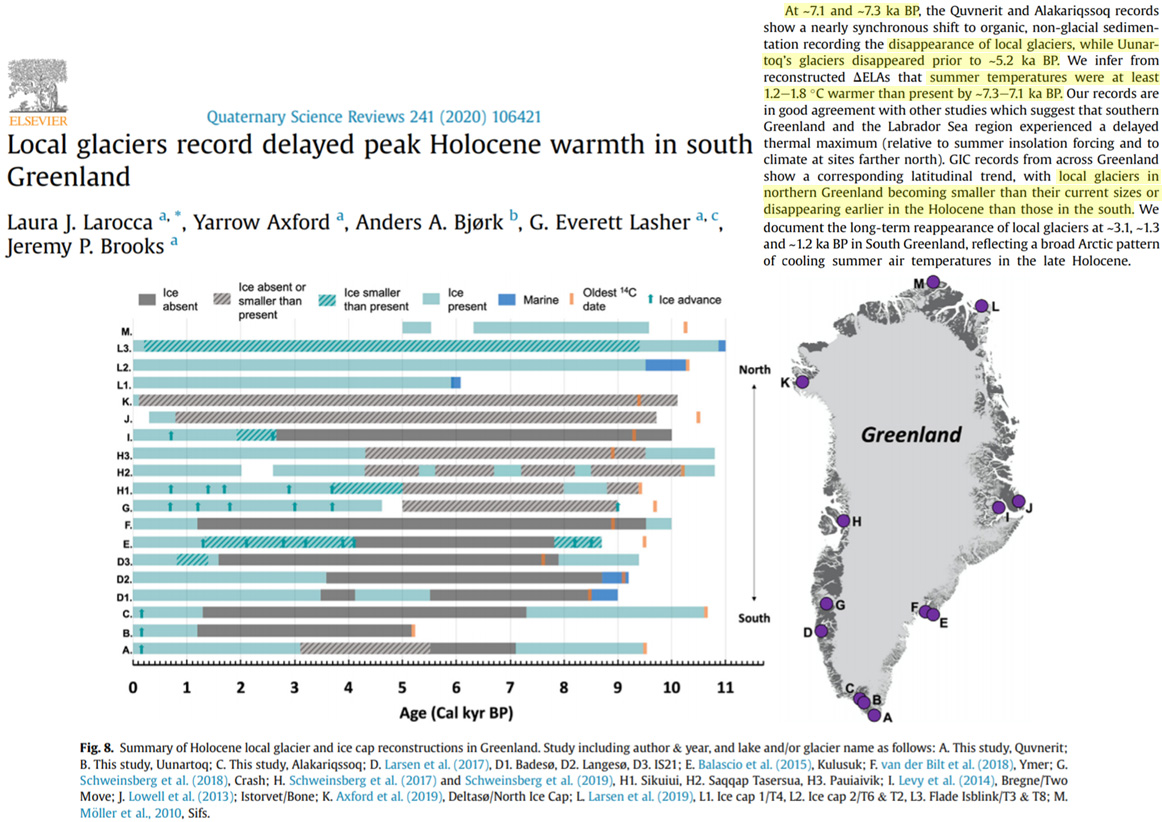
Kawahata et al., 2020 Japan “about 2°C higher than the present”
“The alkenone SSTs around Funka Bay increased from 18.4℃ at 89AD, peaked at 23.2℃ in 759AD and decreased 17.4℃ at 1080AD. It is striking that the warm period overlaps with the prosperity of the Okhotsk culture in Hokkaido from the 5th to the 9th centuries, which corresponds to the most Hypsithermal period for the last 2000 years. … Based upon the topography with the distribution of shell middens, it is known that the lowland in Kanto of eastern Japan was flooded by seawater in 6.5-5.5 cal. kyr BP. This was the period when Corbicula japonica lived in brackish water more than 100 km away from the present-day shoreline and both corals and warm bivalves occurred at temperatures about 2°C higher than the present (Fig. 1a) (Matsushima, 2006). Tanabe et al. (2012) reconstructed detailed time-series sea level change in this area, where the sea level rose rapidly in the deglaciation period and slowly reached its highest in 7.4-4.5 cal. kyr BP by +4.0 m relative to the modern level (Tanabe et al., 2012)”
Yao et al., 2020 Turpan (China) “0.5–1 °C warmer than at present” during the 9th century
“The climate of the 9th–13th centuries in Turpan is recorded in historical documents. For example, Turpan experienced droughts in ad 840 and 843, consistent with the unusual warmth of Japan in the 9th century, and this period was 0.5–1 °C warmer than at present (Li 1985). Our quantitative estimation based on pollen data shows that the MAT in Turpan during the mid-9th–10th centuries was about 0.3 °C higher than today, while the annual precipitation was about 880 mm at that time (Table 4). In the 10th century, the climate changed from warm to cold, and became more humid. This lasted until the end of the 13th century. The temperature was 1 °C lower than the present value, and then gradually recovered until it was about 1 °C higher than today (Li 1985).”
Guo et al., 2020 South China Sea ~2°C warmer with lower pH ~6000 yrs ago
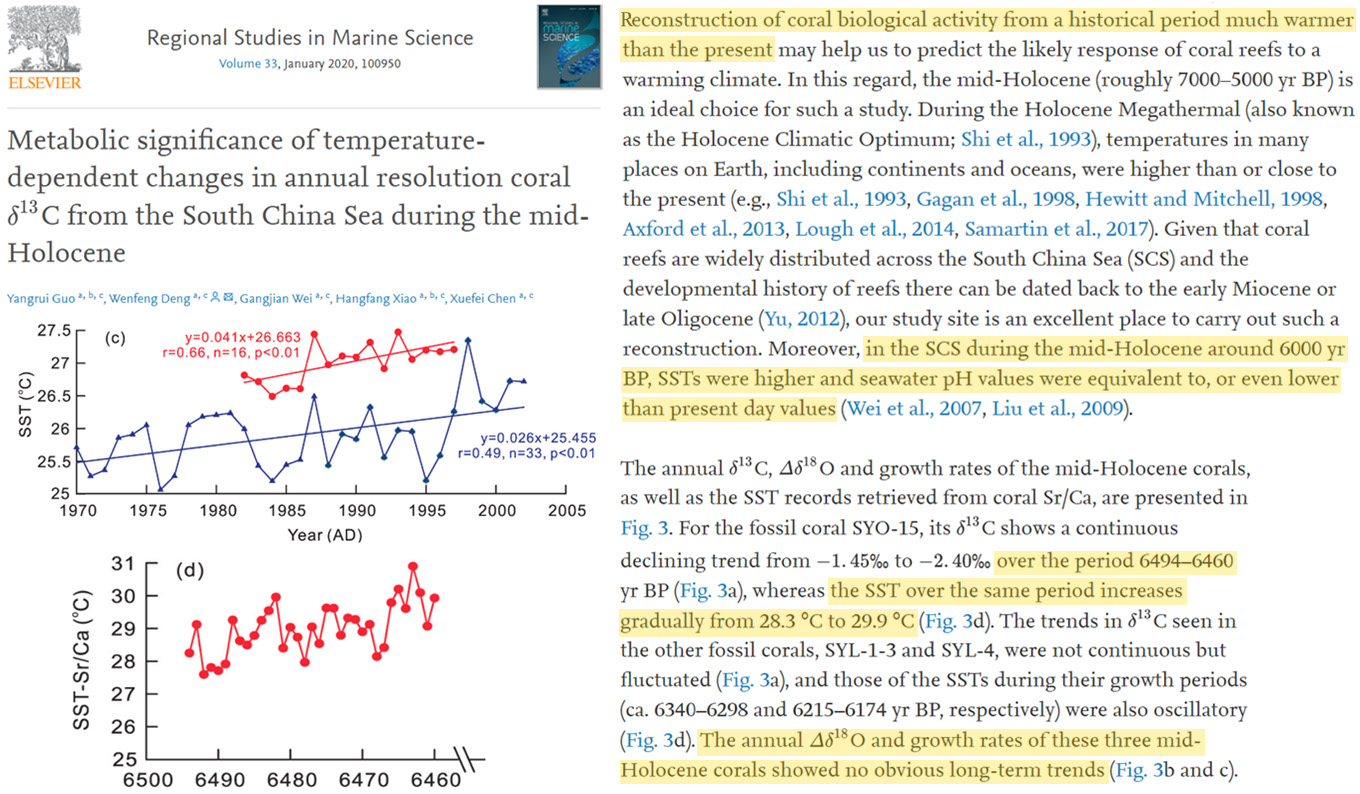
Li et al, 2020 Central Asia ~4-5°C warmer Early Holocene
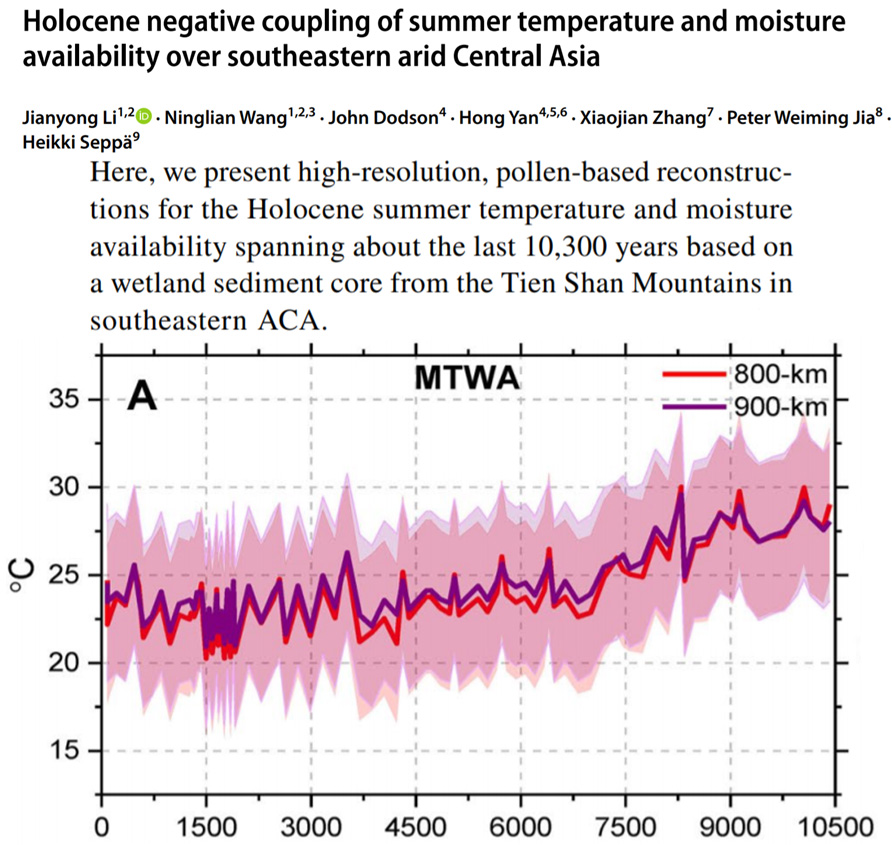
Zhou et al., 2020 E. China Sea warmed 3.3°C during Medieval times, 2.3°C Little Ice Age cooling
“During Period II (2500–750 yr BP), after a lowtemperature period at 2400–2200 yr BP, TEXH86 SST increased gradually from 19.2 to 23.5 °C. During this period, an intensified East Asian summer monsoon (EASM) and a strengthened KC and Taiwan Warm Current (TWWC) transported warm water from low-latitude areas to ECS coastal areas. During Period III (750 yr BP to present), TEXH 86 SST increased gradually and reached a maximum (24.2 °C) at ~565 yr BP. Subsequently, TEXH 86 SST decreased and reached a low value (21.9 °C) at ~279 yr BP. During the period (<750 yr BP), higher TEXH 86 SST values were caused mainly by intensified KC, whereas lower values corresponded to the Little Ice Age. Spectral analysis reveals that variation in TEXH 86 SST exhibits periodicities of 175, 80, and 68 years, consistent with the periodicities of solar activity.”
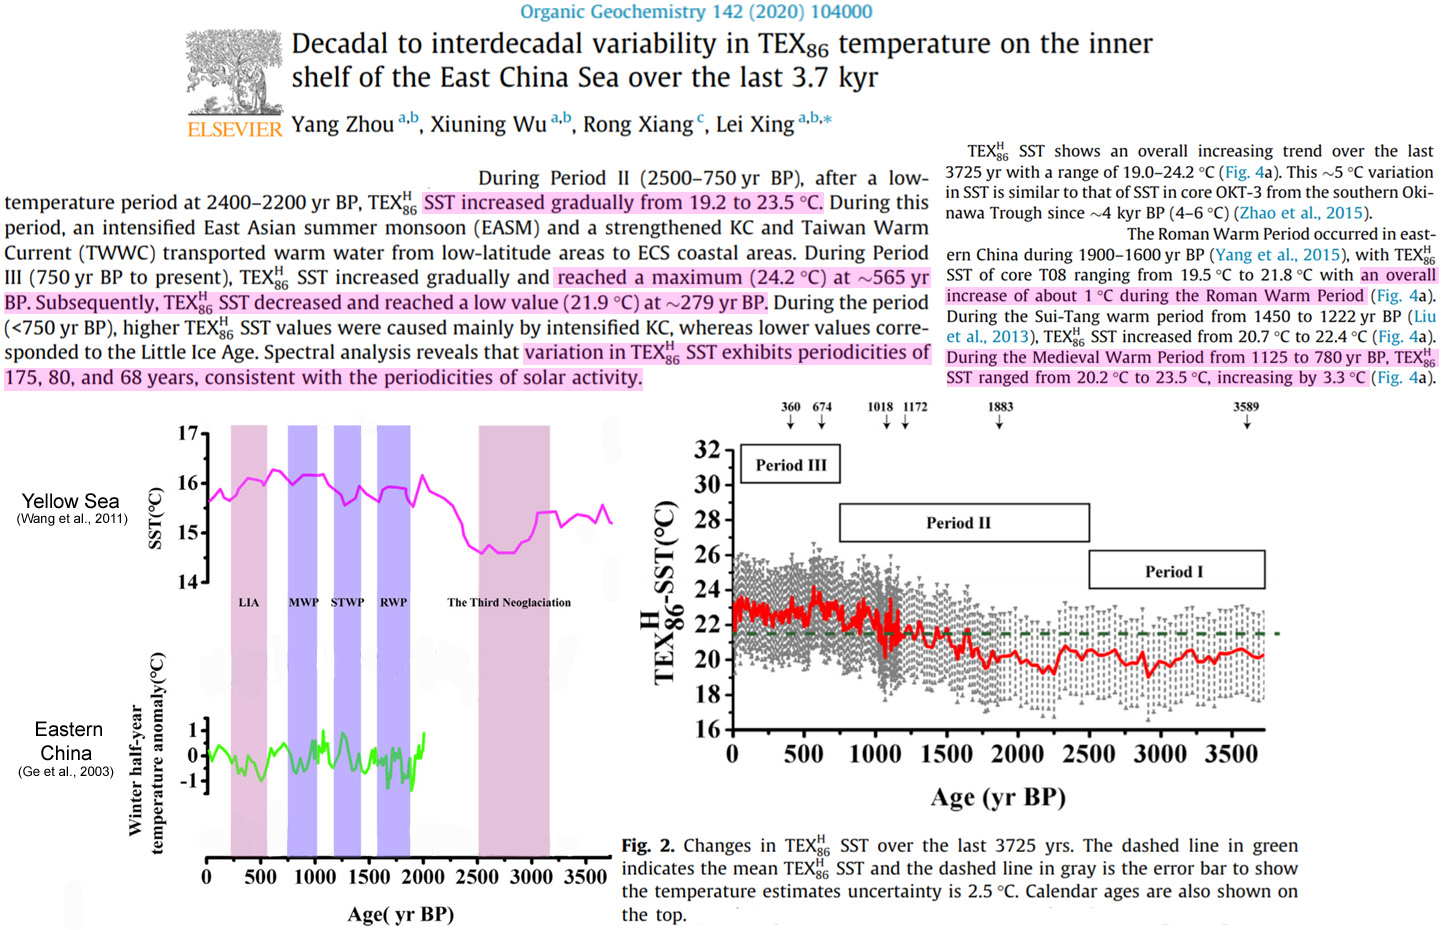
Liang et al., 2020 Tibetan Plateau temps “2.4°C higher than the present”
“Our climatic sequence shows that MTwa [warmest month] during the early Holocene was ca. 10.4°C and reached the highest value at 8.5–6 ka BP (ca. 11°C), followed by a long-term 1.2°C temperature decrease culminating in the coolest temperatures of the Holocene during the neoglacial cooling. The 8.2 ka cold event are indicated in the MTwa drop by up to 1°C. … [T]he Holocene thermal maximum occurred during 10–5 ka, as revealed by the pollen record from Ximen Co, with a warmer condition of ~2°C higher than the present (Herzschuh et al., 2014). However, in the Koucha Lake, the reconstructed temperature during the early-middle Holocene is only ~1°C higher than the present (Herzschuh et al., 2009). Climate reconstructions of Chen Co indicated that the highest temperature was found at beginning of the Holocene, and featured by a temperature of 2.4°C higher than the present (Lu et al., 2011). … Our temperature record correlates statistically and visually with solar-proxy (TSI), showing that cold periods in the eastern Tibetan Plateau are in phase with solar minima. This spectral similarity and phase correlation indicate a possible teleconnection of century-scale climate fluctuations through solar forcing. … Understanding the regularity of temperature change will greatly help predict the future climate dynamic. Our reconstructed MTwa, together with periodic characteristics indicate that we are in the middle of the 500-yr-long relatively warm period and suggest that this natural climate will persist for about some more decades.”
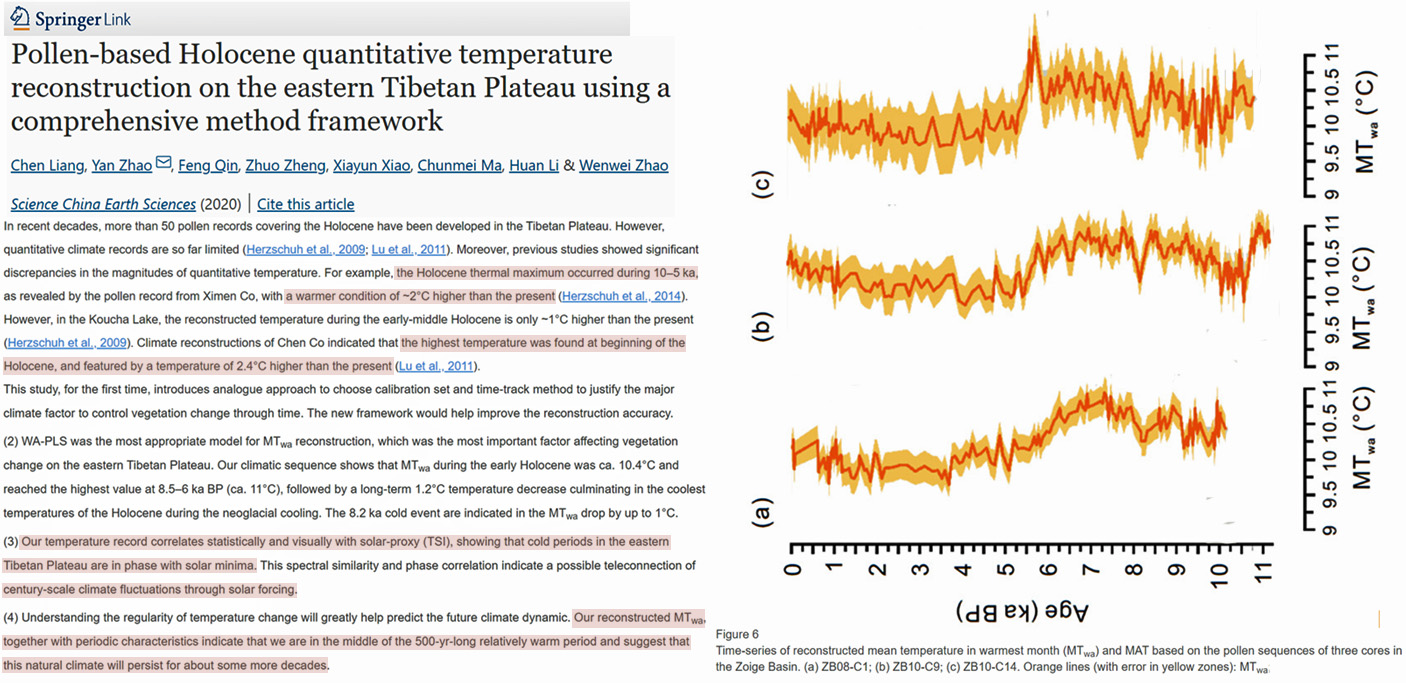
Sawada et al., 2020 NE China 3-5°C warmer during Holocene Thermal Maximum
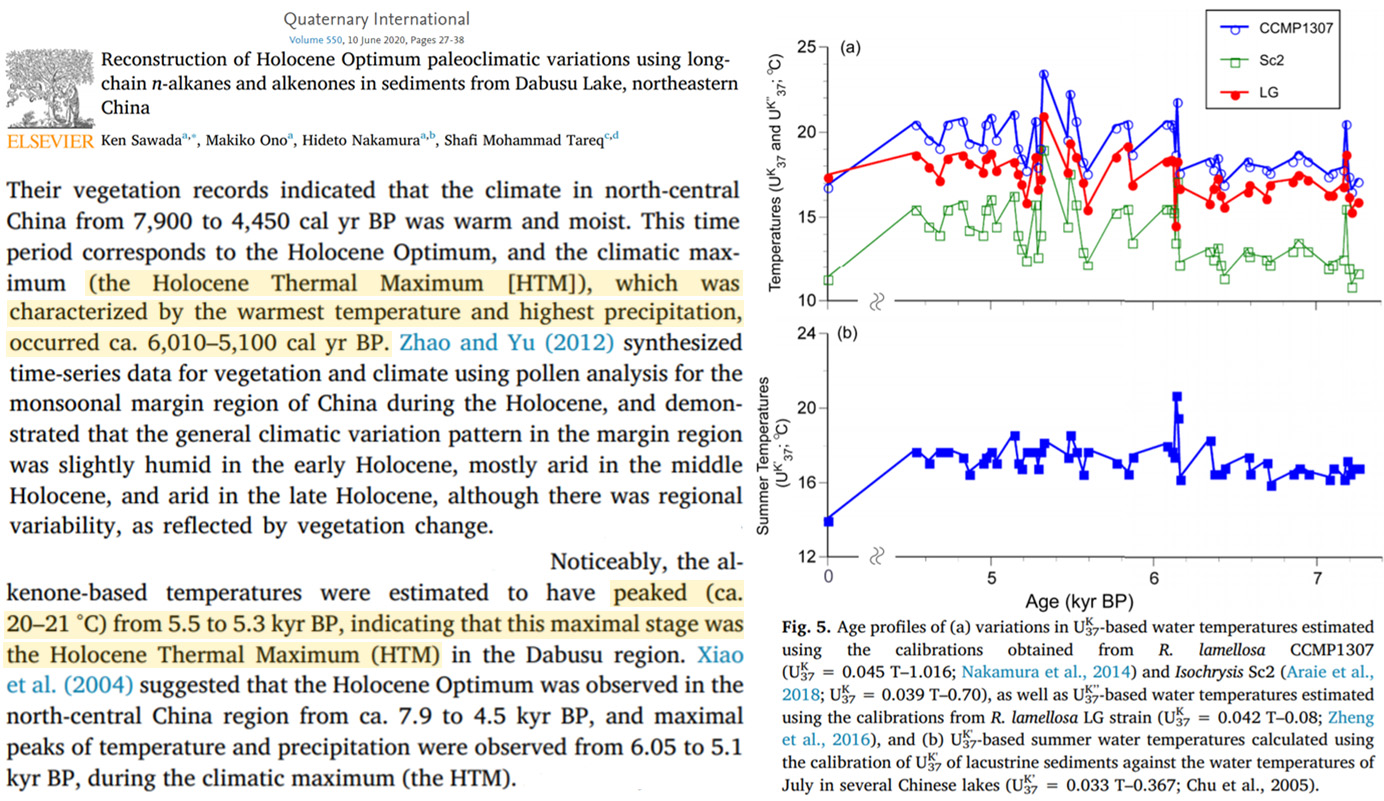
Shi et al., 2020 N. Scandinavia warmed 3.31°C/100 yrs from AD 336-435 vs. 0.85 °C/100 yrs 1901-2000
“In the Northern Scandinavia TSR reconstruction, the warmest 100-years mean June–August temperature (0.36 °C) occurred in AD 24–123, which is warmer than the 0.04 °C reconstructed for the recent most 100-years period (AD 1907–2006). Thus, the TSR reconstructions suggest that summer temperatures during the last century were not the warmest over the past two millennia. … The warming linear trend rate during the 20th century in Yamal is 0.40 °C/100 years from the instrumental data, which is larger than the three TSR reconstructions, but it is not the warmest trend; this occurred from AD 1812–1911 (2.64 °C/100 years). The Torneträsk results show similar features. The warming trend rate (0.85 °C/100 years) during the 20th century from the instrumental period is lower than that from AD 336–435 (3.31 °C/100 years). Similarly, the warming rate from AD 1453–1552 (1.37 °C/100 years) in Northern Scandinavia is larger than that (0.37 °C/100 years) during the 20th century from the original reconstruction (Esper et al. 2012). This indicates that the increasing warming rate of the recent 20th century is not unprecedented over the past two millennia in the three studied regions in the scenario, when the uncertainty of the influence of the tree growth trend is considered.”
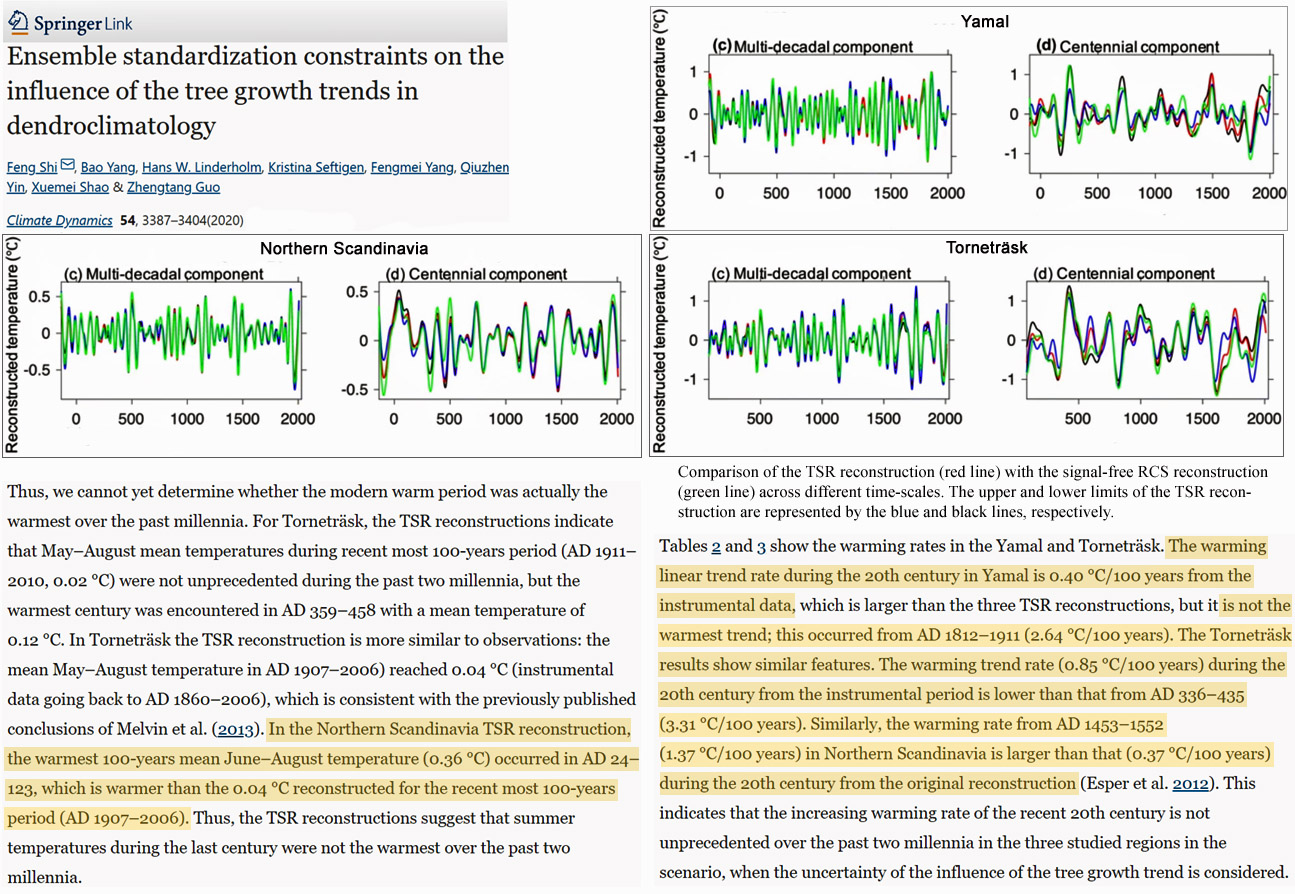
Pilø et al., 2020 Melting ice in Norway reveal a warmer time during the Viking Age
“Mountain passes have played a key role in past mobility, facilitating transhumance, intra-regional travel and long-distance exchange. Current global warming has revealed an example of such a pass at Lendbreen, Norway. Artefacts exposed by the melting ice indicate usage from c. AD 300–1500, with a peak in activity c. AD 1000 during the Viking Age—a time of increased mobility, political centralisation and growing trade and urbanisation in Northern Europe.”
(press release)
“Melting Ice Has Revealed Artefacts From a Lost Viking Highway in Norway … As the Lendbreen ice patch recedes, it’s revealing an absolute treasure trove of artefacts, some of which have been buried under the ice for thousands of years. … After a careful study of these objects, archaeologists have now confirmed that the region was once a heavily trafficked mountain pass around a millennia ago – and not just a pass. The presence of horseshoes and other travel accoutrements indicates the region could have once been a bustling (for the time) Viking highway.”
Churakova et al., 2020 Siberia “highest [VPD/temperature] values during the Medieval Climate Anomaly”
“Reconstructed July VPD [vapor pressure deficit] is highly correlated with the CRU gridded July maximum air temperature … Maximum values of the positive (dry) simulated VPD anomalies (+ 3.5σ) were revealed for the MCA (CE 800–1,070) and the RP (CE 1901–2004) (+ 2.9σ) periods, highlighting extreme anomalies during the medieval period compared to the recent period. … Reconstructed July VPD showed highest values during the Medieval Climate Anomaly period (800–1070) in the Siberian North compared to the period (1870–2004). This finding is similar to reconstructions of June–July air temperatures for this region using tree-ring widths from the same trees”
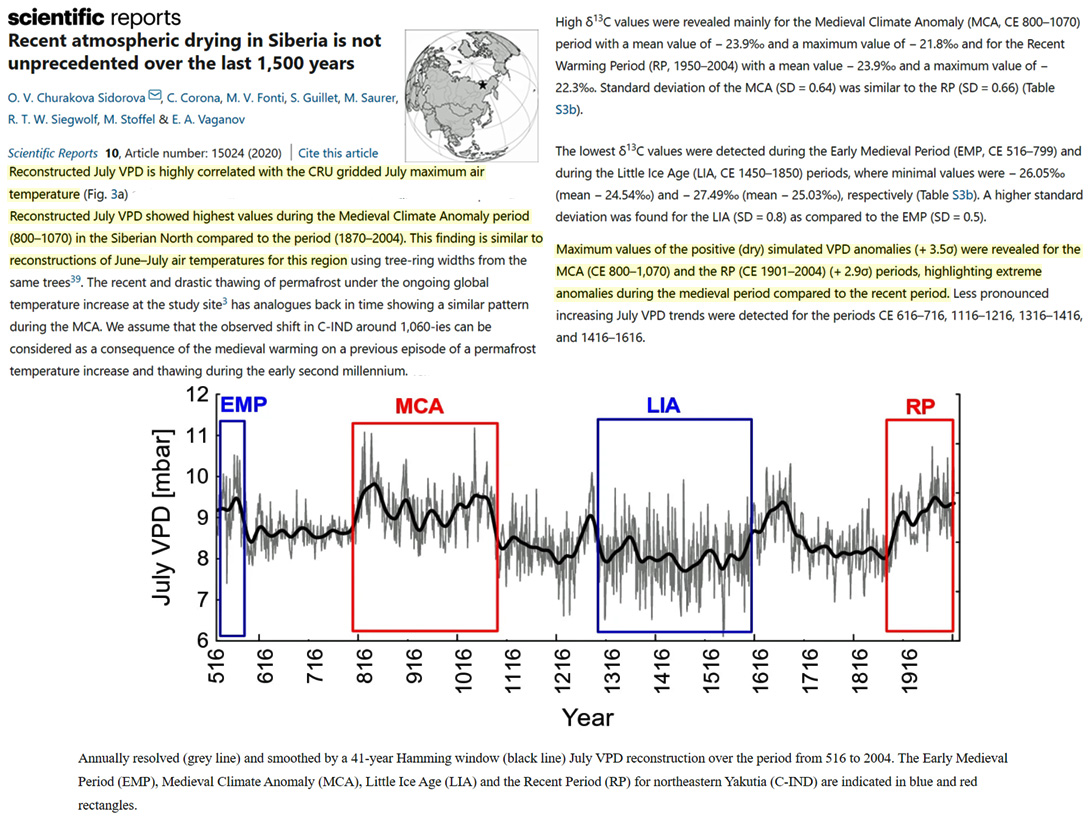
Badgely et al., 2020 Greenland 1-2°C warmer than present
“We focus on the last 20,000 years, which includes the end of the last glacial period, the glacial to interglacial transition, and the Holocene thermal maximum (HTM), when temperatures at the Greenland Ice Sheet summit reached 1-2 °C warmer than present (Cuffey and Clow, 1997; Dahl-Jensen et al., 1998).”
Boeskorov, 2020 Horses, oxen ate grass year-round in Arctic Siberia until “5300-2200 cal yr BP”
“Radiocarbon data show that wild horses inhabited the north of Yakutia during 5300–2200 cal yr BP. Musk oxen lived here about 3400 – 2600 cal yr BP. … To date, there are already several radiocarbon dates of horse remains from the north of Yakutia, which fall in the Middle and Late Holocene time frame. These dates clearly indicate that in the far north of Eastern Siberia, wild horses (most likely the Lena horse) lived in the Middle and Late Holocene, at least 5300–2200 cal yr BP.”
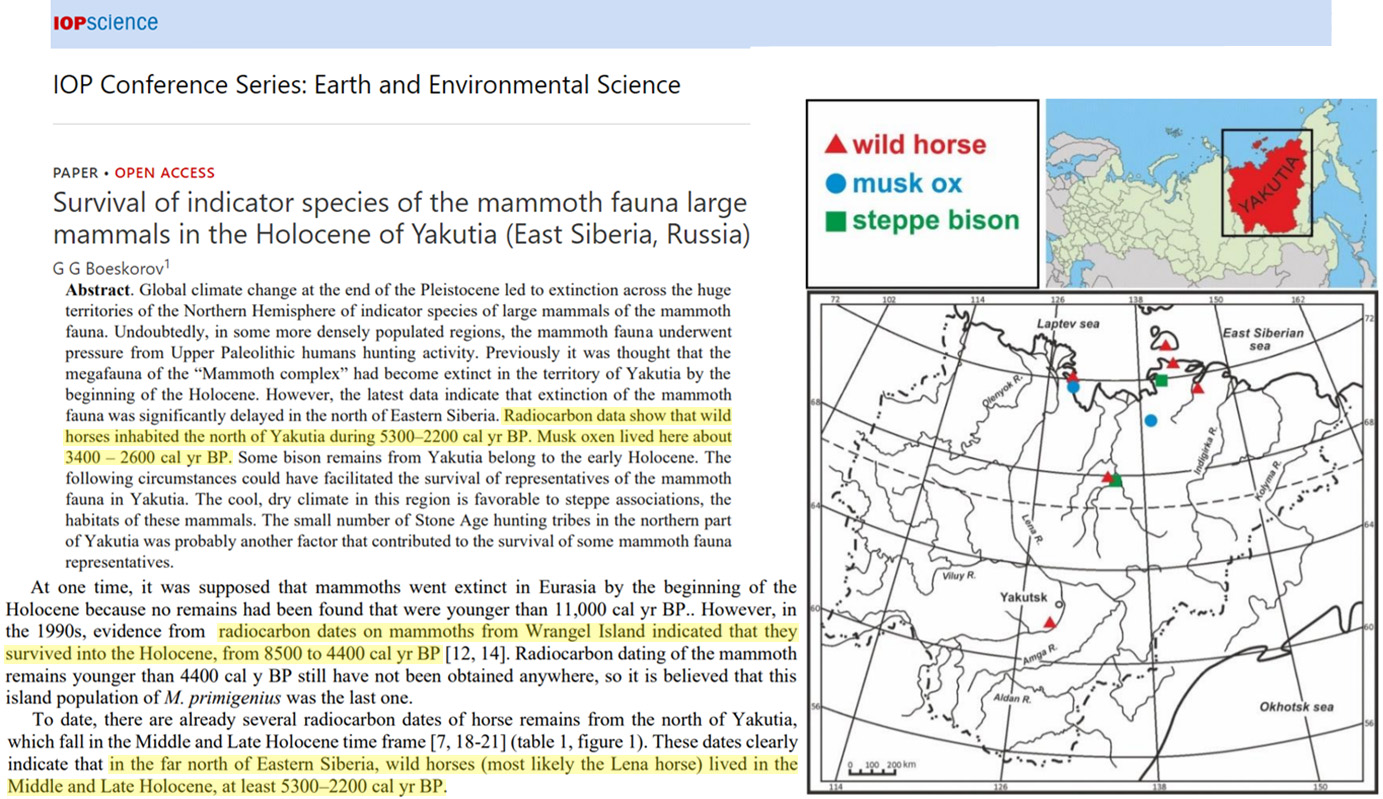
Chang et al., 2020 S. China warmer during Medieval times, 1400s, 1800s
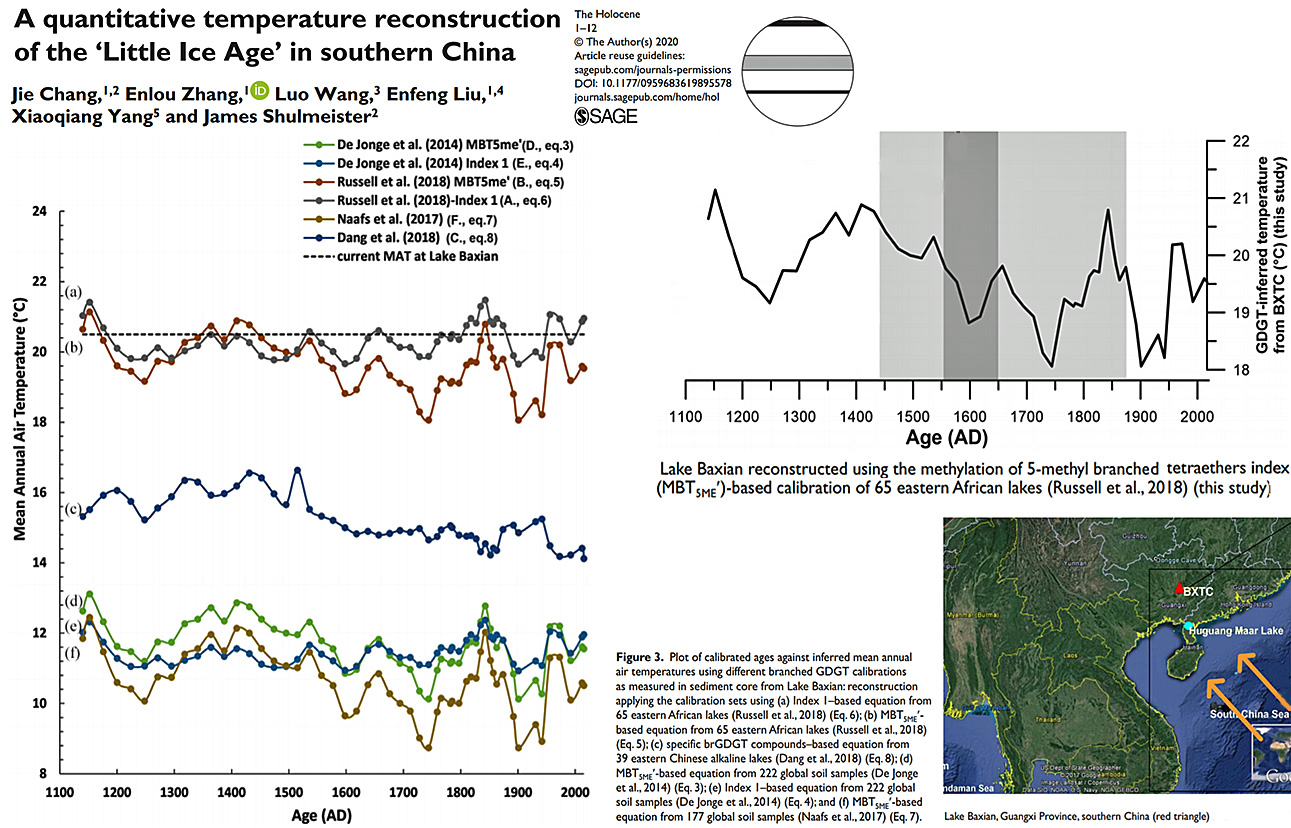
Muñoz et al., 2020 Illinois (USA) 13.5°C during 1870-2018, 17.1°C from CE 1000-1600
“Mean annual temperatures reconstructed from the MBT’5Me index range from 14.8–18.1°C, including a temperature maximum between CE 1000–1600 (x̅ = 17.1°C) bracketed by minima around CE 500–1000 (x̅ = 16.2°C) and 1600–1900 (x̅ = 15.8°C) (Figure 2a). The reconstruction tracks iCESM1 simulated mean annual temperatures (r = 0.53, t = 3.25, νeff = 19.32, p < 0.01), showing warmer temperatures between CE 1000–1600 that generally cool toward present. … Both reconstructed and simulated temperatures show late twentieth century warming that does not exceed temperatures of the Medieval period … Absolute temperatures differ among simulated (x̅ = 12.0°C; s = 0.65°C), reconstructed (x̅ = 16.5°C; s = 0.88°C), and instrumental temperatures for the period CE 1870–2018 (x̅ = 13.5°C; s = 0.82°C; National Weather Service, NWS, 2020) (Figure 2c). Instrumental temperatures fall within the 1σ prediction interval (±2.4°C) of reconstructed temperatures for the 20th century (x̅ = 15.3°C).”
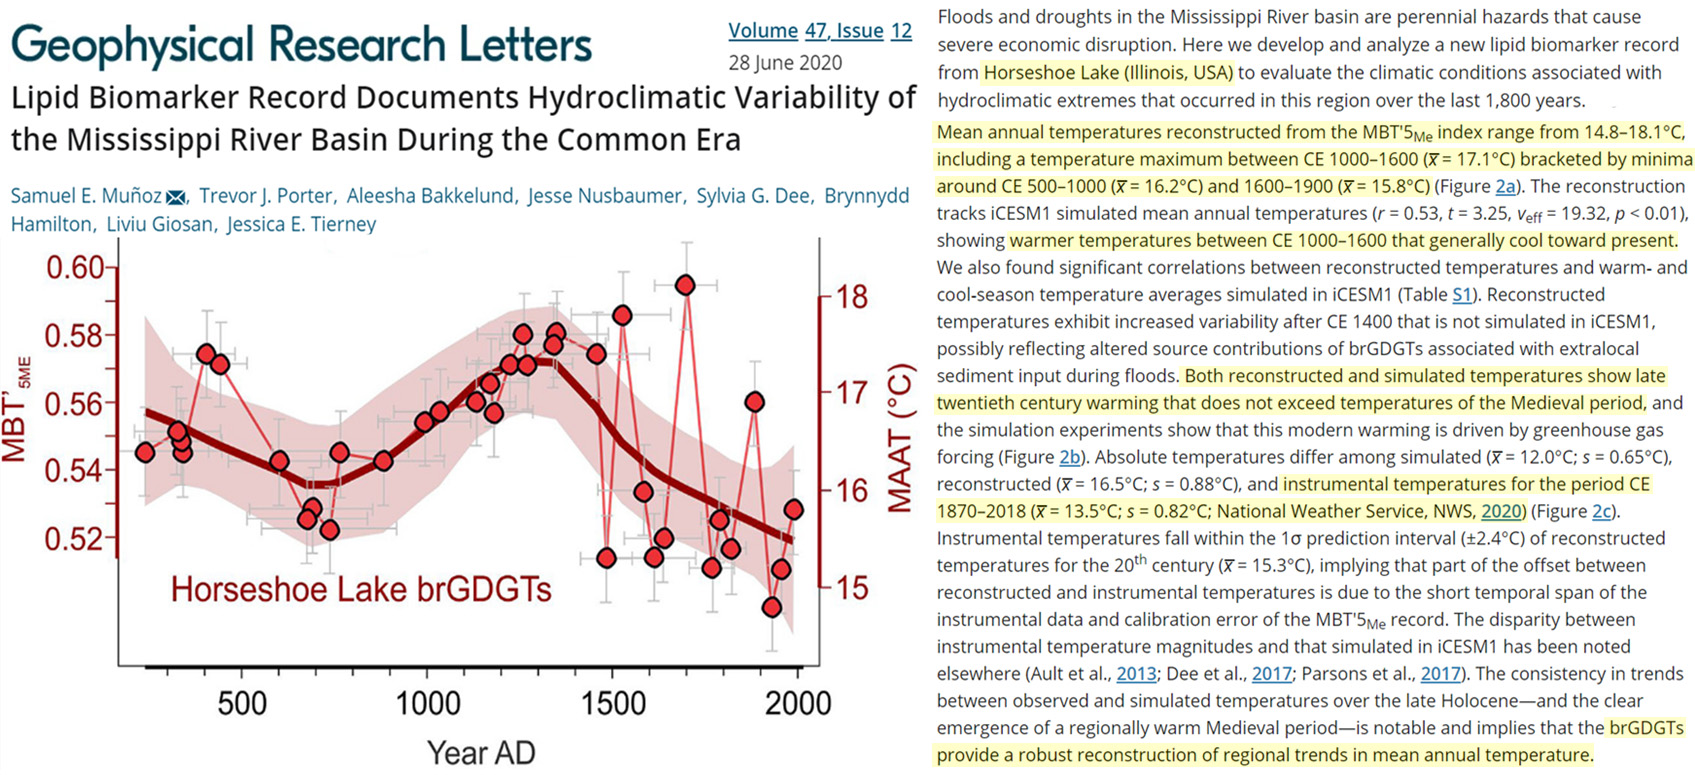
Miles et al., 2020 North Iceland ~2°C warmer (less sea ice) during Medieval Warm Period
“These results provide evidence that marked climate changes may not require an external trigger. The sea-temperature proxy decreased by 1.5°C during the 1300s CE, and the lower temperatures were sustained for centuries. The reconstruction described here provides strong empirical evidence in support of the provocative modeling studies (36–38) that suggest that abrupt multidecadal to century-scale cooling events can arise spontaneously. This interpretation, however, does not exclude the possibility that external forcing—volcanic and solar—may have contributed to the onset and/or development of LIA conditions, as suggested from forced modeling studies (7–11).”
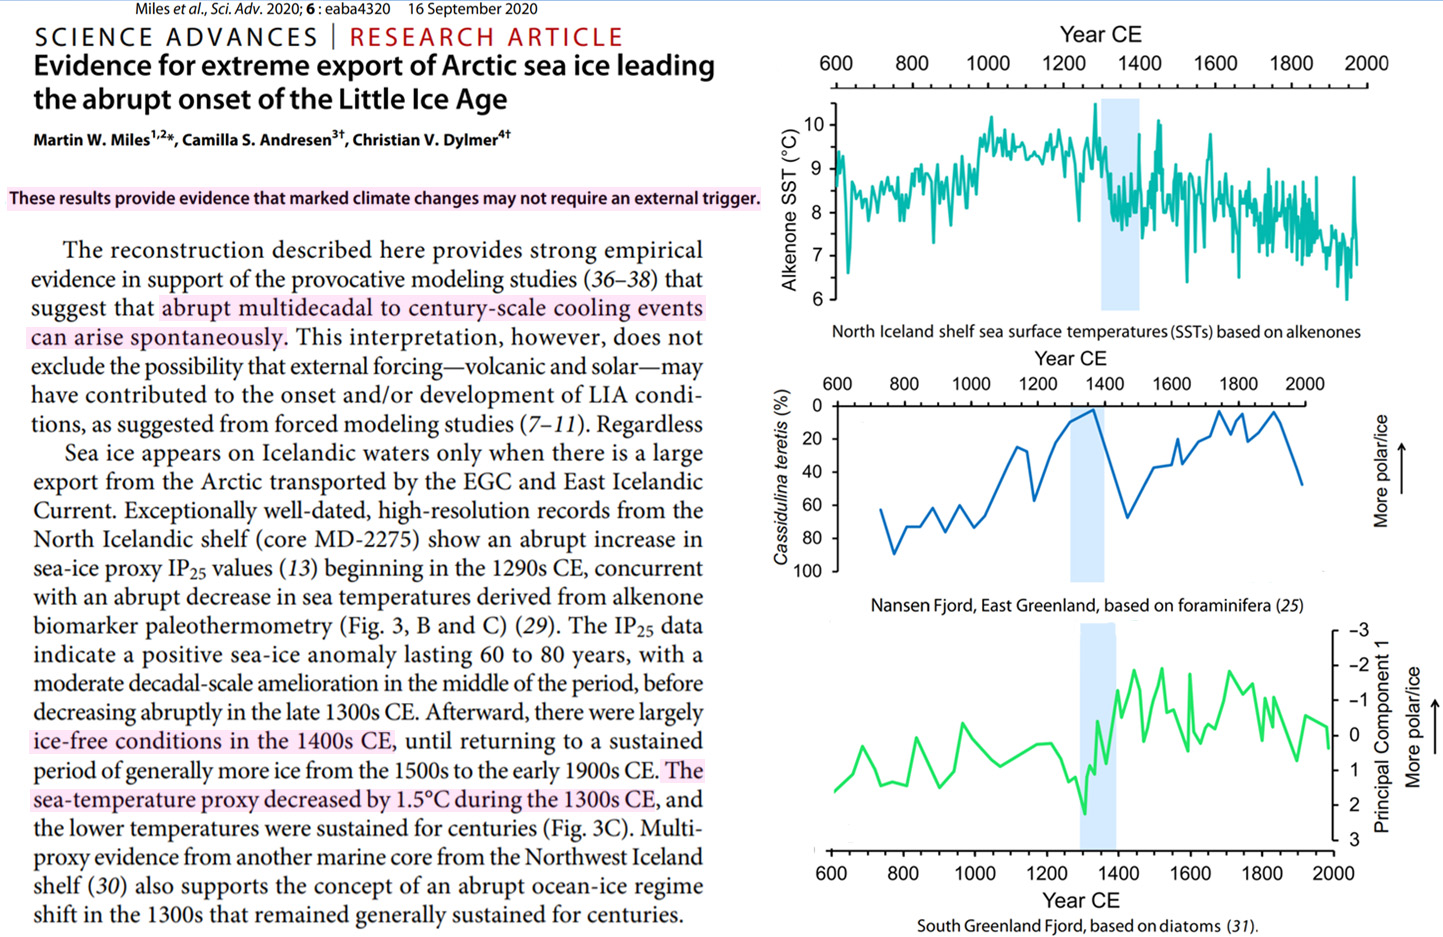
Lesnek et al., 2020 SW Greenland “~2 °C above modern mean annual air temperature”
“[N]umerical modeling indicates that warming of ~2 °C above modern mean annual air temperature is capable of producing sufficient melt to outpace mass gains from increased accumulation (Rae et al., 2012). This modest temperature increase is similar in magnitude to estimates of Arctic‐wide warming during the HTM (Kaufman et al., 2004). Therefore, our results suggest that in southwest Greenland, the warmest summer air temperatures over the entire Holocene occurred between ~10.4 and 9.1 ka.”
Ghadi et al., 2020 Southern Ocean site 2°C today, but 4°C 20,000 yrs ago and during the Early Holocene
“At present time, core SK 200/33 is located in the POOZ, north of the SACCF and WSI edge but 2–3° of latitude to the south of the southern APF (Fig. 1). The most recent diatom assemblages, dated from the earlymid Holocene, preserved in the core are strongly dominated by the POOZ diatom group (Fig. 3c), with few percent of SAZ diatoms (Fig. 3d), and the absence of sea-ice diatoms (Fig. 3a). These assemblages resulted in SST estimates of ~4 °C, which are ~2 °C higher than the modern regional SST of ~2 °C. … Summer SST of 2 to 4 °C were estimated during the interglacial periods while SST of 1 to 2 °C were generally estimated during the glacial stages, except for the short-lived warmer peak at 20 ka BP during the MIS 2. The interglacial SSTs were higher than the modern SST (2 °C) at the core site.”
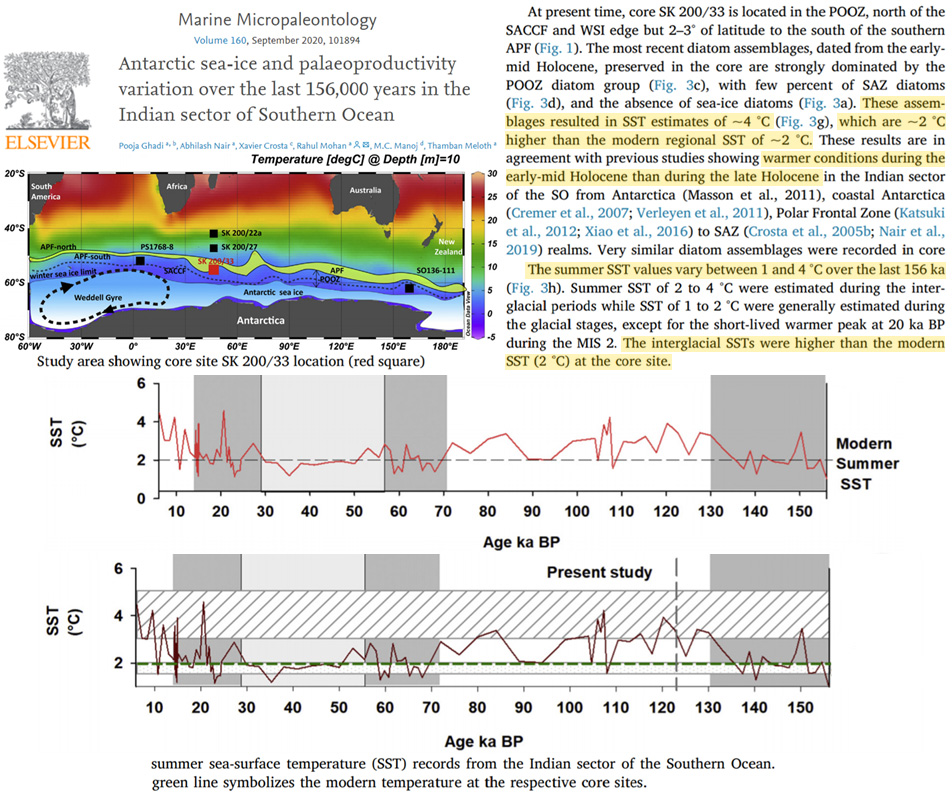
Hansen et al., 2020 Svalbard bottom waters 2°C warmer during last glacial/ice age
“Hansen et al. (2017) speculated that the presence of the vesicomyids in the area, including similar old specimens at theGakkel Ridge in the Arctic Ocean, was made possible by the short-lived increase in bottom water temperature due to a subsurface current of northward advection of Atlantic water below the cold meltwater layer, which led to > 2°C warmer bottom water temperatures than in modern times (Rasmussen et al. 2007, 2014; Ezat et al. 2014, 2016; Sztybor & Rasmussen 2017a, b). … We documented a novel Arctic bivalve, Acharax svalbardensis sp. nov., present in sediment cores from active methane seeping pockmarks at Vestnesa Ridge off Svalbard, at 79N. The new species, Acharax svalbardensis sp. nov., co-occurred with recently described vesicomyids, dated to ~19,000–15,600 cal. years BP. This period of time corresponds to the Heinrich Stadial HS1, where surface water conditions were colder and bottom water conditions warmer (up to 2°C warmer) than today. We suggest that the presence of the newspecies and its restricted stratigraphical distribution are linked to the warmer bottom water conditions in the North Atlantic and Arctic region during HS1.”
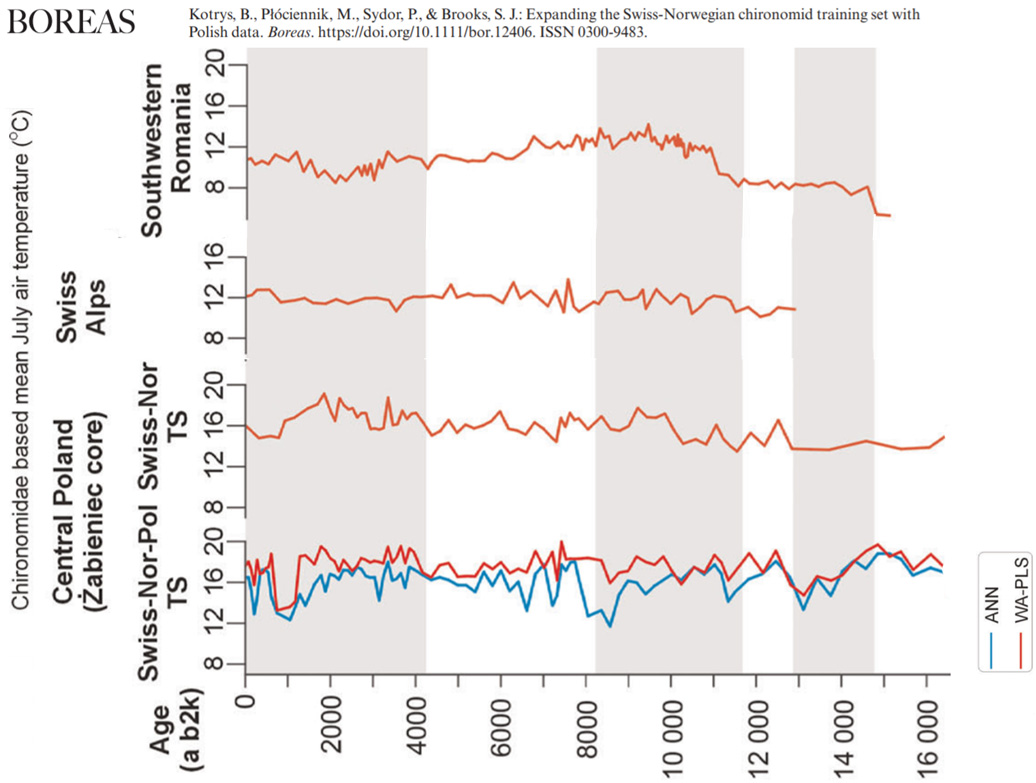
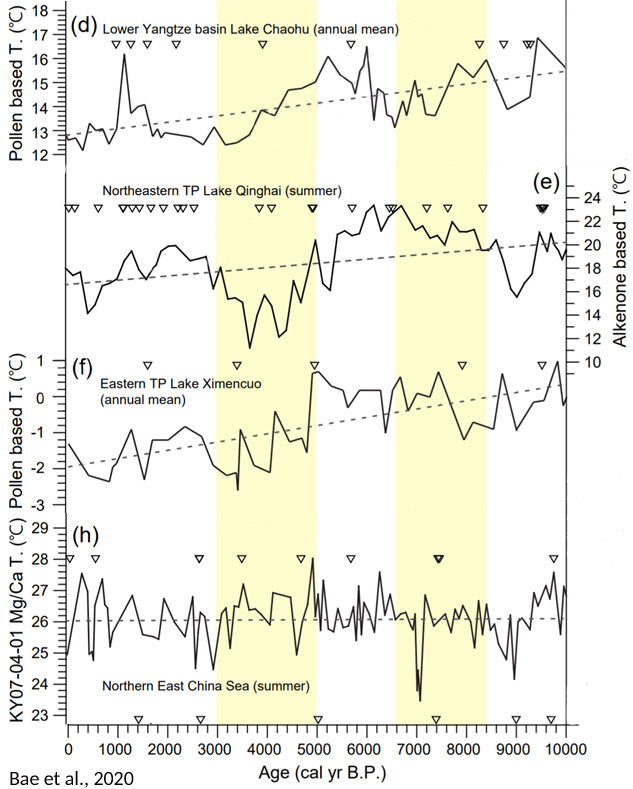
Orme et al., 2020 Southern Ocean SSTs “~1°C higher than today”
“These data however suggest slightly 200 more extensive sea ice cover between 14 and 12 ka BP and after 8 ka BP, and a slight retreat of winter sea ice between 12.2 and 8 ka BP when SSTs were ~1°C higher than today. Relatively low values of the inferred winter sea ice concentration suggest only sporadic and relatively short-term (perhaps decadal to multidecadal scale) expansions of winter sea ice to the coring location throughout the Holocene.”
Blagoveshchenskaya, 2020 E. Europe winter temps 11°C warmer than Little Ice Age, 4°C warmer than today
“In the Late Atlantic period (AT-2, 6000–4500 BP/6700–4200 cal. BP) (the second half of the Middle Holocene), the leading role in the formation of landscapes was also played by climatic factors, particularly higher temperatures of the growing season and less severe conditions in winter. It was in the Late Atlantic phase that the heat-to-moisture ratio in the study area was optimal: the January and July temperatures were 2–3°C higher than today (‒7 to –7.5°C and 23– 23.5°C, respectively) … Sharp climate cooling occurred 700 years ago, which marked the onset of the so-called “Little Ice Age” [29]. The summer and winter temperatures decreased by about 2°C (the average annual temperature was not more than 2–2.2°C, the average January temperature was –18°…–19°C, the average July temperature was +15.0°… +15.5°C“
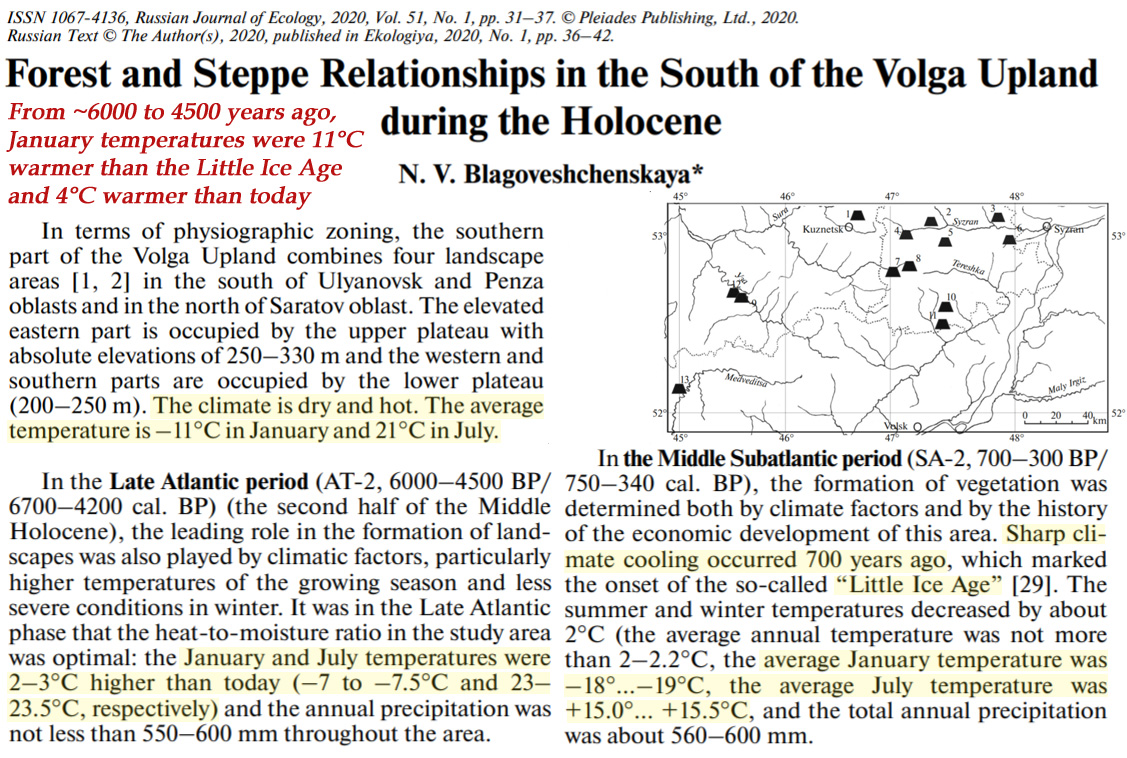
Schenk et al., 2020 Greenland temps 4-7°C warmer, Sweden temps already “near-modern” by 15,000 yrs ago
“Although more sites across a larger spatial area are required to confirm the pre-Allerød results from this study, it appears that July temperatures were already high as soon as the lakes started to form. Similar results are known for the deglaciation around Greenland where remarkably high summer temperatures ~4-7°C warmer than today were reconstructed as soon as melt waters did no longer reach the lake with the Early Holocene (McFarlin et al., 2018; Axford et al., 2019). As already found by Bjorck et al. (2002) for southern Greenland, it appears that summer temperatures were high even during the YD in close vicinity to the Greenland ice sheet as well as south of FIS (this study). … Although the number of sites and hence indicator species is very low during the pre-BØ, BØ and OD, the presence of indicator species with high thermal requirements such as Herniaria glabra (TJuly ~16.5°C), Silene nutans (15.1°C) or Alisma plantago-aquatica (14.4°C) at Bjorker odsmosse and possibly Lotus corniculatus (14.5°C) at Slotseng, indicates near-modern July temperatures even by ~15 ka BP in close vicinity to the FIS margin at that time. We also find clear evidence for equally high July temperatures during the YD stadial of at least ~14°C and possibly up to ~16°C consistent with high summer temperatures found in previous studies (e.g. Birks and Birks, 2014; Schenk et al., 2018).”
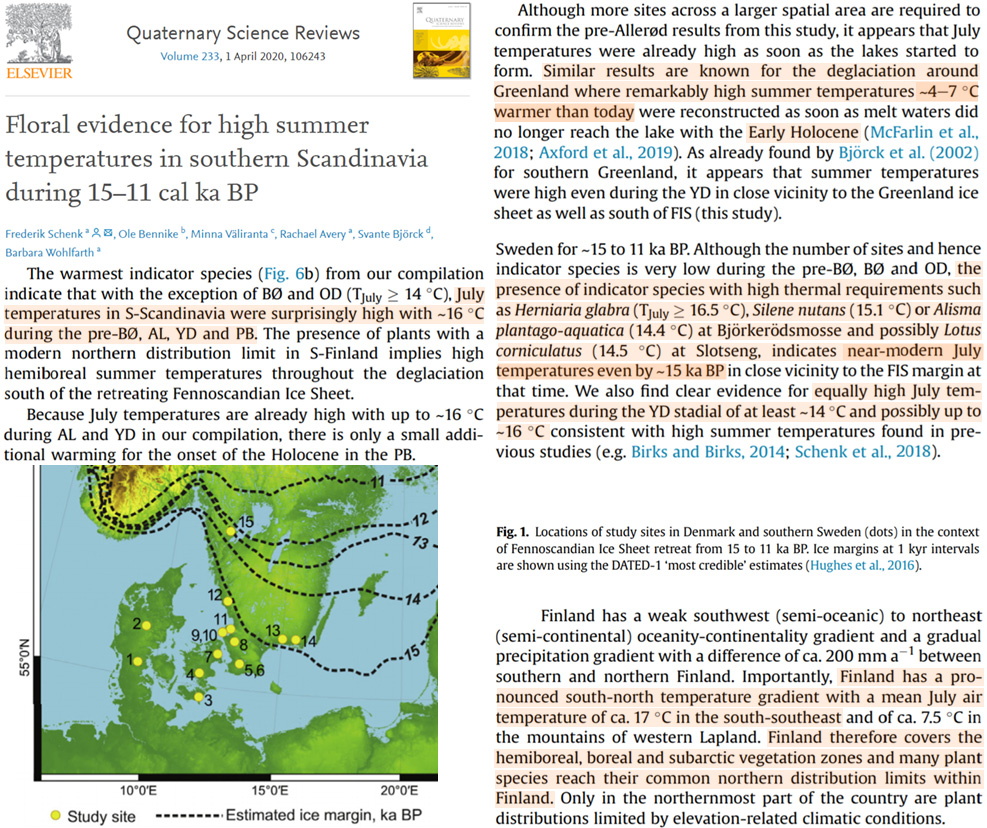
McCulloch et al., 2020 SE Pacific ~2°C warmer 11,000 yrs ago
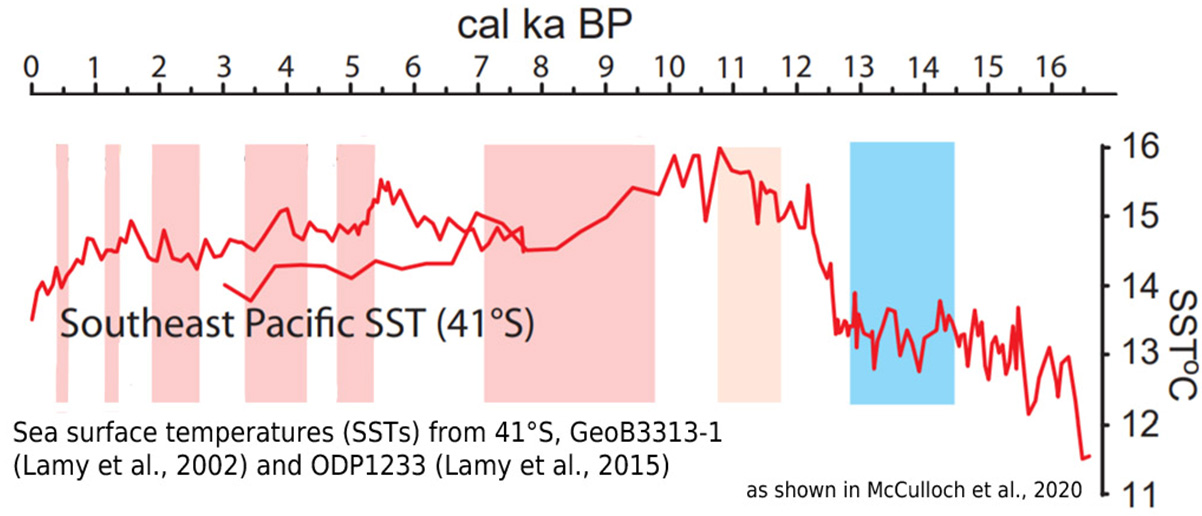
Elmslie et al., 2020 “northern Ontario was ~2–3 °C warmer than the modern climate”
“Atmosphere-ocean vegetation models have suggested that the HTM in northern Ontario was ~2–3 °C warmer than the modern climate (Renssen et al., 2009, 2012). Recent work from northwest Ontario (~1200 km to the west of our study site) reveals that the HTM occurred from ~8500–4500 cal yr BP (calendar years before present) and was ~2 °C warmer than present conditions. This estimate was calculated using a modern analog technique (MAT) calibration based on fossil pollen and a regional set of modern pollen and climate data (Moos and Cumming, 2011).”
Kajita et al., 2020 Tokyo Bay temps 1-2°C higher than those at present
“The reconstructed temperatures in Tokyo bay were generally higher than those in the present, exhibiting a declining trend over the long term, which roughly matches the changes in the orbitalforcing summer insolation throughout the northern hemisphere (Fig. 4a and b) (Laskar et al., 2004). This trend is also consistent with the millennial scale 2-3°C temperature decrease during the mid- to late-Holocene recorded in the core from the Boso peninsula … The timings of these cold periods were generally coincident with minimums in solar activity (Fig. 4c) and/or large volcanic eruptions, except for the coldest event, C1 (Fig. 4d) (Sigl et al., 2015; Solanki et al., 2004). … Temperatures from ca. 2400 BCE to 900 BCE were generally 1-2°C higher than those at present, except for the large cold period ca. 2300 BCE (C1). The relatively warm climate during the mid-to-late-Holocene is consistent with the results of previous paleoclimate studies based on paleofaunal characteristics of coastal areas near Tokyo bay. In shell mounds dated to between 2000 and 3000 BCE, species that inhabit relatively warm seas, such as Anomalocardia squamosa, Meropesta nicobarica, Cerithium coralium, Nassarius bellulus, and Guamanian nerite, have been identified, indicating that the SST at this time was warmer than the present by 1-2°C (Matsushima, 1979, 2006). Fossil corals dated to between 2000 and 4500 BCE, recovered from raised terraces in Tateyama, also suggest that the SST was approximately 2°C higher during this period (Nakata et al., 1980).”
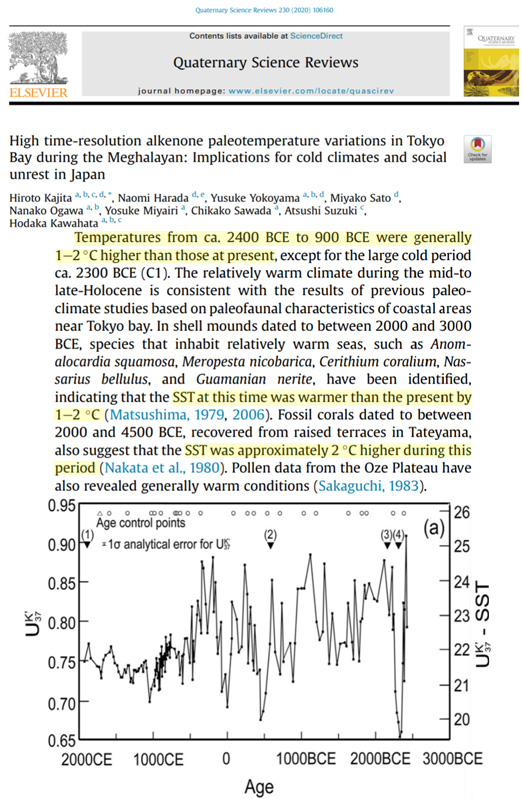
Ni et al., 2020 Holocene Baltic Sea bottom water temps peaked at 9-13°C warmer (16-20°C vs. 7°C)
“Although the absolute temperature values of Mg/Ca‐based and δ18O‐based reconstructed bottom water temperature differ, both show a steady temperature decrease of ~7 °C from 4.1 to 2.5 ka BP. This coincides with the period of salinity decrease, indicating substantial environmental change. Tδ18O increased slightly around 2.5 ka BP, following the previous decrease, and became relatively less variable, with a mean Tδ18O value of 5.2 ± 1.2 °C. This is in the same range as modern bottom water temperature during winter or spring, which is known as the period when a majority of typical shallow‐water foraminiferal calcification occurs (e.g., Gustafsson & Nordberg, 2001). Mean temperature from both proxies was lowest between 2.5 and 0.5 ka BP (3.0 ± 2.1 °C). … During the beginning of Littorina Sea stage (~7.5–4.5 ka BP), the southern Baltic experienced multiple marine transgressions when the ongoing sea level rise outpaced glacioisostatic rebound (Björck et al., 2008). The mean sea level reached its highest level in the Baltic during the Littorina Sea stage (~7.5–~5 ka BP in Berglund et al., 2005). The water depth in the Little Belt increased considerably (~5–8 m) during these transgressions (Berglund et al., 2005), which led to a significant increase in North Sea water inflows due to deeper sills and straits.”
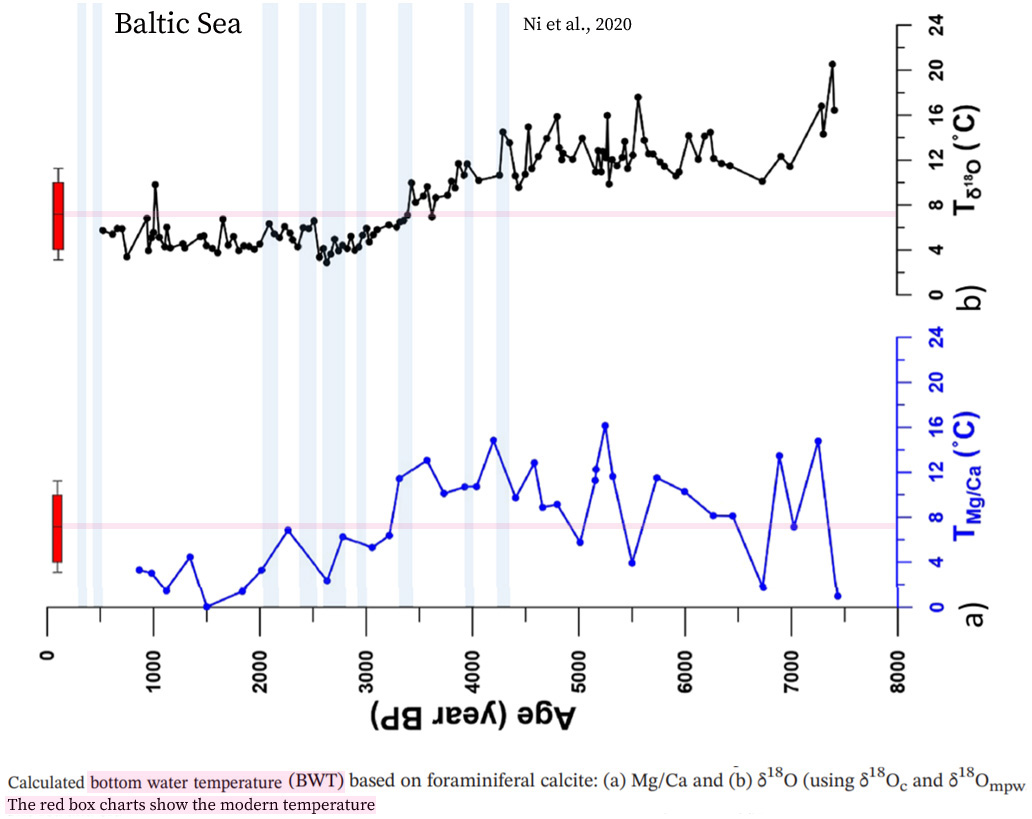
Sommer, 2020 Europe warmed -6°C to +13°C “within a few years” (interstadials); “2-3°C higher than today” 9-5 ka
“From 60,000 to 27,000 years ago (ka), during the Marine Isotope Stage 3 of the Quaternary, the northern hemisphere was characterized by a generally cold environment punctuated by regular warm intervals, the Greenland Interstadials, which lasted from several 100 years to around 3000 years (Fig. 1). … The landscape of Europe north of the glacial refuge areas (Fig. 2b) was characterized by open steppe-tundra (so-called mammoth steppe) with an annual mean temperature of -4°C to -8° C (Hubberten et al. 1998)…. During warmer Interstadial periods the mean temperature rose abruptly (within a few years) to around 10–16°C and led to a spread of animal and plant species from the southern refuge areas (e.g., Balkans or Iberia) to at least 50 latitude, significantly changing regional biotic assemblages. … During the Holocene Thermal Maximum within the Atlantic climatic period, about 9–5 ka (Fig. 2c and Table 1), when annual mean temperatures were up to 2–3°C higher than today (Renssen et al. 2009), Central Europe was largely forested, with oak, elm, lime Tilia sp., and pine dominating in the lowlands and spruce Picea sp., beech Fagus sp., and fir Abies sp. predominant at higher altitudes.”
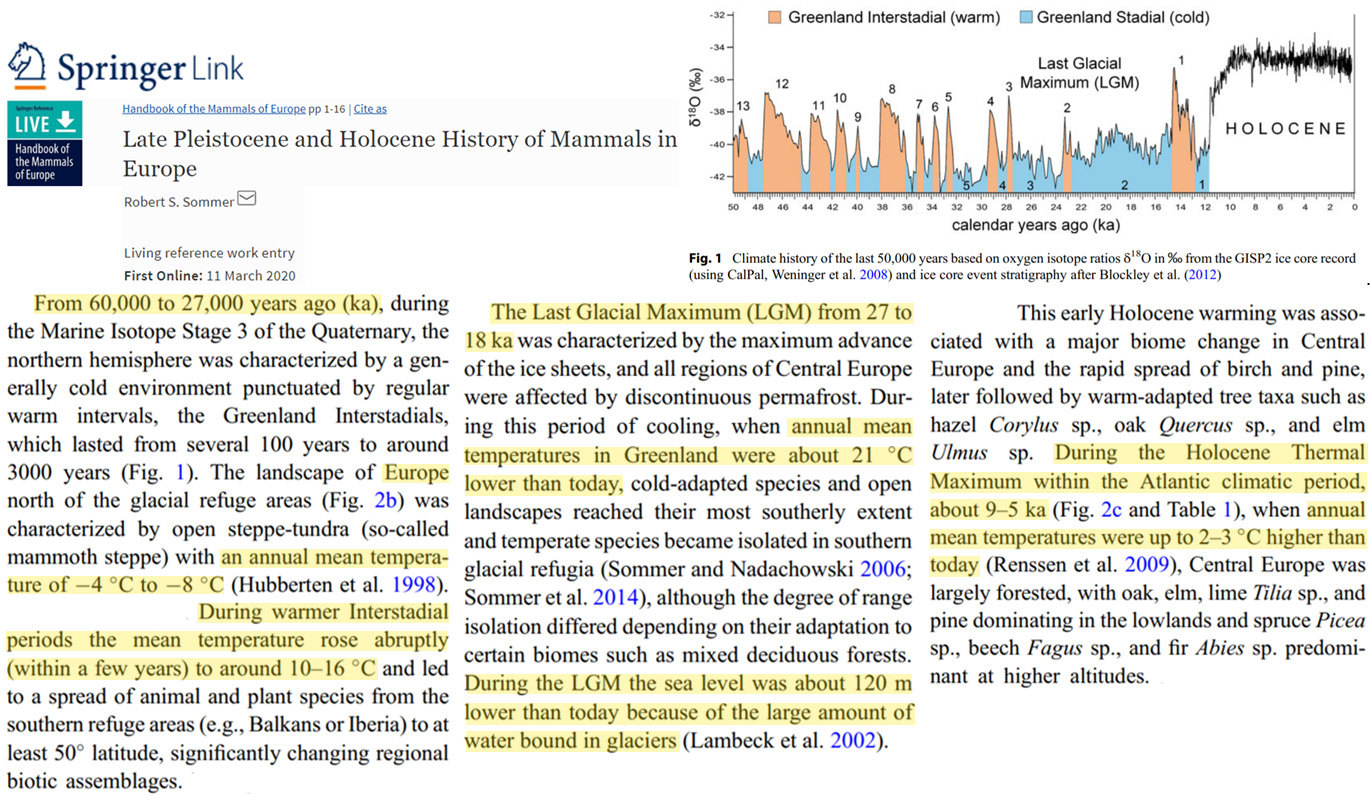
Tesi et al., 2020 Victoria Land, Antarctica, overall cooling last 700 years
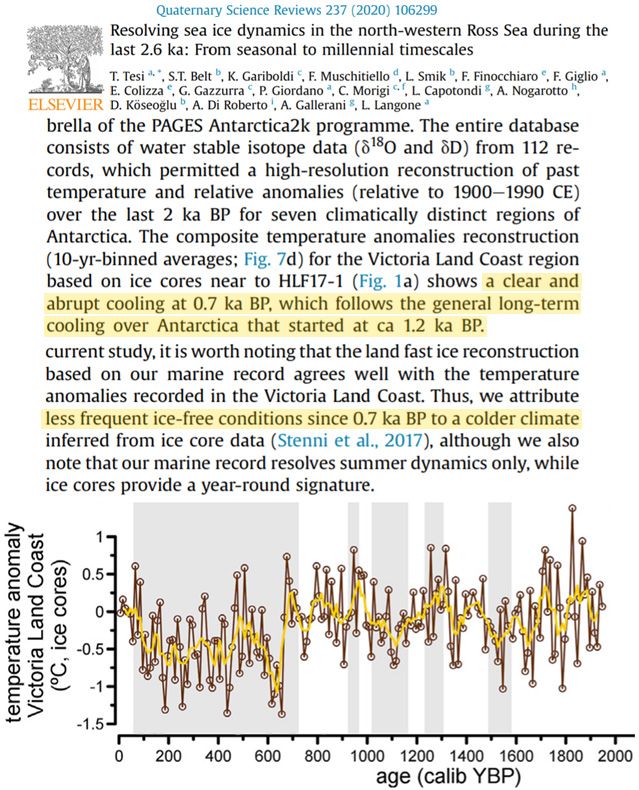
Yao et al., 2020 West Central Asia warmer 1,000 yrs ago
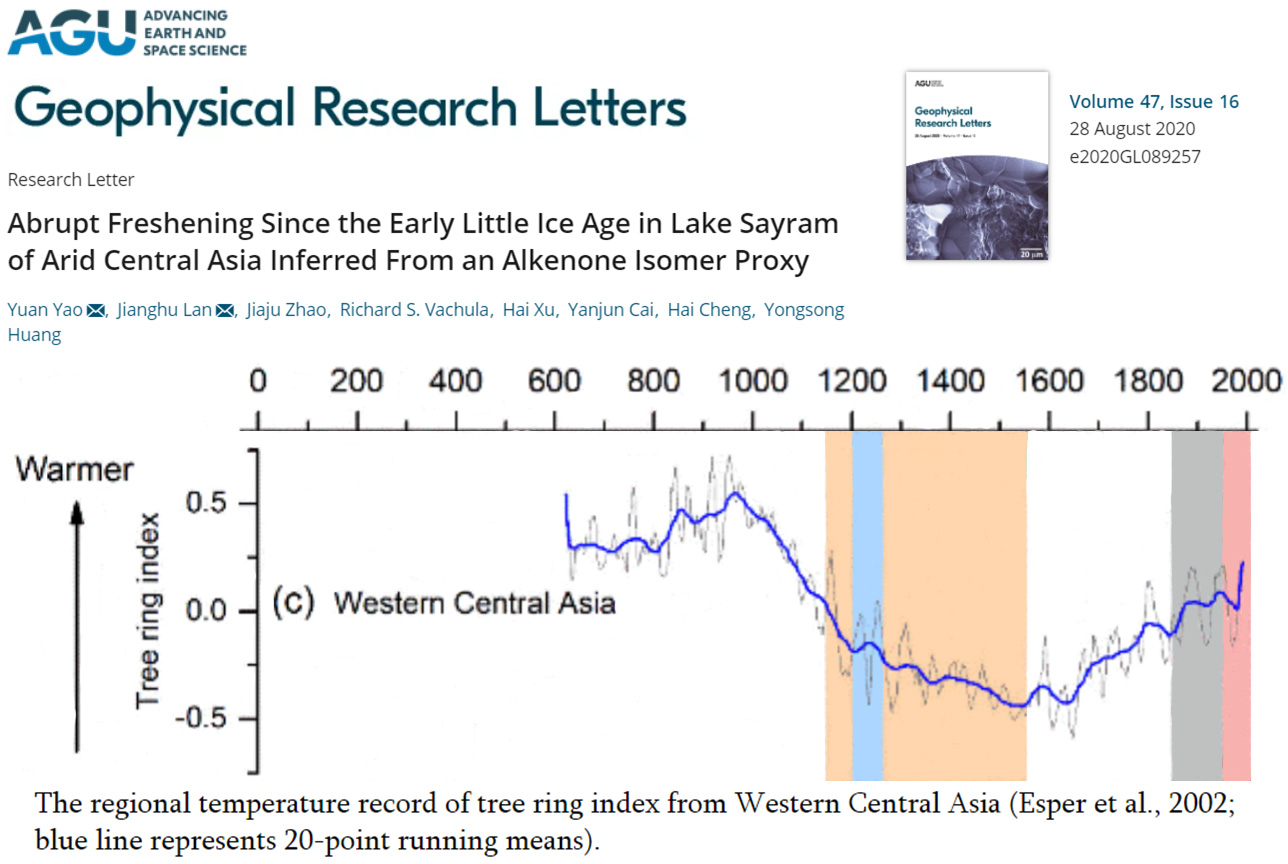
Fedorov et al., 2020 Arctic climate warmer 10-3,000 yrs ago, 4-8°C warmer last interglacial
“In the recent past, Arctic climate was warmer than today at both the last interglacial (the Eemian, 130 to 110 thousand years ago; kyr) and the Holocene thermal maximum between 10 and 3 kyr (1, 5). Species distribution shifts, often associated with local extinction, were the most common response to the Late Quaternary environmental change (6). During warming events, Arctic tundra was reduced as boreal forest communities advanced to the north and was simultaneously restricted from northward retreat by the seacoast (1, 5). … Paleoclimate reconstructions show that the climatic optimum during the last interglacial was the warmest event of at least the past 250 kyr and this warmth strongly affected the Arctic biota (5). Terrestrial records suggest that the Arctic amplification produced last interglacial summer temperature anomalies 4 to 8 °C above present over the most of the Eurasian Arctic but a smaller increase of 2 to 4 °C was inferred in West Beringia (5). The last interglacial increase in summer temperature promoted the northward boreal forest expansion with tree line reaching the Arctic Ocean coastline and likely eliminating tundra from the landscape across the European (26, 27) and most of the Siberian Arctic (28, 29). … Notably, all modern cytochrome b sequences belong to the mtDNA lineage (EA5) that appeared in western Eurasia at 20.5 kyr (15), thus suggesting a recent origin for the phylogeographic structure revealed by our analysis of the present-day variation in nuclear and mitogenome. … Pollen and plant macrofossil records show that, over a large part of northern Eurasia, forest expanded to or near the Arctic coastline between 10 and 3 kyr during the Holocene thermal maximum (35–38).”
McEwen et al., 2020 Norway temperatures “1.0 -3.0 °C higher than today”
“Whereas the stabilization of the upper fan surface has been dated to within a millennium by exposure-age dating, the duration of the stable phase is very poorly constrained by the soil radiocarbon dates. Fan stability is likely to have persisted through a long interval of the mid Holocene when, from ~8.0 to 5. 5 ka, glaciers both in the neighbouring Smørstabbtindan massif and more widely throughout southern Norway were smaller than today and absent for much of the time (Matthews and Dresser, 2008; Nesje, 2009). This period of time corresponds with the Holocene Thermal Maximum (HTM) when, according to local and regional proxy records, mean annual air temperature is likely to have been 1.0 -3.0 °C higher than today (Dahl and Nesje, 1996; Jansen et al., 2008; Seppä et al., 2009; Velle et al., 2010; Lilleøren et al. 2012; Eldevik et al., 2014).”
Bazzicalupo et al., 2020 Alboran Sea summer temperature 1.2°C warmer
“For the last 8 ka, the average annual SST is about 18.5°C, while winter SST in the Alboran Sea varies around ca. 15°C, in agreement with modern conditions (15.4°C; Locarnini et al., 2013) (Figure 3). The average summer SST is 22.6°C, exceeding modern ones (21.4°C; Locarnini et al., 2013)”
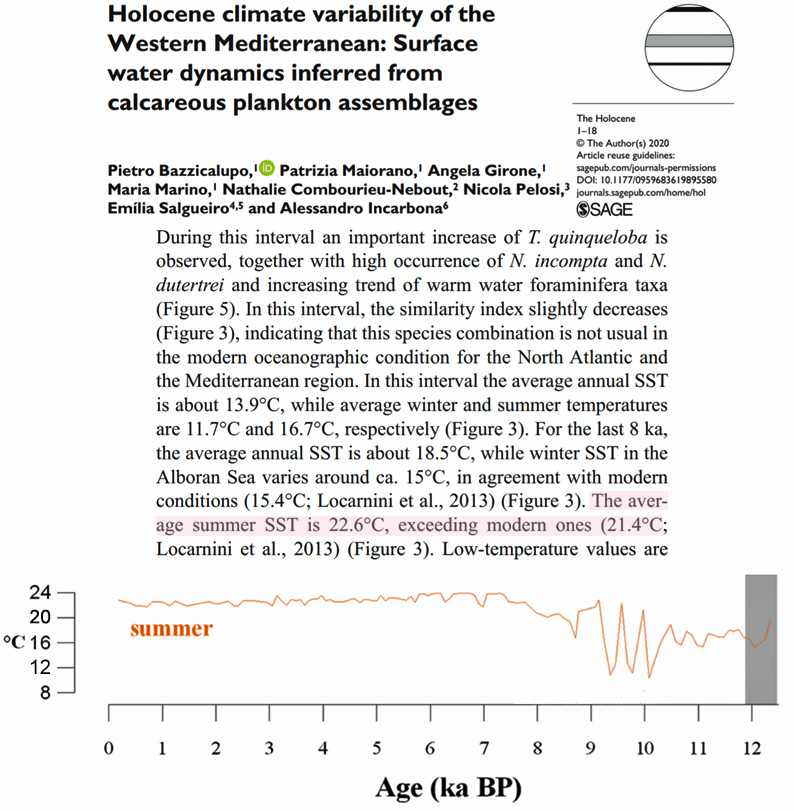
Lesnek et al., 2020 Greenland 2°C warmer 9-10,000 yrs ago
“Model simulations suggest that the principal control on mass balance in land-based ice sheet areas in southwest Greenland is summer temperature (Cuzzone et al., 2019;Schlegel et al., 2016). Low levels of winter precipitation may also contribute to fast ice recession, and conversely, increased snowfall during periods of warmth has been hypothesized to partially offset temperature-driven mass loss (Thomas et al., 2016). However, numerical modeling indicates that warming of ~2 °C above modern mean annual air temperature is capable of producing sufficient melt to outpace mass gains from increased accumulation (Rae et al., 2012). This modest temperature increase is similar in magnitude to estimates of Arctic-wide warming during the HTM (Kaufman et al., 2004). Therefore, our results suggest that in southwest Greenland, the warmest summer air temperatures over the entire Holocene occurred between ~10.4 and 9.1 ka.”
Hao et al., 2020 China warmer during Medieval Warm Period
“Figure 1a shows the temperature variation in China for the past 2000 years integrated from 28 proxy reconstructions such as historical documents, tree rings, stalagmites, lake sediments, and ice cores. Despite the existence of several cold decades in the middle and late 12th century, the 10th–13th centuries were the longest warm period on the centennial scale. Taking AD900–1900 as the reference period (REF, herein after), which covered both the MCA and Little Ice Age (LIA), the mean temperature of 950–1250 was 0.3°C higher than in REF and 0.5°C higher than in the LIA (about 1450–1850). The warm climate lasted until around 1300. The mean temperature of the two warmest 100 years (1020–1120 and 1190–1290) in the MCA was slightly higher than that of the 20th century. Meanwhile, the mean temperature of the two warmest 30 years (1080–1110 and 1230–1260) was comparable to that of the warmest 30 years in the 20th century (1970–2000).”
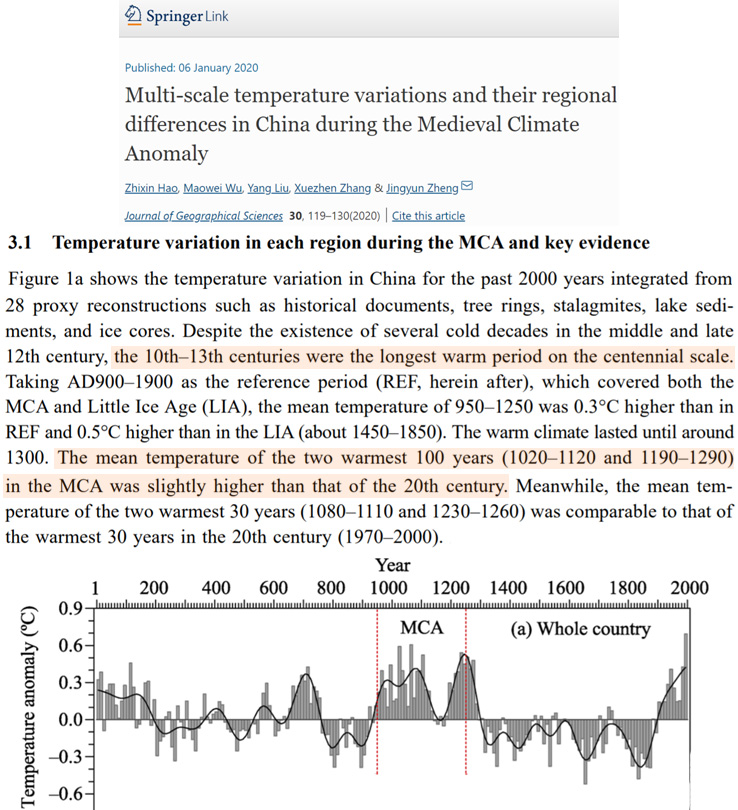
Jimenez-Moreno et al., 2020 Mediterranean SSTs 2-3°C warmer
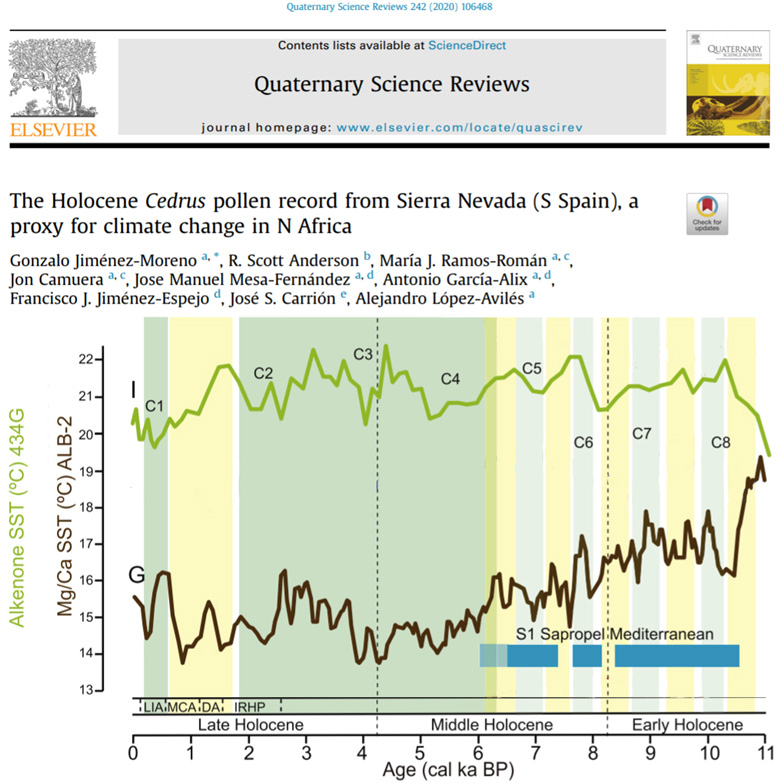
Mikharevich et al., 2020 Western Siberia 1.5°C warmer during the Medieval Warm Period
“However, the years of 850–870 and 930–950 AD were marked by summer cooling, and the years of 876–882 and 982 AD were marked by summer warming with average summer temperatures 1.5°C higher than the reference values of 1961–1990. The climatic variability of the Medieval period in different regions of the south of Western Siberia attests to the metachronous dynamics of the climate specified by the local conditions against the background of general climatic trends typical of Central Asia. … [I]n the 7th–18th centuries AD, the climate was somewhat warmer and wetter than at present. … In the period of 900–1000 AD, the mean annual temperature was 1–1.5°С higher, and precipitation was close to the modern one (according to palynological data).”
Hou and Wu, 2020 China, ~3°C warmer Early Holocene
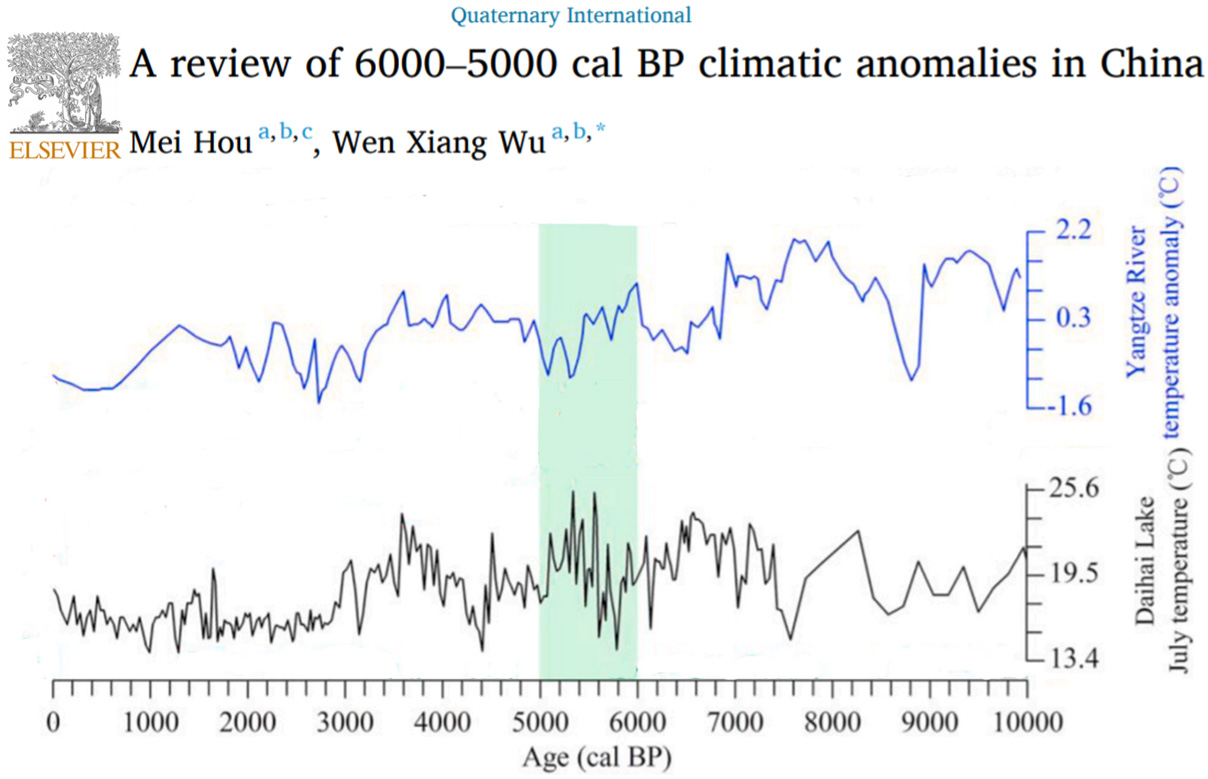
Geoveta et al., 2020 Northern Iceland, 2-3°C warmer 5000-2500 yrs ago
“The highest accumulation rate of the peat (Figure 4) is found between the tephra layers of Hekla 4 (4204 ± 52 cal yrs BP) and Hekla 3 (3000 ± 79 cal yrs BP). This period shows consistently higher levels of Betula pollen compared to the pre-Hekla 4 sample at c. 5000 BP. The higher levels of Betula suggest a warmer climate and is similar to the study of Einarsson (1968) that shows a period with drier and warmer conditions between 5000 and 2500 BP, where the annual mean temperatures were approximately 2–3°C higher than at present.”
Huang et al., 2020 China as warm as today during Medieval Warm Period
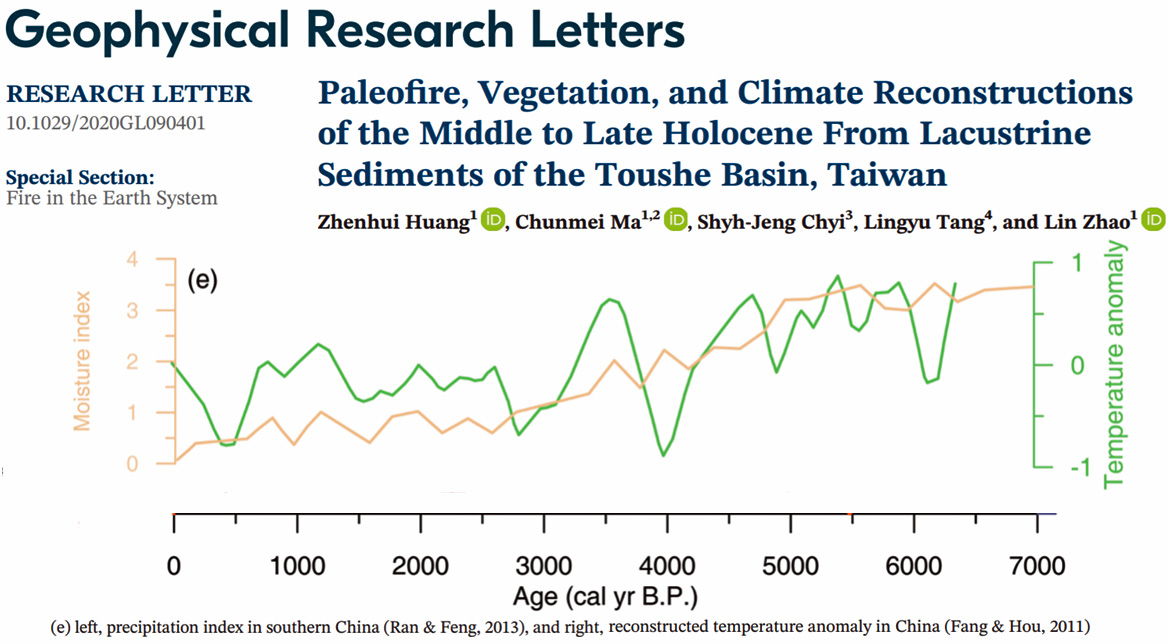
Rudenko et al., 2020 Siberian Arctic 2°C warmer
“Pollen assemblages of the inner LS shelf reflect the mixed environmental signal and complex pollen contribution of the adjacent Arctic tundra and remote taiga zones drained by the LR. These indicate a vegetation response to warmer-than-present climatic conditions between 6 and 4.5 cal. ka and a subsequent gradual cooling … Indeed, pollen and chironomid-inferred quantitative BMA (best modern analogue) reconstructions from Nikolay Lake, the largest body of water within the LR delta located at the northwestern part of Arga Island, suggest mean July temperatures up to 2 °C warmer than modern ones for this time.”
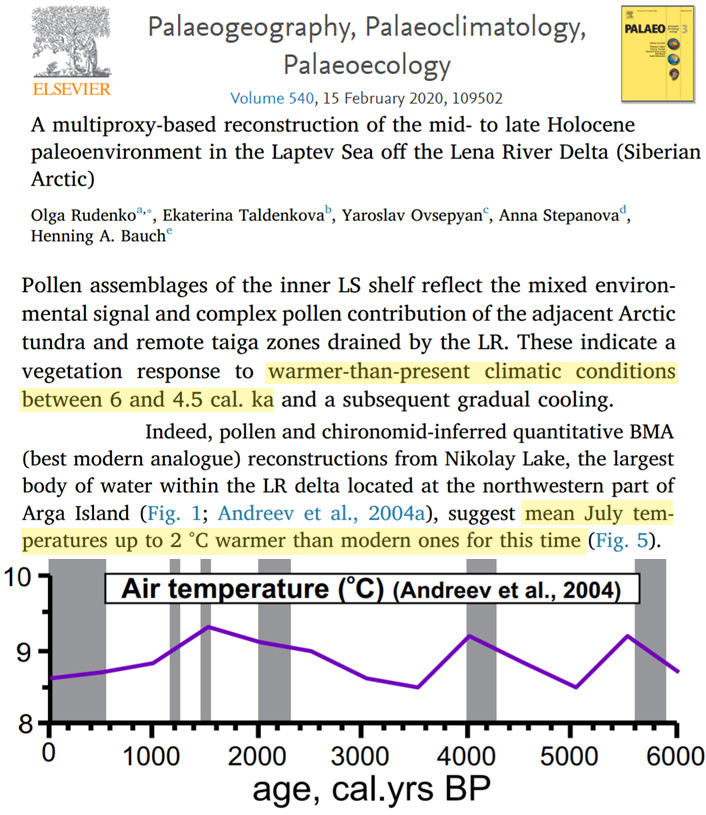
Goto-Azuma et al., 2020 East Greenland “2-3°C warmer than today”
“Ongoing high-resolution analyses on the EGRIP core, the first deep ice core in East Greenland, will provide new insight into the mechanisms and impacts of environmental changes during the early Holocene, which was 2–3 ◦C warmer than today (Schüpbach et al., 2018).”
Gavin et al., 2020 Eastern British Columbia “3.5°C warmer than today”
“The early Holocene thermal optimum provides a good case of persistent, millennial-scale, increased seasonality and (potentially) increased drought (Shuman and Serravezza, 2017). Through the Holocene, decreasing summer insolation allowed expansion of moderated climate regimes and more mesic climates (Hebda, 1995). … While a detailed hydroclimate record does not exist near the site, Gerry Lake lithology and diatom assemblages suggests a shallow lake through the early Holocene (Westover, 2006) and a chironomid-inferred temperature reconstruction indicates summers were 3.5°C warmer than today (Chase et al., 2008).”
Kirillova et al., 2020 Siberian Arctic 9-10°C warmer last interglacial (280 ppm CO2)
“Analysis of the modern distribution of plant species comprising the fossil flora shows that the average temperature of the warmest month exceeded the current temperature by at least 8 °C. … Macro-remains of vascular plants from the Kazantsevo Interglacial deposits from the same section represent 87 species, 55 of which are not found in the territory today. Based on the modern distribution of these species, it can be concluded that the average temperature of the warmest month exceeded the current July temperature in the region by 9–10 °C (Kienast et al. 2011). This conclusion supports our proposed correlation of the mammoth remains with the last interglacial period.”
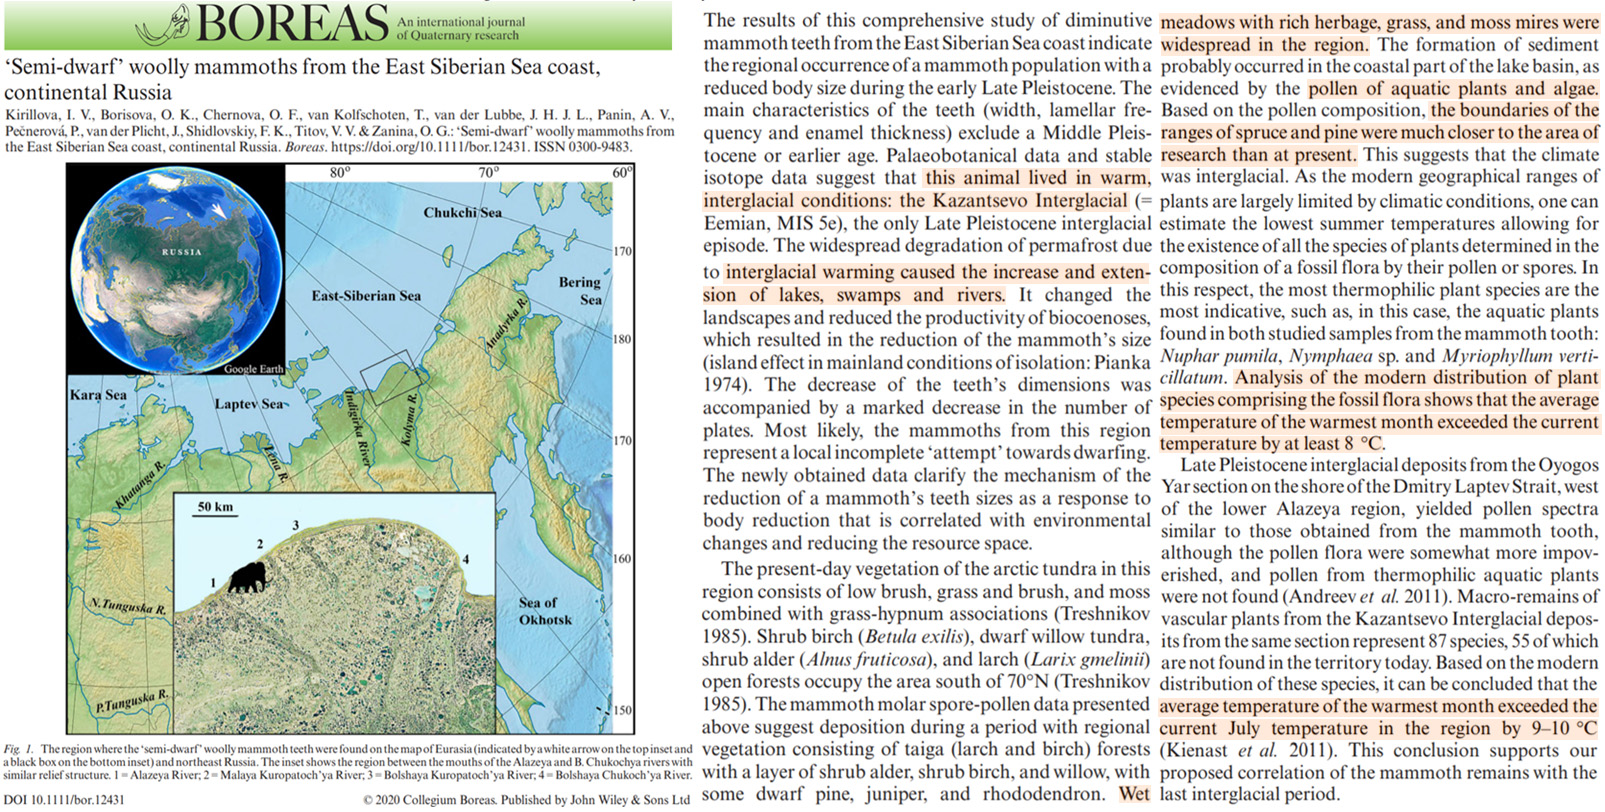

Tamo and Gajewski, 2019
“Reconstructed July temperatures ranged from 4.5 to 8.0°C and showed a cooling trend of about 1.5°C from 1080–1915 CE and with lowest temperatures (4.5°C) reconstructed between 1800 and 1915 CE. Temperatures rose over the last 100 years to between 5 and 6°C, which is comparable to MCA values (Figure 4). … Other reconstructions with an average temporal resolution of less than 100 years between data points (SL06 and MB01, Peros and Gajewski 2009) and one slightly lower resolution record (JR01, Zabenskie and Gajewski 2007) showed some between-site congruence with SW08 (Figure 6). Two of the sites (SL06 and MB01) recorded warmer temperatures during most of the first millennium, and the longer records showed a centennial-scale cooling trend in the Common Era. All four sites reconstructed a relative cooling between 1800 and 1930 CE when temperatures decreased by 0.5–1.5°C from the mean of the last 1,000 years for each record. Although each site experienced a cold period of similar amplitude, the duration varied between sites. SW08 and SL06 recorded a longer sustained cold period from 1800–1930 CE and 1775–1950 CE, respectively. At SL06, this period was an intensification of colder conditions that began at ~1100 CE, whereas at SW08 there was more variability prior to 1800 CE.”
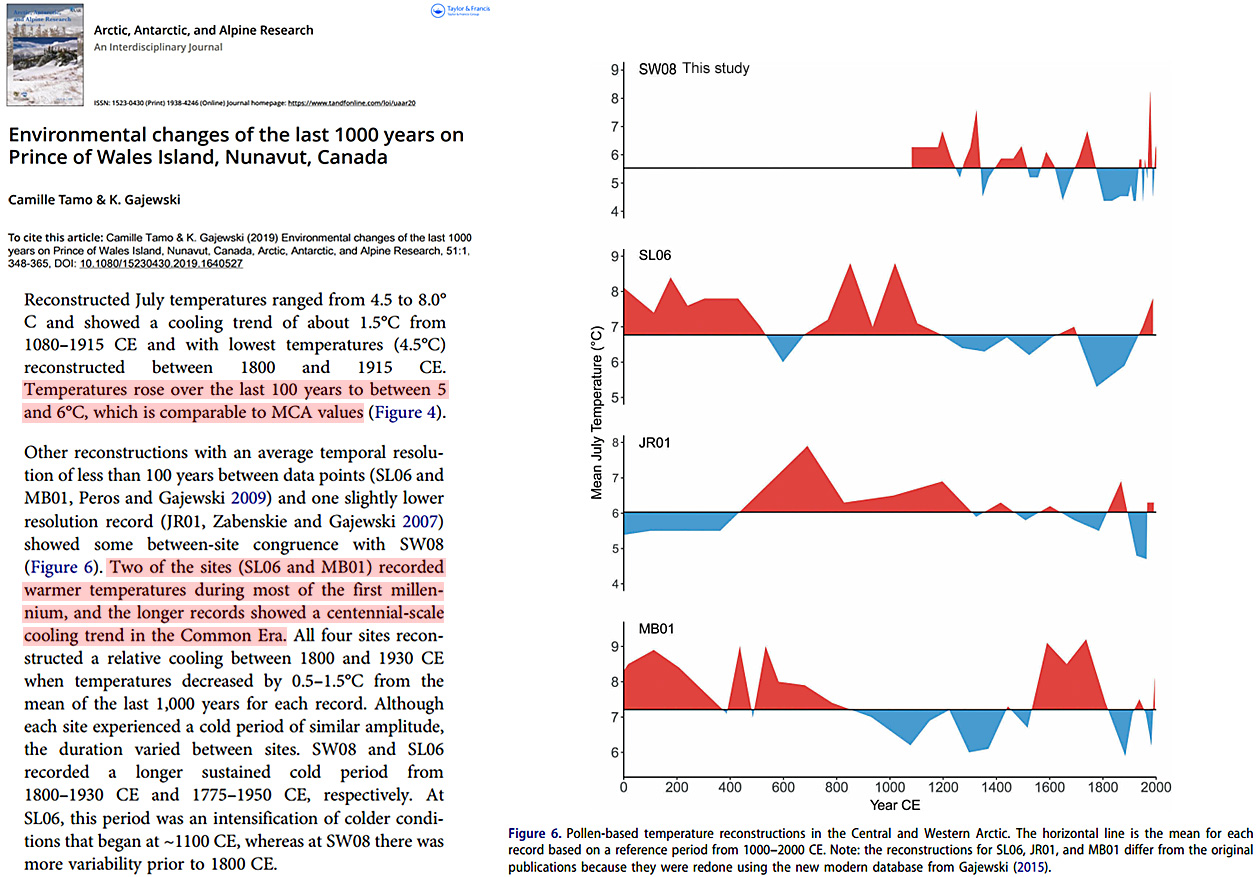
Tonno et al., 2019
“In North Europe, changes in early Holocene climate were rather intense, starting with low temperatures at the beginning of the period, followed by gradual warming, interrupted periodically by short cooling periods (Antonsson and Seppa¨ 2007). During the Holocene Thermal Maximum (HTM), the period from 8.0 to 4.0 cal ka BP, average temperatures in Northern Europe were approximately 2.5–3.5 C higher than today (Antonsson and Seppa¨ 2007; Heikkila¨ and Seppa¨ 2010; Ilvonen et al. 2016).”
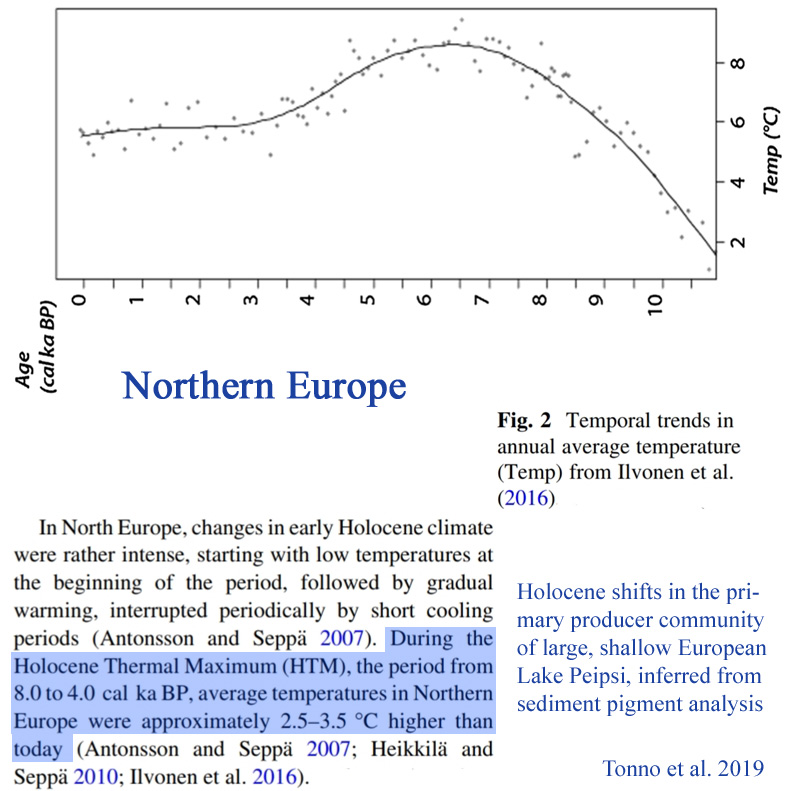
Lacka et al., 2019
“Sea ice-free conditions remained during most of the mid-Holocene as a result of the influence of AW [Atlantic Water] (Łacka et al., 2015b). These conditions coincided with the highest Holocene primary productivity observed on the northern continental slope of the Barents Sea (Wollenburg et al., 2004). The northern Barents Sea experiences seasonal sea ice cover that forms during fall/winter (Loeng, 1991). Sea ice breakup occurs during summer, leading to open-water conditions in August and September (Belt et al., 2015). … The SSTs at the study site during the B-A varied between 2°C and 4°C, which is comparable to modern SST values in Storfjordrenna [~3°C]. … Between 9200 cal yr BP and 3400 cal yr BP, SSTs in Storfjordrenna remained highly variable (from 3°C to almost 13°C). At approximately 6400 cal yr BP, the SST in Storfjordrenna reached a peak of almost 13°C (Fig. 3B).”
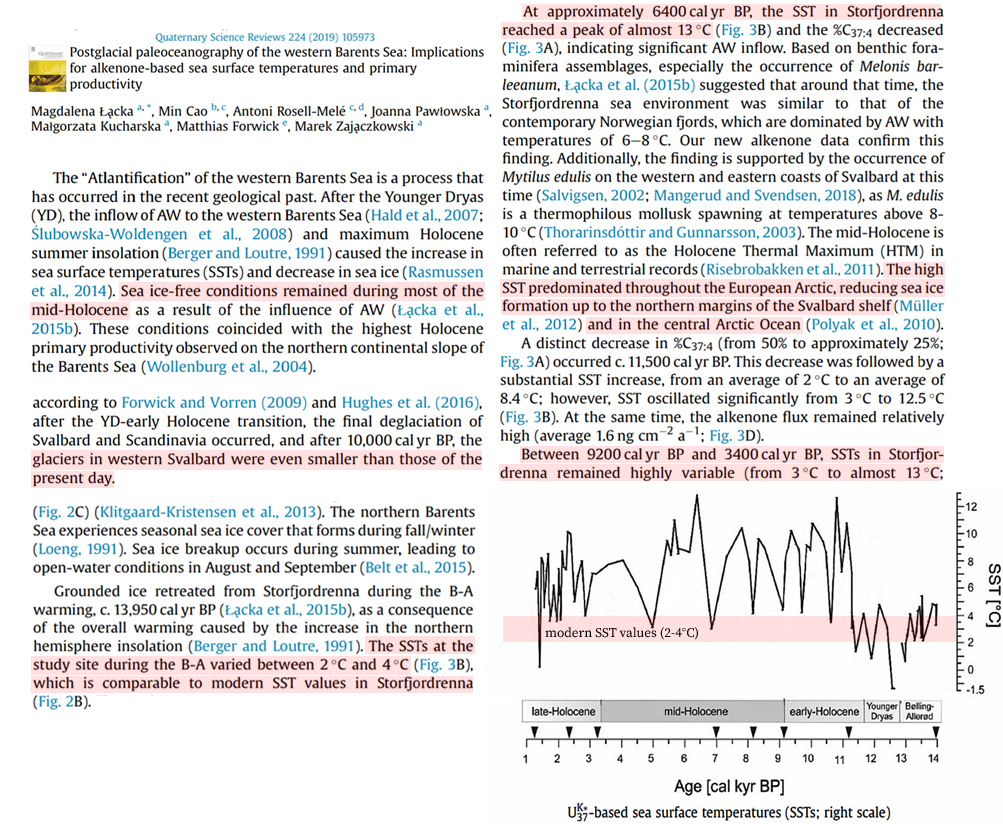
van der Bilt et al., 2019
“Alkenone data show that Svalbard experienced summer temperatures both warmer and colder than today during the Early Holocene. Warmth was greatest around 10 ka BP, when temperatures were up to ~7 °C higher than present in response to high radiative forcing and intensified ocean heat advection. In agreement with a growing body of recent work (e.g. Lecavalier et al., 2017; McFarlin et al., 2018), these findings indicate an earlier and warmer Holocene Optimum in the High Arctic then previously suggested. Supporting these findings, Mangerud and Svendsen (2018) derive a similar amplitude for peak Holocene warmth, based on the presence of Zirfaea crispata, a thermophilous mollusc that is not present in Svalbard waters today. … As seen in Figure 2e, sub-surface temperatures display a prominent peak around 10 ka BP that is unmatched in the remainder of the Holocene. Werner et al. (2015) infer a similar pattern of temperature change in the adjacent eastern Fram Strait. In addition, an IP25 reconstruction from the same site suggests that the seasonal sea ice margin had retreated north of Svalbard at this time. … Placed in a regional context, our findings support a number of recent studies that suggest an earlier, warmer and more distinct Arctic Holocene optimum (Lecavalier et al., 2017; McFarlin et al., 2018). Collectively, this body of work stresses the need for data-model comparisons as simulations neither reproduce this reconstructed pattern nor its magnitude (Figure 2c; Zhang et al., 2018).”
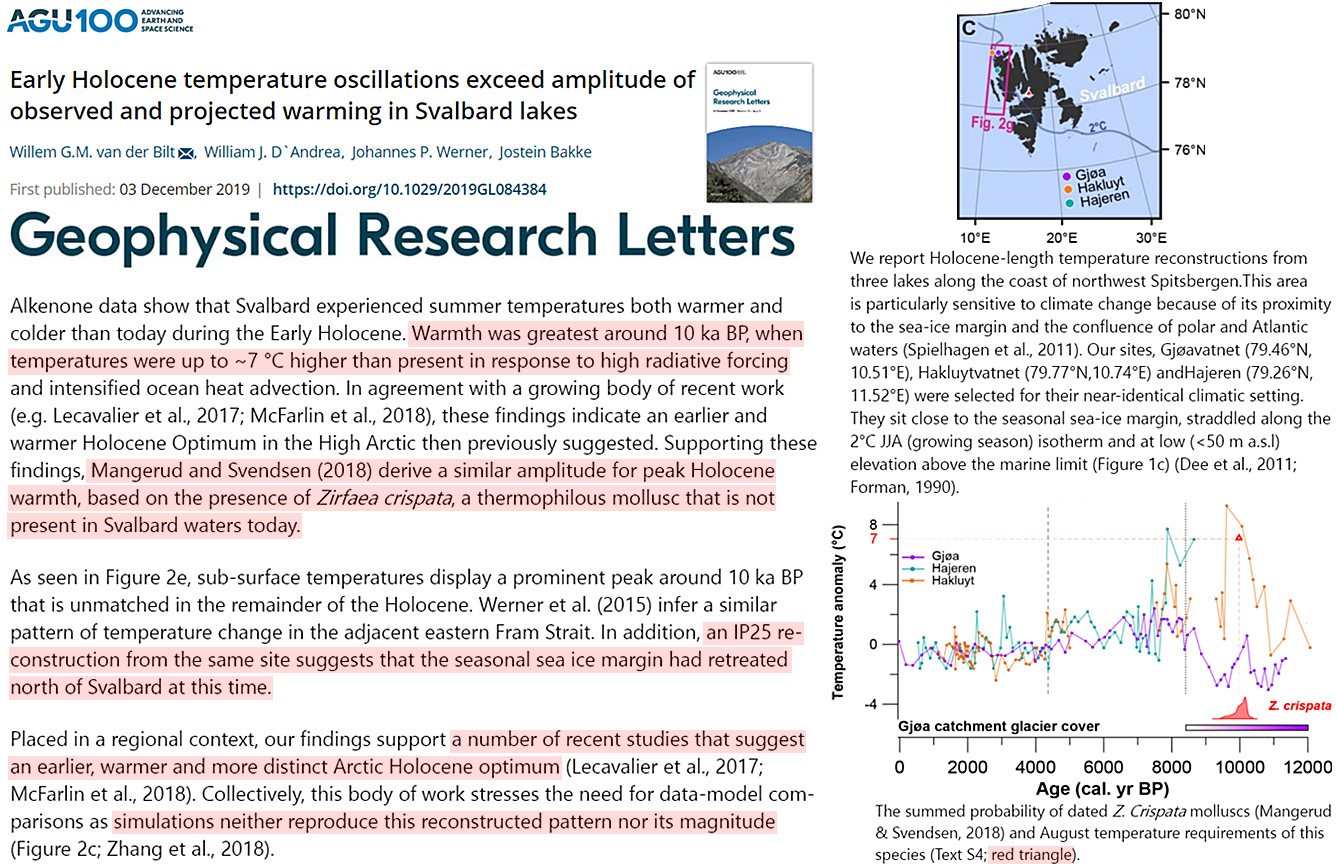
Collins et al., 2019
“Over the past 2300 yrs, SST values range between 14.3°C and 12.2°C (Fig. 4a), and hence most of the record is warmer than today. The earlier half of the record is relatively warm and stable and displays a gradual warming from 13.2°C at 2300 cal yrs BP to 14°C at 1200 cal yrs BP. The largest feature of the record is the cooling transition from 14°C to 12.5°C between 1100 and 600 cal yrs BP. This is followed by warming to 13.5°C at 300 cal yrs BP and then cooling to 12.5°C at present day. Multi-centennial variability is more clearly highlighted in the filtered record and is most pronounced over the last 1200 years. The record exhibits relatively warm conditions during the periods 1200 – 950 cal yrs BP and 500 – 200 cal yrs BP and relatively cool conditions during the periods 950 – 500 cal yrs BP and 200 – present. … Southern Ocean cooling is expected to have further enhanced sea ice cover in the Southern Ocean (Park and Latif, 2008; Zhang et al., 2017a). This is in accordance with two records displaying increased sea ice in the western Ross Sea at a similar timing (between 1250 and 650 cal yrs BP) to the cooling (Mezgec et al., 2017). Late Holocene sea-ice increases are also observed to the west of the Ross Sea (Denis et al., 2010), to the west of the West Antarctic Peninsula (Etourneau et al., 2013) and in the Eastern Ross Sea (Mayewski et al., 2013). Associated ice-albedo and ice-insulation feedbacks (Renssen et al., 2005; Varma et al., 2012) may have contributed to the rapidity of the cooling and sea-ice expansion. … Solar variability would be a potential driver of the changes in ENSO and SAM coupling. Increased (decreased) TSI has been shown to promote La-Niñalike (El-Niño-like) conditions by enhancement of the trade winds (Mann et al., 2005). Similarly, the SHW are sensitive to the 11yr solar cycle (Haigh et al., 2005) and solar variability on centennial timescales (Varma et al., 2011) and thus solar variability might be expected to exert an influence on the SAM. Therefore, it is plausible that solar variability may have controlled the phasing of ENSO and the SAM, and this remains an interesting avenue for further climate modeling research.”
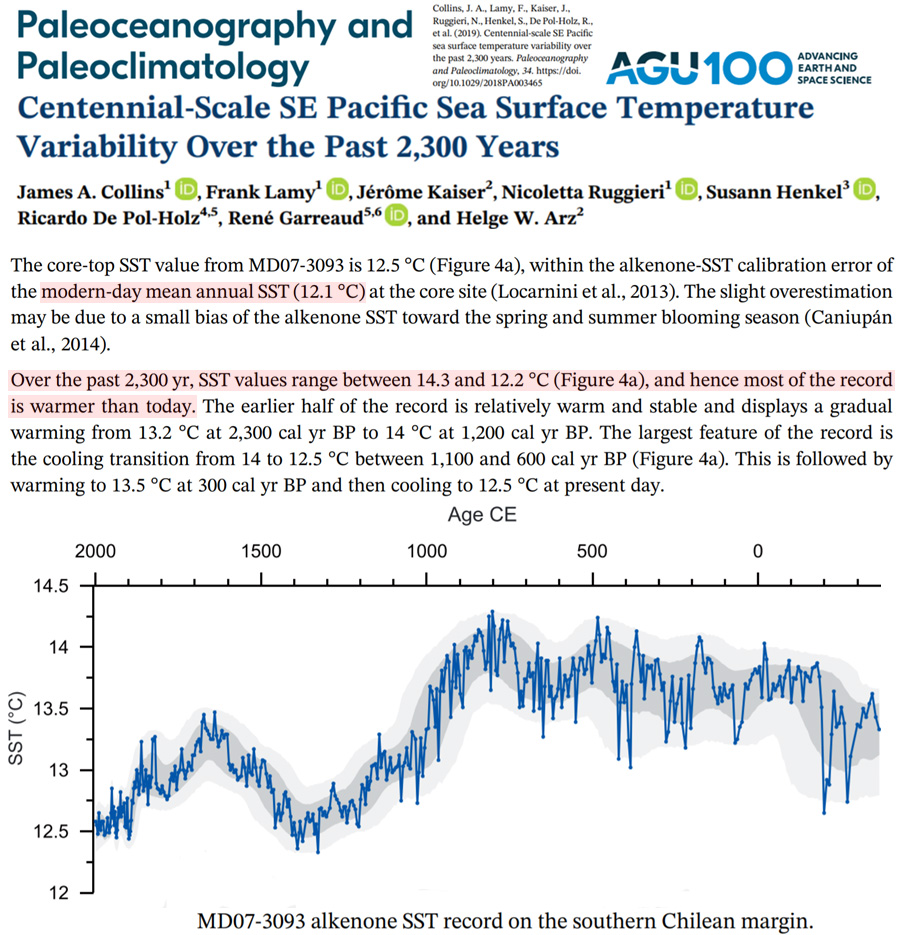
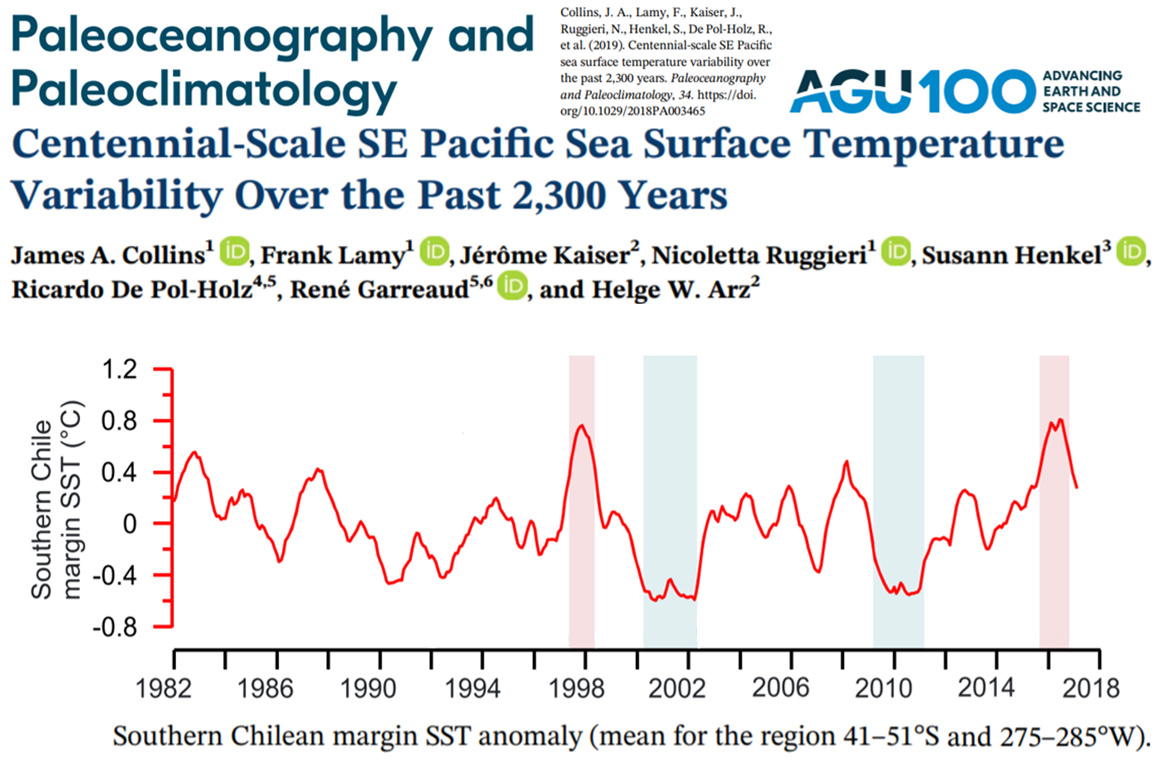
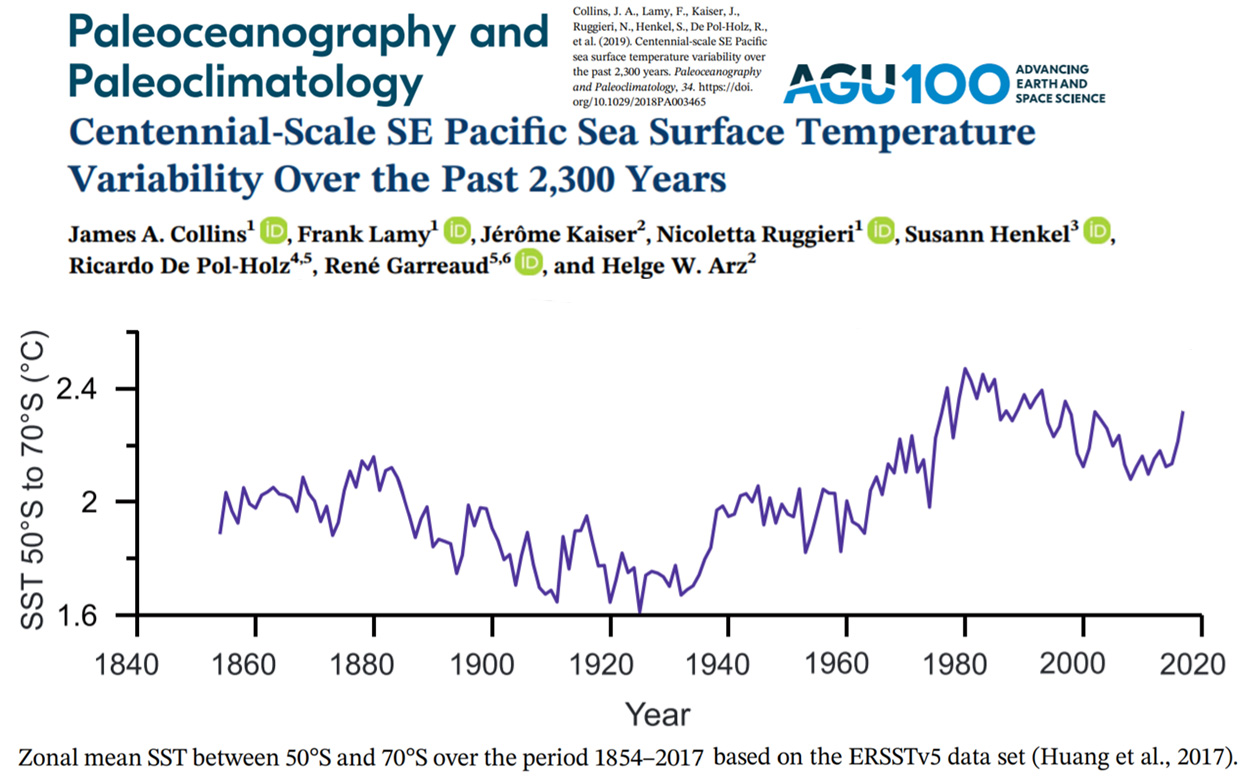
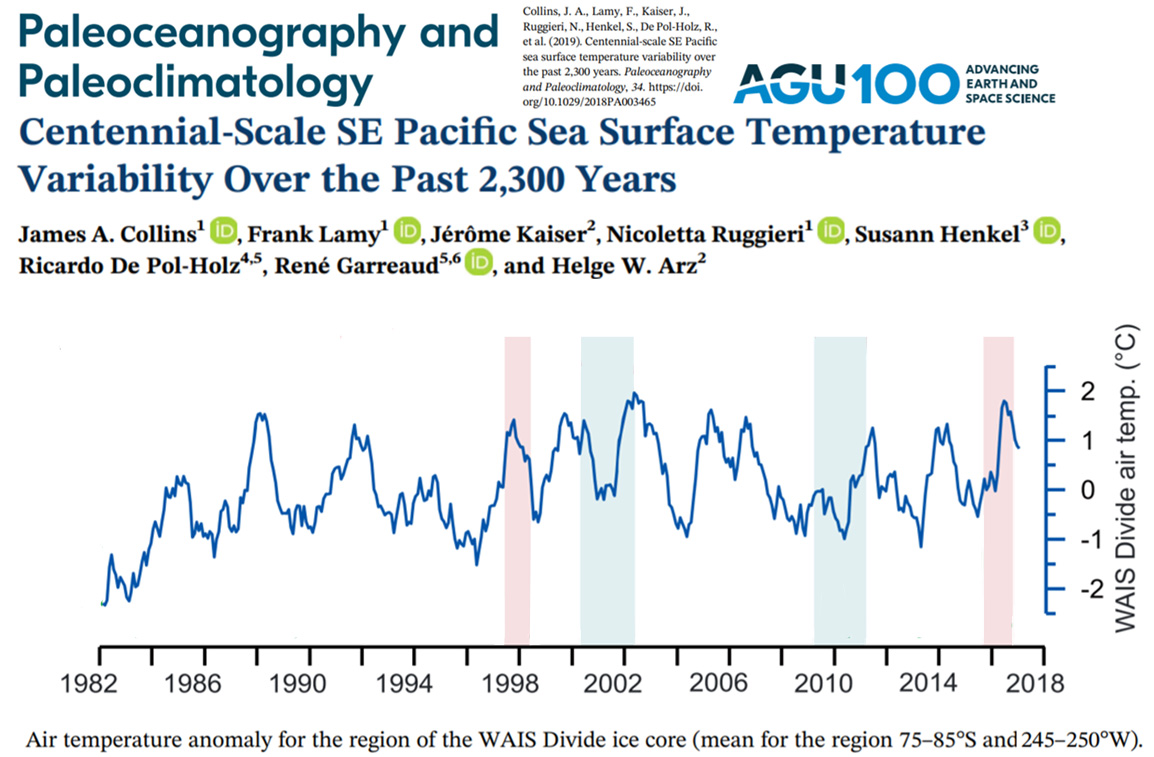
Lüning et al.,2019
“Until recently, the Antarctic Peninsula and West Antarctica were among the most rapidly warming regions on Earth. Between the 1950s and 1990s temperatures on the Antarctic Peninsula increased by more than 0.3°C/decade (Stenni et al., 2017; Turner et al., 2016; Vaughan et al., 2003), with even higher warming rates reported for Byrd Station in West Antarctica (Bromwich et al., 2013; Bunde et al., 2014; Nicolas and Bromwich, 2014). Since the late 1990s, however, this warming has essentially stalled. Rapid cooling of nearly 0.5°C per decade occurred on the Antarctic Peninsula (Favier et al., 2017; Fernandoy et al., 2018; Turner et al., 2016). This already impacted the cryosphere in parts of the Antarctic Peninsula, including slow-down of glacier recession, surface mass gains of the peripheral glacier and a thinning of the active layer of permafrost in the northern Antarctic Peninsula islands (Engel et al., 2018; Oliva et al., 2017; Seehaus et al., 2018). At the same time, temperatures in West Antarctica over the past two decades appear to have plateaued or slightly cooled (Bromwich et al., 2013; Jones et al., 2016; Steig et al., 2009). However, temperature records in West Antarctica are few, often discontinuous and show opposing trends from location to location (Shuman and Stearns, 2001) which complicates modern trend analysis in this part of Antarctica. In contrast, East Antarctica has not experienced any significant temperature change since the 1950s (e.g. Yang et al., 2018) and some areas appear to have even cooled during the most recent decades (Clem et al., 2018; Favier et al., 2017; Jones et al., 2016; Marshall et al., 2014; Nicolas and Bromwich, 2014; O’Donnell et al., 2011; Ramesh and Soni, 2018). Cooling and an increase in snowfall in East Antarctica seems to have led to a gain in ice sheet mass and thickening of ice rises over the past 15 years (Goel et al., 2017; MartinEspañol et al., 2017; Philippe et al., 2016; Zwally et al., 2015). East Antarctic marine-terminating glaciers show no systematic change over the past 50 years (Lovell et al., 2017). Lastly, also the surface layers of the Southern Ocean south of 45°S has predominantly cooled over that past three decades (Armour et al., 2016; Fan et al., 2014; Kusahara et al., 2017; Latif et al., 2017), whilst the subpolar abyssal waters are warming (Sallée, 2018).”
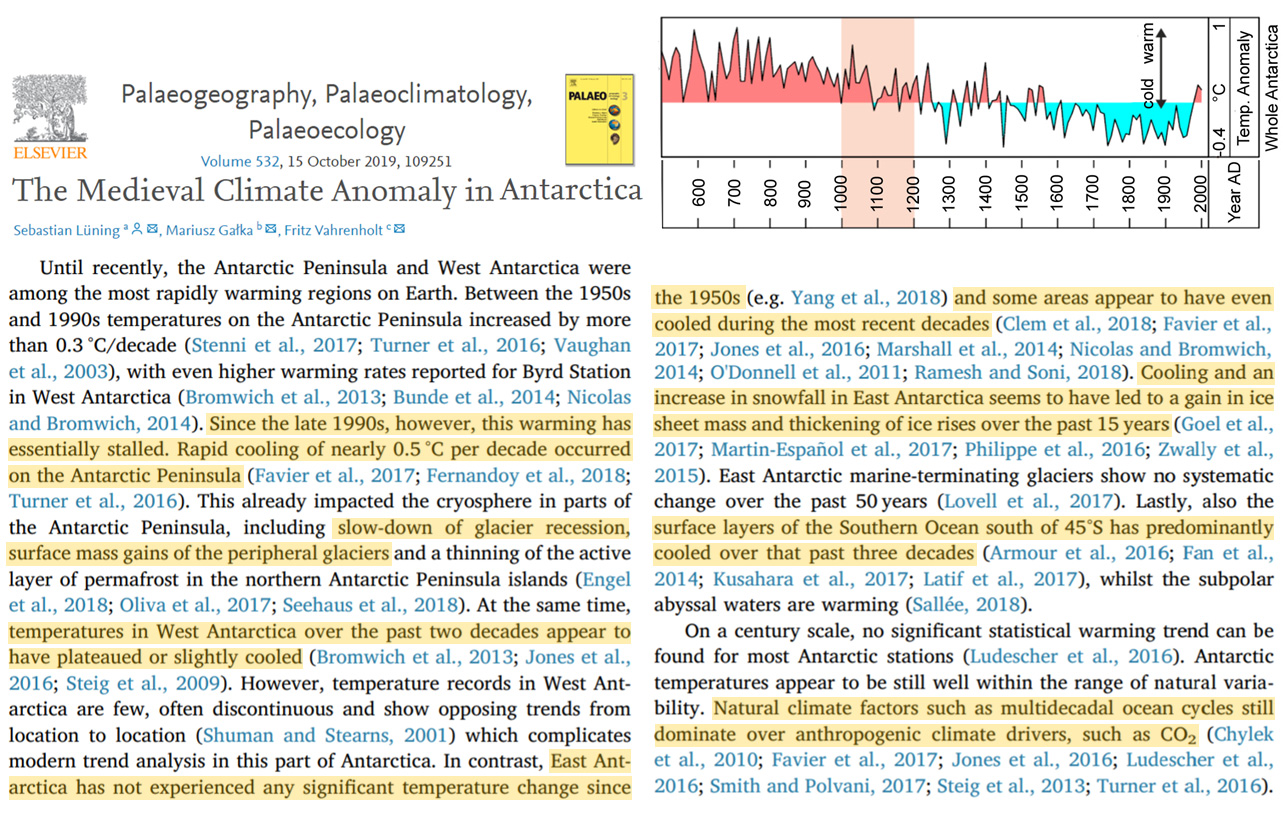
Lohmann et al., 2019
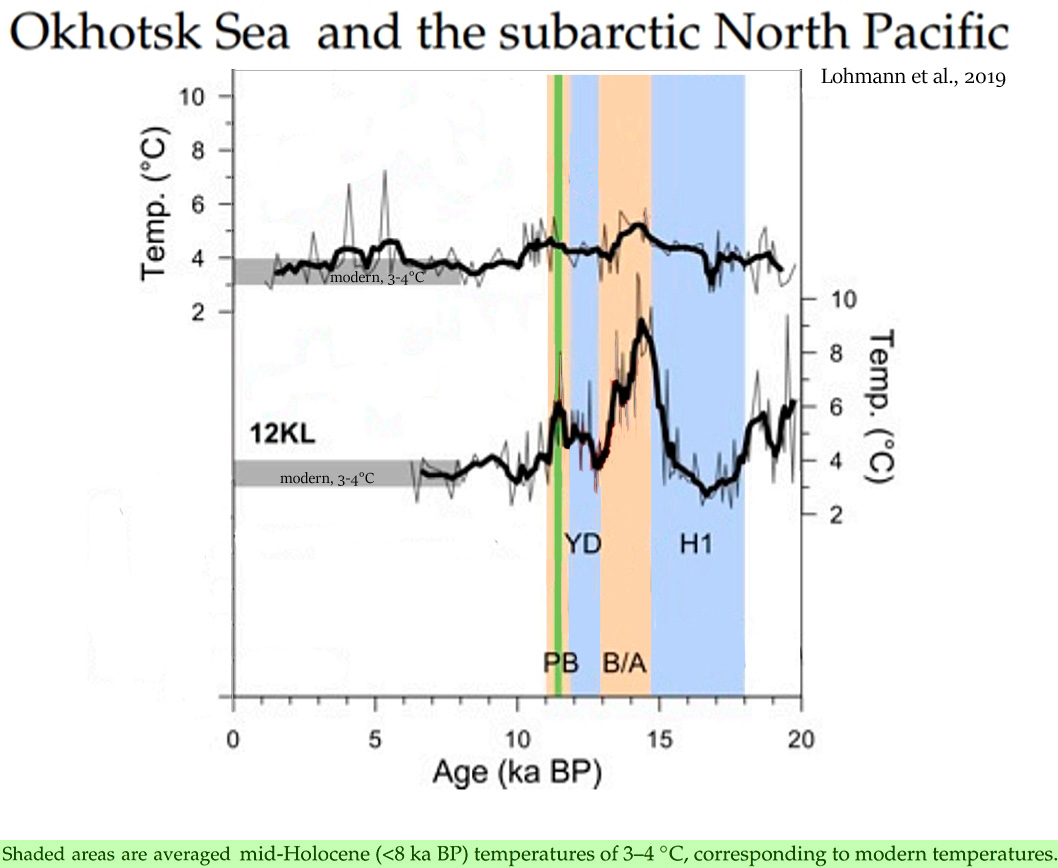
Pitulko et al., 2019
“Our data show that from c. 10 600 BP, Zhokhov Island was situated on the margin of the shrinking Arctic coast (Anisimov et al. 2009); this is supported by the presence of a large quantity of driftwood that washed ashore at the Zhokhov site. The environmental situation was relatively favourable for human occupation: the climate was [5-6°C] warmer than today, and Zhokhov Island was covered by an Arctic tundra comprising sedge grass, shrubs and dwarf birch (Makeyev et al. 2003).”
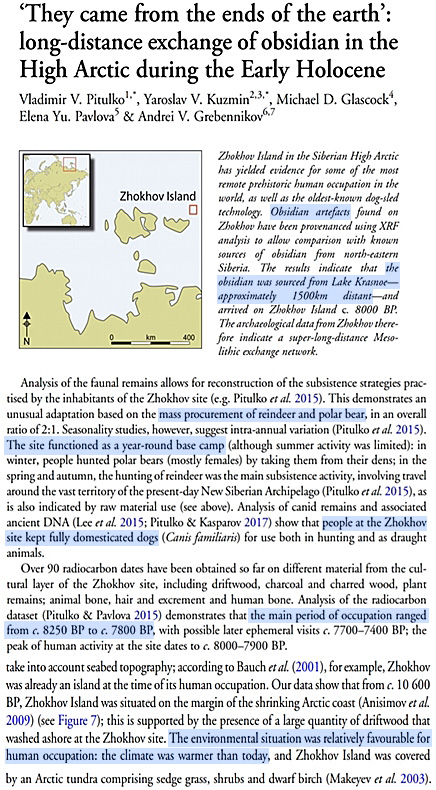
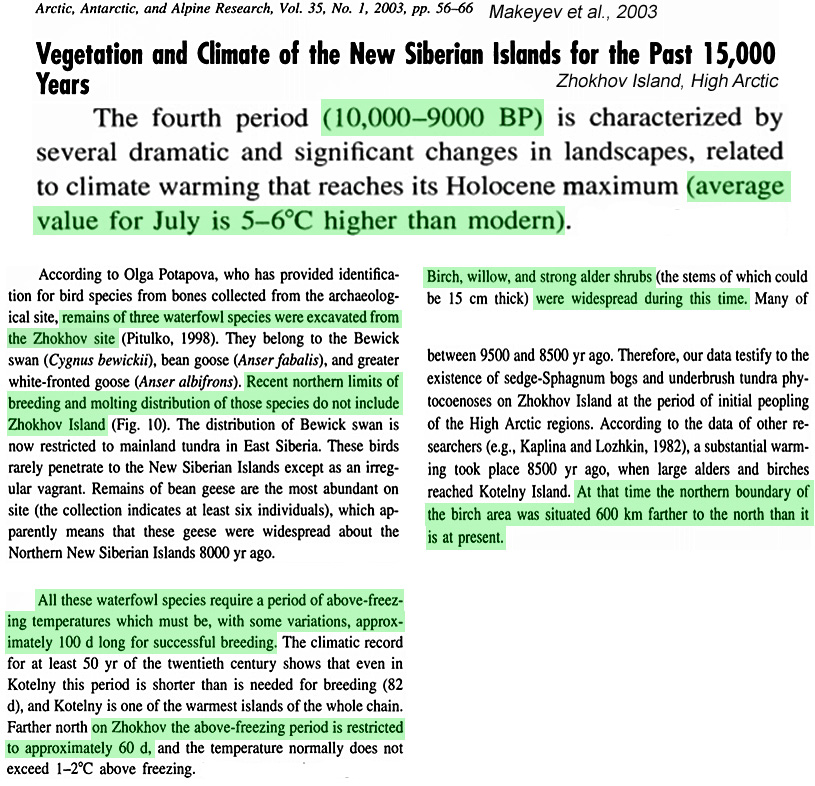
Salvatteci et al., 2019
“[O]tolith δ18O data from Peruvian catfish (Galeichthys peruvianus) excavated from archeological sites in northern Peru suggest SST ~4 °C warmer than present‐day SST (Andrus et al., 2002).”
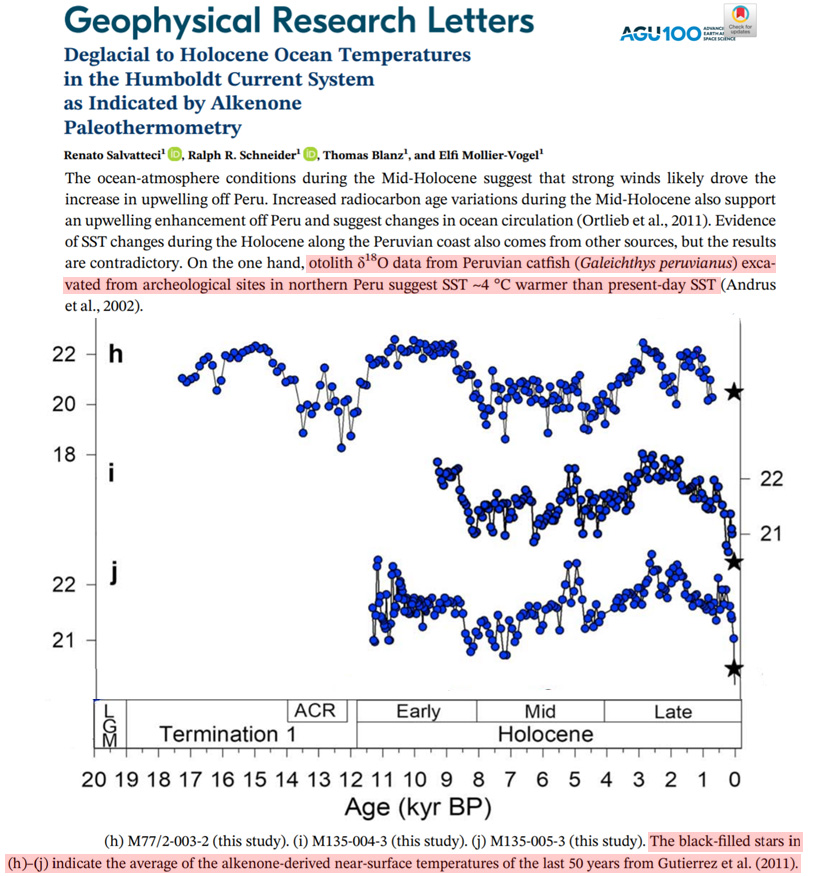
Wang and Zhang, 2019
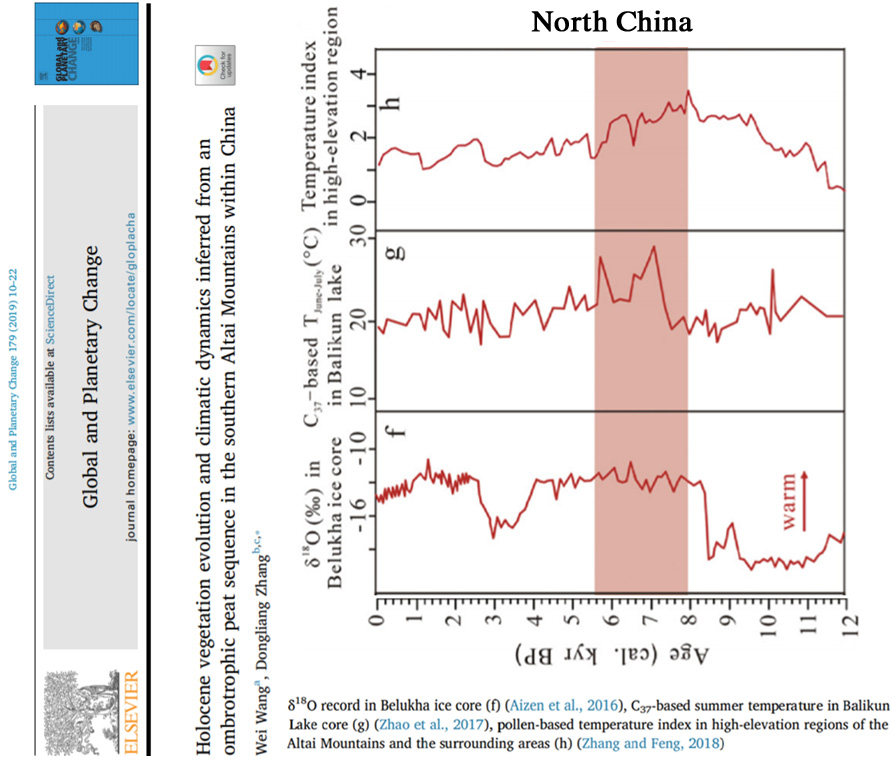
Lüning et al., 2019
“The main MCA warming phase coincides with a higher SAM, more El Niño-dominated ENSO, more positive IPO and higher solar activity (Abram et al., 2014; Conroy et al., 2008; Steinhilber et al., 2012; Vance et al., 2015) (Fig. 5). Spectral analysis of the classical Mt Read tree rings series (site 5), yields characteristic cycle periods associated with the solar Gleissberg (80 years) and Suess-de Vries (210 years) cycles (Cook et al., 1995; Cook et al., 2000). … An alternation of well-defined multicentennial warm and cold phases has been reconstructed for Grotto of Oddities in SE Australia (site 3). Temperatures oscillated with an amplitude of more than 1°C during the past 1500 years (McGowan et al., 2018).”
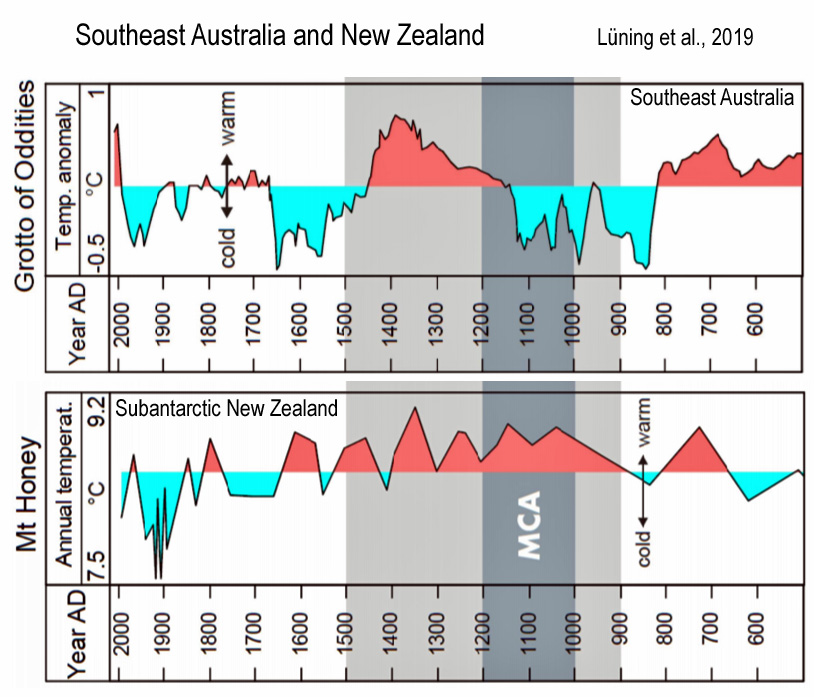
Emslie and Meltzer, 2019 Colorado, USA
“Ultimately, however, the most significant changes in climate and biota in the UGB [Upper Gunnison Basin, Colorado] occurred in the Early to Middle Holocene, when incoming solar radiation peaked, summer temperature increased, and effective precipitation decreased. As a result, biotic communities changed: the upper tree line shifted upslope to perhaps 270 m higher than today [1.6°C higher temps with 0.6°C/100 m lapse rate] (Fall,1997b).”
Aguirre et al., 2019
“A SST rise of ca. 1-2°C during the Hypsithermal (ca. 7.5-4.5 ka B.P.) in comparison with the modern average oceanic temperatures is independently supported by the palaeobiogeographical pattern of stenothermal gastropods and bivalves northwards displaced at present (“anomalous taxa”; Aguirre, 1993, Aguirre et al., 2011, 2017) together with the absence of the cold gastropod T. atra (Aguirre et al., 2013) and is sufficient to have displaced winds, shallow water masses and the Brazil Malvinas Confluence southwards along Patagonia. … The mid-Holocene and Last Interglacial were warmer than today due to a southward shifted BMC, stronger and poleward shifted southern westerlies winds, enhanced ACC and subantarctic shelf water, and intensified ocean fronts/upwelling levels.”
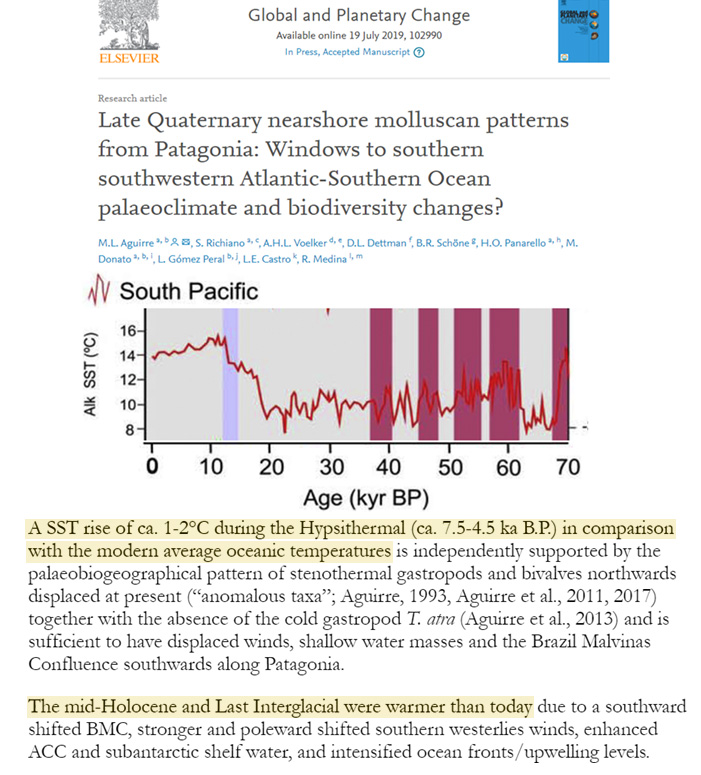
Kuzmina et al., 2019
“Even during coldest time of the Pleistocene, the Last Glacial Maximum (LGM), summer temperatures were higher here than they are today (Alfimov, Berman, 2001, Alfimov et al., 2003). … The Pleistocene megafauna of the North Slope was dominated by mostly horses … There are depressions in the main Pleistocene unit filled by early Holocene sediments containing well-preserved leaves, logs and stumps of Populus balsamifera. Since the modern limit of this tree species is south of the North Slope, the presence of fossil poplar indicates warmer than present climate during the early Holocene. … The second warming (around 9–8 ka), which corresponds with Boreal Period of the BlyttSernander scheme, was probably the warmest interval of the Holocene in Beringia (Kaufman et al., 2004). Trees spread north to coastal areas in Siberia (Kaplina, Lozhkin, 1982; Kuzmina, Sher, 2006), spruce forest reached the central Brooks Range (Anderson, Brubaker, 1994), and beaver occupied formerly treeless landscapes in Alaska (Robinson et al., 2007). Climate on the North Slope was about 2 to 3°C warmer than today; and moisture was lower (Nelson, Carter, 1987).”
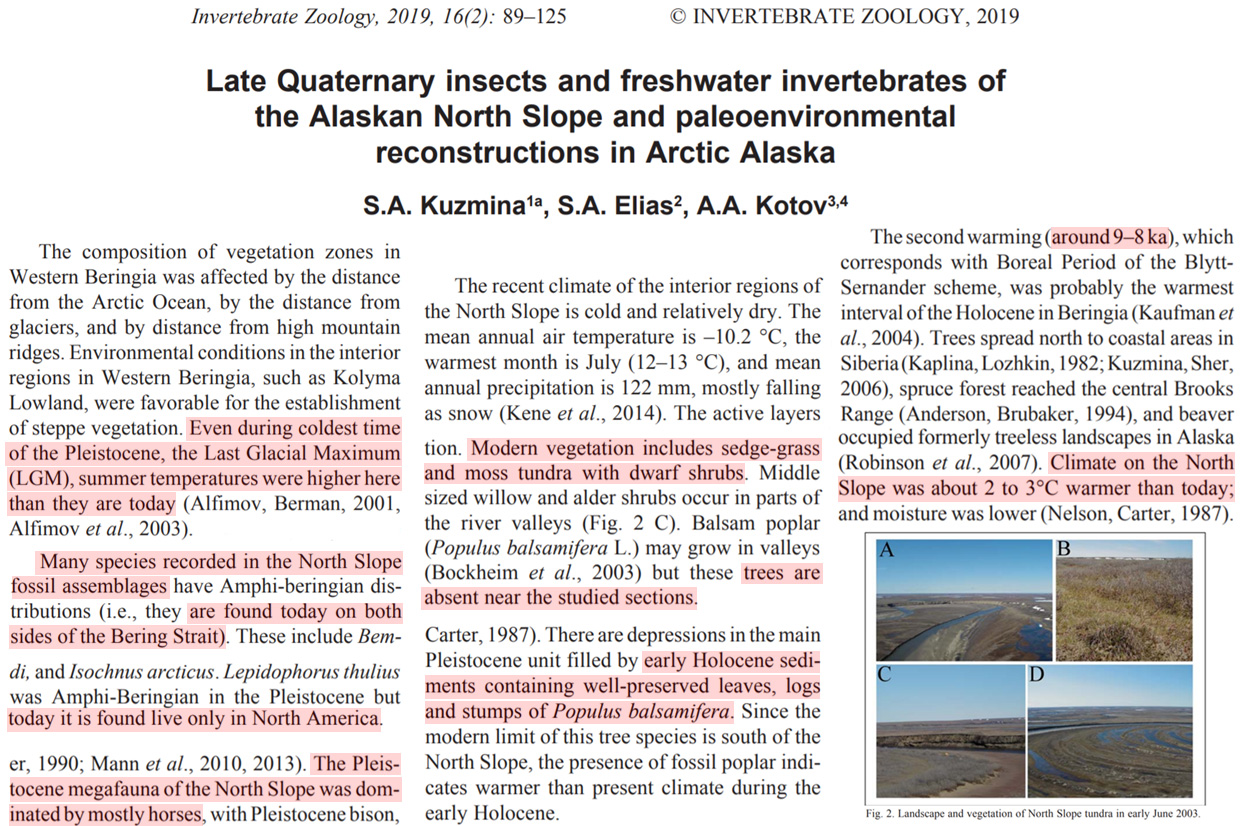
Girardin et al., 2019
“For the most recent 11 years on record (2005–2016), Greenland temperature has exhibited a slightly decreasing trend consistent with northern North Atlantic-wide cooling during that period (figure S15) and a slowdown of the Atlantic Ocean overturning circulation (Thornalley et al 2018). The proportion of forest that was affected by extreme biomass burning also declined during this period (figures 1 and S7). … Two periods of high sub-continental biomass burning and p̂CHAR (i.e. 4950–4750 BP and 1250–1050 BP) are found during some of the periods of warmest Holocene temperatures in Greenland (respectively about +2.4 °C and +3.4 °C above the 1951–1980 baseline; figure 4(e); Kobashi et al 2017). Both periods coincide with positive temperature anomalies that have been inferred from chironomid assemblages in eastern boreal North American lakes (∼+2.1 °C and 2.2 °C above baseline (Bajolle et al 2018, figure S11).”
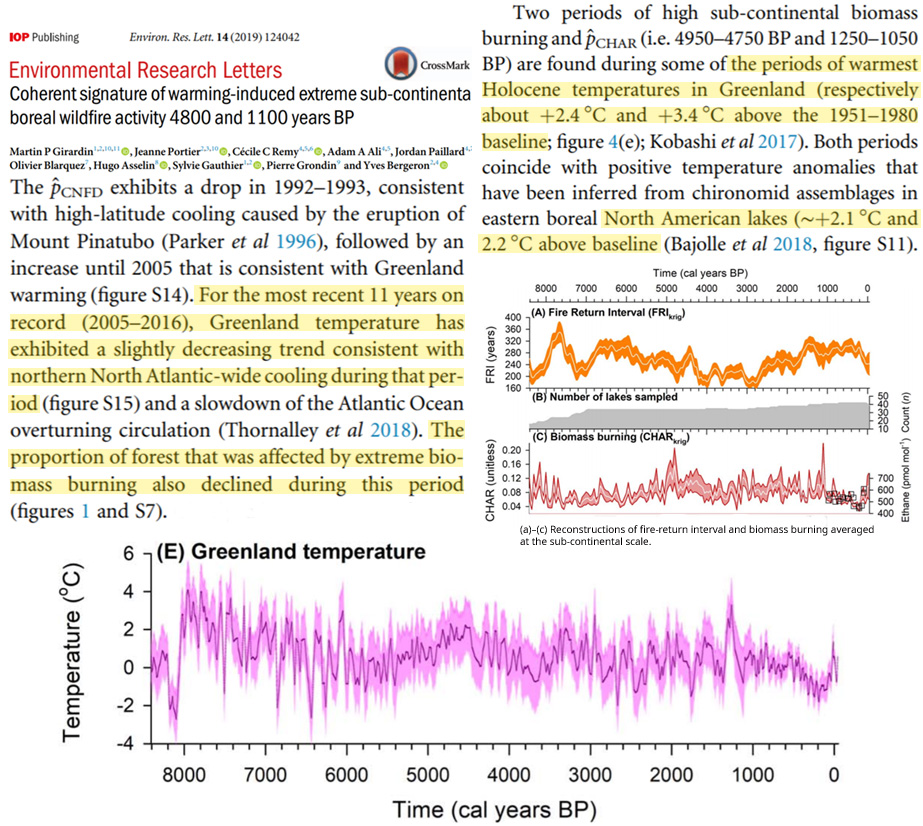
Curran et al., 2019
“[R]ecords for the Northgrippian from the East Greenland margin provide no evidence of increased calving of the Greenland Ice-Sheet (Jennings et al., 2002, 2011; Risebrobakken et al., 2011). This is likely due to the absence of sustained marine-terminating glaciers on the East Greenland margin during the warmer than present Northgrippian (Larsen et al., 2015). … The intervals of warmest BWT [bottom water temperatures] occurred between ca. 4-5 ka and between 2.2 ± 0.1 ka and 2.4 ± 0.2 ka. … Mg/Ca measurements from gravity core GC07 indicate a gradual warming from 11.5°C at 7.5 ± 0.2 ka to reach a maximum of 13.1°C at 4.2 ± 0.2 ka“
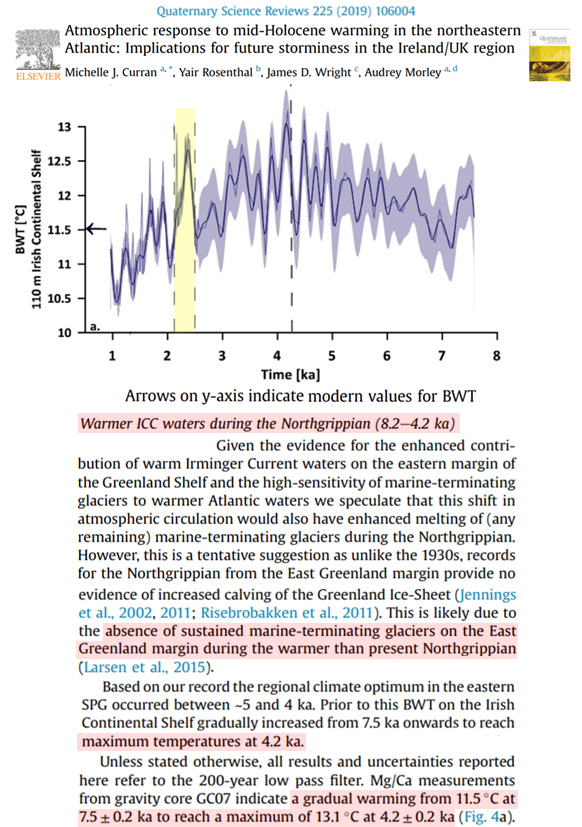
Kusch et al., 2019
“High d13C values from Bliss Lake indicate that warmer conditions than today persisted from 7.2 to 6.5 cal. ka BP (Olsen et al. 2011). The records mentioned above imply relative warming during the HTM, but do not provide quantitative constraints on temperature changes. The closest terrestrial, non-ice-core record of absolute temperature change comes from Last Chance Lake in central East Greenland, approximately 1000 km farther south. Axford et al.(2017) D’Andrea et al. (2011) used the alkenone-basedUk’37 palaeothermometer to reconstruct lake water temperatures in two small lakes near Kangerlussuaq, southwest Greenland. Their results show variations of up to 5.5 °C since 5.6 cal. ka BP (D’Andrea et al. 2011). … Interestingly, using a combined MBT’/CBT calibration such as the Peterse et al. (2012) calibration (Table S1) results in a smoothed MAT curve, which shows a relatively constant ~3.7 °C decrease across the Holocene that agrees well with other temperature estimates (e.g. Axford et al. 2017).”
Jia et al., 2019
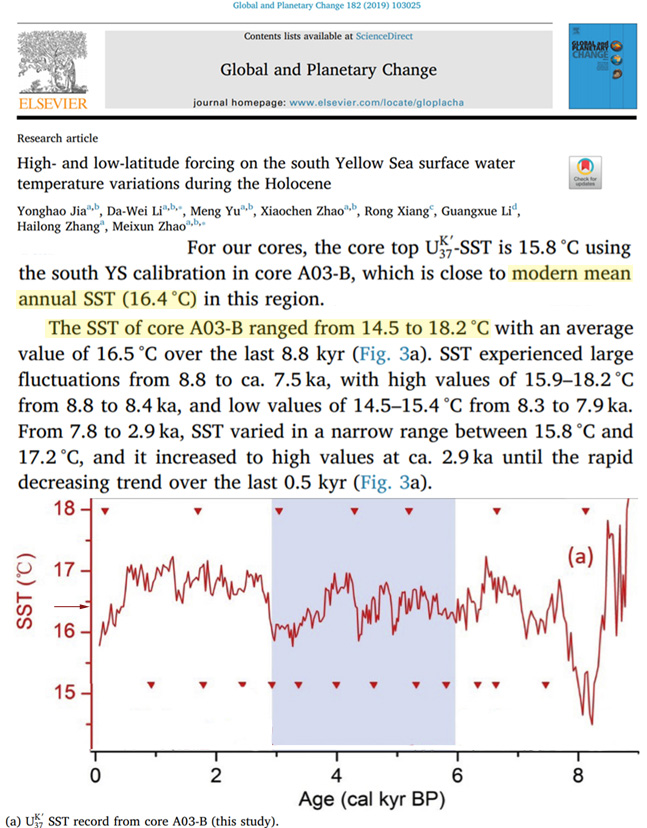
Joo et al., 2019
“An early Holocene seawater temperature reconstruction for Dicksonfjorden exemplifies an amplified effect of warming (+4–6°C [warmer than present]) at high latitudes relative to global estimates (+1–3°C [warmer than present]; Beierlein et al. 2015). The early Holocene warmth culminated with a stepwise regional cooling, influenced by decreasing insolation, starting at ca. 9–8.8 Kya (Svendsen & Mangerud 1997; Hald et al. 2004; Forwick & Vorren 2009; Rasmussen et al. 2012; Mangerud & Svendsen 2018).”
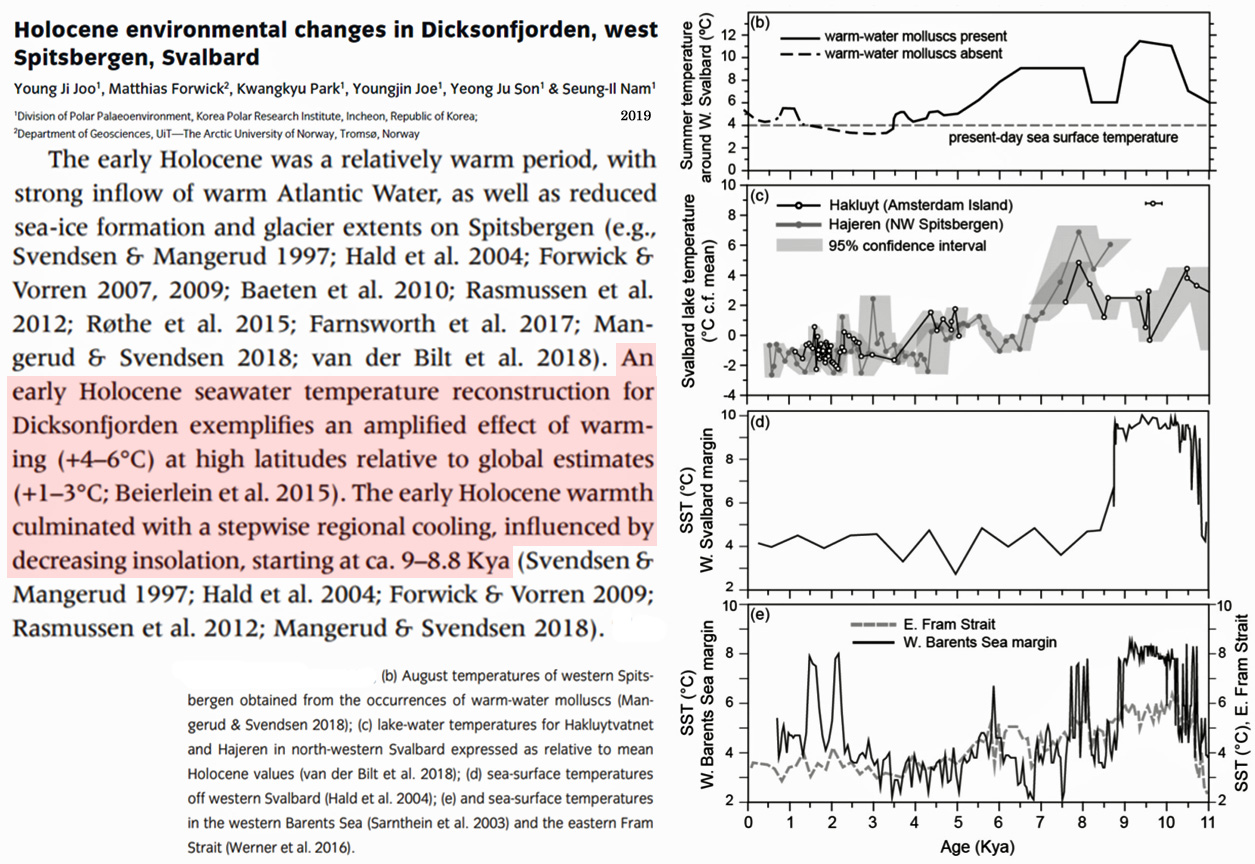
Leopold et al., 2019
“The warmest phase, referred to as the ‘Holocene thermal optimum’, occurred around 10.7–7.7 kyr. BP, peaking at 10.2–9.2 kyr. BP (Mangerud and Svendsen 2018). Reconstructed summer SSTs were as high as 8 °C during this period and later dropped to around 4 °C where they stabilized and persisted for~ 5 kyr. (Sarnthein et al. 2003). … Even though the summer SSTs today around Svalbard are some 5–8 °C lower than during the thermal peak of the early Holocene, they are well within the temperature range when Mytilus spp. previously occupied the archipelago. The Holocene occurrence of Mytilus spp. was most likely a recurring event during intermittent warm periods (see Mangerud and Svendsen 2018, results and discussion).”
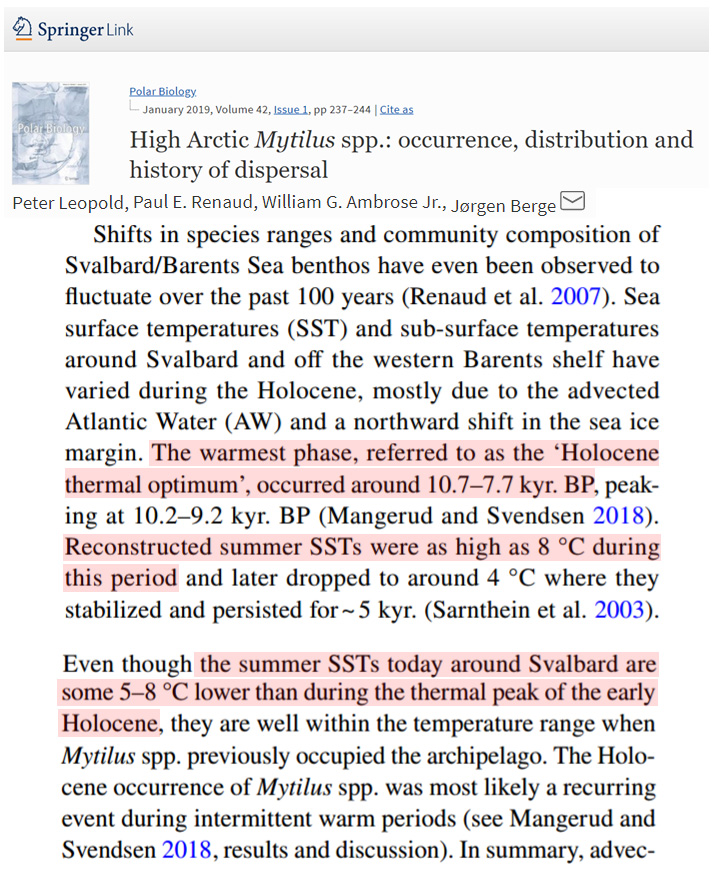
Brown et al., 2019
“While summers in the interior of BC were 2–4 ºC warmer-than-present (Rosenberg et al., 2004), the coastal regions were probably only 1–2 ºC warmer (Hebda, 1995; Mathewes and Heusser, 1981).”
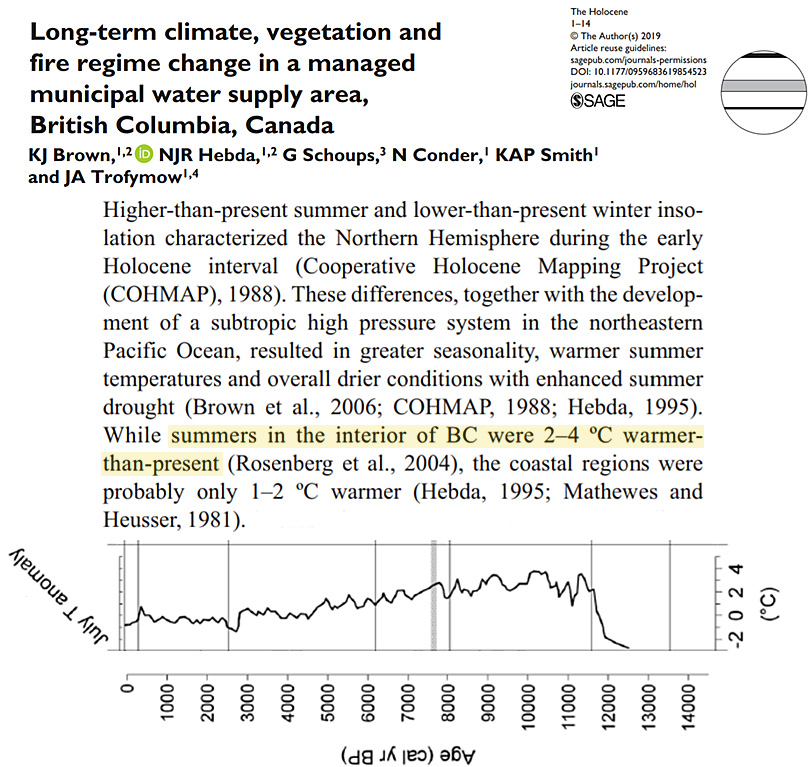
Barhoumi et al., 2019
“In North America and Arctic Canada, an early Holocene thermal maximum (from about 8000 to 5000 cal. yr BP) is evidenced with summer temperatures at least 2° warmer than today (Axford et al., 2009; Viau and Gajewski, 2009). In the prepolar and polar Ural regions, the climate was probably moist and warm (summer temperatures c. 4°C warmer than today) between 8000 and 4500 BP (Kultti et al., 2003).”
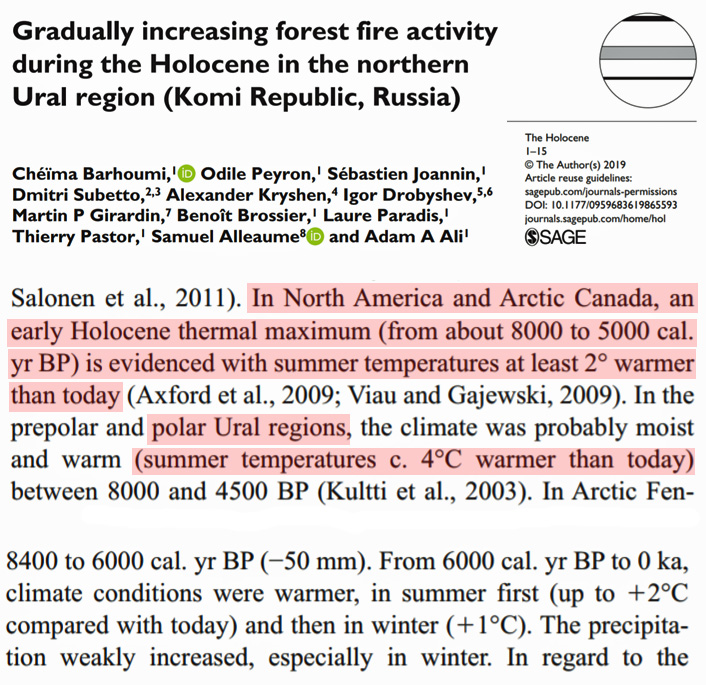
Valley et al., 2019
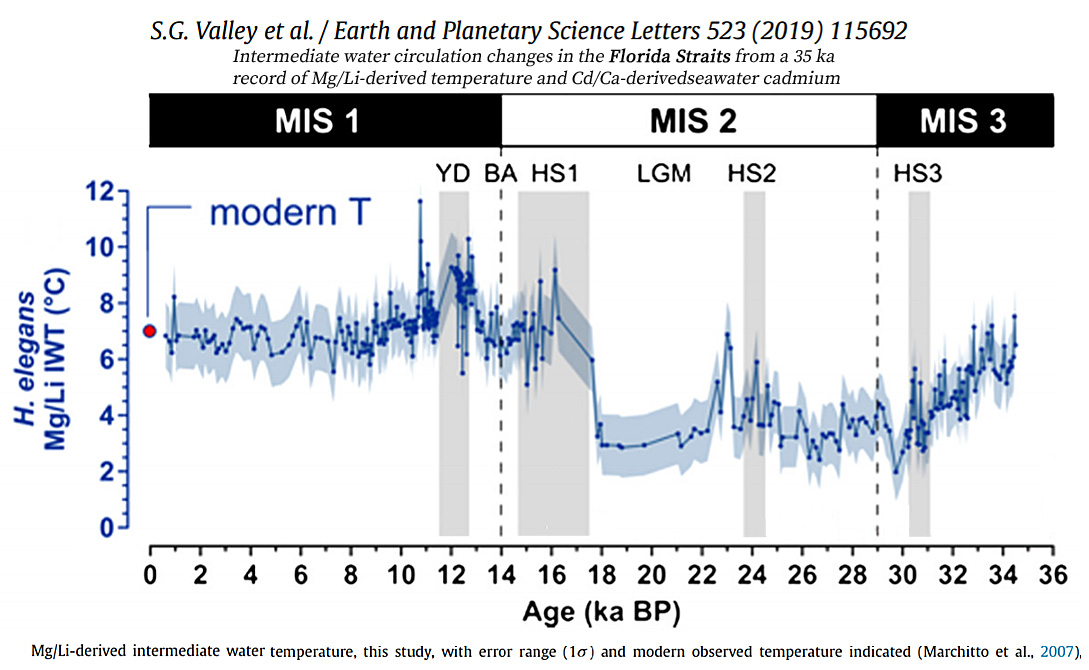
Bogren, 2019
“Macrofossil inferred temperatures from indicator plant taxa in northern Fennoscandia indicate that the very beginning of Holocene (between 11000 and 10000 cal. yr BP) had several degrees warmer summer temperatures than present (e.g. Valiranta et al., 2015; Shala et al., 2017), which is also in agreement with what Luoto et al. (2014) found in chironomid-based records in northern Finland.). … Most proxies indicate that a long-term cooling trend started in Fennoscandia during the late Holocene (from c. 5000 cal. yr BP to the present), likely related to the decreased insolation in northern Europe (Borzenkova et al., 2015). … In Abisko in the northern Swedish Scandes the tree-type Betula tree line is suggested to have been at an altitude of 300-400 m higher than present in the early Holocene (Barnekow, 1999; Barnekow and Sandgren, 2001).”
Schirrmacher et al., 2019
“In the Gulf of Cádiz alkenone-based SST values vary between 20.0 to 22.7°C and are warmer compared to recent annual mean temperatures (18.7°C; Locarnini et al., 2013). Higher SSTs during the mid-Holocene might be partly a consequence of higher insolation during this period.”
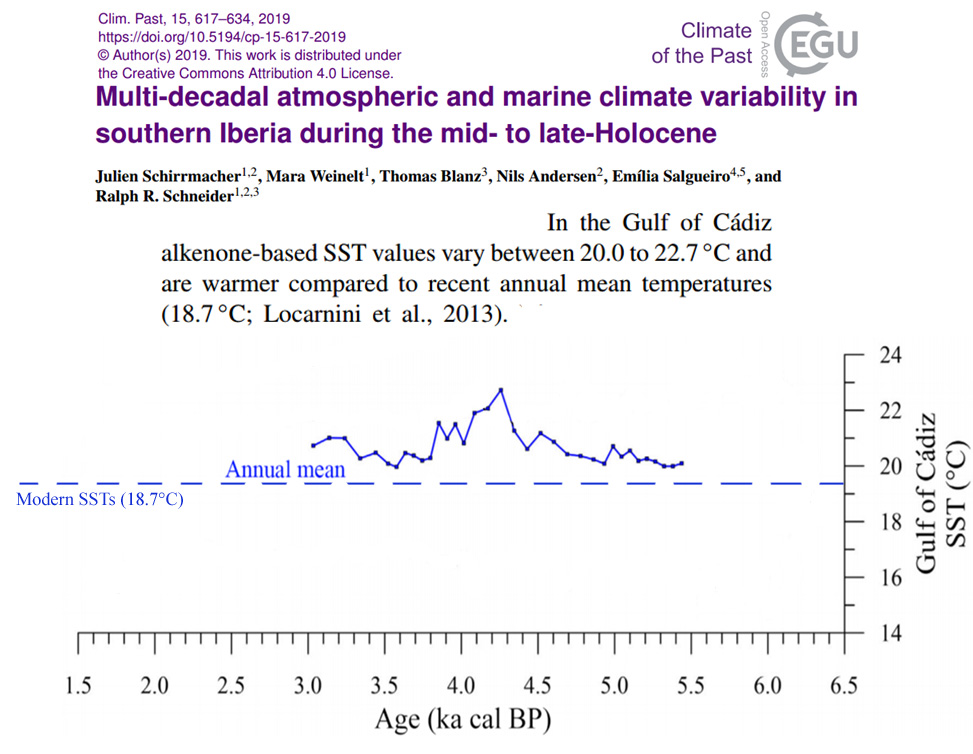
Lin et al., 2019
“The mid-Holocene period (MH) has long been an ideal target for the validation of general circulation model (GCM) results against reconstructions gathered in global datasets. Our results indicate that the main discrepancies between model and data for the MH climate are the annual and winter mean temperature. A warmer-than-present climate condition is derived from pollen data for both annual mean temperature ( ∼ 0.7 K on average) and winter mean temperature (∼ 1 K on average), while most of the models provide both colder-than-present annual and winter mean temperature and a relatively warmer summer, showing a linear response driven by the seasonal forcing.”
Cascella et al., 2019
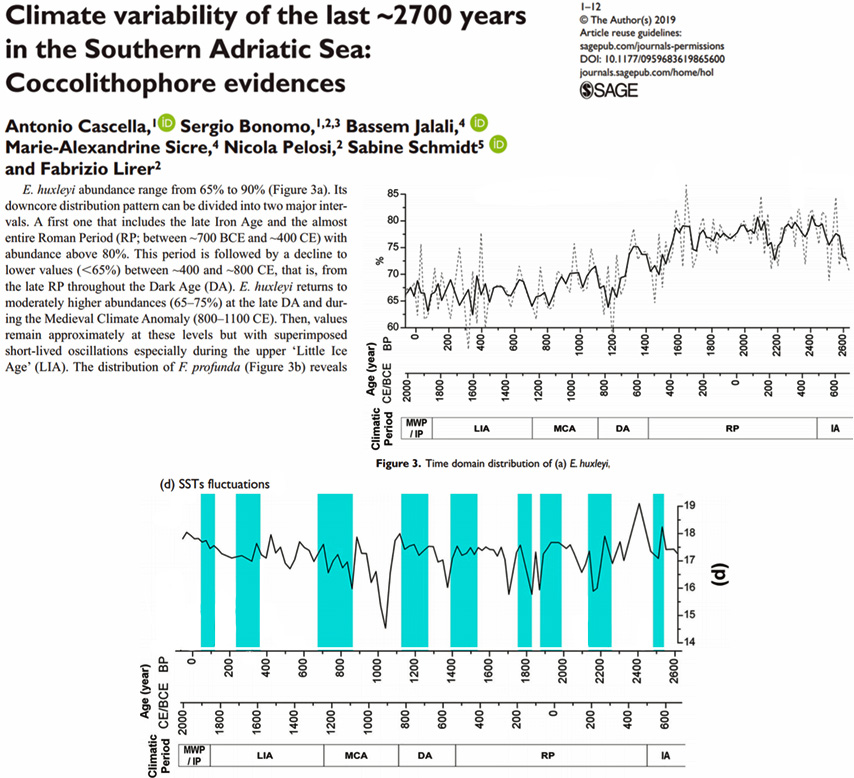
Li and Born, 2019
“D-O events could be an unforced oscillation of the Northern Seas coupled system … A sweet spot in the coupled system sets up feedbacks causing unforced oscillations … Dansgaard-Oeschger events are most clearly seen in Greenland ice core records (Dansgaard et al., 1993; Andersen et al., 2004), where they represent temperature swings of 8–16°C (Severinghaus et al., 1998; Wolff et al., 2010). … Dansgaard-Oeschger events extend well beyond Greenland. Throughout the North Atlantic, observational evidence points to warmer ocean temperatures (Bond et al., 1993; Curry and Oppo, 1997), less sea ice (Masson-Delmotte et al., 2005; Rasmussen and Thomsen, 2004; Dokken et al., 2013), and fresher surface waters in the subtropical gyre (Schmidt et al., 2006). While the events themselves are millennial in time-scale, the transitions occur within decades or less, and the stadial-to-interstadial (cold-to-warm) transitions are more abrupt (Alley and Clark, 1999). Proxy evidence reveals that Dansgaard-Oeschger signals extended across the Northern Hemisphere and into the Southern Hemisphere.”
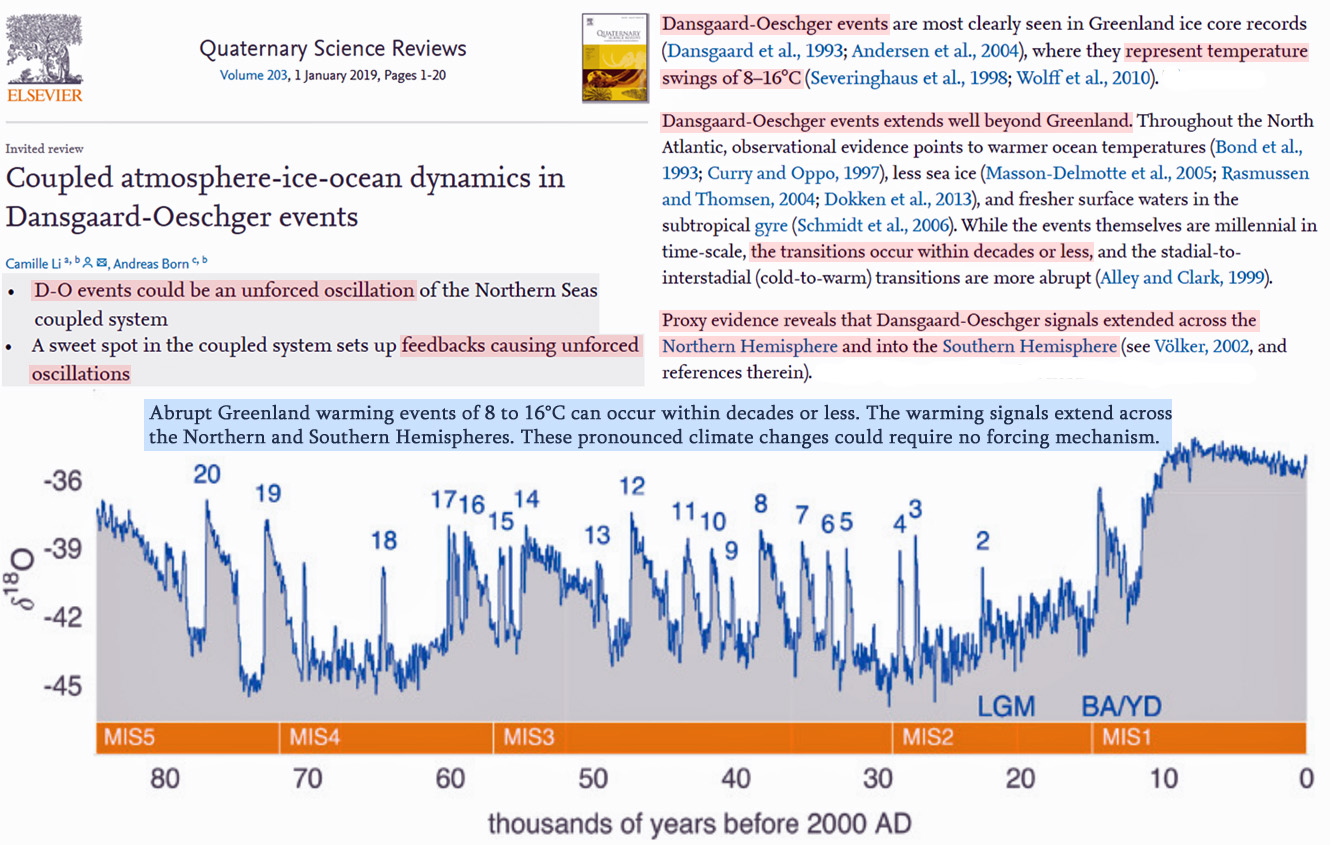
Bobylev and Miles, 2019
“The Holocene is the present interglacial period, which has persisted for about 12 kya. The Arctic summer air temperatures during the warmest part of the period were as much as 2–3°C above present for much of the region, which was well above the interglacial average temperature for the rest of Earth (Fig. 2.5). Multiple proxy records indicating that early Holocene temperatures were higher than today and that the Arctic contained less ice, are consistent with a high intensity of orbitally-controlled spring and summer insolation that peaked about 11 kya and gradually decreased thereafter. The warming phase after the end of the Younger Dryas was very abrupt and central Greenland temperatures increased by 7°C or more in a few decades (McBean et al. 2004). Arctic summer temperatures were warm enough to melt all glaciers below 5 km elevation, except the Greenland Ice Sheet, which was reduced moderately. The last major ice sheet disappeared from Scandinavia about 8000–7000 BC, while in North America the ice retreated completely at an even later date (Frolov et al. 2009). The continued Holocene climate warming, which culminated in the “Holocene Climatic Optimum” (HCO) of 5–9 kya, was characterized by a significant increase in mean air temperature, which was generally 2–3°C higher in summer compared to present conditions.”
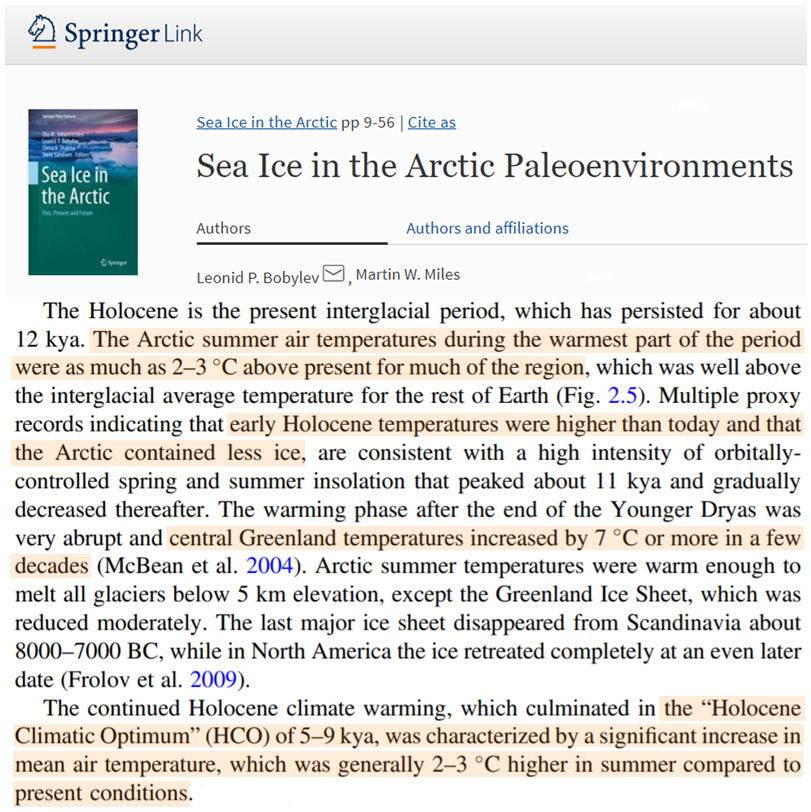
Rohling et al., 2019
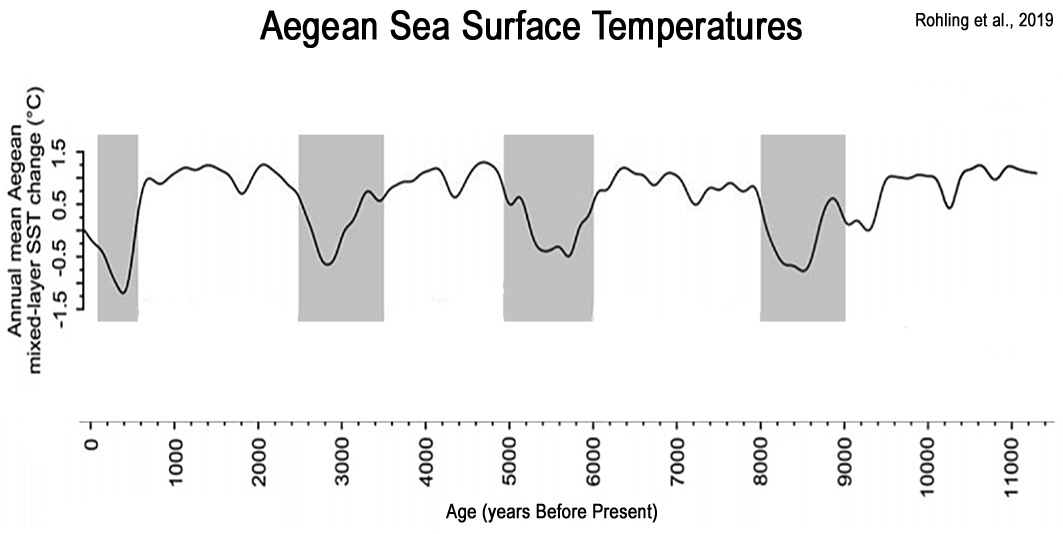
Røthe et al., 2019
“Our findings do not provide any confirmation that the glacier Sørfonna melted entirely away during the Holocene Thermal Maximum (HTM). Bjune et al. (2005) suggest summer temperatures were 1.5–2 °C warmer than present during this period. Combined with the evidence from the glaciers Nordfonna and Hardangerjøkulen, it is, however, likely that the glacier Sørfonnawas also significantly smaller than at present during this period. … Since 1650 cal. a BP, we infer that the glacier was larger than the 2002 CE glacier extent until 1910 CE when a GLOF [glacier outburst flood] occurred. Svartenutbreen has been retreating since 1910 CE, which led to the ice damming of the two historical GLOFs [glacier outburst floods] in the 1980s and 2002 CE separated by a glacier advance in the 1990s CE.”
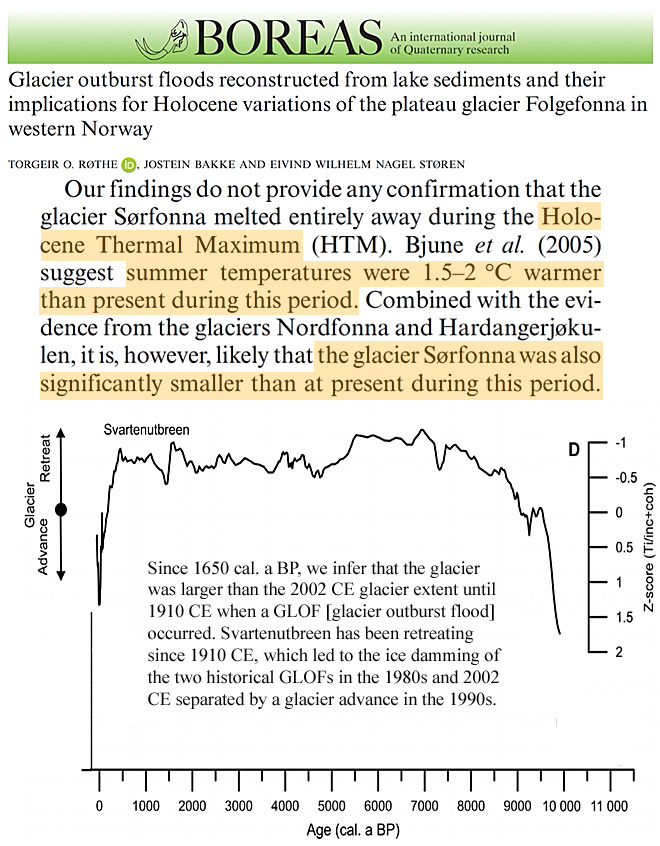
Liu et al., 2019
“The modern vegetation around Tianchi Crater Lake is categorized as temperate mixed conifer-broad-leaved forest … The area experiences a typical cold temperate monsoon climatic regime with long cold winters and short cool summers. The [modern] annual average air temperature is 0–0.5 °C … The PFT-MAT-based reconstructed Pann record for Tianchi Crater Lake has a similar trend of variation to that of the pollen percentage diagram. The ranges of Pann [annual precipitation] and Tann [annual mean temperature] are 268–881 mm and 1.7–10.5°C, respectively [for the Holocene]. …[V]ariations in Tann exhibit […] a marked rise from the beginning of the early Holocene and a peak at 9000–8000 cal yr BP.”
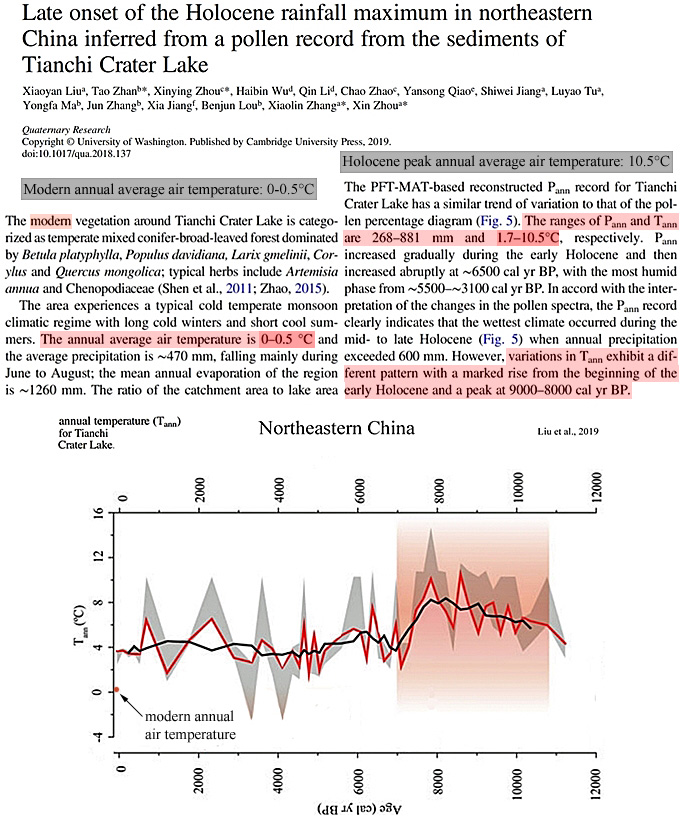
Steinman et al., 2019
“The early Holocene d18O [hydroclimate] maximum in the Castor Lake record at 9630 (9110-10,100) yr BP is likely in part a result of higher summer insolation, which produced higher temperatures and greater evaporation during the warm season. Additionally, atmospheric circulation in the early Holocene was substantially different from the modern configuration (Bartlein et al., 2014), and precipitation amounts were likely lower, due to the presence of the residual Laurentide and Cordilleran Ice Sheets (Dyke, 2004), which affected air mass trajectories and the seasonal distribution and amount of precipitation on a hemispheric scale. … A chironomid based climate reconstruction from Windy Lake, south-central British Columbia, supports the assertion that greater summer insolation produced warmer summer temperatures at this time (Chase et al., 2008).”
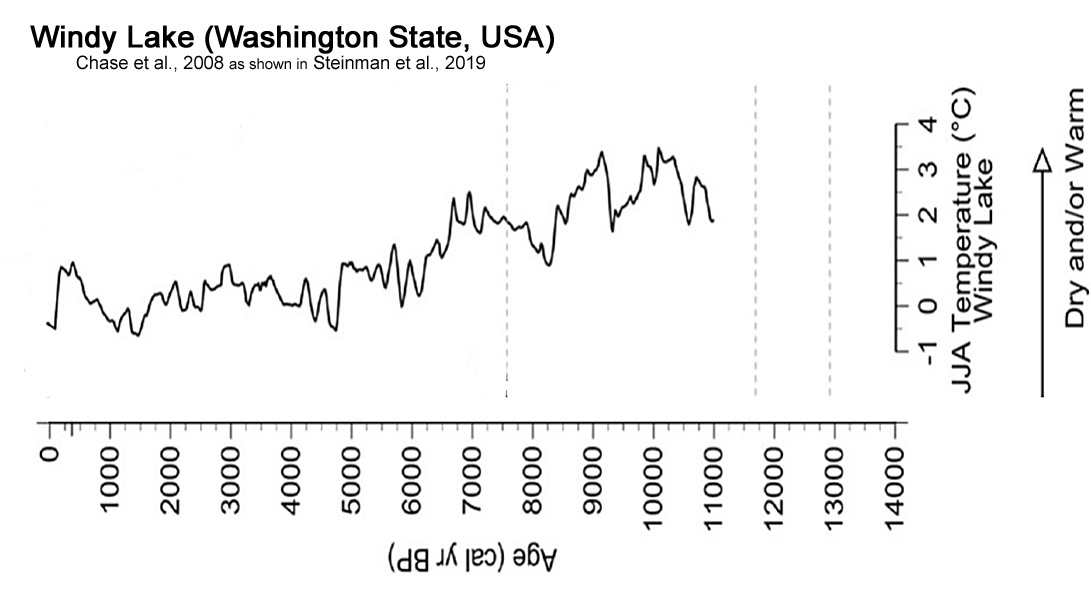
Yan et al., 2019
High-precision uranium–thorium (U–Th) dating of dead branching corals from Luhuitou reef, Sanya, northern South China Sea (SCS) indicates that the reef framework grew episodically over the past 7,000 years. Episodes of coral reef growth (“switch-on” phases) occurred in response to regional warming during the mid-Holocene Climate Optimum, Medieval Warm Period and Current Warm Period, when the East Asian summer monsoon (EASM) was strong and the East Asian winter monsoon (EAWM) was weak. In contrast, episodes when reef growth dramatically slowed or ceased (“switch-off” phases) occurred during comparatively cold periods (e.g. Dark Age Cold Period and Little Ice Age), and are linked to abrupt weakening of the EASM and concurrent strengthening of the EAWM. … SST records derived from Sanya Porites coral cores dated from 6500 to 6100 yr BP indicate that the mid-Holocene maximum monthly summer SSTs during this period were as much as 2.0°C higher than at present in the northern SCS [South China Sea] [Wei et al., 2007]. … Reconstructions of SST based on Porites from the Leizhou Peninsula [Yu et al., 2005] indicate that while the summer SST maxima were relatively stable (~2°C) over the past 7,000 years, the winter SST minima displayed large variability (up to 5°C) between switch-off and switch-on episodes.
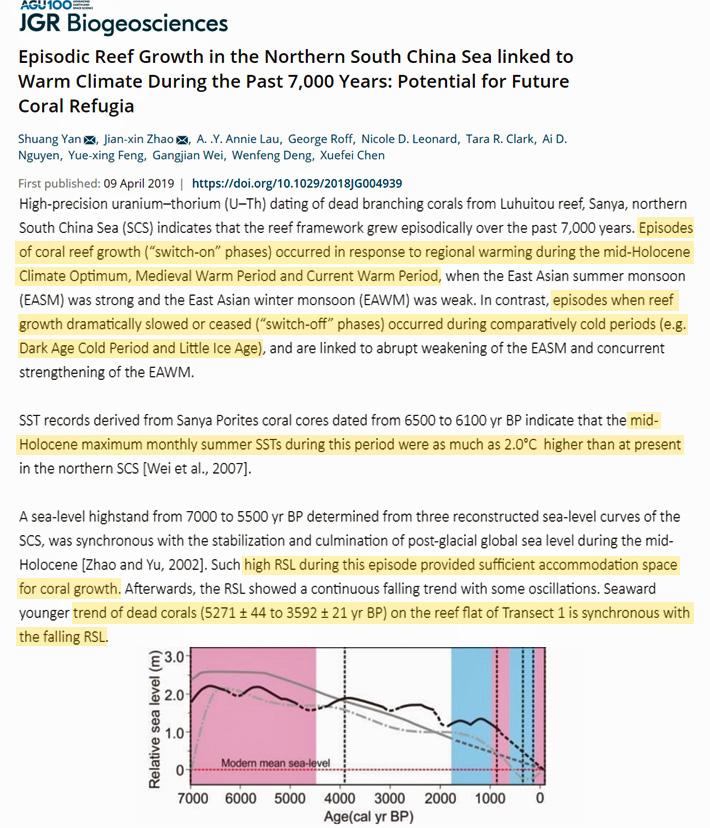
Zhang et al., 2019
“Studies of solar activity and cosmic radiation indicate that solar activity is the main factor driving climate change on decadal-to centennial scales (Stuiver and Braziunas, 1993; Xu et al., 2014; Yu and Ito, 1999; Zhao et al., 2010). In addition, solar activity is well correlated with global surface temperature (Bond et al., 2001; Usoskin et al., 2003). Changes in the production rates of two common cosmic radionuclides (∆14C and 10Be), which are preserved in ice cores and tree rings, suggest that periodic fluctuations in solar activity on decadal-to-centennial scales directly affect the cosmic ray flux (Abreu et al., 2013; Masarik and Beer, 1999; Steinhilber et al., 2012). Kirkby (2007) summarized evidence for a close relationship between temperature change and solar activity during the last millennium, finding that cosmic radiation flux was weak and solar activity was strong during the MWP; whereas, the opposite conditions occurred during the LIA. Therefore, the cosmic ray flux can be regarded as a proxy for solar activity and that it can be used to assess the relationship between climate change and solar activity. … Several notable cold periods, with lower Quercus frequencies, occurred at approximately 1200 AD, 1410 AD, 1580 AD, 1770 AD and 1870 AD. These centennial-scale cold periods basically correspond to major minima in solar activity, suggesting that variations in solar activity may have been an important driver of climate and vegetation change in the study area during the last millennium.”
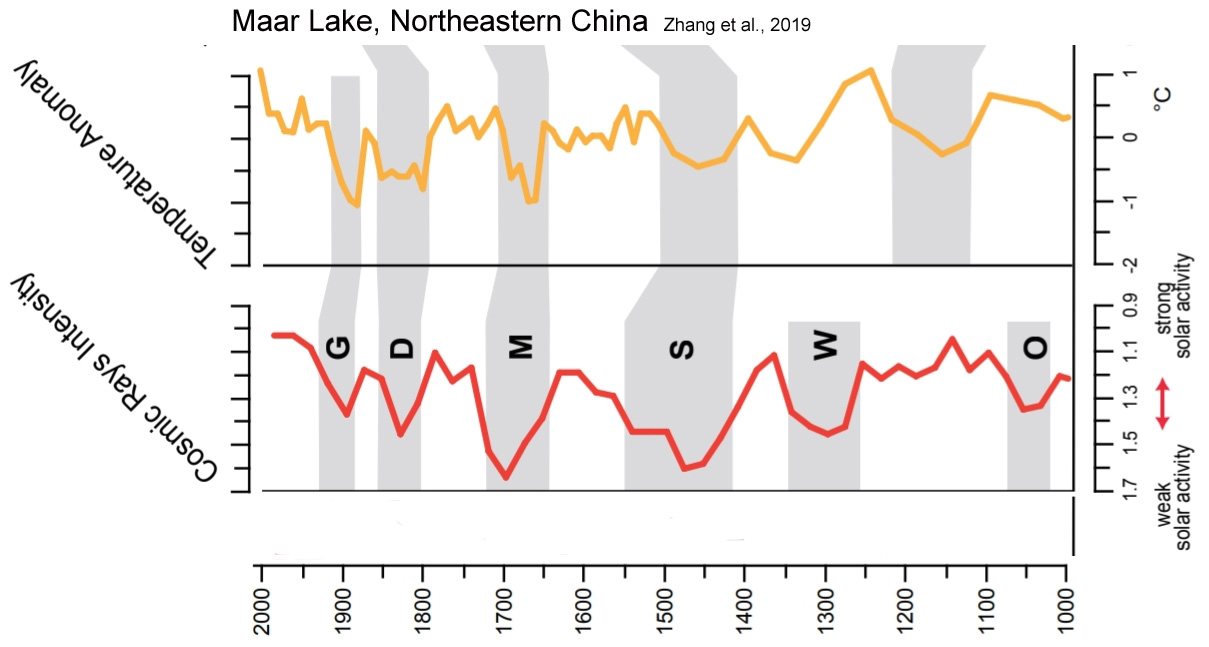
Cao et al., 2019
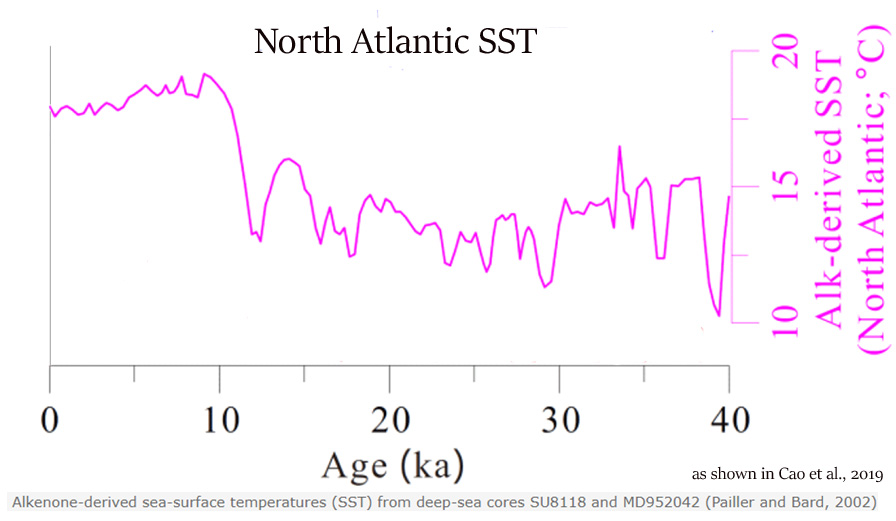
Dauner et al., 2019
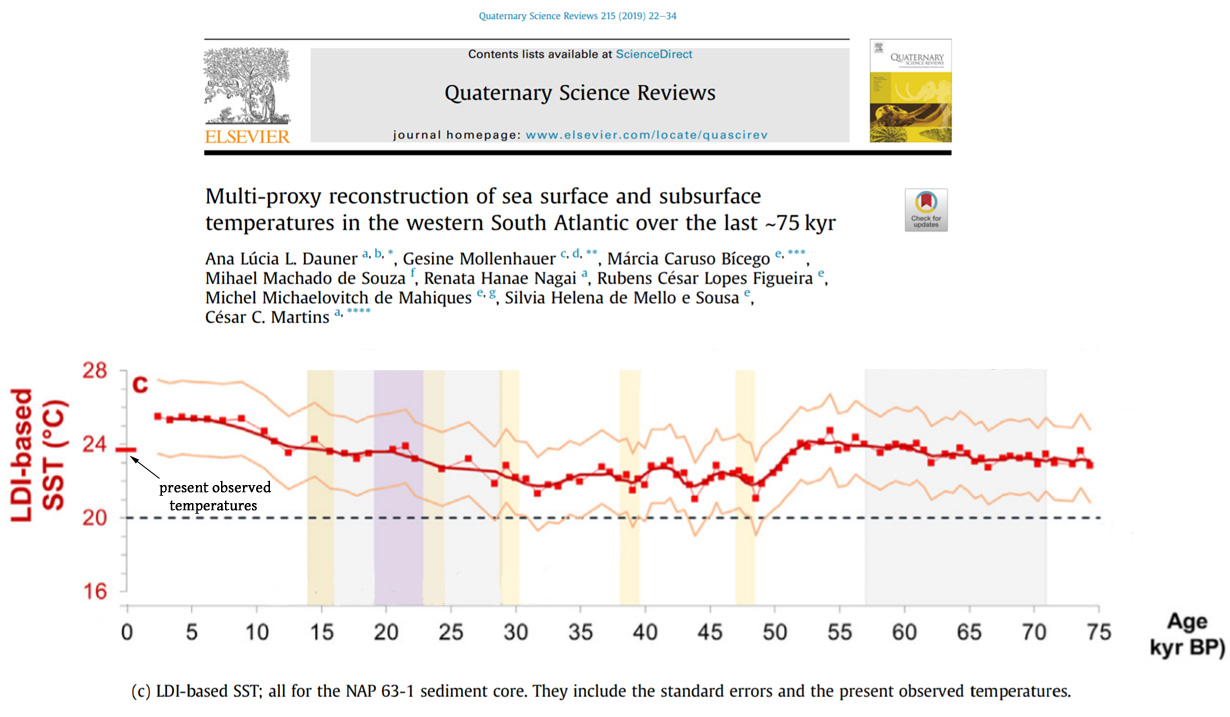
Lozhkin et al., 2019
“Mixed Larix-Betula forest was established at the Tanon site by ∼6600 14C BP (∼7500 cal BP). This forest included Betula platyphylla, a species common in moderate zones of the Russian Far East (e.g., B. platyphylla-Larix forests of central Kamchatka). The importance of Betula in the Middle Holocene assemblage is unusual, as tree Betula is not a common element in the modern coastal forest. The abundance of B. platyphylla macrofossils particularly suggests warmer than present summers and an extended growing period. This inference is supported by a regional climate model that indicates a narrow coastal region where the growing season was longer and summer temperatures were 2-4 °C warmer than today. Variations in Betula pollen percentages at other sites in northern Priokhot’ye are suggestive that this Middle Holocene forest was widespread along the coast.”
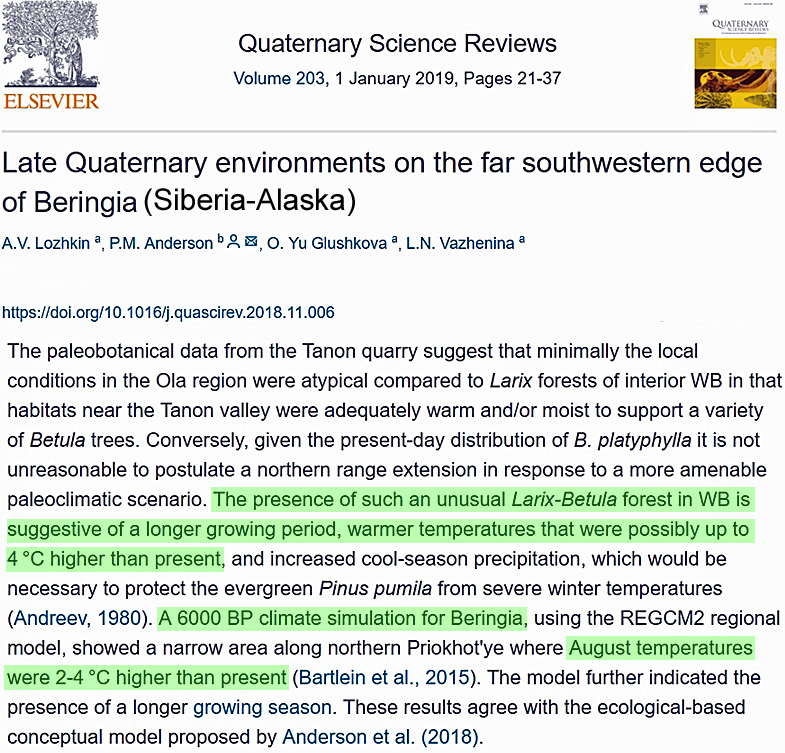
Novenko et al., 2019
“[D]uring the Holocene Thermal Maximum when the mean annual temperatures were 2°С higher than those of the present day [6,9,10,11]. Roughly 5.7–5.5 ka BP, the Holocene Thermal Maximum was followed by gradual climatic cooling that included several warming and cooling phases with temperature fluctuations ranging between 2 and 3°С. …The CFSNBR [Central Forest State Natural Biosphere Reserve] is situated roughly 360 km northwest of Moscow (the Tver region, 56º35’ N, 32º55’ E) in an ecological zone transitioning from taiga to broadleaf forests. The vegetation of the CFSNBR is primary southern taiga forests, and it has been undisturbed by any human activities for at least 86 years. The climate of the study area is temperate and moderately continental with a mean annual temperature of 4.1°C and annual precipitation of roughly 700 mm.”
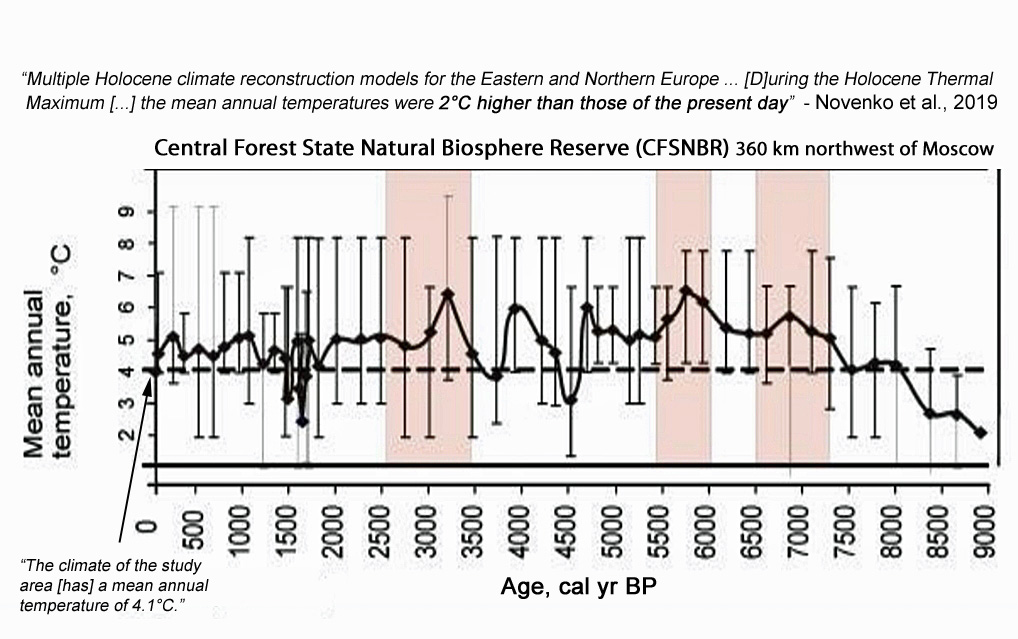
Rey et al., 2019
“Our results imply that mixed Fagus sylvatica forests with Abies alba and Quercus may re‐expand rapidly in these areas, if climate conditions will remain within the range of the mid‐Holocene climatic variability (with summers c. +1–2°C warmer than today). … [T]he rise and fall of early farming societies was likely dependent on climate. Favourable climatic conditions (i.e. warm and dry summers) probably led to an increase in agricultural yields, the expansion of farming activities and resulting forest openings, whereas unfavourable climatic conditions (i.e. cold and wet summers) likely caused crop failures, abandonment of agricultural areas and forest succession. A better understanding of the environmental and societal factors controlling coeveal land-use dynamics as shown in this study would require new climate proxy data (e.g. temperature reconstruction from well dated and complete Holocene tree ring series). On the basis of our results and considering the ongoing spread of temperate forests in lowland Central Europe, we conclude that the existing beech forest ecosystems are resilient to anthropogenic disturbances under a changing climate.”
Eda et al., 2019
“Recent taxonomic composition and faunal distribution patterns support recognition of three biogeographic regions in Asia, Palaearctic (north), Indomalayan (south), and a transition zone between the two (Hoffmann 2001). In the division, the Yangtze River delta is located at the boundary of the Indomalayan region and transition zone. Pollen records suggest that, middle Holocene temperatures were ca. 2–4 °C warmer than today in the middle Yangtze River delta (Yi et al. 2003). Peters et al. (2016) indicated that the middle Yangtze River basin would delimit the northern most boundary for required habitat of (sub-) tropical red junglefowl during the Holocene thermal optimum. Furthermore, Xiang et al. (2014) reported that the wild distribution area of red junglefowl extended to northern China in the early Holocene, and domestic chicken farming began in the region.”
Caballero et al., 2019
“Diatom-based transfer functions for salinity, precipitation and temperature were developed using a training set that included data from 40 sites along central Mexico. … Maximum last glacial cooling of ∼5°C is reconstructed, a relatively wet deglacial and a warmer (+3.5°C [than present]) early Holocene. … The early Holocene marked a change towards high lake salinities and the highest positive temperature anomalies (+3.5°C) during a peak in summer insolation.”
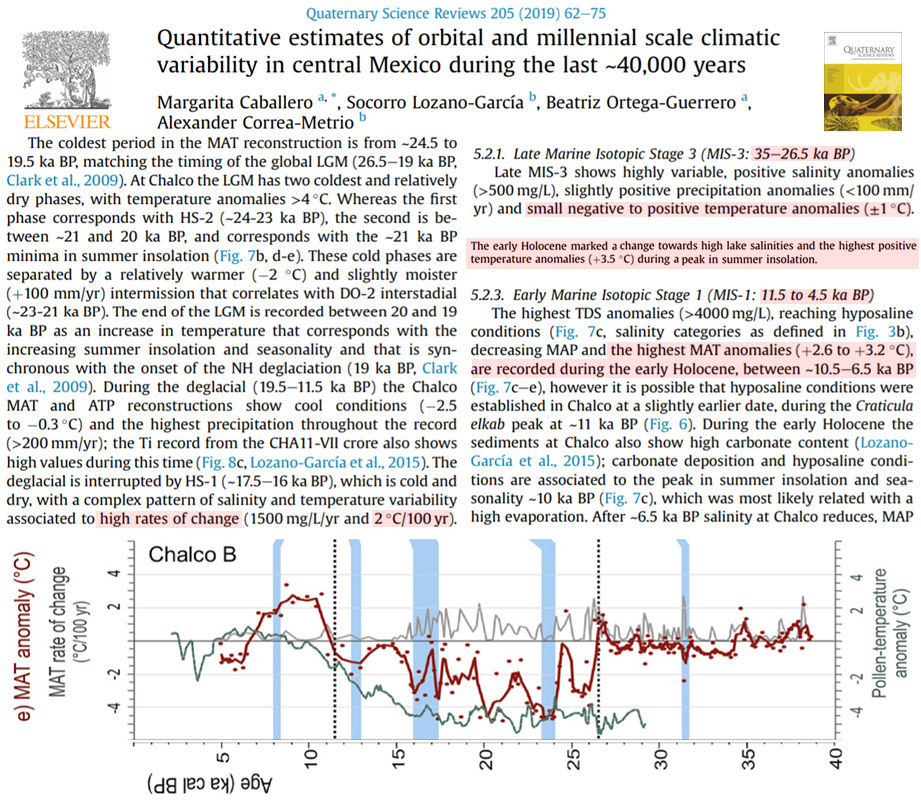
Manzanilla-Quiñones et al., 2019 (North America)
“Given the recent diversification of the genus Abies in the world (Xiang et al., 2015), it is very likely that climatic conditions of 6 000 to 12 000 years ago were warmer (+2 °C) in North America’s temperate and cold areas (Caballero et al., 2010; Svensson et al., 2008).”
Helmens, 2019
“Quantitative climate reconstructions based on pollen from terrestrial plant taxa show mean July temperature values reaching 3 °C warmer than the present-day value of +13 °C at Sokli.”
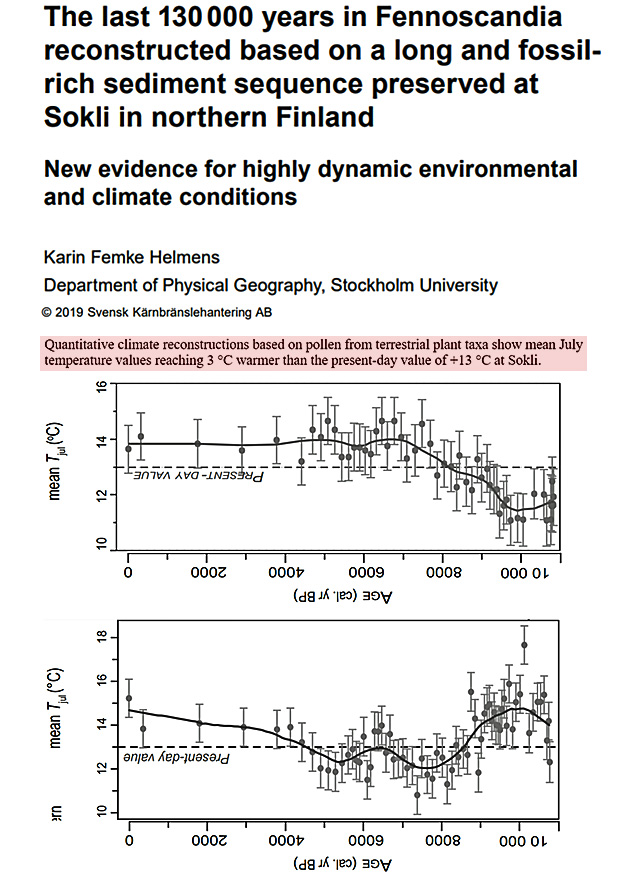
Pei et al., 2019
“During the period of 0–10,000 yr BP, China’s temperature has closely followed the solar forcing. The correlation is as high as 0.800 (p < 0.01) for the EOF-based reconstruction. … Similar to the North Atlantic SST, AO also plays an important role in China’s temperature (Zuo et al., 2015). NAO and AO are both suggested to influence the climate in East Asia by modifying the strength and location of the 200 hPa jet stream (Yang et al., 2004). The AO record of Darby et al. (2012) is based on sea-ice drift, which has a high resolution of 10–100 years and shows a close connection with solar activities.”
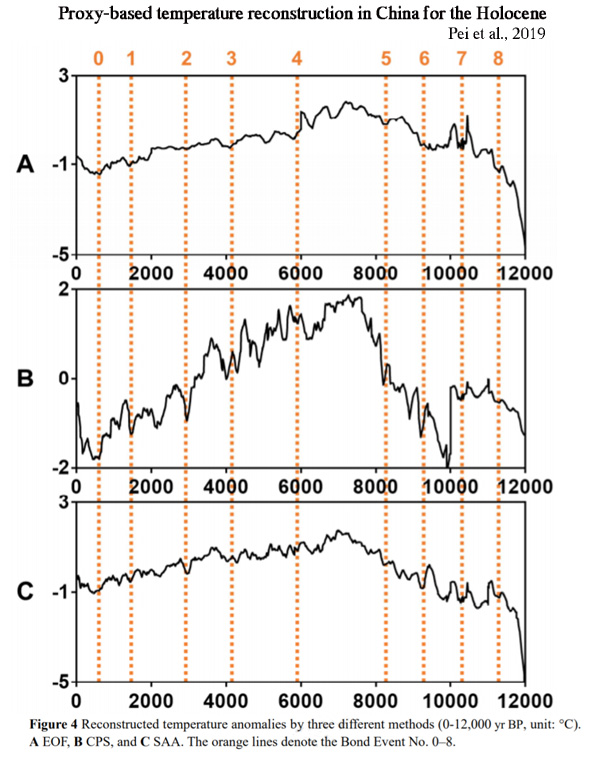
Tanhuanpää et al., 2019
“The postglacial expansion of hazelnut happened in the Holocene epoch, mainly during the Sub-Boreal climatic stage about 6000–4000 years ago, when climate was 2–4 °C warmer than present (Eriksson et al. 1991).”
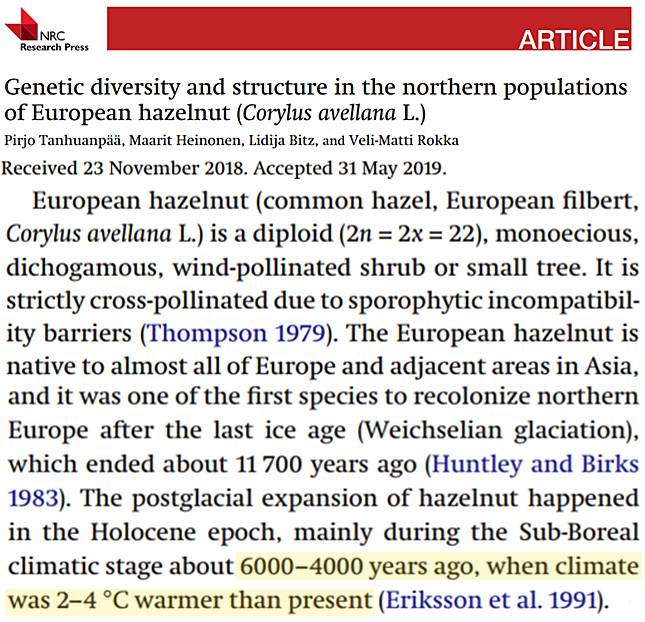
Ning et al., 2019
“Here we investigate the sources of branched glycerol dialkyl glycerol tetraethers (brGDGTs) in Lake Ximenglongtan from southwestern China and present a brGDGTs-based Holocene (~9.4 cal kyr BP) temperature reconstruction. Holocene temperature evolution is characterized by an early cool phase (with a mean annual air temperature (MAAT) of 12.5 °C) prior to 7.6 cal kyr BP, followed by a rapid warming towards the local thermal maximum (MAAT = 13.8 °C) from 7.6 to 5.5 cal kyr BP and a subsequent long-term cooling that ended at 1.5 cal kyr BP. Temperature changes after 1.5 cal kyr BP show high variability and low correspondence to global climate events such as the Medieval Warm Period. Overall Holocene temperature variation has been primarily controlled by boreal summer insolation changes.”
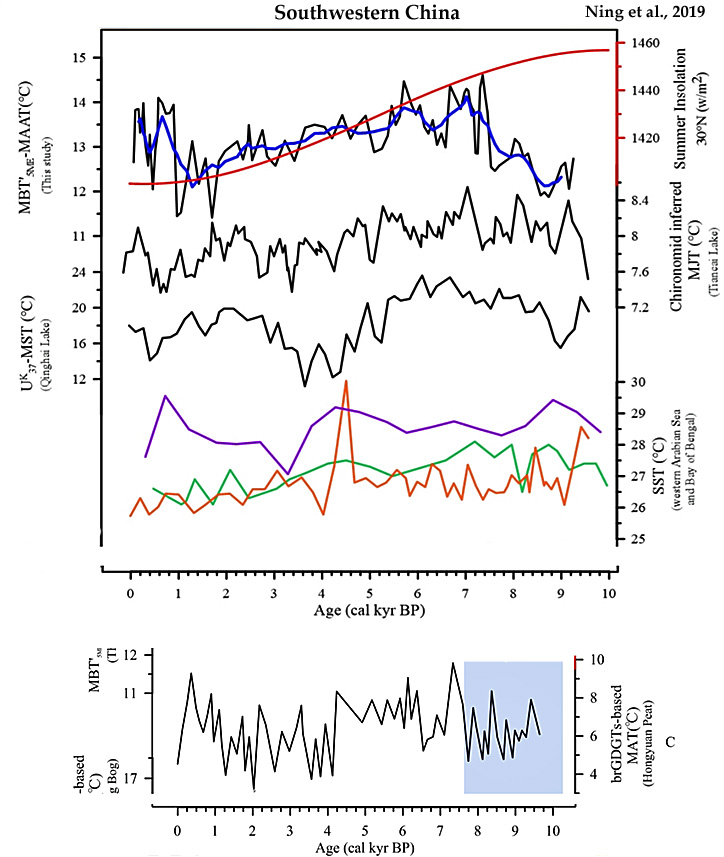
Rull et al., 2019 (Pantepui, NE South America)
“Myrica forests dominated during the HTM [Holocene Thermal Maximum] and reached their maximum importance at the end of this phase. A sudden replacement of these forests by tepui meadows dominated by Stegolepis took place after the HTM, just at the beginning of the regional cooling and drying trend initiated at B6 cal kyr BP. Myrica forests never returned to the site. The only species of this genus living today in the Guiana region, Myrica rotundata, is endemic to Pantepui and occurs on the slope forests of the Apakara´-tepui, with an upper distribution limit near the coring site (Miller, 2001). It has been suggested that during the HTM, warmer and wetter climates would have favored upslope migration of Myrica forests to higher elevations, which could explain their dominance in the Apakara´ summit. The subsequent post-HTM cooling would have returned Myrica to lower elevations favoring the local expansion of meadows. HTM climatic conditions never recovered during the rest of the Holocene, and Myrica remained at lower elevations until today (Rull and Montoya, 2017)”
Yuan et al., 2019
“During the early Holocene (10.0–6.0 ka), the modern-type circulation system was not established, which resulted in strong water column stratification; and the higher sea surface temperature (SST) might be associated with the Holocene Thermal Maximum (HTM). The interval of 6.0 to 1.0/2.0 ka displayed a weaker stratification caused by the intrusion of the Yellow Sea Warm Current (YSWC) and the initiation of the circulation system. A decreasing SST trend was related to the formation of the cold eddy generated by the circulation system in the ECS. During 1.0/2.0 to 0 ka, temperatures were characterized by much weaker stratification and an abrupt decrease of SST caused by the enhanced circulation system and stronger cold eddy, respectively.”
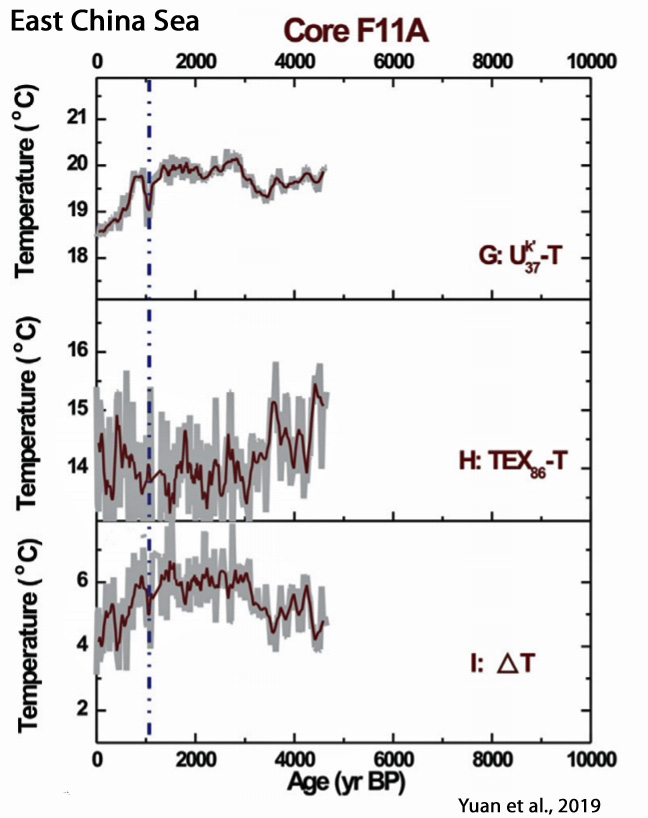
Marret et al., 2019
“The studied region is the only coastal region in Russia to have subtropical landscapes as well as humid to semi-arid landscapes (Petrooshina, 2003). Winter temperatures average 3–5°C in winter up to 23–24°C in summer. … A possible maximum of warm conditions may have occurred between 3.0 and 2.5 cal. ka BP, as highlighted by the occurrence of O. israelianum. This species has not been seen in modern sediments from the Black Sea nor the Caspian Sea and mainly occurs in waters where winter SSTs are above 14.3°C and summer SSTs are more than 24.2° C … Establishment of present-day conditions may have happened within the last 1500 years, but the low-resolution sampling at the top of the core prevents us to exactly pinpoint this change. However, our dinocyst assemblage indicates cooler conditions [today] with the decrease of S. mirabilis.”
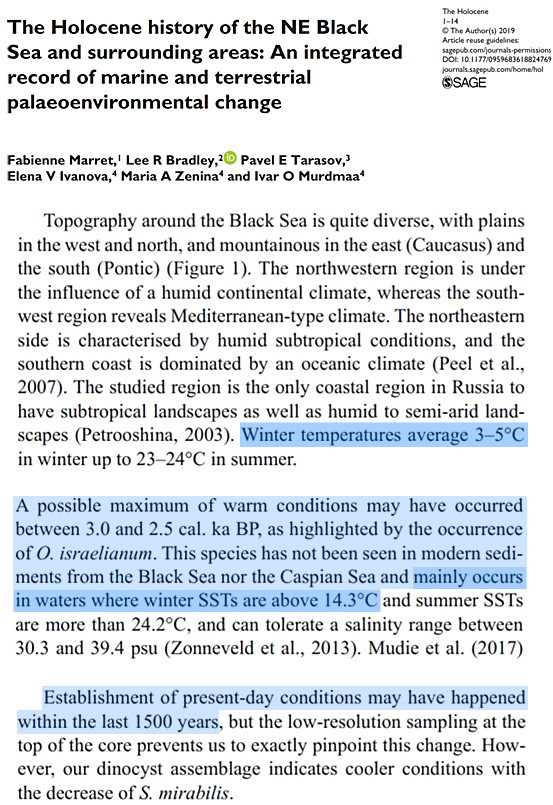
Benson et al., 2019
“Summer temperatures reconstructed from Burial, Zagoskin, and Trout Lakes using fossil Chironomidae assemblages provide additional evidence of increased summer temperatures (Fig. 7) that were roughly 1–2°C warmer than modern July air temperatures (Kurek et al., 2009b; Irvine et al., 2012). Additional evidence suggesting regionally warm conditions during the early Holocene includes the highest rates of thaw-lake initiation and peat formation ages from 11 to 10 cal ka BP (Jones and Yu, 2010; Walter Anthony et al., 2014).”
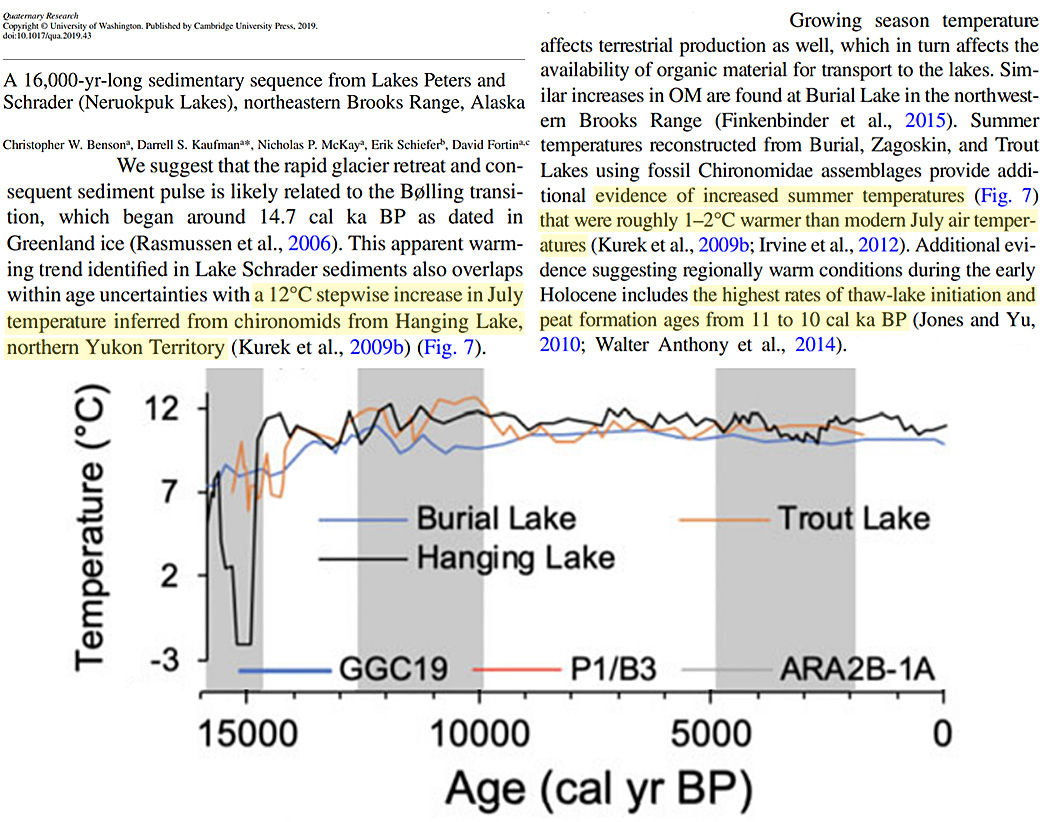
Ortega et al., 2019
“Highly variable SSTs in Tongoy Bay occurred during the last 2000 years (Figure 7c), and possibly earlier, in agreement with variable upwelling since ~3000 yr ago suggested by variable faunal assemblages (32°45’S) (Marchant et al, 1999). … Observed standardized annual precipitation and the 10-year running average at La Serena show a general decreasing trend (Figure 8a) reflecting the persistent aridification affecting the semi-arid coast of Chile. The linear trend over the whole observed period (1869–2016 CE) indicates that La Serena has had a 4% decrease in precipitation per decade, as previously documented by Schulz et al. (2011) and Quintana and Aceituno (2012). A similar calculation for CMIP5 simulations (1850-2005, historical simulations) indicates no significant trend over the 20th century. This difference between observations and simulations suggests that most of the observed trend is due to natural variability instead of a forced response to anthropogenic forcing.”
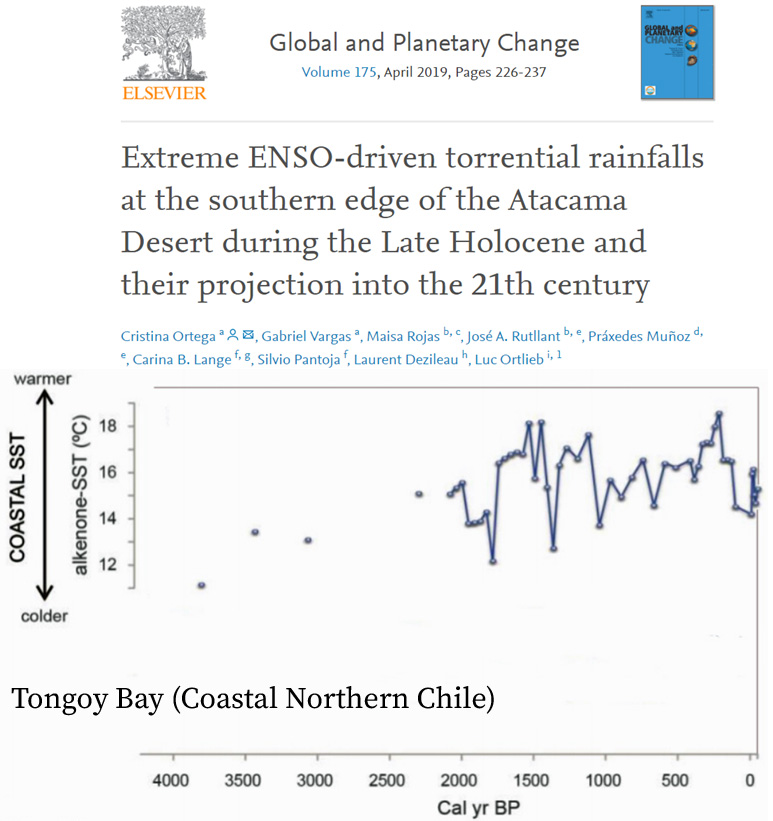
Hvidberg et al., 2019
“Here we present results from a study of the evolution of the Greenland ice sheet through the Holocene (Nielsen et al. 2018). We use a suite of different ice-core-derived climate histories for the Holocene to investigate the evolution of the Greenland ice sheet through the deglaciation, the Holocene thermal maximum and up to present day. The Holocene thermal maximum was a period 8–5 kyr ago when annual mean surface temperatures in Greenland were 2–3°C warmer than present-day values. We use climate histories based on new interpretations of the isotope records (Gkinis et al. 2014), which results in a more pronounced thermal maximum compared to previously used climate records. Furthermore, our records inform of snow accumulation rates in the early Holocene. Our studies show that the Greenland ice sheet retreated to a minimum volume of up to ∼1.2 m sea-level equivalent smaller than present in the early or mid-Holocene, and that the ice sheet has continued to recover from this minimum up to present day.”
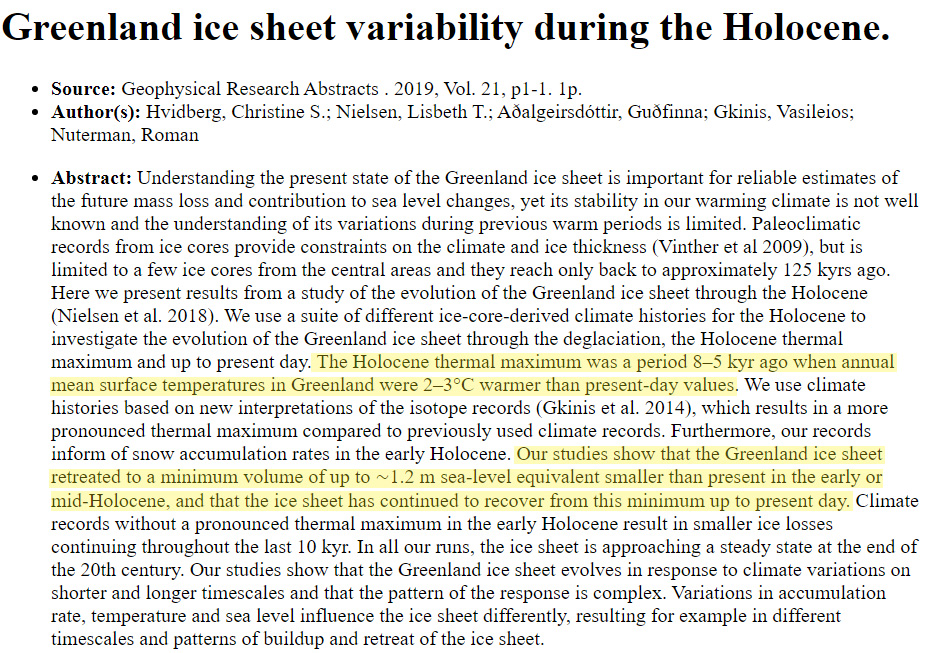
Erturaç et al., 2019
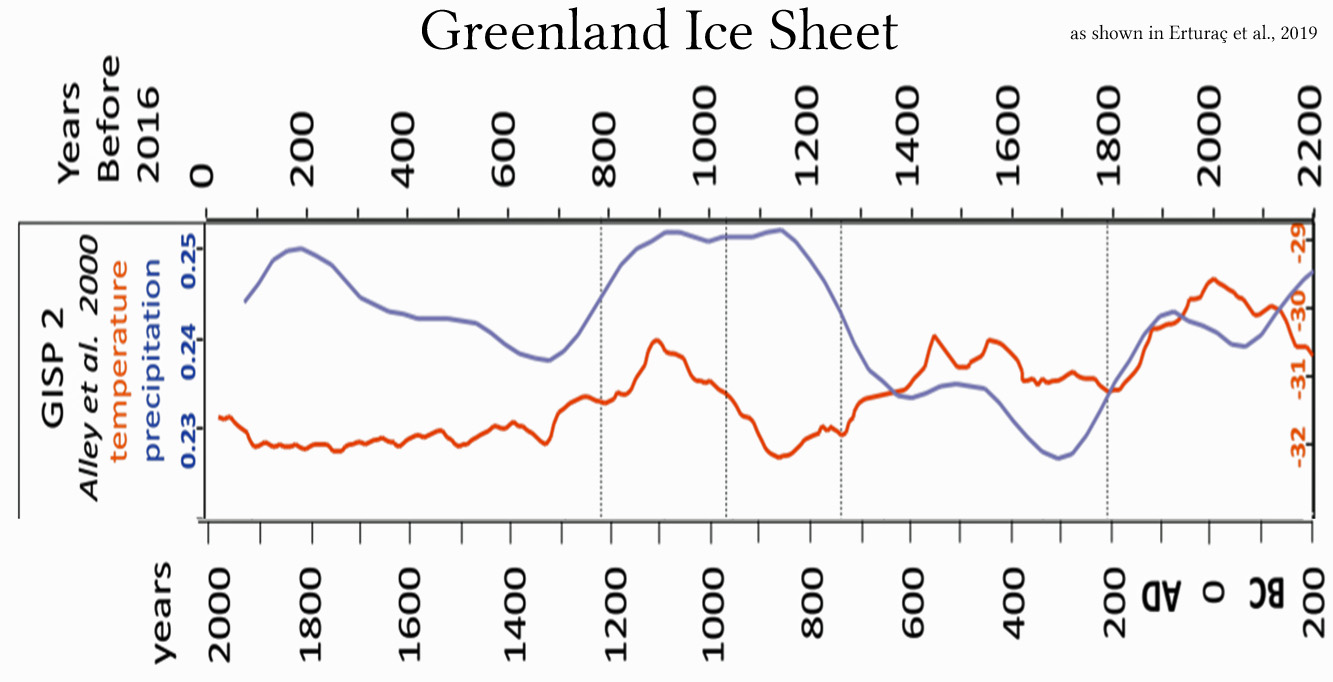
Fletcher et al., 2019
“The Pliocene is an intriguing climatic interval that offers important insights into climate feedbacks. Atmospheric CO2 concentrations were, at times, as high as modern ones (Fig. 1), but generally show a decreasing trend throughout the Pliocene (Haywood et al., 2016; Pagani et al., 2010; Royer et al., 2007; Stap et al., 2016), Although CO2 estimates from different methods do not converge, the modeled direct effects of these CO2 discrepancies appear to be small (Feng et al., 2017). Of additional importance for comparability to the modern climate system, continental configurations were similar to present (Dowsett et al., 2016). While global mean annual temperatures (MATs) during the Pliocene were only ∼ 3°C warmer than in the present day, Arctic land surface MATs may have been as much as 15 to 22°C warmer (Ballantyne et al., 2010; Csank et al., 2011a, b; Fletcher et al., 2017). Further, Arctic sea surface temperatures may have been as much as 10 to 15°C warmer than modern ones (Robinson, 2009), and sea levels were approximately 25 m higher than present (Dowsett et al., 2016). As a result, the Arctic terrestrial environment was significantly different from today, with boreal ecosystems at much higher latitudes (Salzmann et al., 2008).”
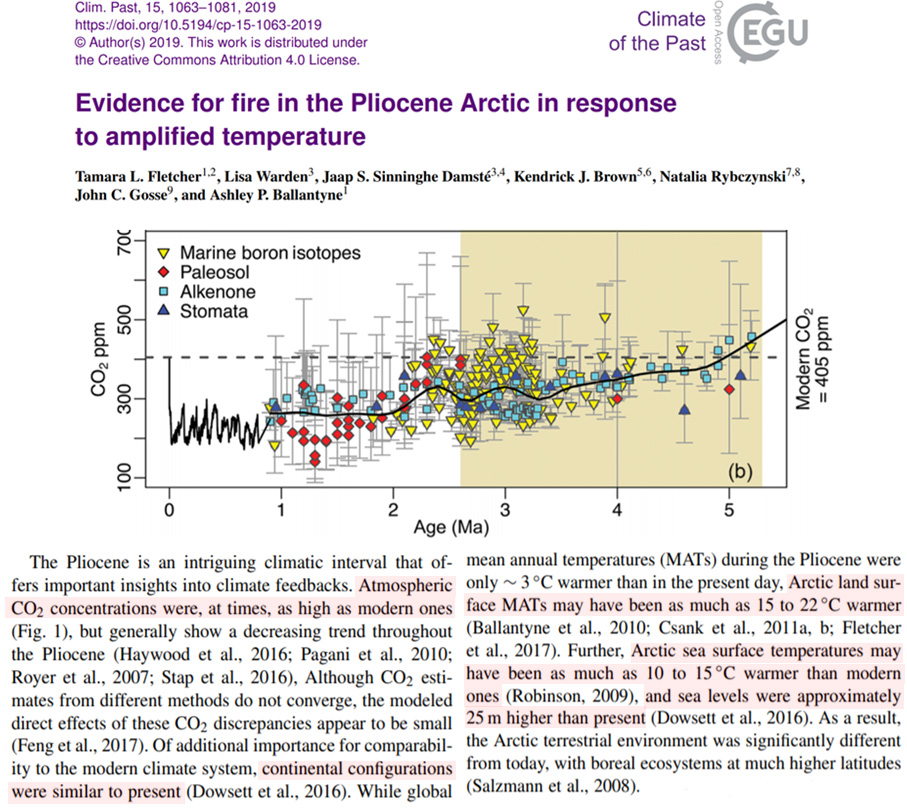
Feakins et al., 2019
“At lake level [Lake Elsinore, southern California] mean annual temperature (MAT) averages 18°C, with summer average temperatures of 25°C, resulting in high potential evaporation rates and lake water loss of >1.4 m yr−1(Kirby et al., 2013). … [T]he reconstructed temperatures are reasonable with early Holocene values close to modern (18°C). … Temperatures >20°C are reported for six late glacial samples, including a high of 22°C at 29.4 ka and a maximum of 23°C at 26.8 ka which coincides with the pollen-inferred warm and dry period from 27.5–25.5 ka (Heusser et al., 2015) when the lake was shallow (∼3.2–4.5 m deep; Kirby et al., 2018). … The lowest temperature, 10°C, occurs at 23.5 ka and the deglacial warming from 14–12 ka is >10°C, agreeing with the pollen interpretations of ∼11°C warming at the glacial termination (Heusser et al., 2015).”
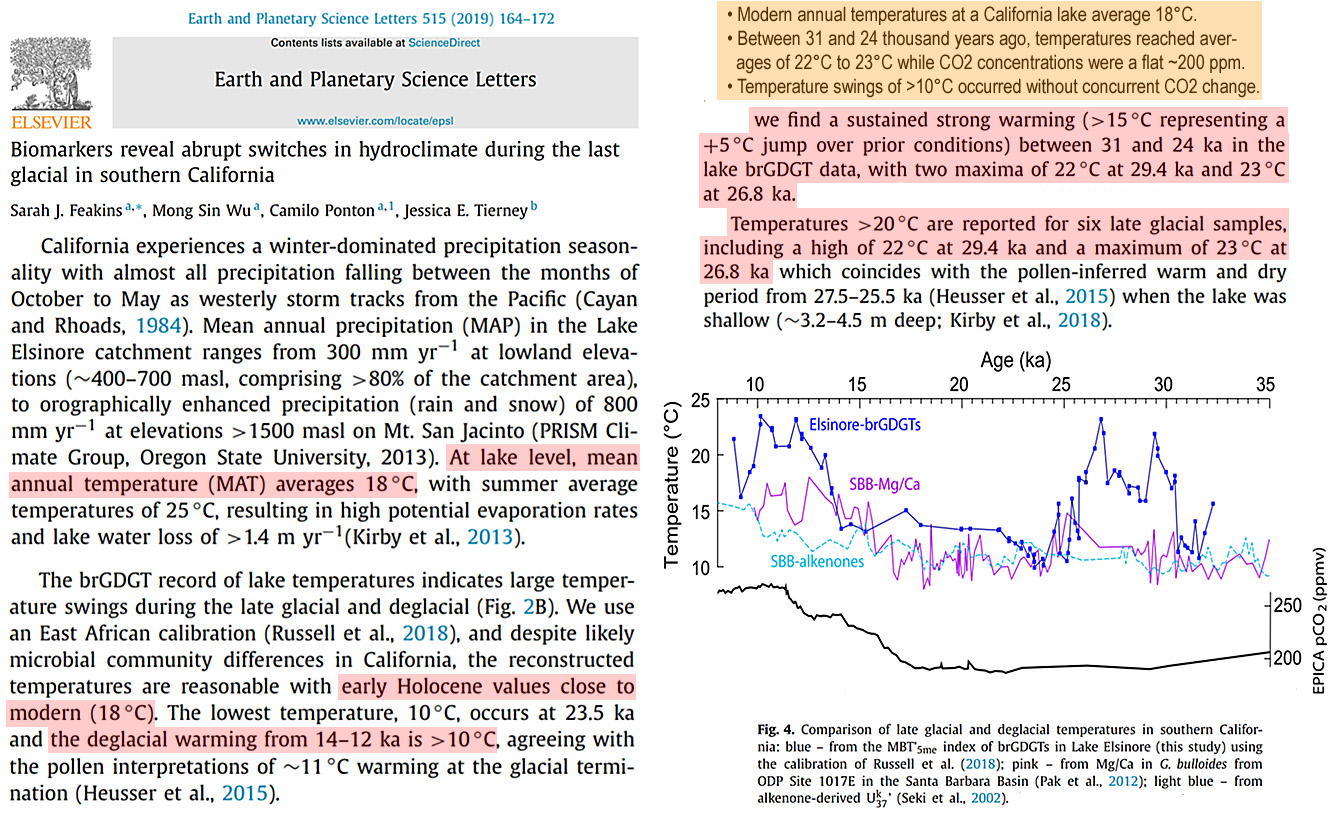
Klinge and Sauer, 2019
“For the Tsambagarav Mountain (central Mongolian Altai), Herren et al. (2013) reconstructed the climatic development over the last 6 ka, based on an ice core. Because the maximal age obtained for the base of the glacier ice was approximately 6 ka, they concluded that warm conditions led to disappearance of most of the glaciers in the Altai Mountains during the early to mid-Holocene. This assumption was supported by Ganyushkin et al. (2018), who found fossil wood above the modern tree line in the Mungun-Taiga Mountain in northwest Mongolia, dating between 10.6 ka and 6.2 ka. They concluded that the tree line was 350 m higher than today at that time, indicating that summer temperatures were 2.0-2.5°C warmer than at present, and MAP was about twice as much as today, which led to a decrease of the glaciated area.”
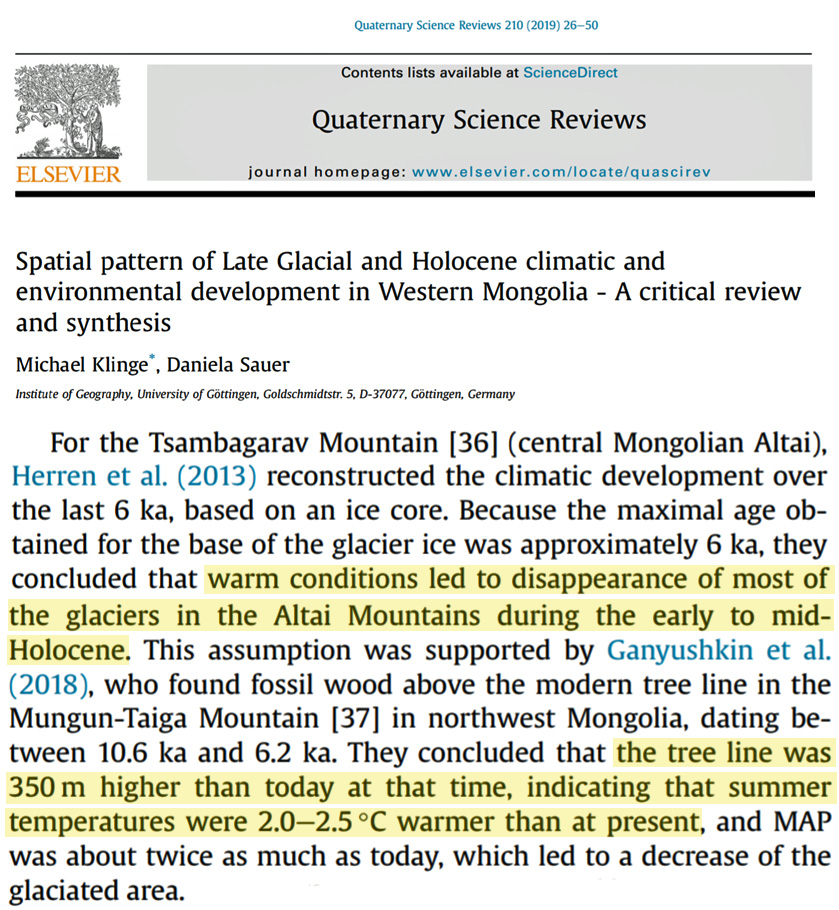
Axford et al., 2019
“Deltasø chironomids indicate peak early Holocene summer temperatures at least 2.5-3°C warmer than modern and at least 3.5-4°C warmer than the pre-industrial last millennium. We infer based upon lake sediment organic and biogenic content that in response to declining temperatures, North Ice Cap reached its present-day size ~1850 AD, having been smaller than present through most of the preceding Holocene.”
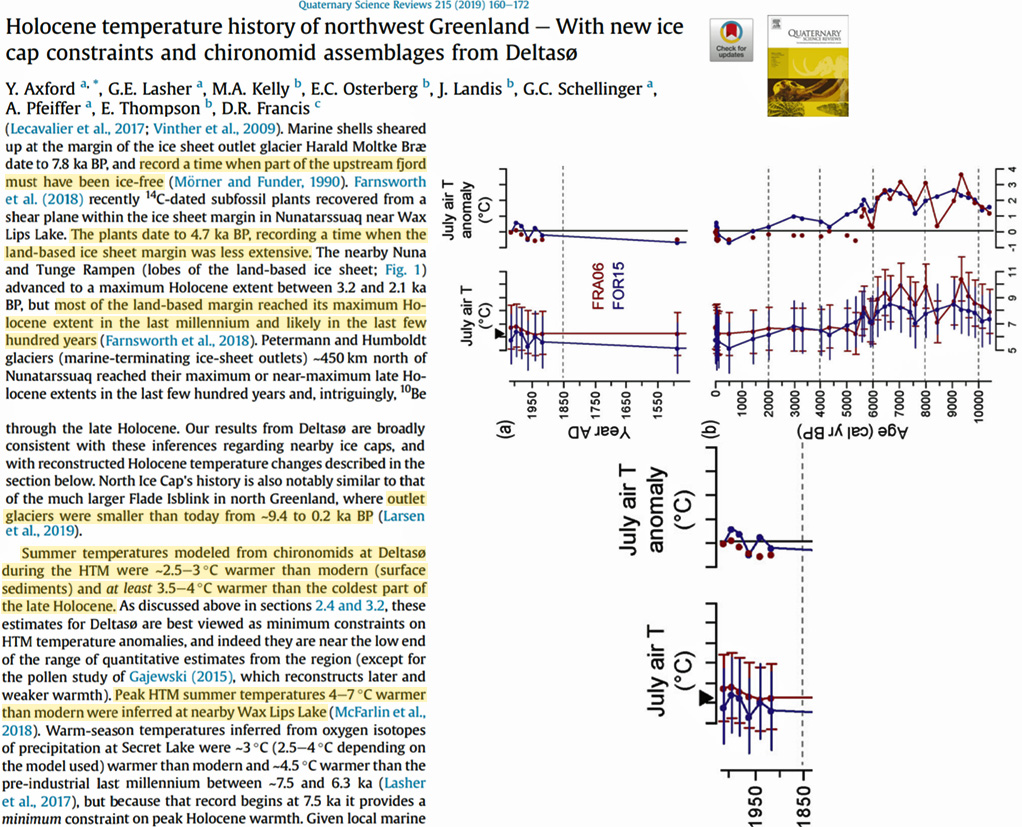
Jimenez-Moreno et al., 2019
“The pollen record is also consistent with higher than modern summer temperatures. Previous studies from the area show that upper treeline would have been between 80 and 300 m higher than today. … Here, we find that low elevation thermophilous species, such as Quercus, Juniperus and Cercocarpus, reached maximum abundances between 8000 and 6700 cal yr BP in subzone EL-2a. This pattern probably points to the occurrence of these species at their highest Holocene elevations at this time and thus adds to evidence for the highest regional temperatures in the middle Holocene, possibly >2°C warmer than today (Andrews et al., 1975; Carrara et al., 1984; Elias, 1996).”
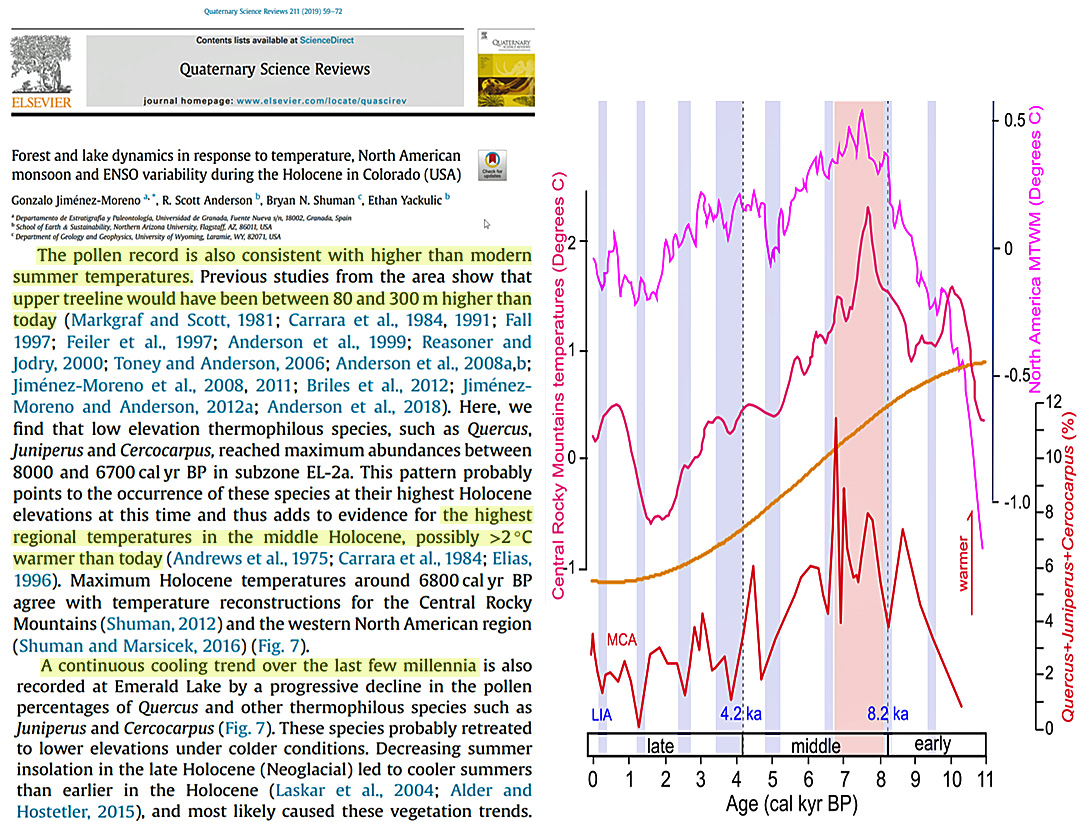
Reißig et al., 2019
“[T]he Tobago Basin core 235 subSSTMg/Ca record is highly variable and ranges from ~13-23°C, which is approximately three times as much as at Beata Ridge.. In Tobago Basin, the subSSTMg/Ca decrease by ~2°C from 30 ka BP (18°C) to the onset of HS1 (16°C). Within HS1, the subSSTMg/Ca increase continuously by 2°C, while at ~15.5 ka it rises abruptly by ~6°C up to maximum temperatures of 23°C. The abrupt subSST rise is delayed too the reconstructed SST rise at the beginning of HS1 by Bahr et al. (2018) (Fig. S7). Subsequently, subSSTMg/Ca scatters around 20°C until the beginning of the Bølling-Allerød (B/A). During the B/A and the YD the subSSTMg/Ca remains higher than ~19°C, abruptly increases up to ~22°C at mid YD, while steadily decreasing afterwards reaching modern values of ~15.5°C in the mid Holocene. Lowest subSSTMg/Ca of ~13°C are observed after ~7 ka BP. On average, the LGM subSSTMg/Ca are warmer by ~2.5°C than during the Holocene. … [T]he subsurface temperature variability is a robust climate signal in the tropical W Atlantic. Both records show an increase of ~5°C in subSSTMg/Ca from the LGM to the early YD and a subSSTMg/Ca decrease by ~7-8°C during the Holocene suggesting that both sediment cores are influenced by the same oceanographic changes. Notably, the mid Holocene subSSTMg/Ca in Tobago and Bonaire Basins remain cooler by ~1.5°C and ~3°C, respectively, than during the LGM. … At Tobago Basin and Bonaire Basin, the deglaciation is characterized by abrupt rises in subSSTMg/Ca by ~5.5°C at the end of HS1 and by ~6°C at the middle of the YD to peak values of up to ~23°C and ~22°C, respectively, accompanied by changes towards saline conditions (mean δ18Osw-ivf of ~2.25‰ and ~2‰, respectively (Fig. 3). These highly variable changes occur within less than 400 years. … In contrast to modern conditions Tobago Basin core 235 was influenced by a warm water mass between 30-10 ka BP, indicated by elevated subSSTMg/Ca (~2.5°C warmer than the modern conditions)”
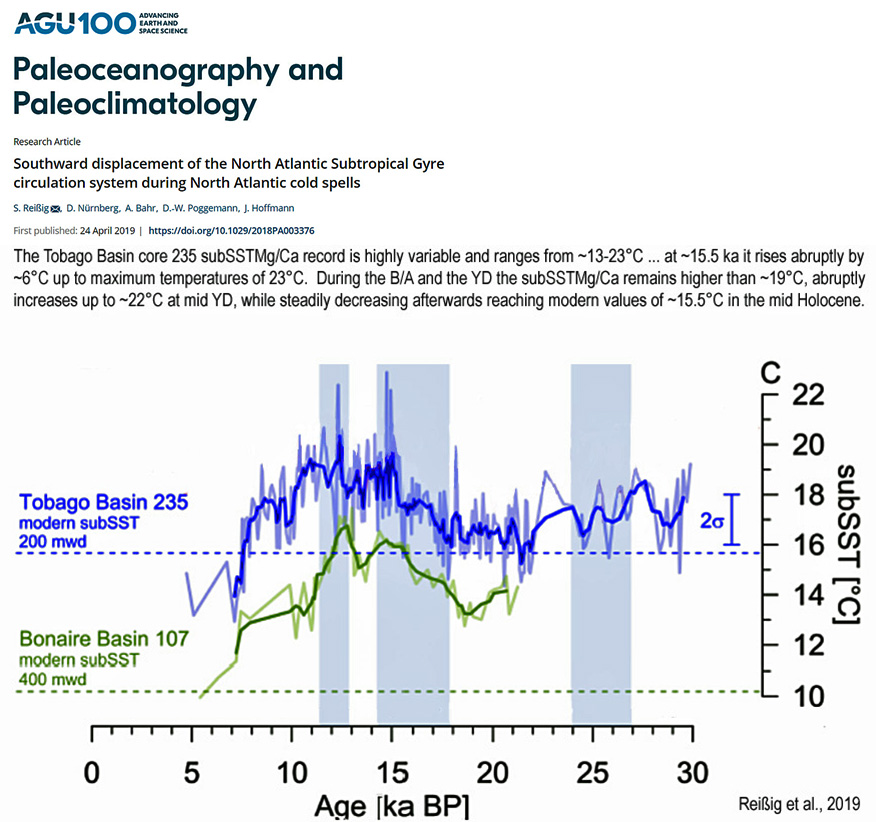
Yasuhara et al., 2019
“Our reconstructions reveal a series of multi-centennial-scale abrupt warming events likely caused by upper NADW reduction coinciding with deglacial and Holocene stadial events. Notably, we discovered pervasive Holocene upper NADW variability in the western North Atlantic for at least the past 4000 yr and perhaps throughout the Holocene. Bottom-water temperature at ODP Site 1055 (1798 m) averaged ~5 °C during the last glacial period, which is slightly (by 1 °C) warmer than present-day and late Holocene values of ~4 °C. During the last deglaciation, ODP 1055 BWT shows several warming events supported by multiple data points (apart from noisy, singlepoint excursions). During the Holocene, ODP 1055 BWT shows ±1–1.5 °C multi-centennial-scale variability. Evidence for warmer-than-present lastglacial BWT at 1800 m water depth is consistent with low-resolution depth transect reconstructions (Dwyer et al., 2000).”
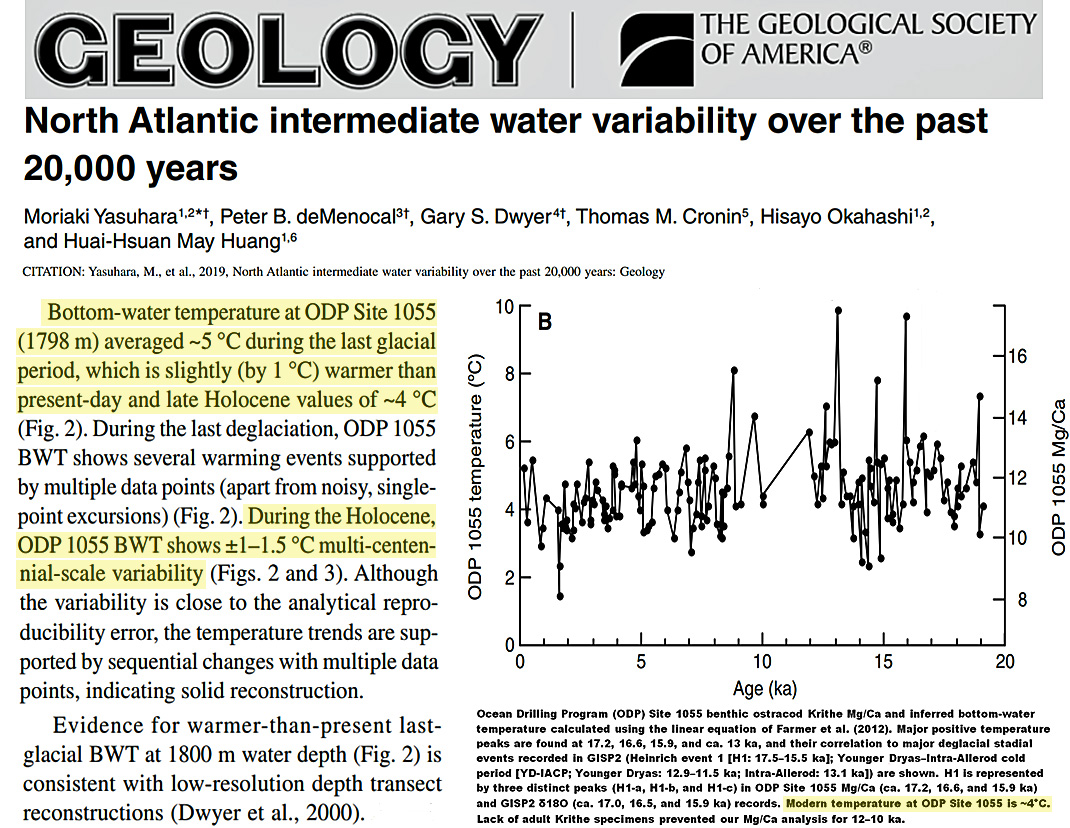
Colin et al., 2019
“The Holocene subpolar North Atlantic climate is characterized by an early to mid-Holocene “thermal maximum” followed byprogressive cooling induced by decreased insolation forcing (related to orbital precession) (e.g. Marchal et al., 2002; Sarnthein et al., 2003). This climatic cooling reflects a major reorganization of atmospheric and ocean circulation in the North Atlantic (e.g. O’Brien et al., 1995; Came and Oppo 2007; Repschlager et al., 2017). … The time interval from 1 to 0.68 ka BP, which is marked by a strong eastward extension of the SPG, has been associated with the warm Medieval Climatic Anomaly and a subsequent intensification of the surface limb of the AMOC (Copard et al., 2012; Wanamaker et al., 2012; Ortega et al., 2015) (Fig. 4). The westward contraction of the weak SPG observed thereafter (between 0.68 and 0.2 ka BP) is coeval with the cold period of the Little Ice Age and may be linked to reduced AMOC intensity.”
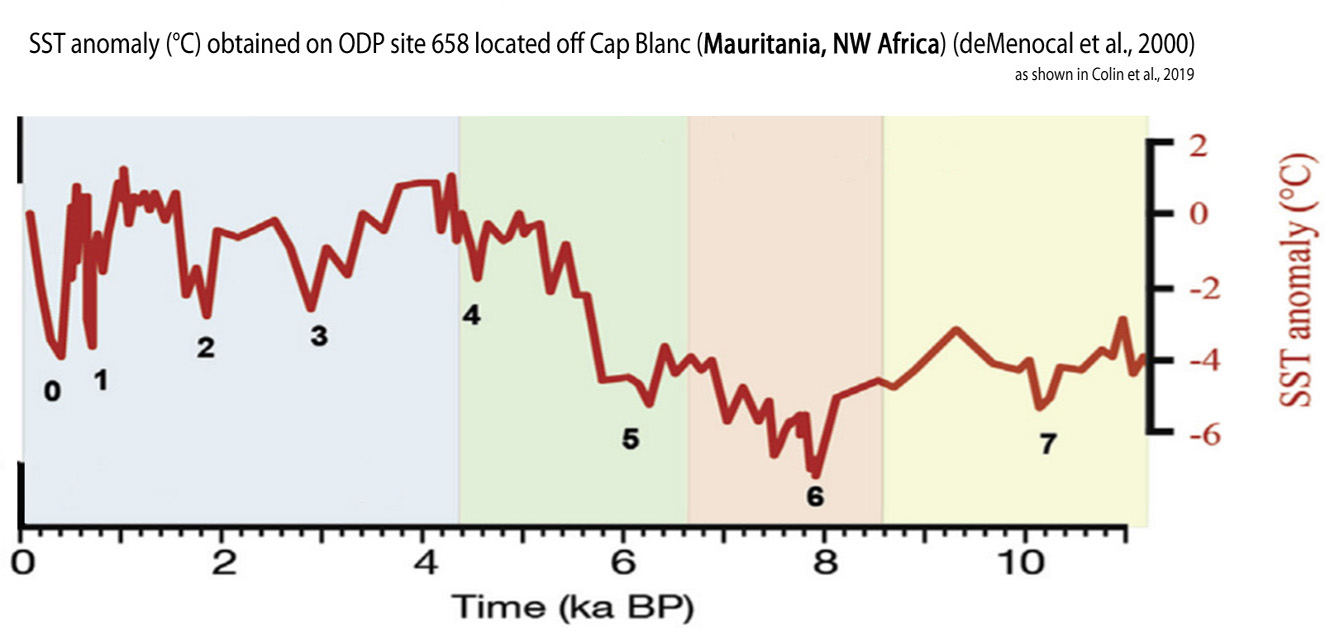
Schweinsberg et al., 2019
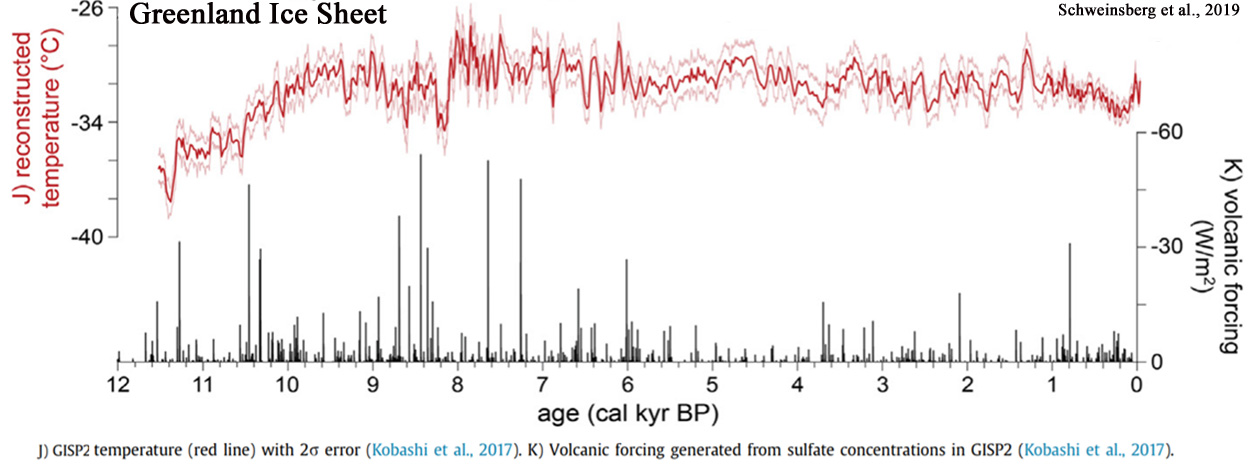
Adamson et al., 2019
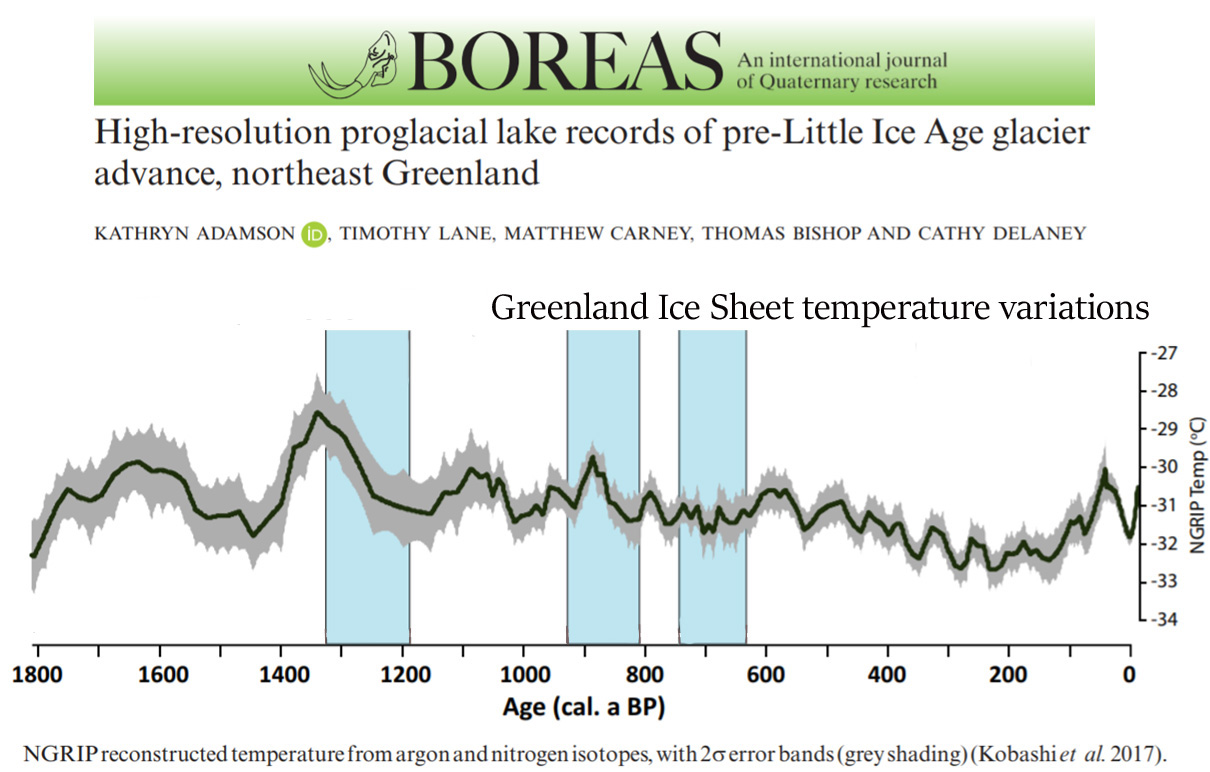
Wetterich et al., 2019 (NW Greenland)
“To reconstruct Holocene temperature changes, Lasher et al. (2017) employed δ18O of chironomid head capsules from Secret Lake in the Thule District as a proxy for the δ18O of precipitation, which is further related to surface air temperature. This proxy approach yields maximum estimates of Holocene temperature changes but is, as the study states, biased in summer and early autumn. The inferred summer season temperatures that were up to 4 °C warmer than today decreased from about 7.7 until about 2.3 ka cal BP before reaching colder than today temperatures, including the coldest period after about 1.2 ka cal BP (Lasher et al., 2017). The reconstructed period of decreasing summer temperatures covers the onset of permafrost aggradation at both sites, on Appat and at Annikitisoq, and likely relates to the dynamics of the NOW as reflected in sea surface temperature (SST), sea surface salinity (SSS), and sea ice cover (SIC) proxy data from marine sediments such as dinocyst records (Levac et al., 2001). After the breakup of perennial sea ice cover in the northern Baffin Bay around 10.5 ka cal BP, Holocene minima in SIC with up to 4–5 ice-free months per year occurred between about 7.4 and 4 ka cal BP accompanied by maxima in August SST and SSS (Levac et al., 2001).”
Bidauretta, 2019
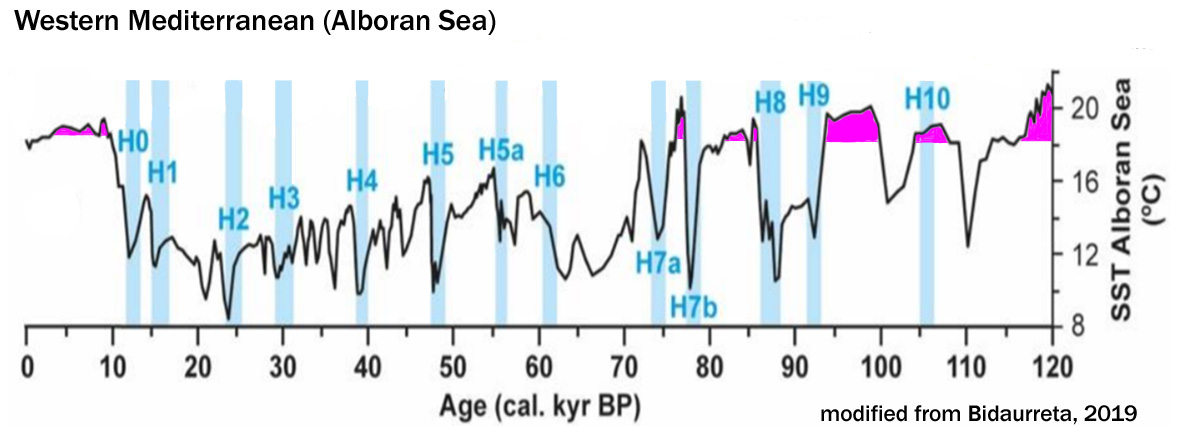
Xu et al., 2019
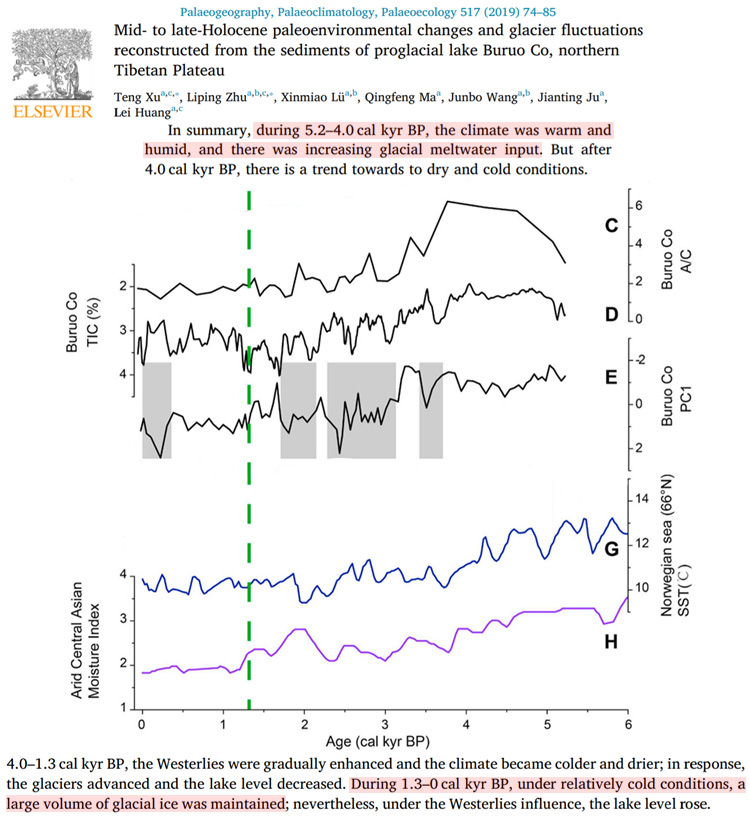
Gebbie and Huybers, 2019
“The ongoing deep Pacific is cooling, which revises Earth’s overall heat budget since 1750 downward by 35%. … In the deep Pacific, we find basin-wide cooling ranging from 0.02° to 0.08°C at depths between 1600 and 2800 m that is also statistically significant. The basic pattern of Atlantic warming and deep-Pacific cooling diagnosed from the observations is consistent with our model results, although the observations indicate stronger cooling trends in the Pacific. …. At depths below 2000 m, the Atlantic warms at an average rate of 0.1°C over the past century, whereas the deep Pacific cools by 0.02°C over the past century. … These basin-wide average trends are used to relax the assumption of globally uniform changes in surface conditions and to constrain regional temperature histories for 14 distinct regions over the Common Era by a control theory method. The result, referred to as OPT-0015, fits the observed vertical structure of Pacific cooling and Atlantic warming. Global surface changes still explain the basic Atlantic-Pacific difference in OPT-0015, but greater Southern Ocean cooling between 600 and 1600 CE leads to greater rates of cooling in the deep Pacific over recent centuries.”
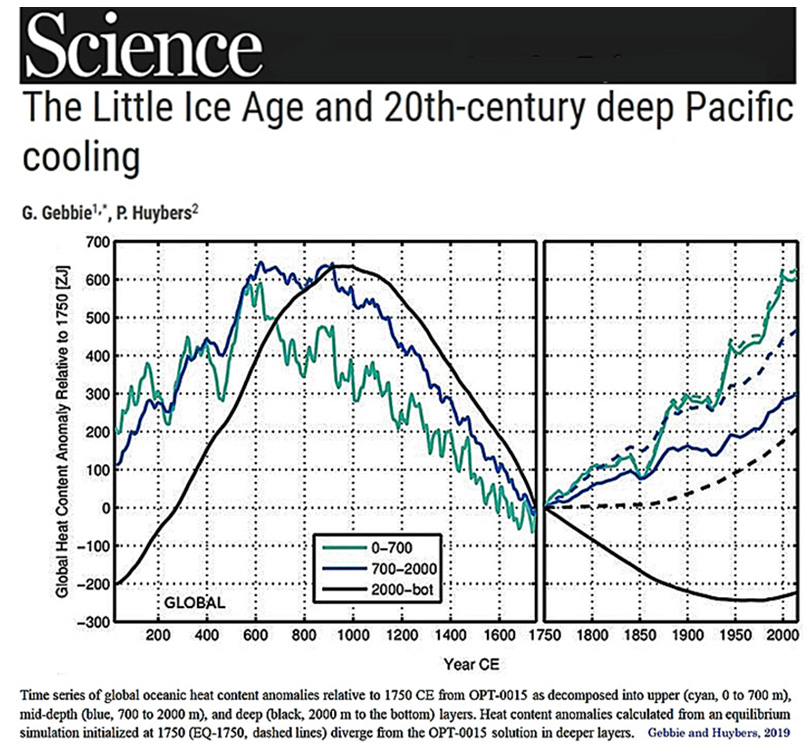
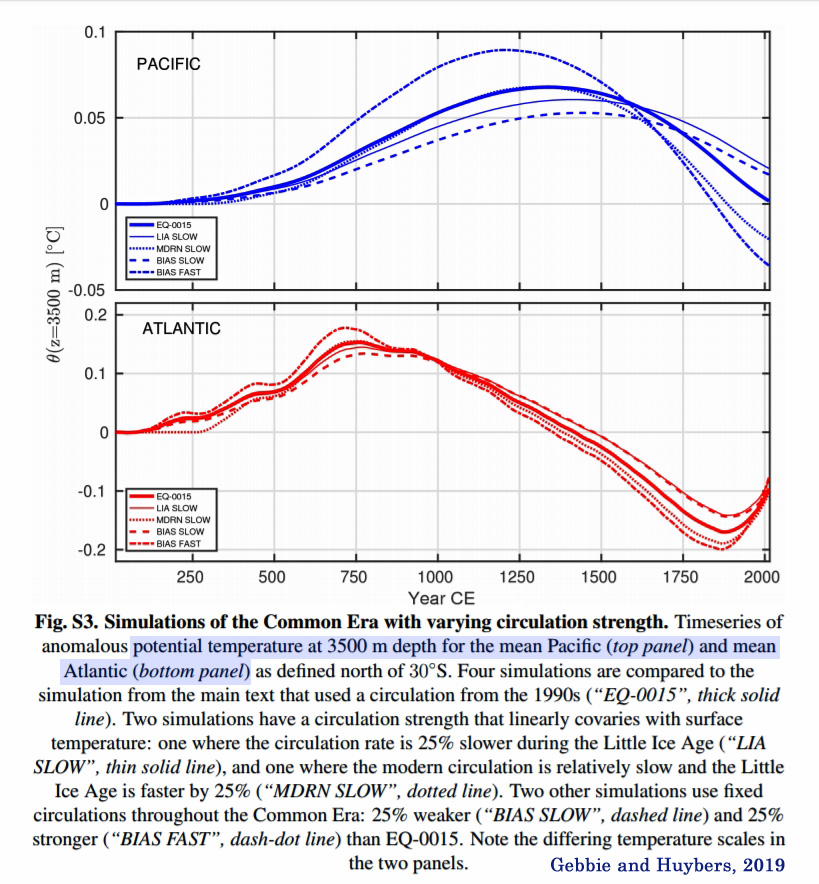
Image Source: Supplemental Data (Gebbie and Huybers, 2019)
Svare, 2019 (Northern Europe)
“Seppä et al. (2008) set the summer temperature maximum in the northern European tree-line region to ca. 7500-6500 cal. yrs BP (ca. 1.5°C higher than present), similar to the Dovre area (Paus et al., 2011). Further, Bjune et al., (2005) found the HTM to last from ca. 8000 to 4000 cal. yrs BP in Western Norway, with temperatures reaching 12-13°C. … The early establishment of pine-forests in the area surrounding both study sites from ca. 9600 cal. yrs BP give evidence of local mean July temperatures of at least 11°C ca. 9600-8200 cal. yrs BP, 0.8-1.1°C warmer than present. From ca. 8200 cal. yrs BP until present day the July mean temperature has presumably been around 8-10°C.”
Recent (20th-21st Century) Cooling/Non-Warming
Sae-Lim et al., 2019
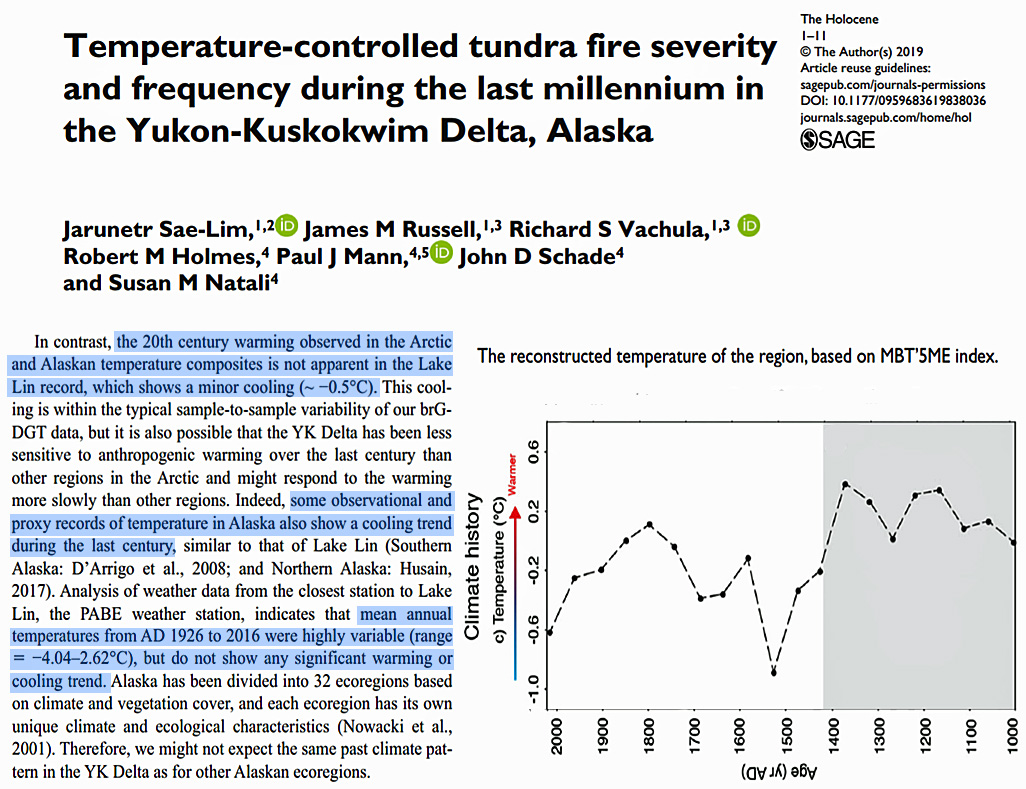
Klippel et al., 2019
“[A]n analysis of instrumental temperatures for the period 1955–2013 shows that in northwestern Greece, statistically significant trends in summer temperature are absent (Feidas, 2016). The cooling trend from 1950–1976, previously reported throughout the Mediterranean basin, was followed by an, so far, insignificant warming (Piervitali et al., 1997; del Río et al., 2011). Our reconstruction mirrors this absence of a clear positive trend at decadal scale. … In total, 110 cold and 48 warm extremes appear in the 100SP reconstruction, and 105 cold and 57 warm extremes in the 10SP reconstruction (Figure 5 and Table S1). The year 1240 was the warmest summer, with reconstructed anomalies of +3.13 °C and +2.64 °C in the 100SP and 10SP reconstructions, respectively. The two coldest summers in the 100SP reconstruction are 1217 and 1884 with anomalies of –3.71 °C and –3.61 °C, respectively. The two coldest summers in the 10SP reconstruction occurred in different years, 1035 and 1117, with anomalies of –3.11 °C and -3.14°C, respectively. The third coldest summer in the 100SP and fourth coldest summer in the 10SP reconstructions, is 1959, which is the second coldest year in the instrumental EOBS v.15 record. The coldest decade is 1811–1820 (–0.73°C) and the warmest decade 1481–1490 (+0.88°C; calculated only for 100SP reconstruction). The elimination of decadal trends in the 10SP reconstruction causes events to appear more evenly distributed. However, over the past 450 years the occurrence of warm temperature extremes is substantially less frequent compared to preceding centuries.”
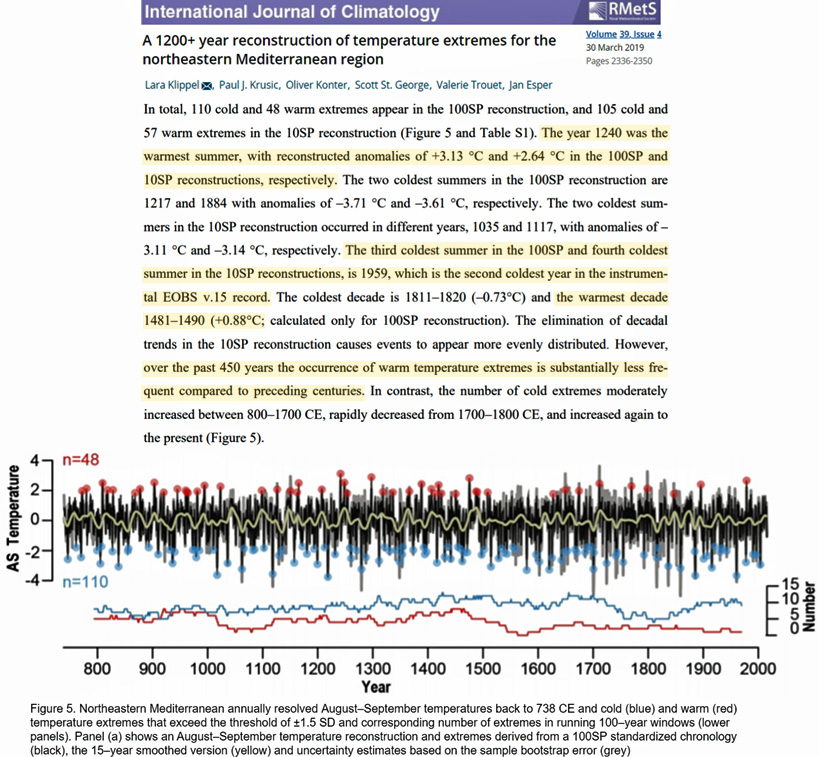
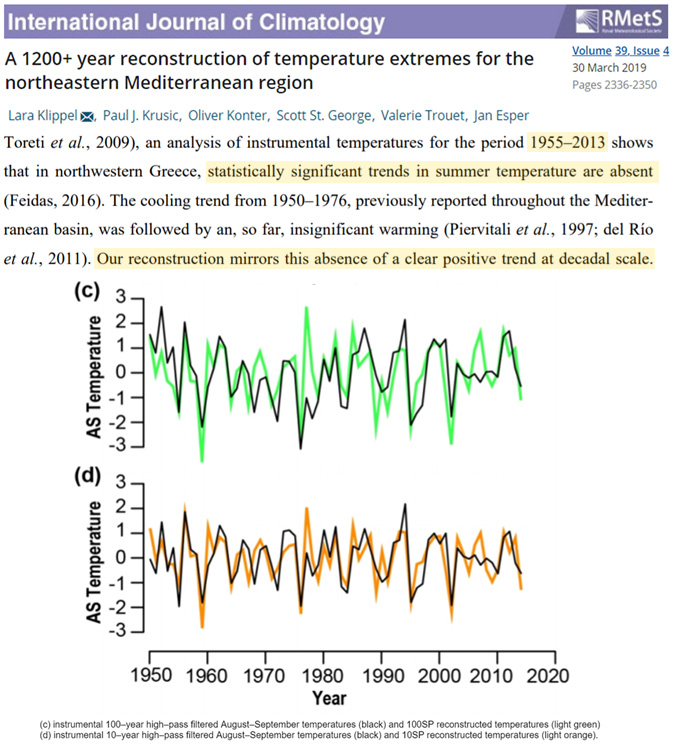
Borgaonkar, 2019
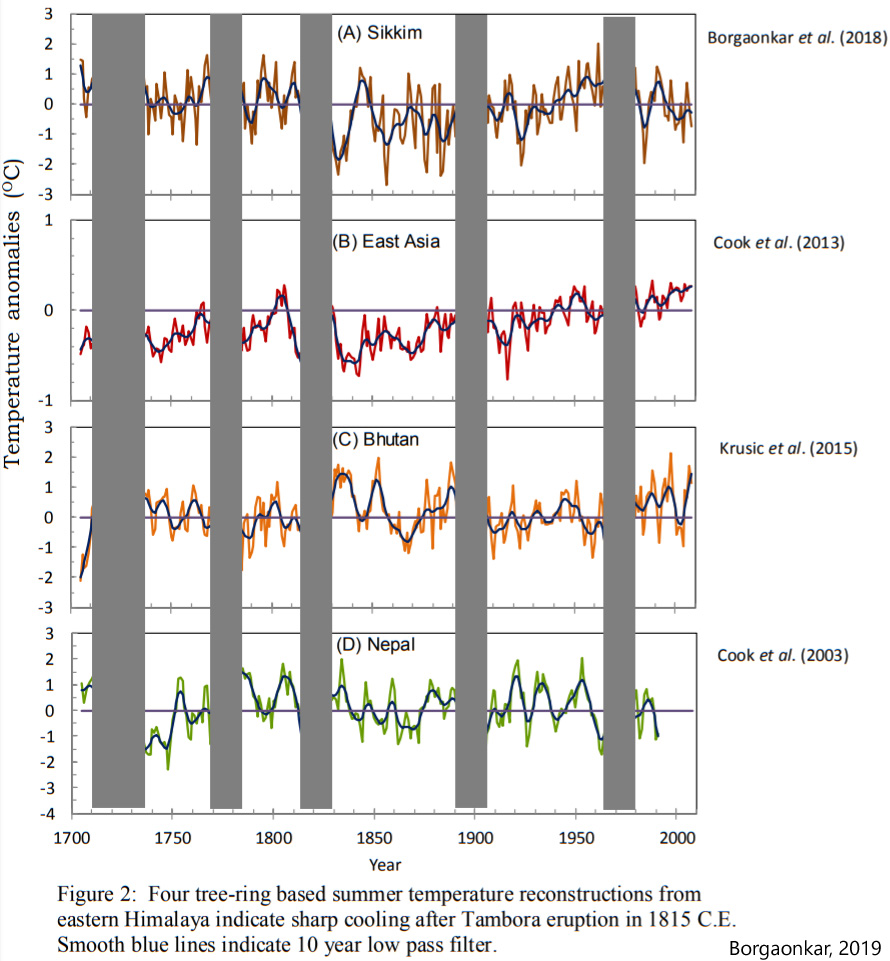
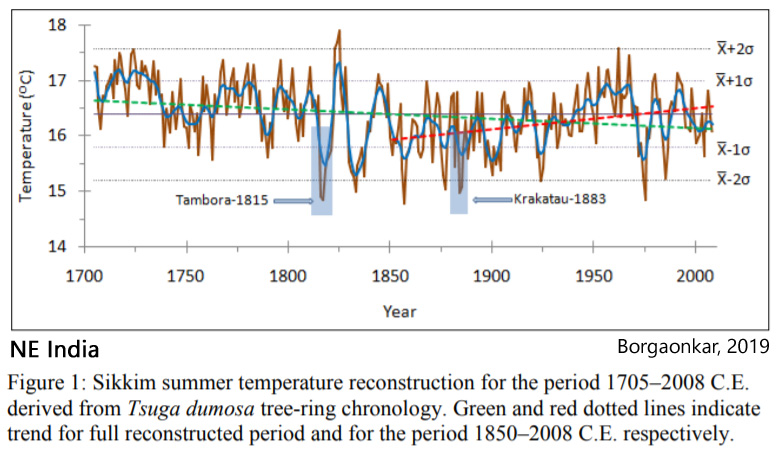
Ruan et al., 2019
“Decelerated Greenland Ice Sheet Melt Driven by Positive Summer North Atlantic Oscillation … The GrIS lost mass at a rate of about -102 Gt/yr in early 2003, increased to -393 Gt/yr during 2012-2013, but suddenly reduced to no more than 75 Gt/yr during 2013-2014 (Bevis et al., 2019). It is suggested that this deceleration is due to the increased snowfall accumulation driven by the positive phase of summer North Atlantic Oscillation (sNAO; Folland et al., 2009; Chen et al., 2015). … It is shown that the deceleration of GrIS melting since 2013 is due to the reduction in short-wave solar radiation in the presence of increasing total cloud cover, which is driven by a more persistent positive summer North Atlantic Oscillation (sNAO) on the decadal time scale. … The lower SLP over Greenland is also consistent with the dramatic cooling of the northern North Atlantic Ocean during the same period. On the surface, the mean summer sea surface temperature (SST) in the North Atlantic subpolar gyre is more than 2ºC colder than the SST during 2003-2013; in the upper 300m, the volume mean ocean temperature is nearly 1.6ºC less (Fig. 6). The cooling of the ocean is not only helpful for the atmospheric configuration over the Greenland, but also favorable for the reduction of mass loss due to warmer water intrusion into the marine-terminated glaciers, though the latter process explains only around 30-50 Gt of the total mass budget of the GrIS (Zwally et al., 2002; Box et al., 2009; Tedstone et al., 2013).”
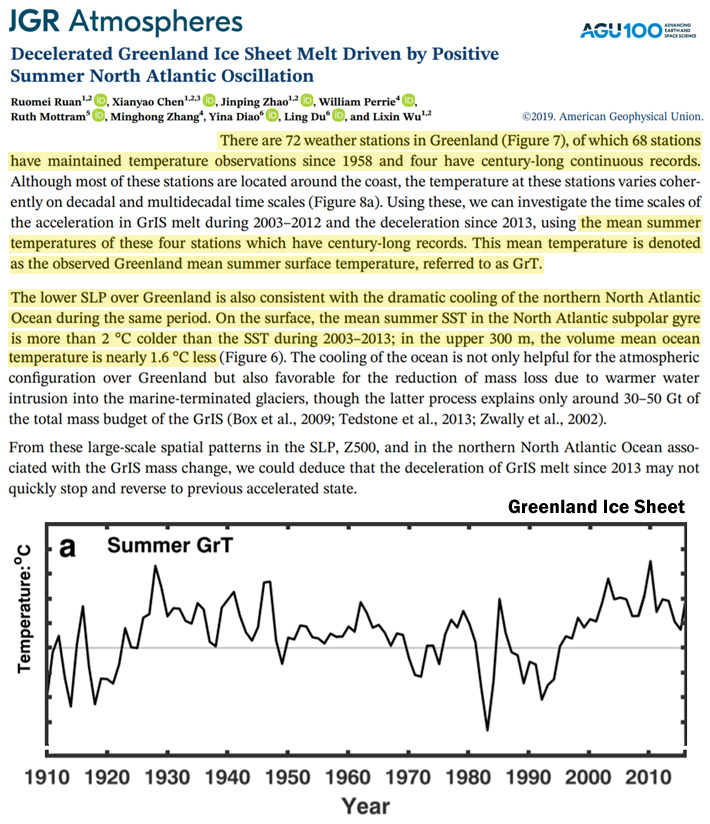
Caron et al., 2019
“Subzone 3b (2100 cal a BP to present; 45–0 cm) is characterized by the maximum abundance of I. minutum (up to 48%) and by increasing abundance of E. karaense, Polykrikos var. Arctic and cysts of P. dalei (Fig. 5). Sea‐surface reconstructions reveal a slight increase in SIC and a slight decrease in SST and primary productivity during this period. … In the Kane Basin, this transition toward interglacial conditions is also marked by the increase of accompanying autotrophic species O. centrocarpum and S. elongatus from 7880 to 7200 cal a BP, although the assemblage is still dominated by heterotrophic taxa. This suggests warmer sea‐surface conditions, which nonetheless remained relatively cold with an extended SIC, as expected considering the presence of the strong cold Arctic current flowing southward in the basin (Münchow et al., 2006). This is coherent with Levac et al. (2001), who suggest sea‐surface temperatures up to 3°C higher than at present as early as 7800 14C a BP (~8000 cal a BP) in Smith Sound.”
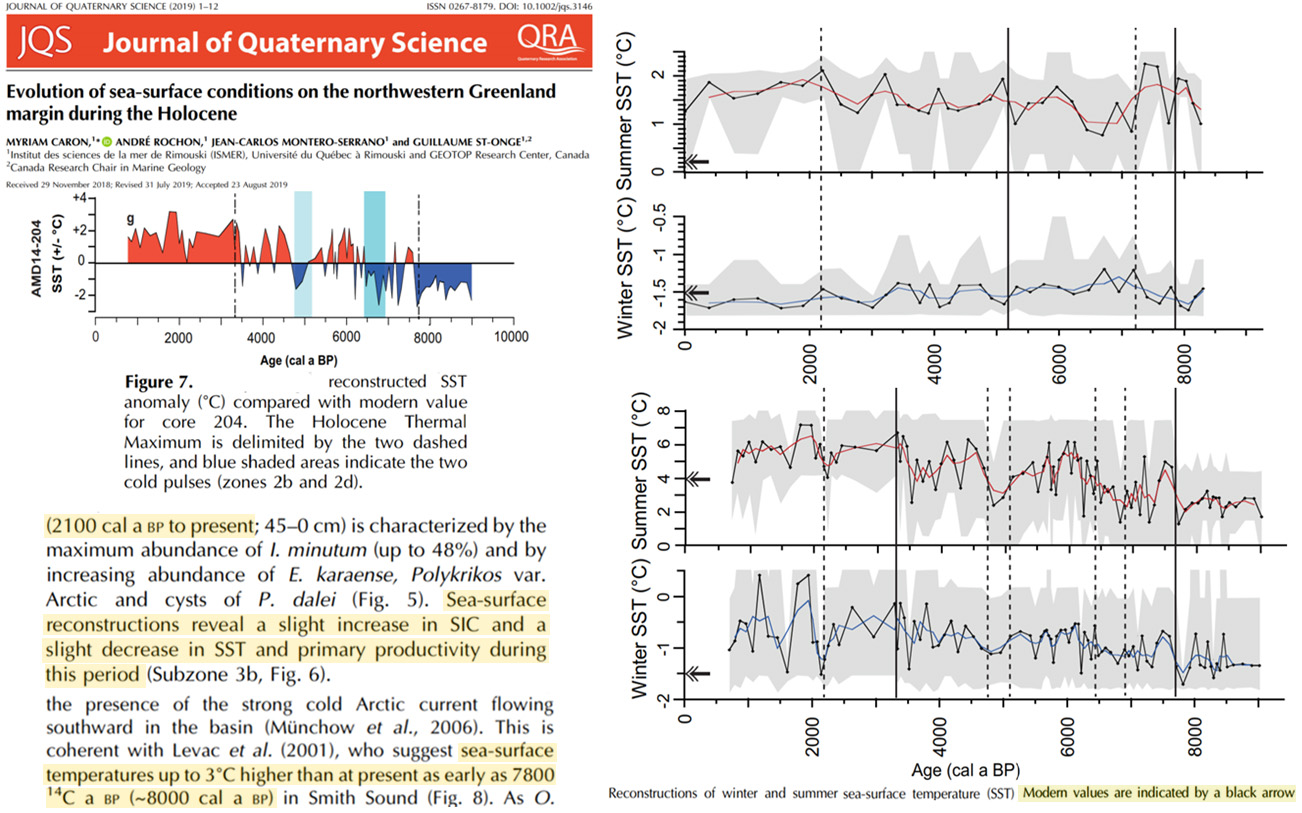
Nath and Luo, 2019
“Using the Community Earth System Model (CESM)-Large Ensemble (LE) surface air temperature (SAT) data, we investigate the multidecadal changes in SAT variability over Central Indian landmass, particularly the Indo-Gangetic (IG) river basin. This region comes under the active influence of the Indian summer monsoon, and during the summer monsoon months (JJA), we observe an amplified cooling (< − 3 °C) trend (1961–2000) in SAT. This SAT trend is considered as a superposition of external forcings and natural climatic variability. The forced response is computed by averaging the trend in 35 ensemble members, which displays a moderate cooling trend due to aerosol-, ozone-, and volcano-only forcings. But the internal variability introduces a wide range of uncertainties in SAT, with majority of the members display a strong cooling trend in the Central Indian region. During the entire period, natural climatic variability dominates over the forced response, which strongly overrides the greenhouse gas (GHG) warming. Here, we separate out the influence of global climate variability on regional climate variability and identify the specific internal variability which is responsible for the multidecadal cooling trend in the analyzed region.”
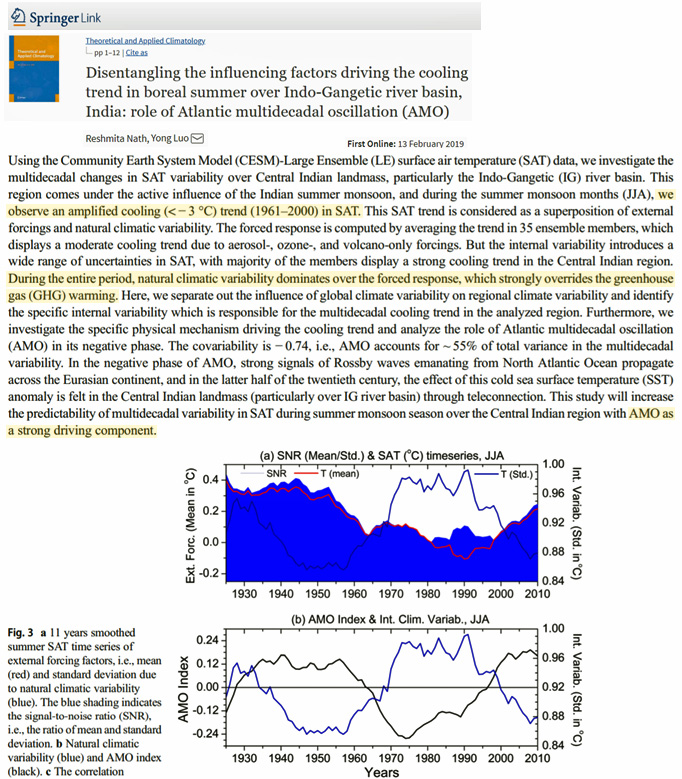
Toomey et al., 2019
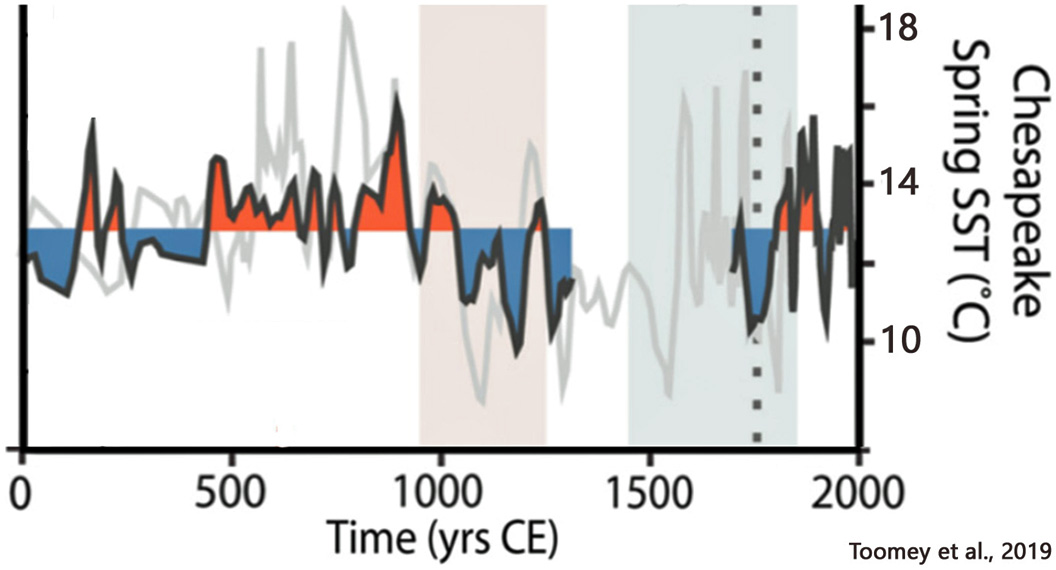
Caillouet et al., 2019
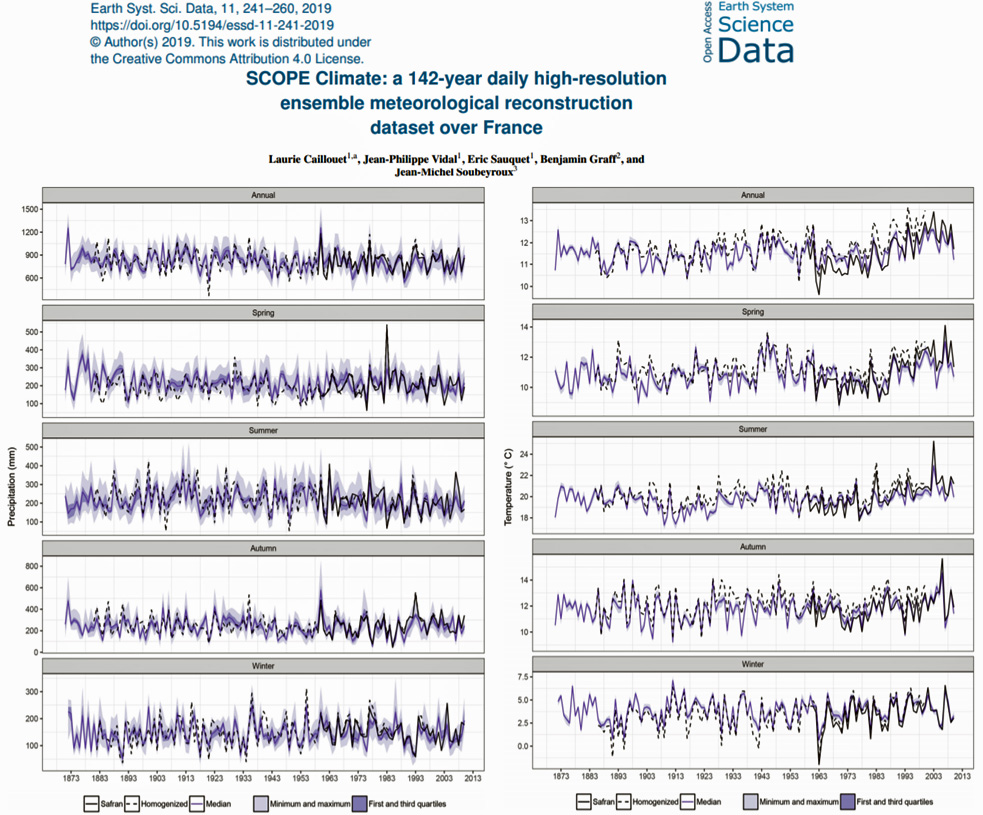
Booker et al., 2019
“Warm Period 1 (~1924–2006 CE) was characterized by Tcal from 23 to 34°C (average 28.3 ± 0.96 °C), which is similar to the current seawater temperature for Grand Cayman and significantly warmer than CP 2. During this period there were two warm intervals (WI 2: ~1924–1932, WI 3: ~1972–1993) and two cool intervals (CI 3: ~1960–1972, CI 4: ~1993–2006). The warm intervals are characterized by an increase in Tcal of ~5–7 °C. The cool intervals are characterized by a decrease of ~4–5 °C. … • Mild Period 1 (~2006–2014 CE) was characterized by Tcal of 25 to 33 °C (average 27.5 ± 0.96 °C) which is similar to the current average seawater temperature for Grand Cayman (t-test: p b 0.01; Fig. 14).”
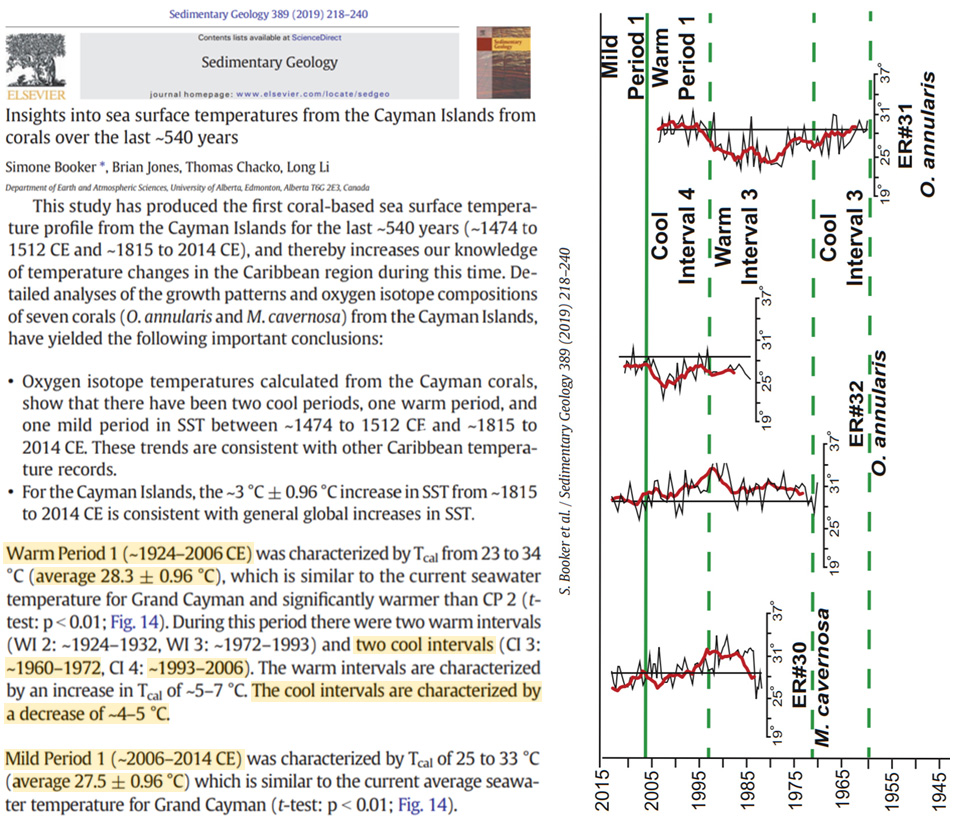
Campbell, 2019
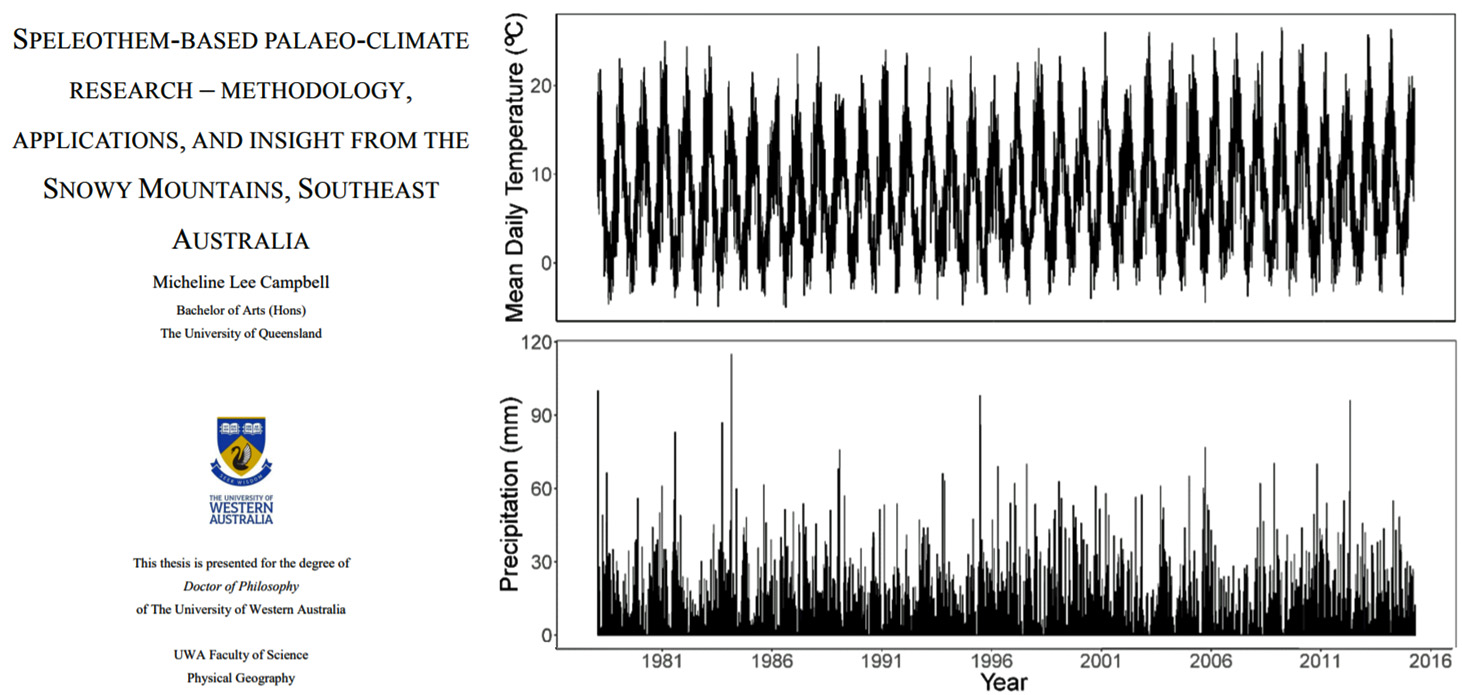
Fröb et al., 2019
“The container vessel M/V Nuka Arctica, owned by Royal Arctic Line, operates between Ilulissaat, Greenland and Aalborg, Denmark. … The SST measurements on Nuka Arctica show a substantial cooling during winters between 2004 and 2017 (Figures 2c and S6). From the IRM-W through the ICE-W box, the SST trend varies between -0.084±0.020 and -0.096±0.018 ◦C yr−1. Towards the east, thecooling is less pronounced, and in the FB box, the SST trend is only -0.045±0.016 ◦C yr−1. Averaged over all boxes, SST decreased by 0.78±0.19◦C per decade.”
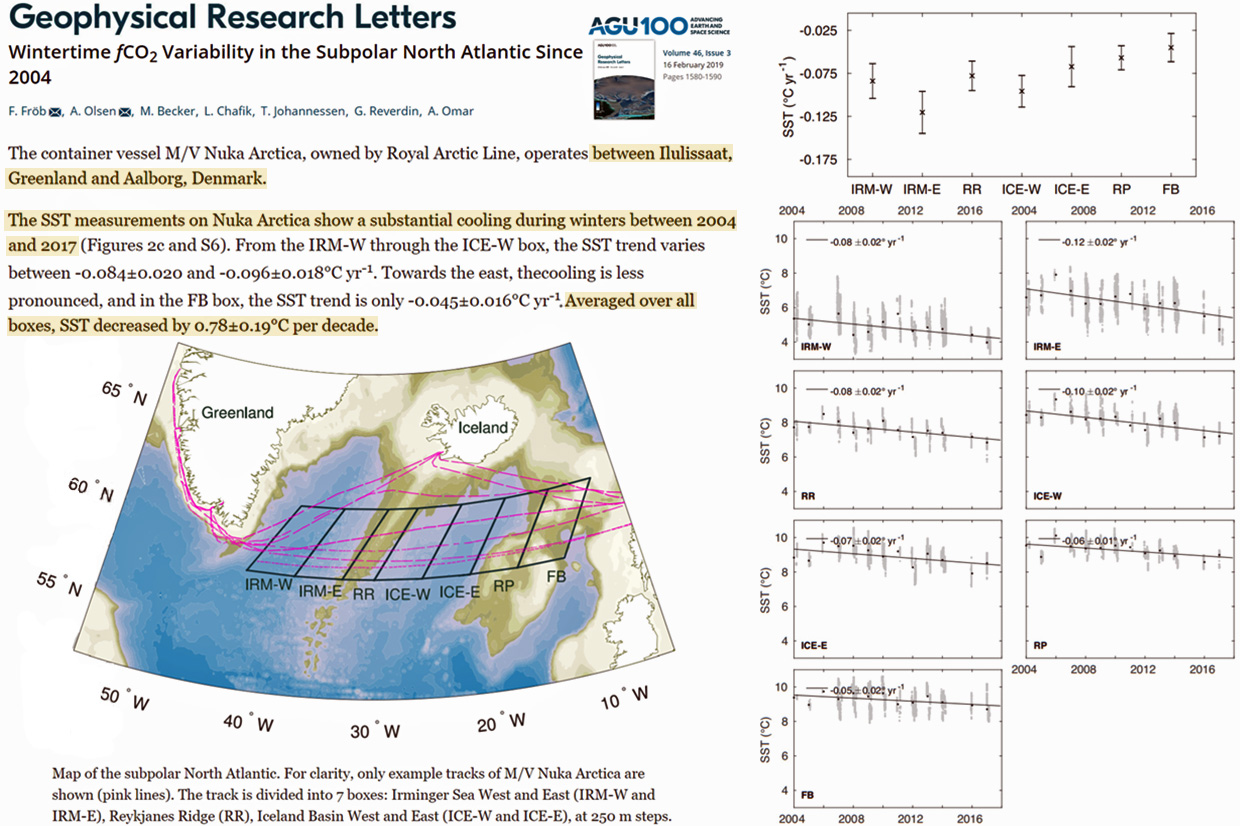
Watanabe et al., 2019
“[P]revious studies have observed that global surface air-temperatures remained relatively constant between the late-1990s and 2015, although climate models predicted continued anthropogenic warming. This so-called global-warming hiatus has received considerable attention [Kosaka et al., 2013]. Satellite-based SST data suggest that the main cause of the global-warming hiatus is the Interdecadal Pacific Oscillation (IPO), which is the dominant mode of atmosphere-ocean interactions in the subtropical Pacific. The IPO reversed from a positive to a negative phase in the late 1990s, i.e. the timing of the IPO phase change coincides with the onset of the global-warming hiatus. The negative IPO led to anomalous cooling in the eastern Pacific and this is thought to be a major cause of the global-warming hiatus. … The 26-year SSTanom record shows a significant regime shift in October 1996 (peak: 0.202; P < 0.01: Fig. 2b). The mean (range) of SSTanom is 0.73 ± 2.59 °C (10.96 °C) before 1996 and −0.46 ± 2.71 °C (11.72 °C) after 1996 (Fig. 2b). SST anom (δ18OSW-anom) shows a gradual cooling (decrease) over the past-26 years (−0.03 ± 0.01 °C/year and −0.02 ± 0.00‰VSMOW/year, respectively).”
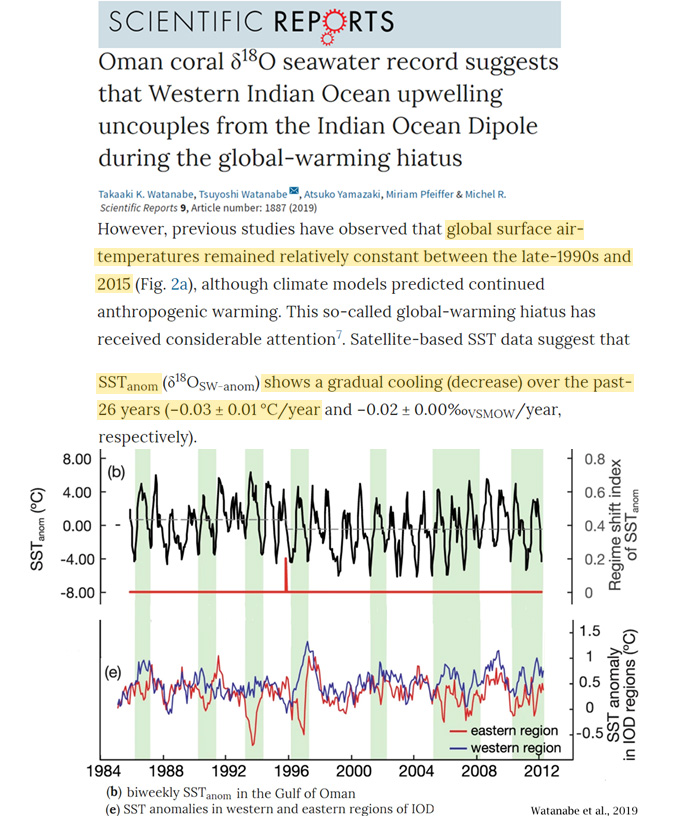
Chen and Luo, 2019
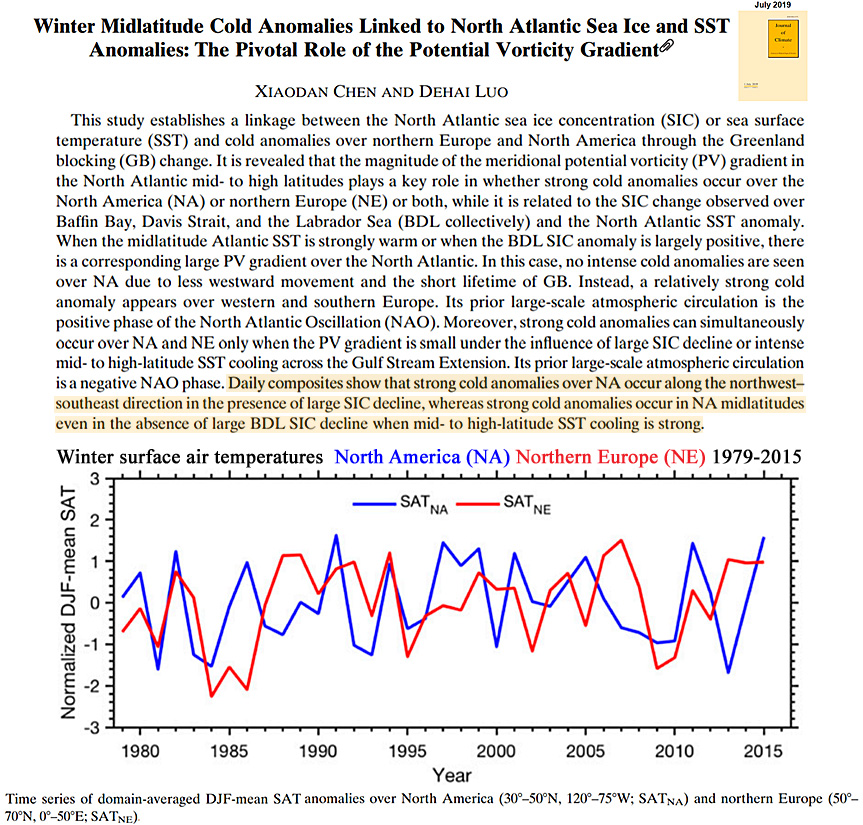
Buckley et al., 2019
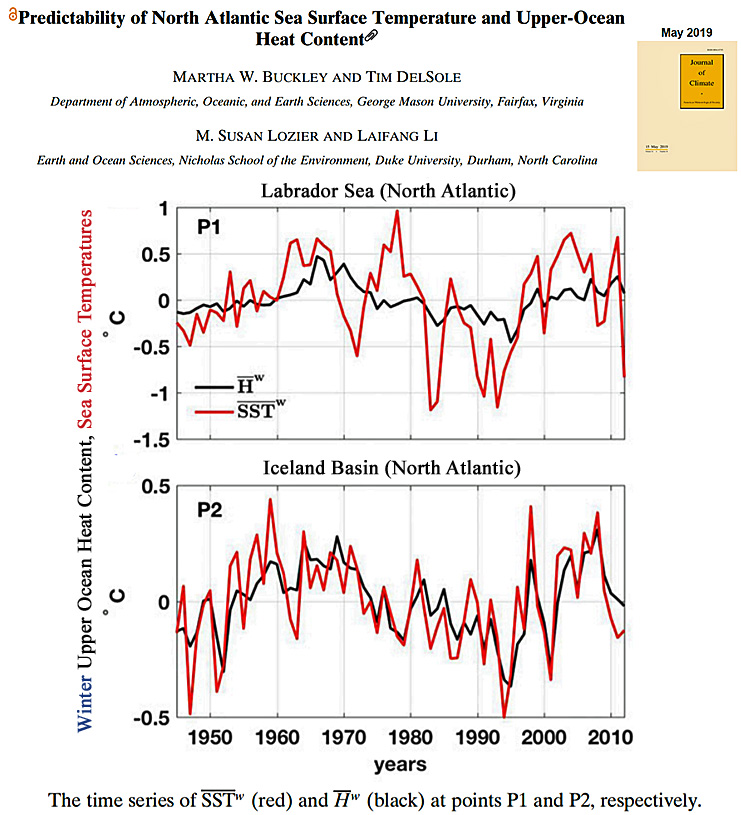
Li and Luo, 2019 (Eurasia)
“The surface air temperature over the Eurasian continent has exhibited a significant cooling trend in recent decades (1990–2013), which has occurred simultaneously with Arctic warming and Arctic sea ice loss. While many studies demonstrated that midlatitude cold extremes are linked to Arctic warming and Arctic sea ice loss, some studies suggest that they are unrelated. The causal relationship between midlatitude cold extremes and Arctic change is uncertain, and it is thus an unsolved and difficult issue. … Arctic warming or sea ice decline is not necessary for the occurrence of midlatitude cold extremes.”
Holme et al., 2019
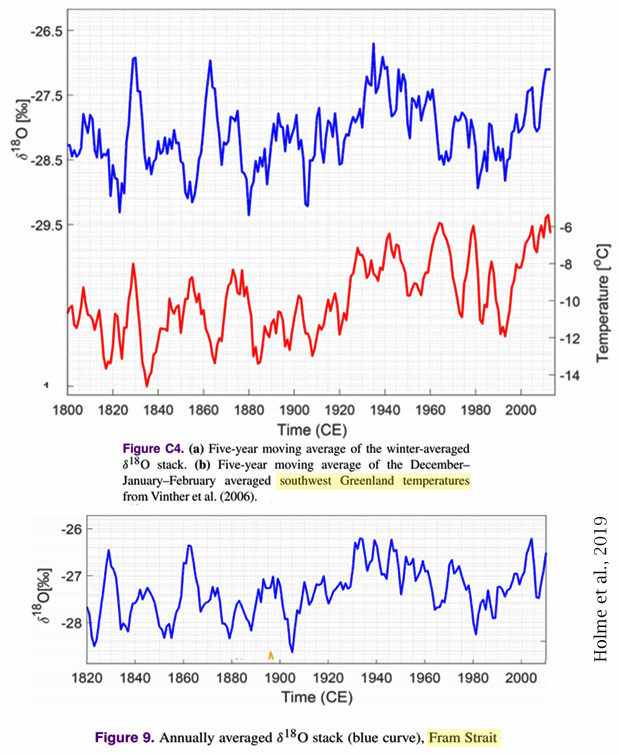
He et al., 2019
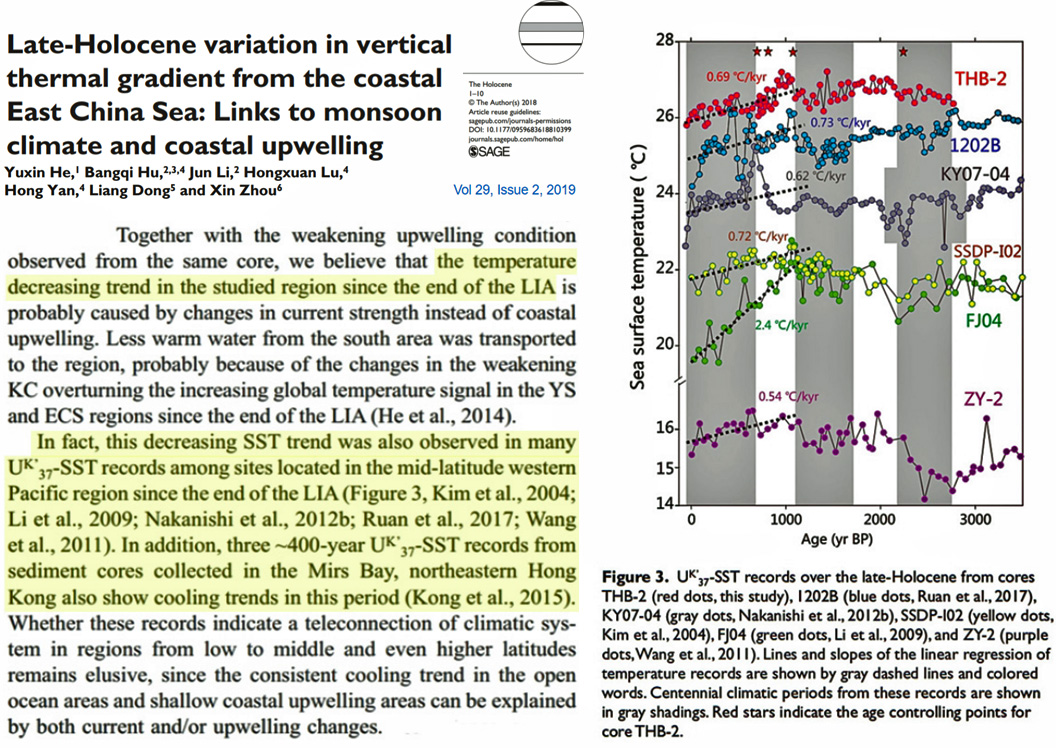
Lasher and Axford, 2019 (South Greenland)
“More positive δ18O values are found between 900 and 1400 CE, indicating a period of warmth in South Greenland superimposed on late Holocene insolation-forced Neoglacial cooling, and thus not supporting a positive NAO anomaly during the MCA. Highly variable δ18O values record an unstable climate at the end of the MCA, preceding Norse abandonment of Greenland. The spatial pattern of paleoclimate in this region supports proposals that North Atlantic subpolar ocean currents modulated South Greenland’s climate over the past 3000 yr, particularly during the MCA. Terrestrial climate in the Labrador Sea and Baffin Bay regions may be spatially heterogeneous on centennial time scales due in part to the influence of the subpolar gyre.”
Zhang et al., 2019
“In core 31003, the SST record shows a distinctly anti-phase relationship with that of core 38002 over the last millennium. For instance, from the MWP to LIA, SST values increased from ∼17.0 ± 0.3°C to ∼19.1 ± 0.6°C in the northern core 38002 but decreased from ∼24.3 ± 0.4°C to ∼23.5 ± 0.3°C in the southern coastal core 31003. Since ∼1850 AD, the SST record in core 31003 elevated within the range of 24.3 ± 0.4°C, similar to values during the MWP, but decreased gradually to ∼18.0°C in core 38002, in line with the SST trends at two additional locations from the YSWC [Yellow Sea Warm Current] pathway as reported by He et al. (2014).”
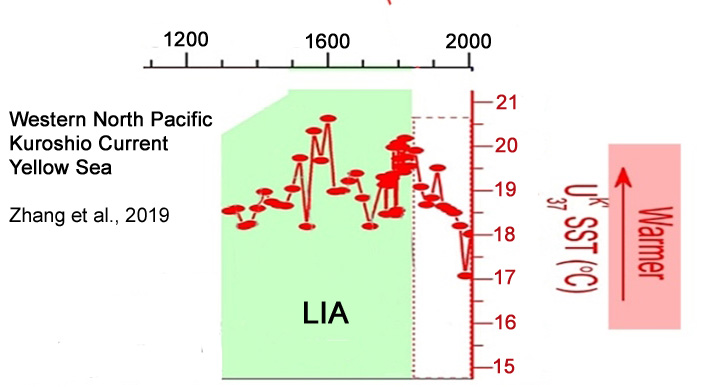
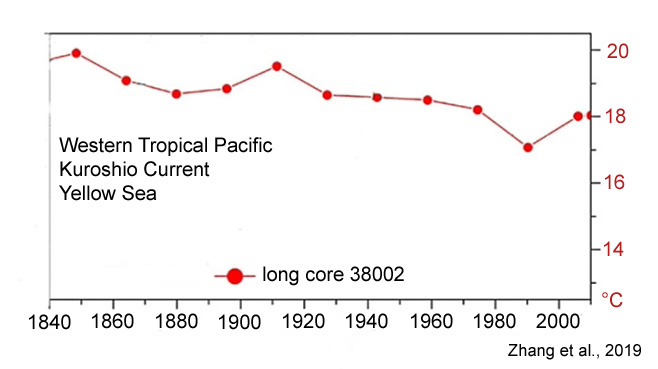
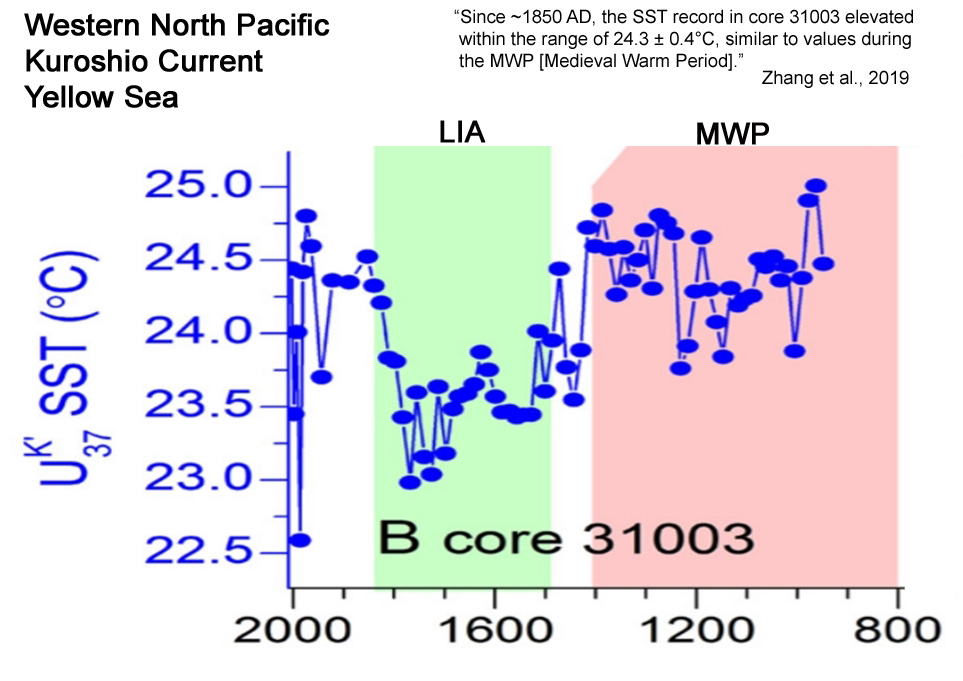
Gräwe et al., 2019
“MSLR [mean sea level rise] (corrected for the relative sea level contribution from GIA) in the Baltic Sea has been estimated by 2.08 ± 0.49 mm yr−1 over the period 1950–2015. This value is slightly larger than the simultaneous global mean of 1.63 ± 0.32 mm yr−1 (Dangendorf et al. 2017), as well as the adjacent southeastern North Sea (1.94 ± 0.36 mm yr−1 over 1940–2008; Albrecht et al. 2011).”
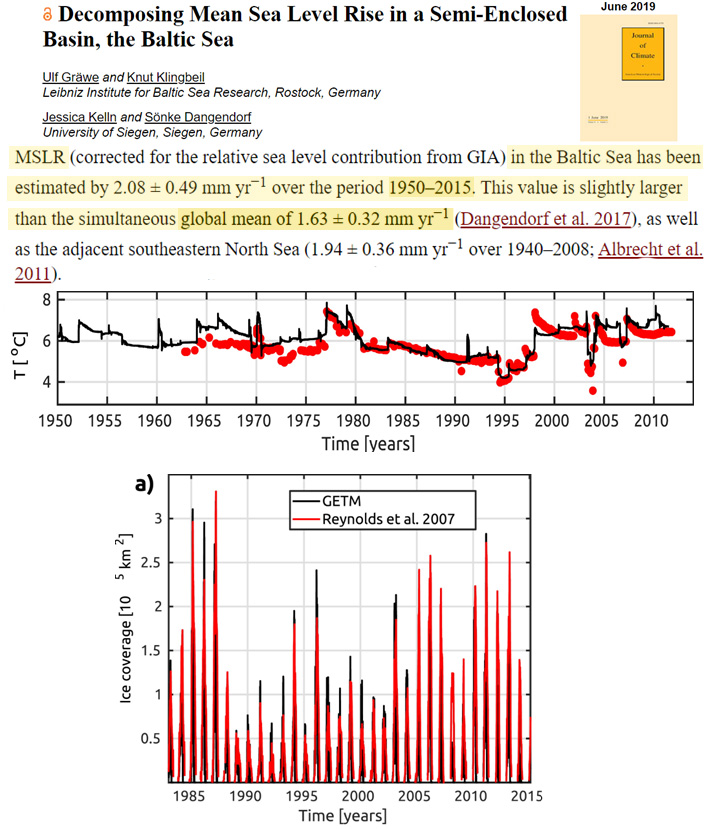
Porter et al., 2019
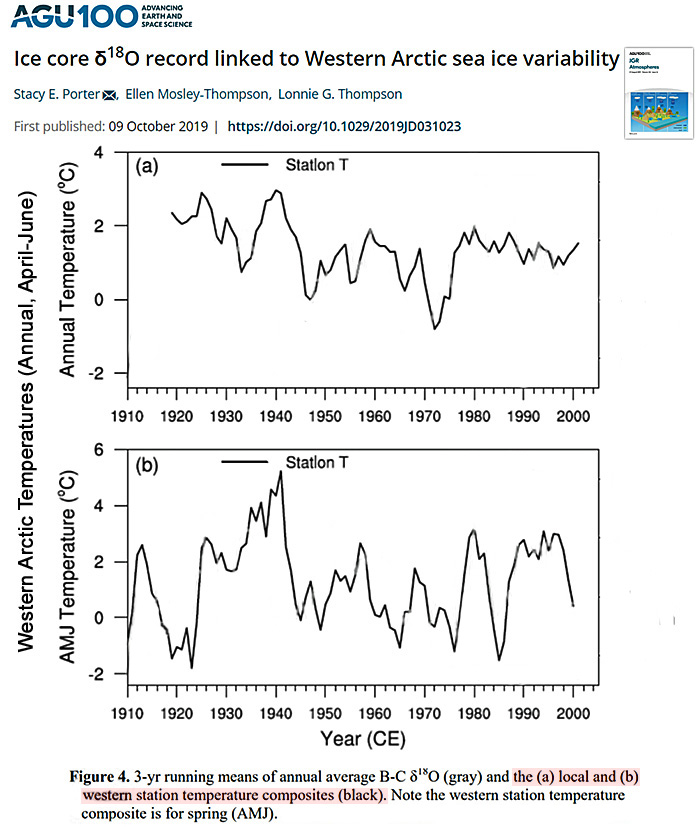
Byambaa et al., 2019
“[T]he recent cool-moist period from 1985 to 2000 has been related to the Arctic Oscillation (this study, Robock, 1984, He et al., 2017). The recent cooling could have been caused by volcanic aerosols of the El Chichón eruption (VEI5, 1982) in Southern Mexico, which impacted atmospheric wind patterns, including a positive phase of the Arctic Oscillation (Robock, 1984). No large volcanic-induced cooling was observed at this time due to the simultaneous warming ocean temperature caused by El-Niño (Robock, 2002). During this recent cool-moist period, ice mass accumulation of the glaciers in the Russian Altai Mountains was observed and Narozhniy and Zemtsov (2011) connected this phenomenon to annual precipitation increased by 8% – 10% especially in winter and spring (April-May) as a result of a strengthening of the zonal circulation over the Altai Mountains.”
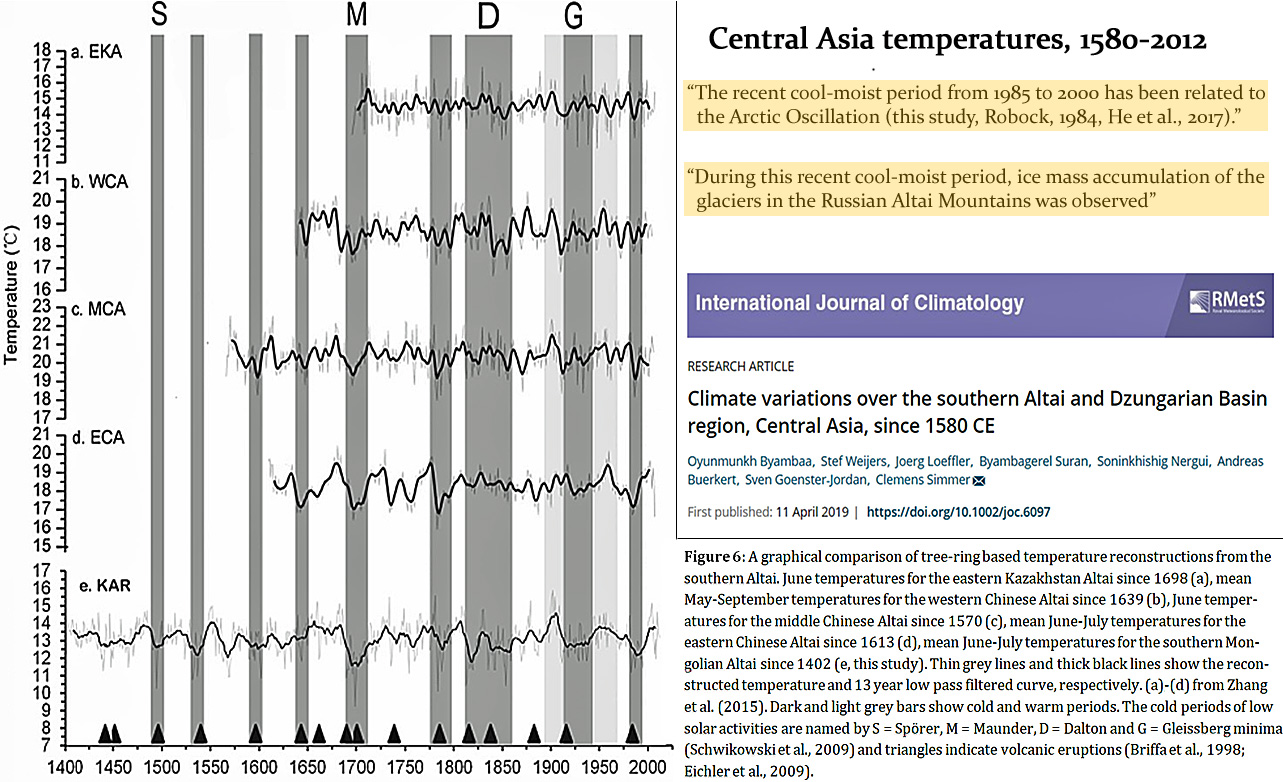
Araźny et al., 2019
“Air temperature in 1899–1914 during three expeditions was 1.8–4.6 °C lower than the modern period in winter (Oct–Apr). However, during the 1930/31 expedition it was 4.6 °C warmer than the years 1981–2010. Our results relate to what has been called the ‘1930s warming’, referred to by various authors in the literature as the ETCW or the ETCAW. … In individual months, the highest negative anomalies were identified in Calm Bay (hereafter CB) in January 1914 (− 7.4 °C) and in February 1900 (− 6.8 °C). In contrast, during the 1930/31 expedition, it was 4.6 °C warmer than the present day in CB [Calm Bay]. Such a high thermal anomaly was influenced by a warm autumn and winter, especially February 1931, when the average monthly temperature was 10.7 °C higher than in the modern period.”
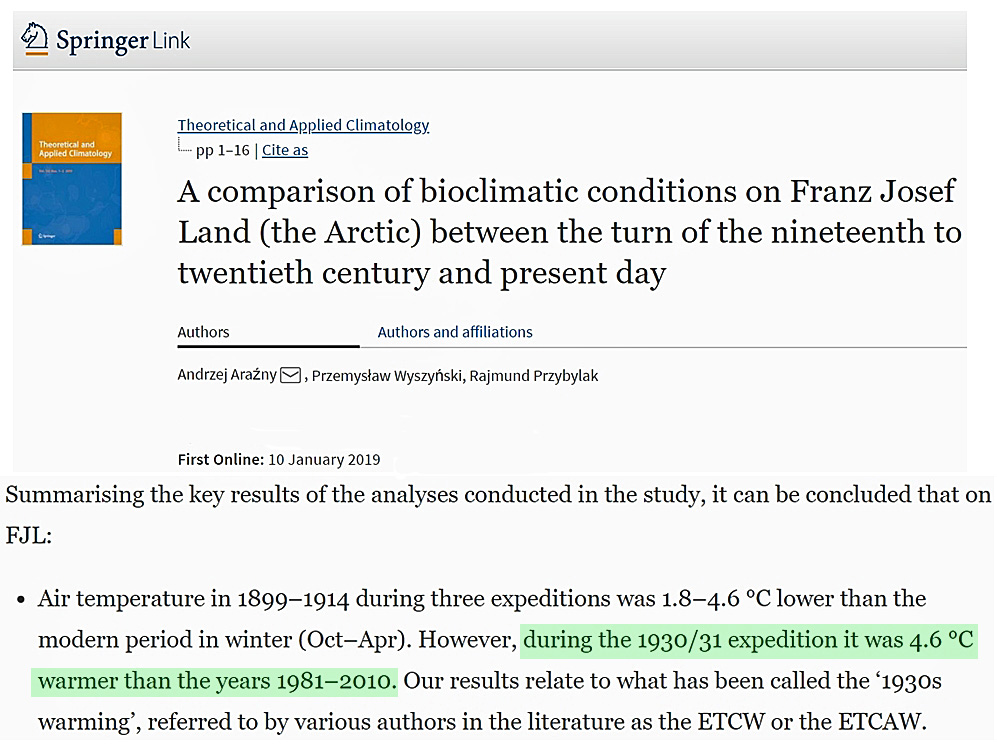
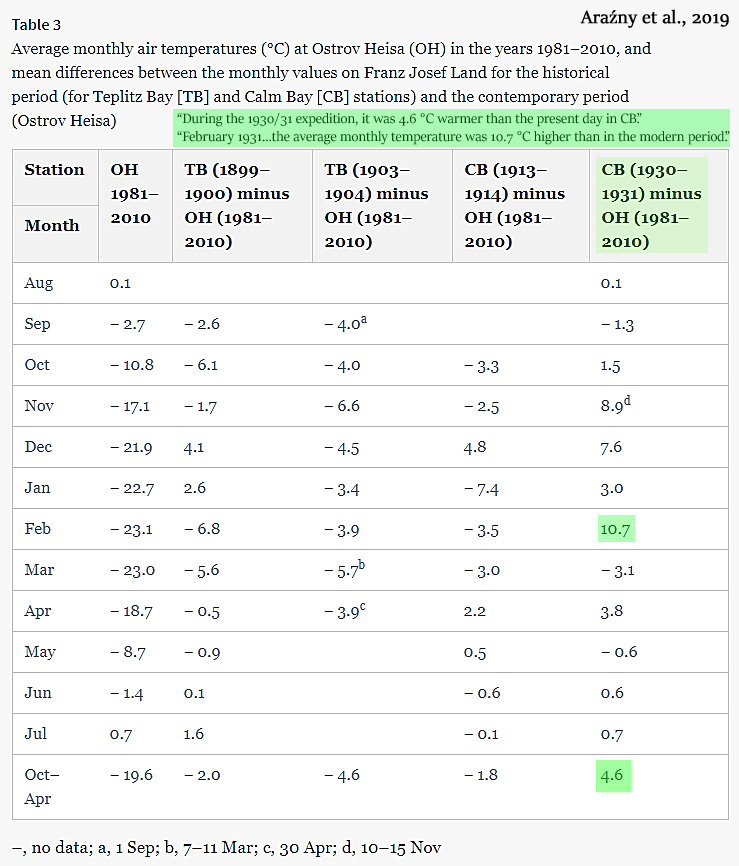
Huang et al., 2019
“The temperature effect of the Zhada δ18OTR series is further verified by consistency with nearby ice-core δ18O variability.”
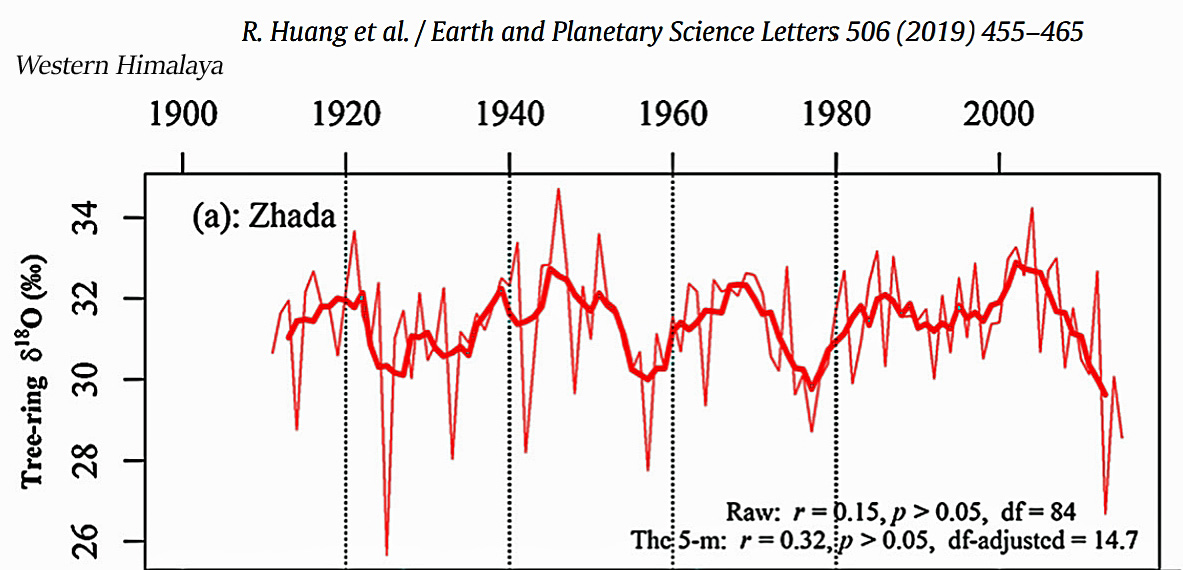
Huang et al., 2019
“Climatic change is exhibiting significant effects on the ecosystem of the Tibetan Plateau (TP), a climate-sensitive area. In particular, winter frost, freezing events and snow avalanche frequently causing severe effects on ecosystem and social economy, however, few long-term winter temperature records or reconstructions hinder a better understanding on variations in winter temperature in the vast area of the TP. In this paper, we present a minimum winter (November–February) temperature reconstruction for the past 668 years based on a tree-ring network (12 new tree-ring chronologies) on the southeastern TP. The reconstruction exhibits decadal to inter-decadal temperature variability, with cold periods occurring in 1423–1508, 1592–1651, 1729–1768, 1798–1847, 1892–1927, and 1958–1981, and warm periods in 1340–1422, 1509–1570, 1652–1728, 1769–1797, 1848–1891, 1928–1957, and 1982–2007. … It also shows the possible effects of volcanic eruption and reducing solar activity on the winter temperature variability for the past six centuries on the southeastern TP.”
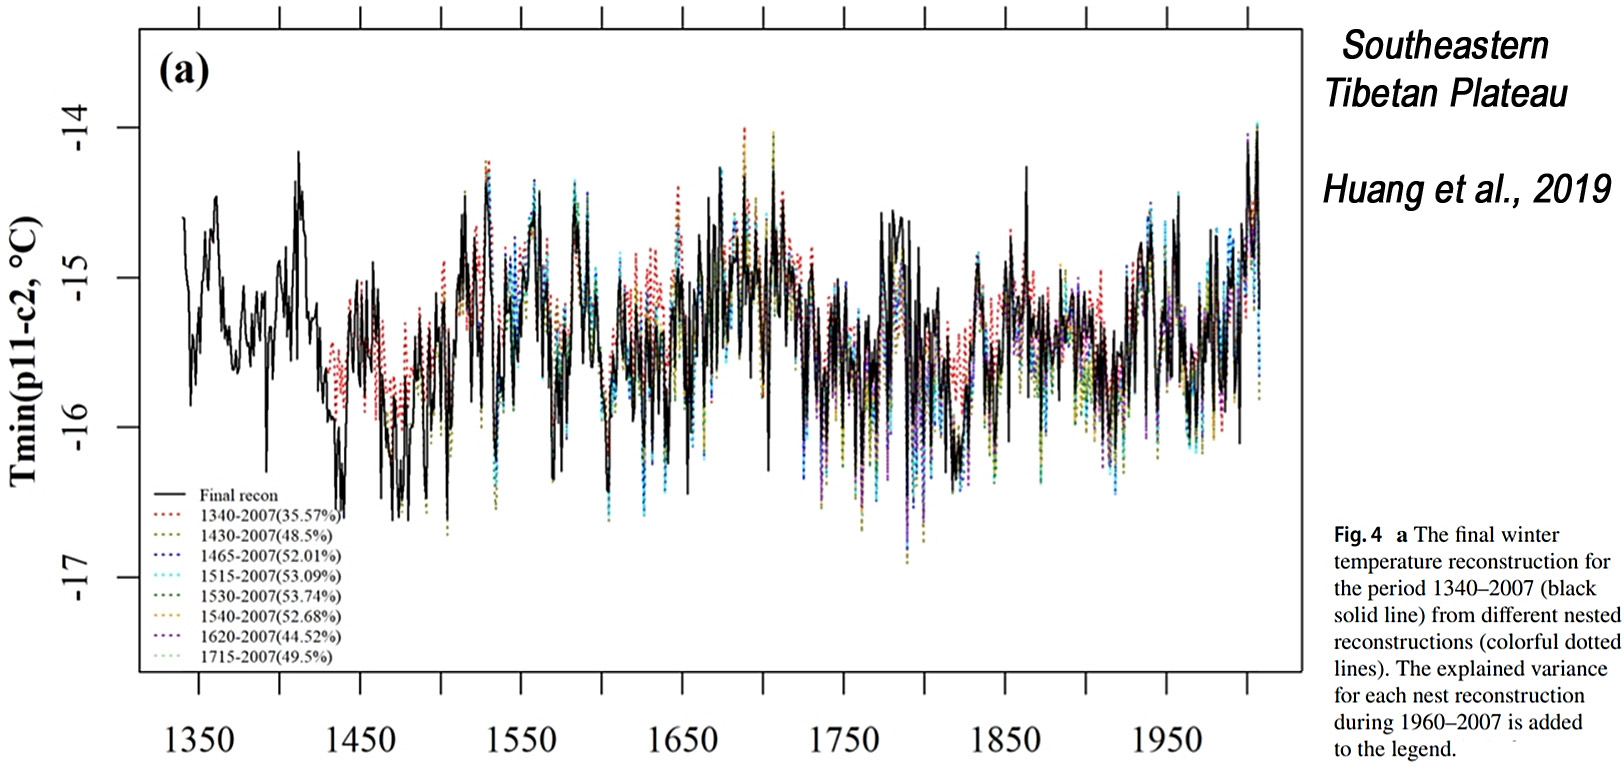
Vermassen et al., 2019
“A link between the physical oceanography of West Greenland and Atlantic SSTs has indeed been suggested previously: a positive phase of the AMO [Atlantic Multidecadal Oscillation] is related to an increase of warm Atlantic waters flowing towards and along the SE and W Greenland shelf (Drinkwater et al., 2014; Lloyd et al., 2011). … Despite differences in the timing and magnitude of the retreat of the different glaciers, they broadly share the same retreat history. High retreat rates occurred between the mid ‘30s and mid ‘40s (400-800m/yr), moderate retreat rates between 1965-1985 (~200 m/yr, except for Upernavik) and high retreat rates again after 2000 (>200 m/yr). … Since the meridional overturning circulation strength and associated heat transport is currently declining, (Frajka-Williams et al., 2017), this may lead to cooling bottom waters during the next decade in Upernavik Fjord and most likely also other fjords in West-Greenland.”
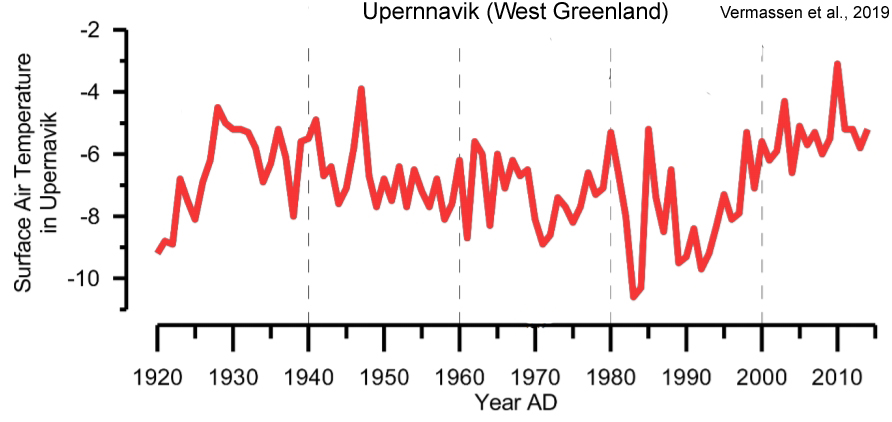
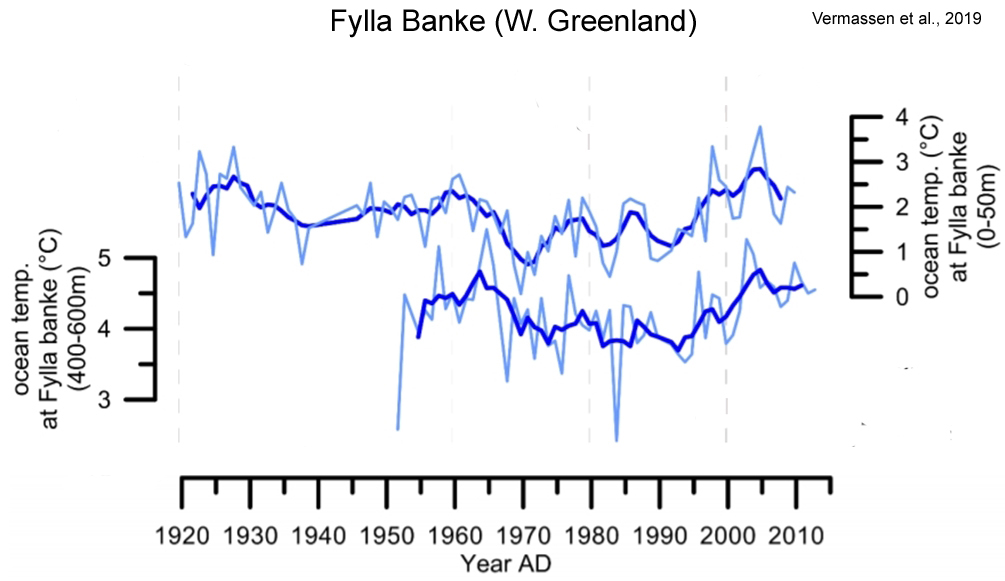
Kutta and Hubbart, 2019
“Between 1900 and 2016, climatic trends were characterized by significant reductions in the maximum temperatures (−0.78°C/century; p = 0.001), significant increases in minimum temperatures (0.44 °C/century; p = 0.017) [overall -0.34°C per century], and increased annual precipitation (25.4 mm/century) indicative of a wetter and more temperate WV climate. Despite increasing trends of growing degree days during the first (p ≤ 0.015) and second half of the period of record, the long-term trend indicated a decrease in GDD [warm growing degree days] of approximately 100 °C/days.”
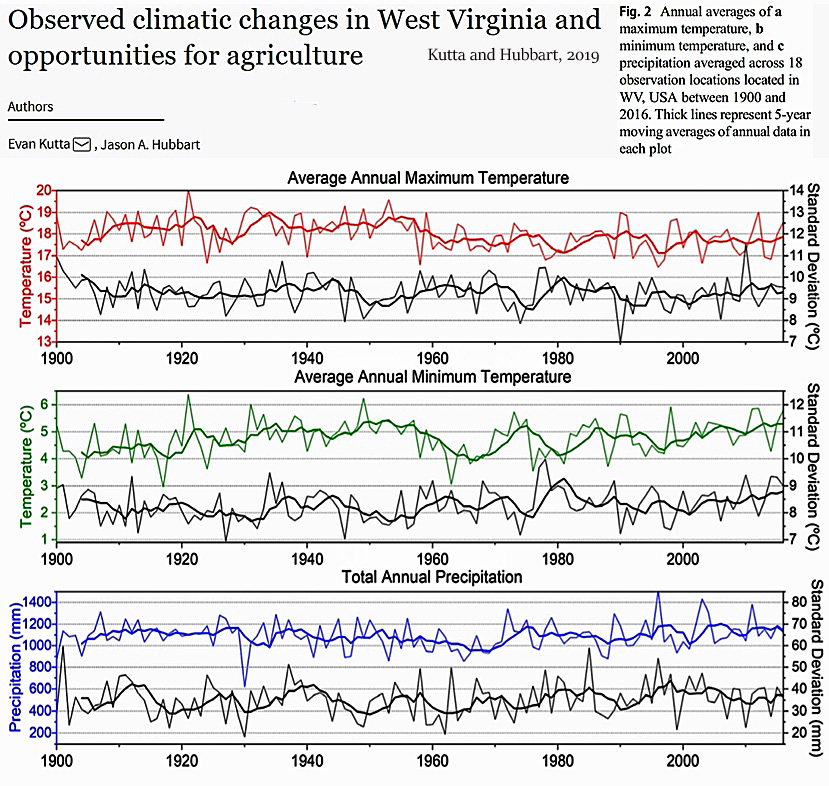
Lee et al., 2019
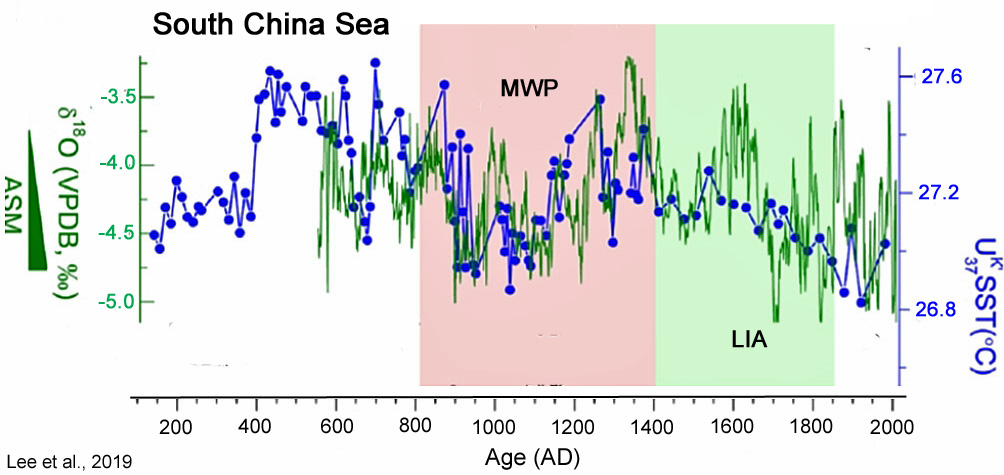
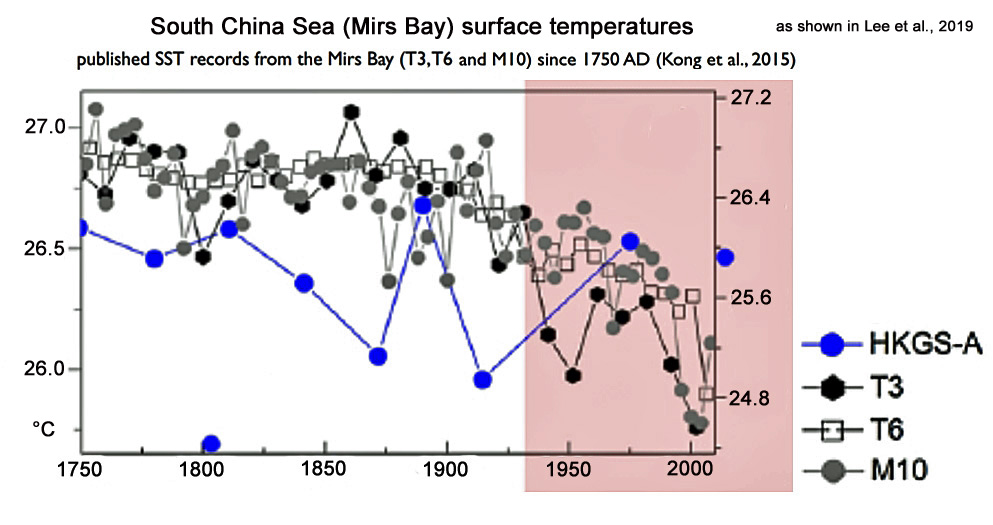
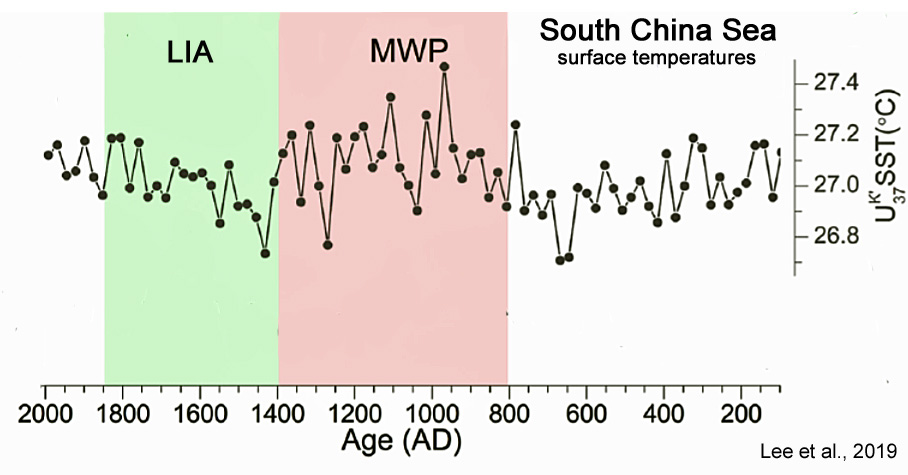
Eck et al., 2019
“A majority (12/14) of the regions within the SAM [southern Appalachian Mountains] have experienced a long‐term decline in mean winter temperatures since 1910.”
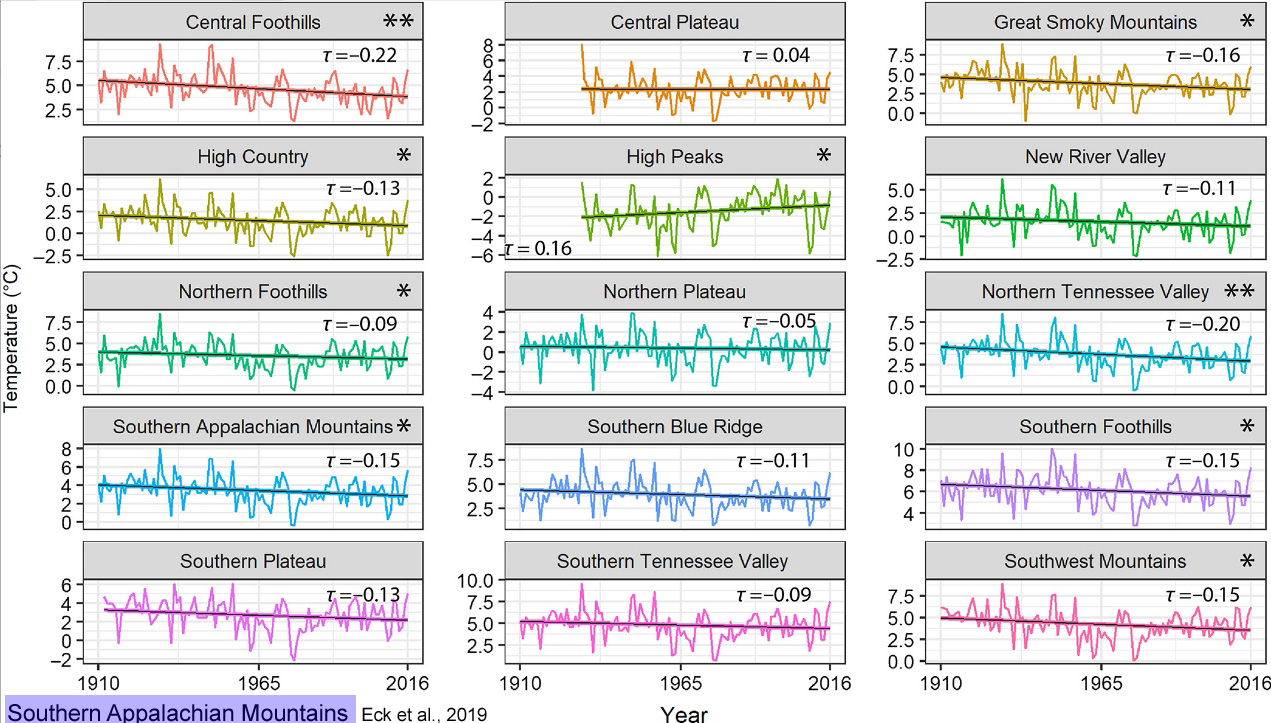
Deng et al., 2019
“Recent SST records based on longchain alkenones imply that the MCA [Medieval Climate Anomaly] was slightly warmer than the CWP [Current Warm Period] in the northern SCS [South China Sea] (Kong et al., 2017). … [I]t still should be noted that the SST record reconstructed from a Tridacna gigas Sr/Ca profile by Yan et al. (2015a) suggested that the annual average SST was approximately 0.89°C higher during the MCA [Medieval Climate Anomaly] than that of the CWP [Current Warm Period].”
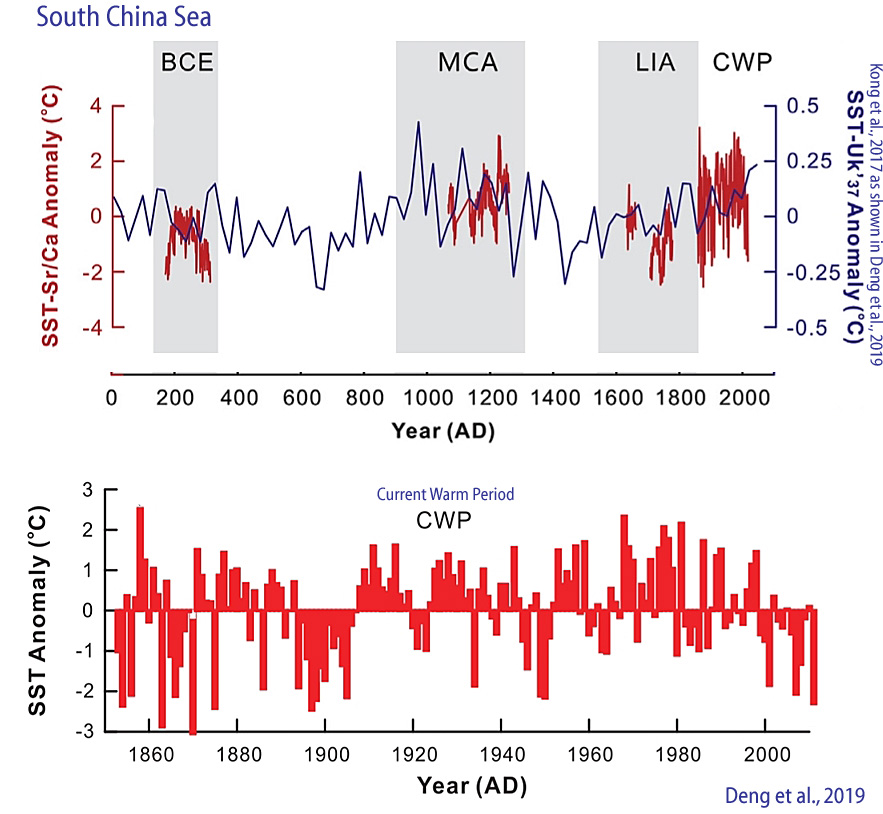
Zhang et al., 2019
“Natural variability of Southern Ocean convection as a driver of observed climate trends … Observed Southern Ocean surface cooling and sea-ice expansion over the past several decades are inconsistent with many historical simulations from climate models. Here we show that natural multidecadal variability involving Southern Ocean convection may have contributed strongly to the observed temperature and sea-ice trends.”
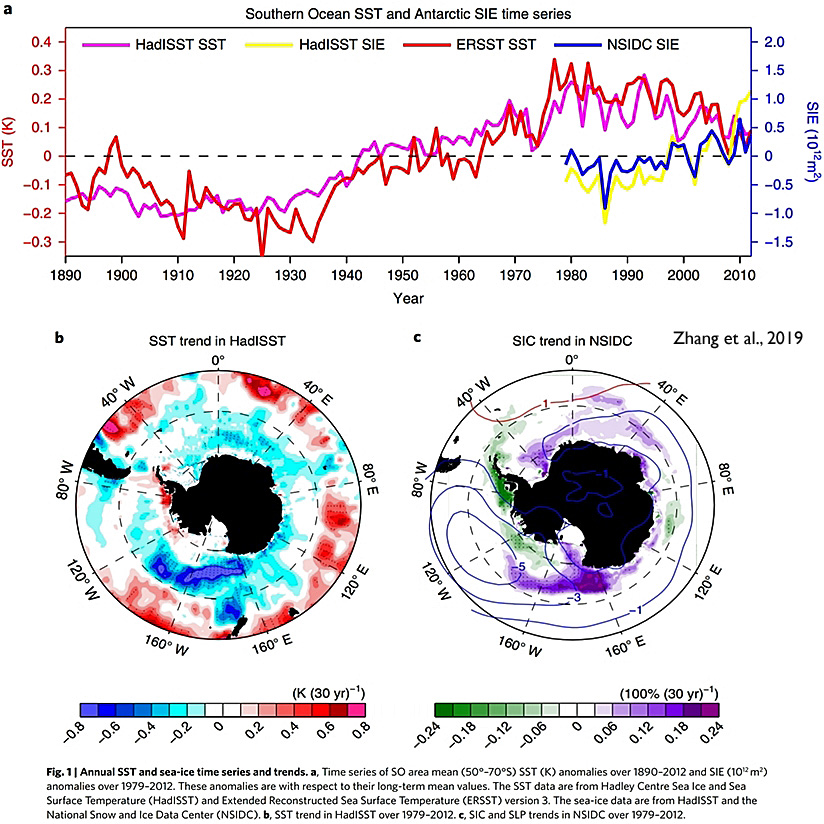
Etourneau et al., 2019
“Based on water stable isotopes calibrated to recent air temperatures [Abram et al., 2013, Mulvaney et al., 2012], the reconstructed mean annual SAT documents a 1.5 °C cooling over the Holocene occurring in two steps between 10,000 and 6000 years before present (BP), and 3500 and 500 years BP. The Holocene cooling was interrupted by a slightly warmer period. The first main cooling episode corresponds to a phase of major EAP [East Antarctic Peninsula] ice shelf retreat reported in the literature [Domack et al., 2005, Cofaigh et al., 2014, Johnson et al., 2011, Davies et al., 2012]. … The Larsen A ice shelf was probably destabilized at least as early as ~6300 years BP [Brachfeld et al., 2003], while evidence show that the Larsen B ice shelf experienced a continuous and significant shrinkage throughout the Holocene [Domack et al., 2005]. Hence, the EAP ice shelves underwent a major retreat mostly between ~8000 and 6000 years BP. … [T]he ice core-derived SAT were overall warmer throughout the Holocene than during the last two millennia and could have hence favored the EAP [East Antarctic Peninsula] ice shelf surface melting during the entire period. … The long-term SOT [subsurface ocean temperatures] increasing trend at the JPC-38 core site was punctuated by up to 1.5 °C warm events at the centennial scale.”
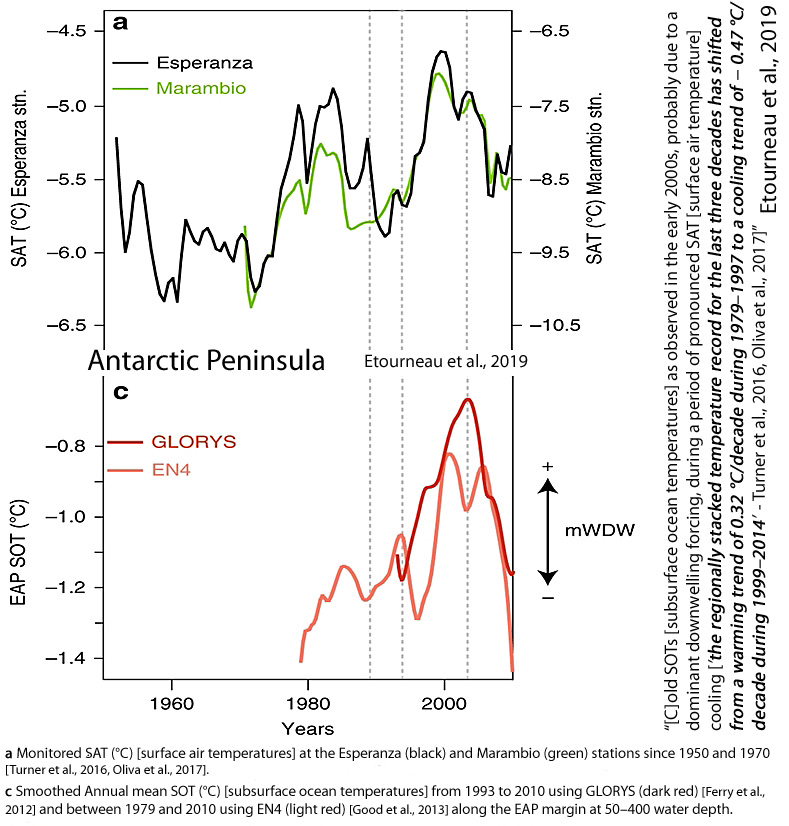
Voelker et al., 2019
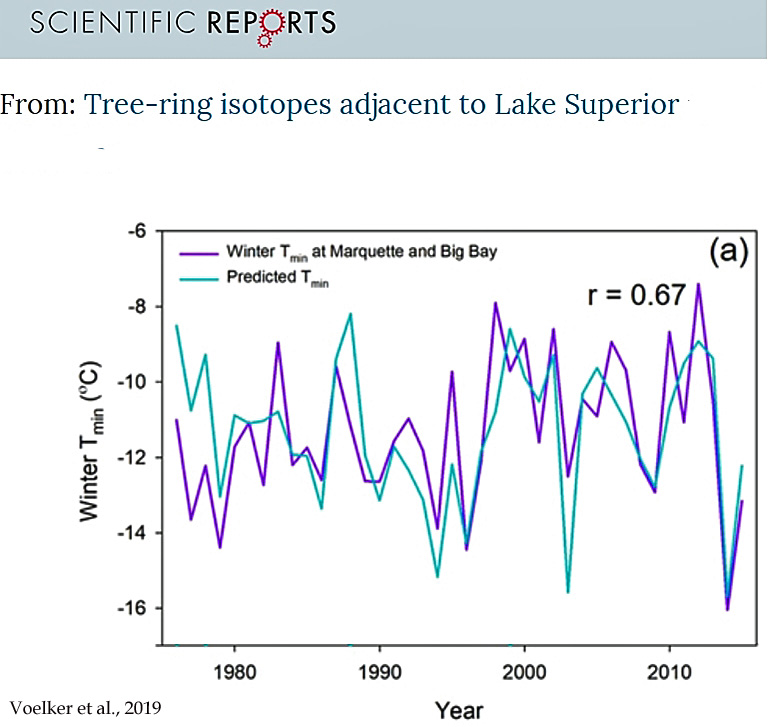
Gan et al., 2019
“Daily Minimum temperature (Tmin) is an important variable in both global and regional climate changes, and its variability can greatly affect the ecological system. In the early 21st century, warming slowdown is seen over the North Hemisphere and North America is one of the major cooling centers. … In this study, we found that Tmin experienced an obvious decline in North America during warming slowdown period. Such Tmin decline is closely related to the Atlantic Multidecadal Oscillation (AMO), the correlation between the decadal components of Tmin and AMO reached 0.71 during 1950-2014.”
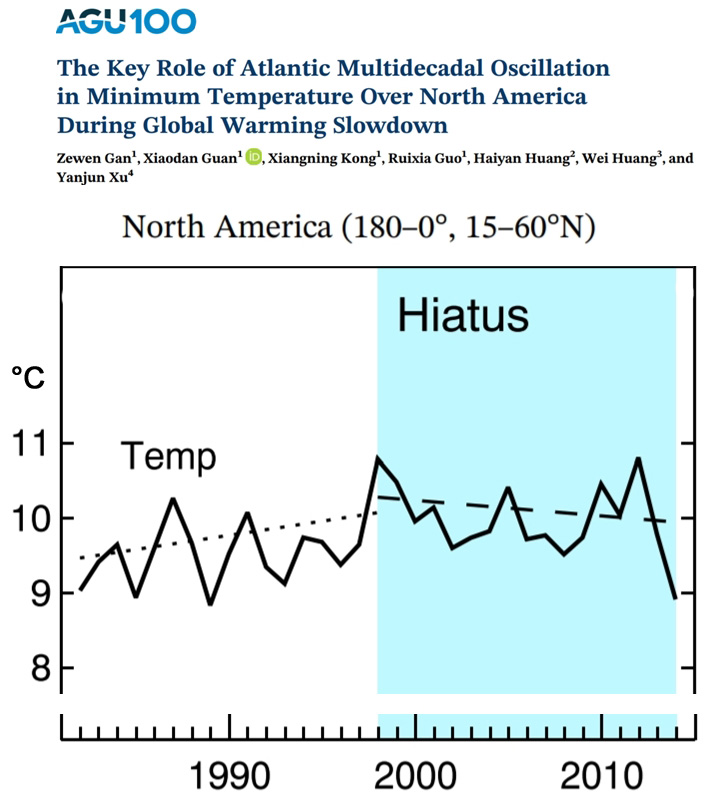
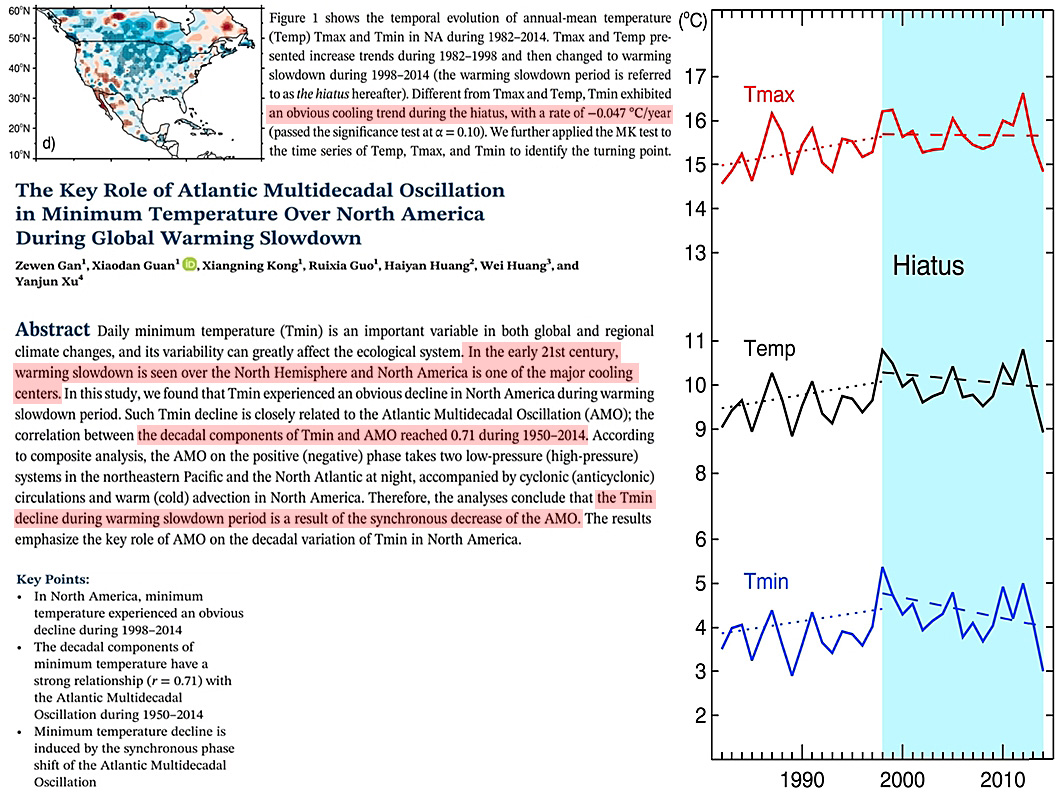
Khazendar et al., 2019
“Jakobshavn Isbrae has been the single largest source of mass loss from the Greenland Ice Sheet over the last 20 years. During that time, it has been retreating, accelerating and thinning. Here we use airborne altimetry and satellite imagery to show that since 2016 Jakobshavn has been re-advancing, slowing and thickening. We link these changes to concurrent cooling of ocean waters in Disko Bay that spill over into Ilulissat Icefjord. Ocean temperatures in the bay’s upper 250 m have cooled to levels not seen since the mid 1980s. … Over the past several years, ocean temperatures have cooled on the continental shelf in the vicinity of Jakobshavn Isbrae . We find that ocean temperatures in Disko Bay below about 150 m cooled by nearly 2 °C between 2014 and 2016. … The data then show cooling in the first half of 2016 of a normal magnitude (~2 °C) acting on water at already below-average temperatures cooling it to 1 °C, which is ~2–2.5 °C colder than the 2009–2015 values. The mooring data also show that temperatures remain significantly below average through summer 2017. … Since the late 1990s, Jakobshavn developed Greenland’s largest cumulative ice discharge anomaly, contributing the equivalent of ~0.9mm [9/100ths of a cm] to global mean sea-level rise between 2000 and 2010. … To explain the cooling observed in Davis Strait and in Disko Bay in 2015 and 2016, we first note that anomalous wintertime heat loss lowered ocean temperatures across the entire North Atlantic subpolar gyre since 2011 by about 0.6 °C on average in the top 300m of the water column (Supplementary Fig. 13). In the northern Irminger Sea where Atlantic Water first enters the East Greenland Current, ECCO shows that average temperatures have cooled by 0.75 °C over the same time period with the greatest cooling occurring during the winter of 2015. This 0.75 °C cooling of waters far upstream in the Irminger Sea explains part of the 2 °C cooling observed in Davis Strait and in Disko Bay. … Most prominently, the sharp drop in ocean temperatures in 2016 and 2017 by 2 °C relative to the peak temperature in 2014 corresponds to the slowing and dramatic thickening of the glacier in 2017 and 2018. The higher melting in 2014 simulated in our plume model is not reflected in flow acceleration and thinning, which we cannot explain.”
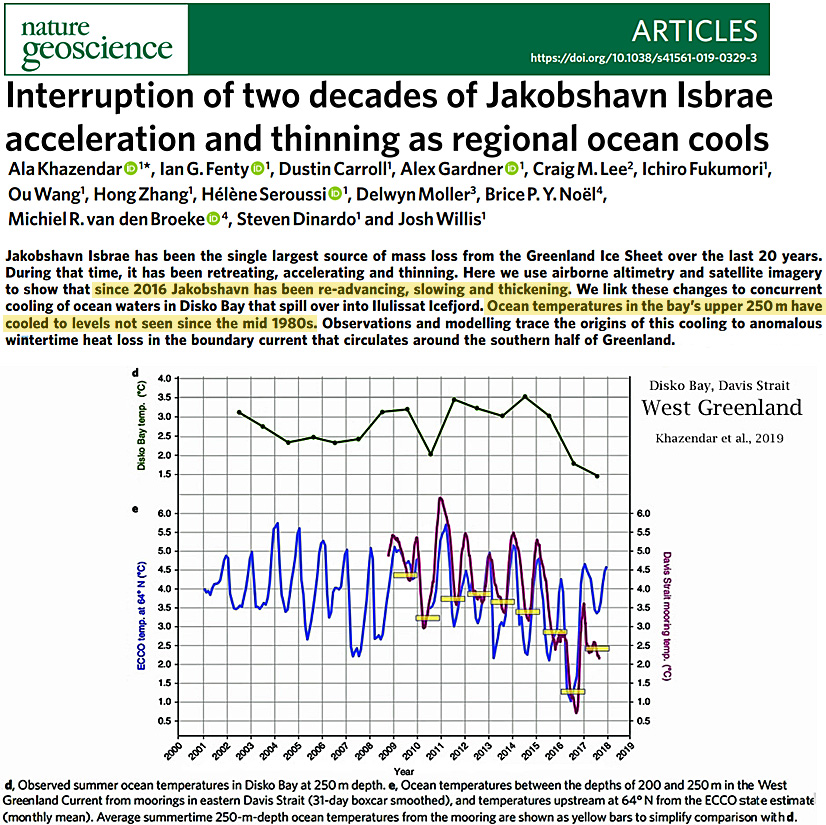
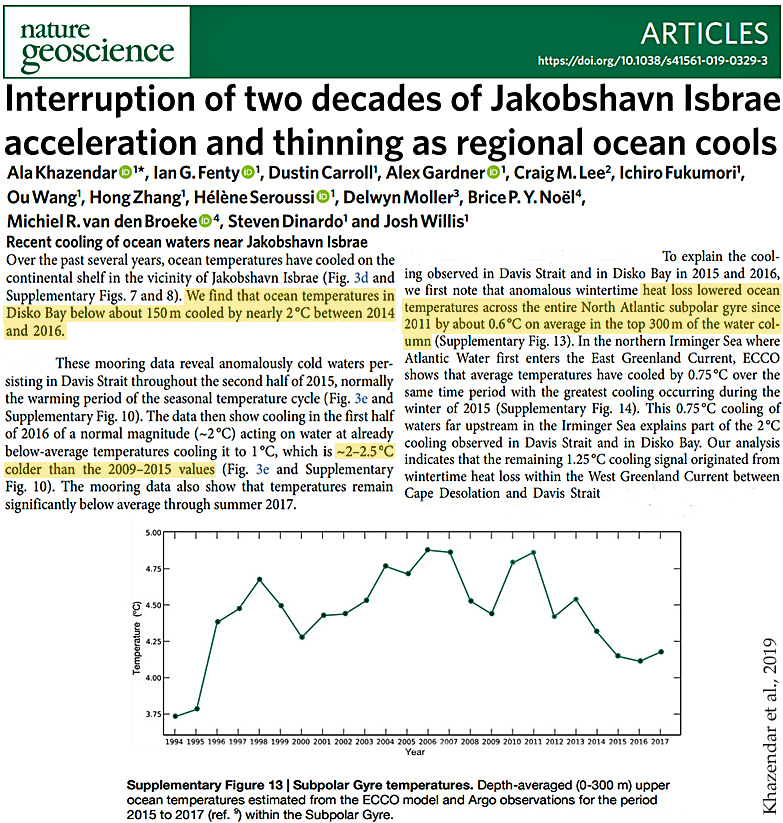
Zhou et al., 2019
“These results demonstrated that the climate of the ASIR [the entire Antarctic Sea Ice Region, the (1) Weddell Sea (WS), (2) Indian Ocean, (3) Pacific Ocean (PO), (4) Ross Sea, and (5) Bellingshausen-Amundsen Sea (BS)] exhibits a cooling trend during summer [1982-2015], except for the BS. … Consistent with the trend of SAL [surface albedo], the slope values of SIC [sea ice concentration] were mostly positive, except for the BS (Table 4), which further demonstrated that the climate of the ASIR exhibits a cooling trend in recent decades. … The average SAL (Table 3), SIC (Table 4), and SST (Table 5) for the total ASIR were 46.75%, 65.39%, and −2.44 °C during summer.”
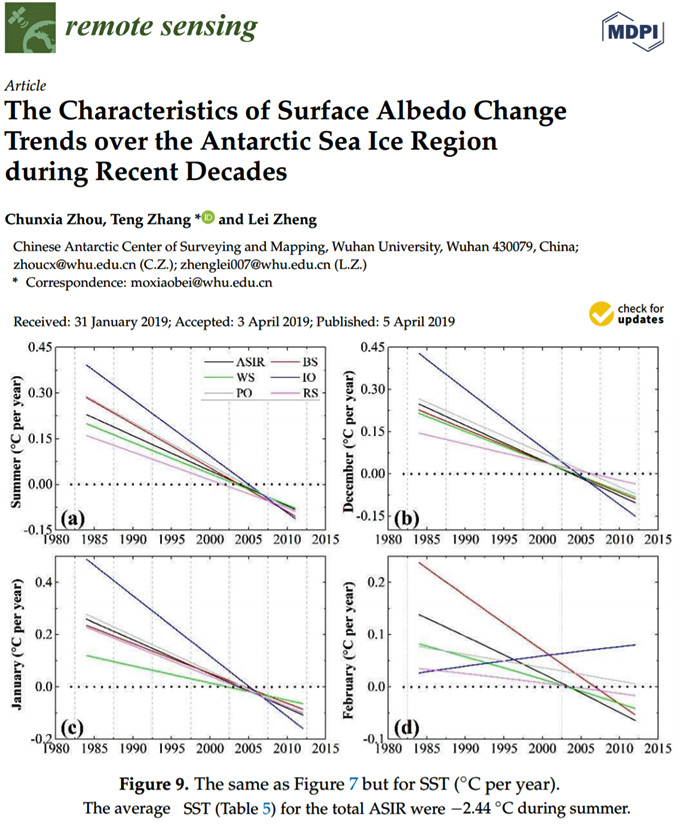
![]()
Li et al., 2019
“On the contrary, there is a cooling trend by 0.29 ± 0.26 °C (10 yr)−1 in northern China during the recent 15 yr, where a warming rate about 0.38 ± 0.11 °C (10 yr)−1 happened for 1960–2000. Overall, satellite simulation shows that the warming rate is reduced to −0.02 °C (10 yr)−1. The changes in underlying surface, Earth’s orbit, solar radiation and atmospheric counter radiation (USEOSRACR) cause China’s temperature rise about 0.02 °C (10 yr)−1. A combination of greenhouse gases (GHGs) and other natural forcing (ONAT, predominately volcanic activity, and atmosphere and ocean circulation) explain another part of temperature trend by approximately −0.04 °C (10 yr)−1. We conclude that there is a regional warming hiatus, a pause or a slowdown in China, and imply that GHGs-induced warming is suppressed by ONAT [other natural forcing] in the early 21st century.”
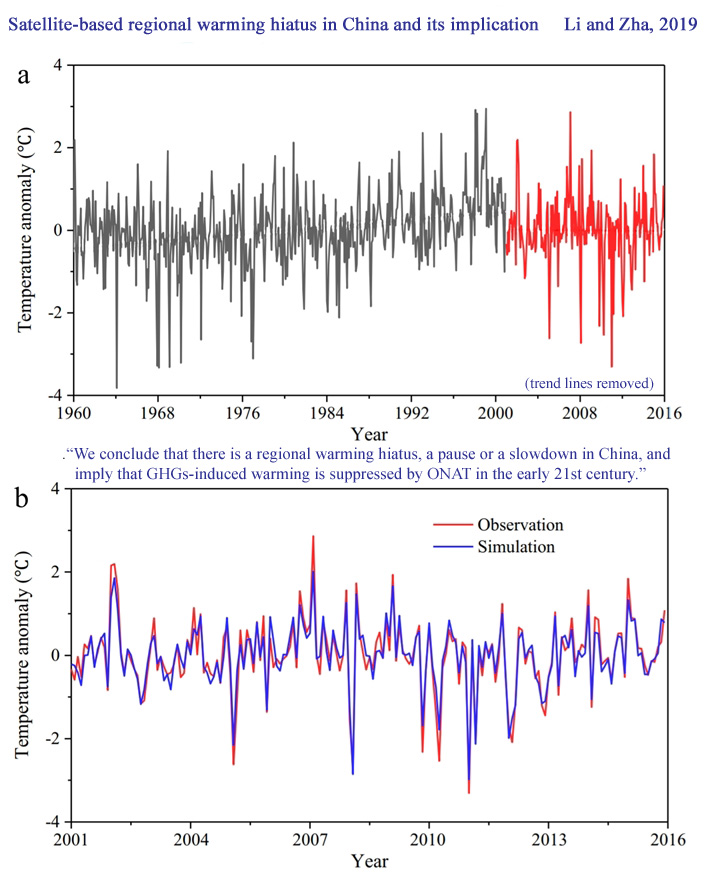
Jiang et al., 2019
“In this study, ring-width chronology of Picea jezoensis var. microsperma from the Changbai Mountain (CBM) area, Northeast China, was constructed. … … The 11-year smoothing average of the reconstructed Tmax6–7 series was used to reveal low-frequency information and to show temperature variability in this area. After smoothing with an 11-year moving average, cold periods occurred in 1899–1913 (average value was 21.41 °C), 1955–1970 (21.49 °C), and 1975–1989 (20.97 °C), while warm periods occurred in 1881–1888 (23.93 °C). Furthermore, there are six obvious processes of Tmax6–7 increasing in 1781–1791 (from 22.76 °C to 23.54 °C), 1800–1809 (from 22.72 °C to 23.44 °C), 1835–1845 (from 22.66 °C to 23.76 °C), 1900–1919 (from 21.47 °C to 22.30 °C), 1931–1942 (from 21.36 °C to 22.04 °C), and 1983–2004 (from 20.49 °C to 22.99 °C), and five obvious processes of Tmax6–7 decreasing in 1790–1800 (from 21.89 °C to 22.98 °C), 1810–1835 (from 23.40 °C to 22.66 °C), 1880–1901 (from 23.83 °C to 21.25 °C), 1917–1931 (from 22.36 °C to 21.36 °C), and 1970–1983 (from 21.75 °C to 20.49 °C). In addition, the temperatures during 1780–1890 were much warmer (average value was 23.35 °C) than the temperatures during 1900–2004 (average value was 21.65 °C).”
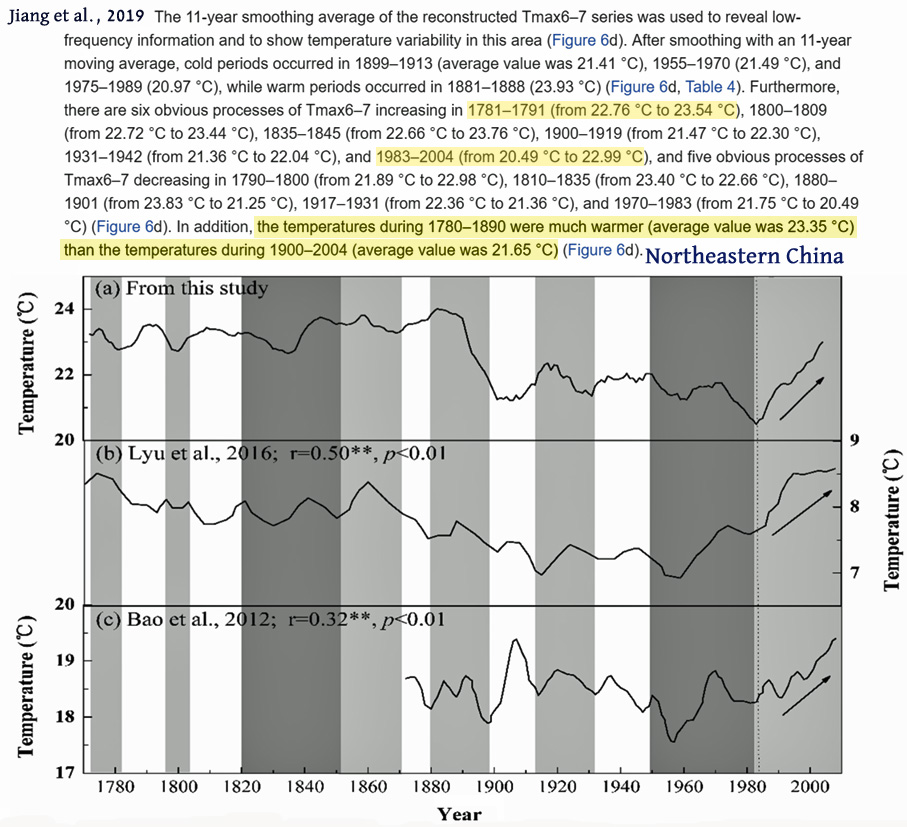
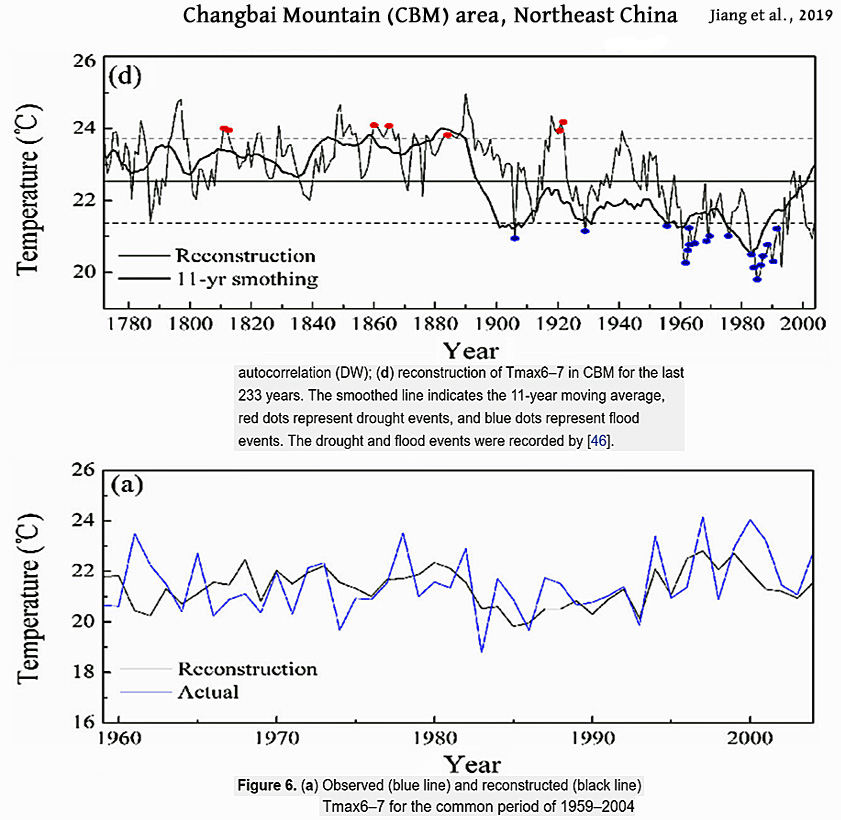
“After 2005, we observe a gradual transition from a weak to a strong subpolar gyre, which is related to the cooling and freshening trend of the SPNA.[Subpolar North Atlantic]. The anomalously low sea level during the past few winters (2014–2016) can be attributed to the exceptionally strong North Atlantic Oscillation and hence a return to the conditions seen during the early 1990s. We estimate the regional SPNA trend during the WP and CP to be about 3.9±1.5mm/yr and −7.1±1.3mm/yr, respectively. … Oceanic climate variability in the North Atlantic is known to be dominated by decadal-to-multidecadal fluctuations that have profound regional and global climate impacts. Recent observational evidence shows that the strength of the Atlantic Meridional Overturning Circulation or AMOC, i.e. the flow of warm surface waters polewards and the return of cold deep waters equatorwards, is indeed the major factor regulating the warm and cold decades of the North Atlantic as has long been hypothesized. This decadal-scale AMOC variability can have substantial influence on dynamical sea-level change, especially on regional scale, as a result of variable amount of mass, heat and freshwater redistributed by ocean currents.”
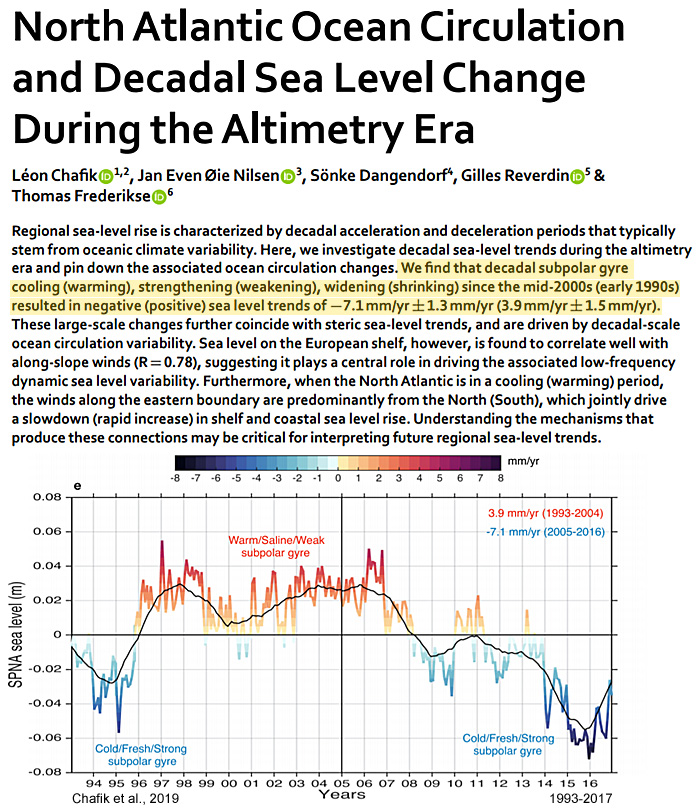
Kushnir and Stein, 2019
“Medieval Climate in the Eastern Mediterranean: Instability and Evidence of Solar Forcing … The Nile summer flood levels were particularly low during the 10th and 11th centuries, as is also recorded in a large number of historical chronicles that described a large cluster of droughts that led to dire human strife associated with famine, pestilence and conflict. During that time droughts and cold spells also affected the northeastern Middle East, in Persia and Mesopotamia. Seeking an explanation for the pronounced aridity and human consequences across the entire EM, we note that the 10th–11th century events coincide with the medieval Oort Grand Solar Minimum, which came at the height of an interval of relatively high solar irradiance. Bringing together other tropical and Northern Hemisphere paleoclimatic evidence, we argue for the role of long-term variations in solar irradiance in shaping the early MCA in the EM and highlight their relevance to the present and near-term future.”
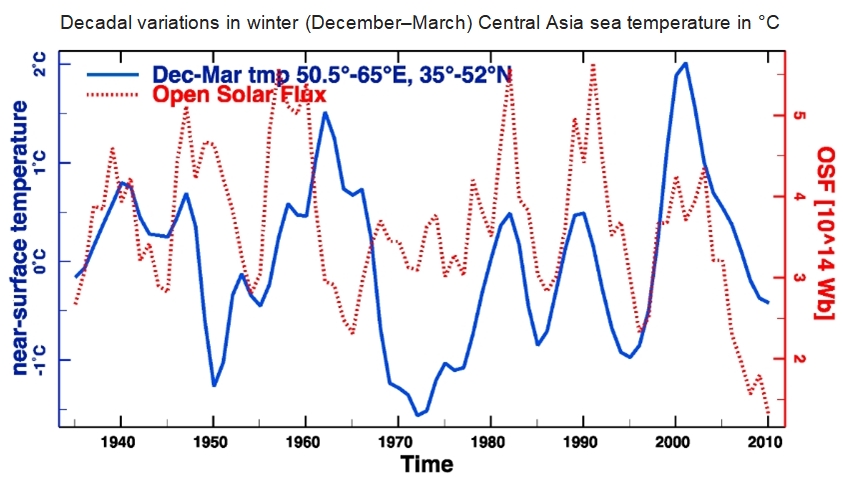


Recent Comments