Sea Levels 2+ m Higher 9,000-4,000 Years Ago
Image Source: Scheffers et al., 2012
Holocene Rates of Global Sea Level Rise
Cronin et al., 2017 Global Sea Level Rise Rate: +4 meters per century (14,500 to 14,000 years ago)
“Rates and patterns of global sea level rise (SLR) following the last glacial maximum (LGM) are known from radiometric ages on coral reefs from Barbados, Tahiti, New Guinea, and the Indian Ocean, as well as sediment records from the Sunda Shelf and elsewhere. … Lambeck et al. (2014) estimate mean global rates during the main deglaciation phase of 16.5 to 8.2 kiloannum (ka) [16,500 to 8,200 years ago] at 12 mm yr−1 [+1.2 meters per century] with more rapid SLR [sea level rise] rates (∼ 40 mm yr−1) [+4 meters per century] during meltwater pulse 1A ∼ 14.5–14.0 ka [14,500 to 14,000 years ago].”
Abdul et al., 2017 Global Sea Level Rise Rate: +4 meters per century (11,450 to 11,100 years ago)
“We find that sea level tracked the climate oscillations remarkably well. Sea-level rise was fast in the early Allerød (25 mm yr-1), but decreased smoothly into the Younger Dryas (7 mm yr-1) when the rate plateaued to <4 mm yr-1here termed a sea-level ‘slow stand’. No evidence was found indicating a jump in sea level at the beginning of the Younger Dryas as proposed by some researchers. Following the “slow-stand”, the rate of sea-level rise accelerated rapidly, producing the 14 ± 2 m sea-level jump known as MWP-1B; occurred between 11.45 and 11.1 kyr BP with peak sea-level rise reaching 40 mm yr-1 [+4 meters per century].”
Zecchin et al., 2015 Regional Sea Level Rise Rate +6 meters per century (15,000 to 10,000 years ago)
Smith et al., 2011 Regional Sea Level Rise Rate +7.5 meters per century (Early Holocene, 11,000 to 8,000 years ago)
Ivanovic et al., 2017 Northern Hemisphere Sea Level Rise Rate: +3.5 to 6.5 meters per century (~14,500 years ago)
“During the Last Glacial Maximum 26–19 thousand years ago (ka), a vast ice sheet stretched over North America [Clark et al., 2009]. In subsequent millennia, as climate warmed and this ice sheet decayed, large volumes of meltwater flooded to the oceans [Tarasov and Peltier, 2006; Wickert, 2016]. This period, known as the “last deglaciation,” included episodes of abrupt climate change, such as the Bølling warming [~14.7–14.5 ka], when Northern Hemisphere temperatures increased by 4–5°C in just a few decades [Lea et al., 2003; Buizert et al., 2014], coinciding with a 12–22 m sea level rise in less than 340 years [3.5 to 6.5 meters per century] (Meltwater Pulse 1a (MWP1a)) [Deschamps et al., 2012].”
~9,000 – 4,000 Years Ago, Sea Levels Were…
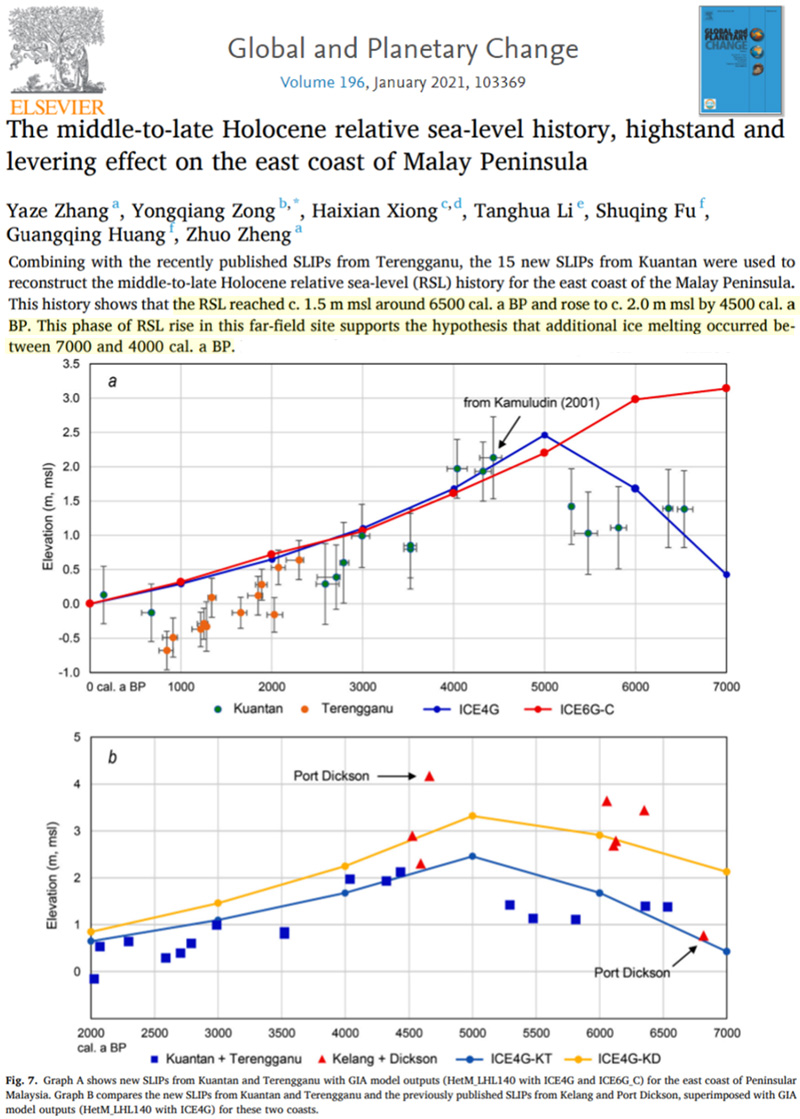
Zhang et al., 2021 Malay Peninsula +1.5 to 2 m higher than present
This history shows that the RSL reached c. 1.5 m msl around 6500 cal. a BP and rose to c. 2.0 m msl by 4500 cal. a BP. This phase of RSL rise in this far-field site supports the hypothesis that additional ice melting occurred between 7000 and 4000 cal. a BP.
Haque and Hoyanagi, 2021 Bangladesh +0.8 m higher than present (Medieval Warm Period)
This study illustrates the influences of sea-level on the depositional process during the last 1000 years of the southwestern delta, Bangladesh. … During the 850–1300 AD, RSL [relative sea level] was reached up to +80 cm higher than the present level where tidal-influenced bioturbated light yellow to gray mud deposited in the upper delta plain area. RSL was dropped up to −110 cm during 1300–1850 AD
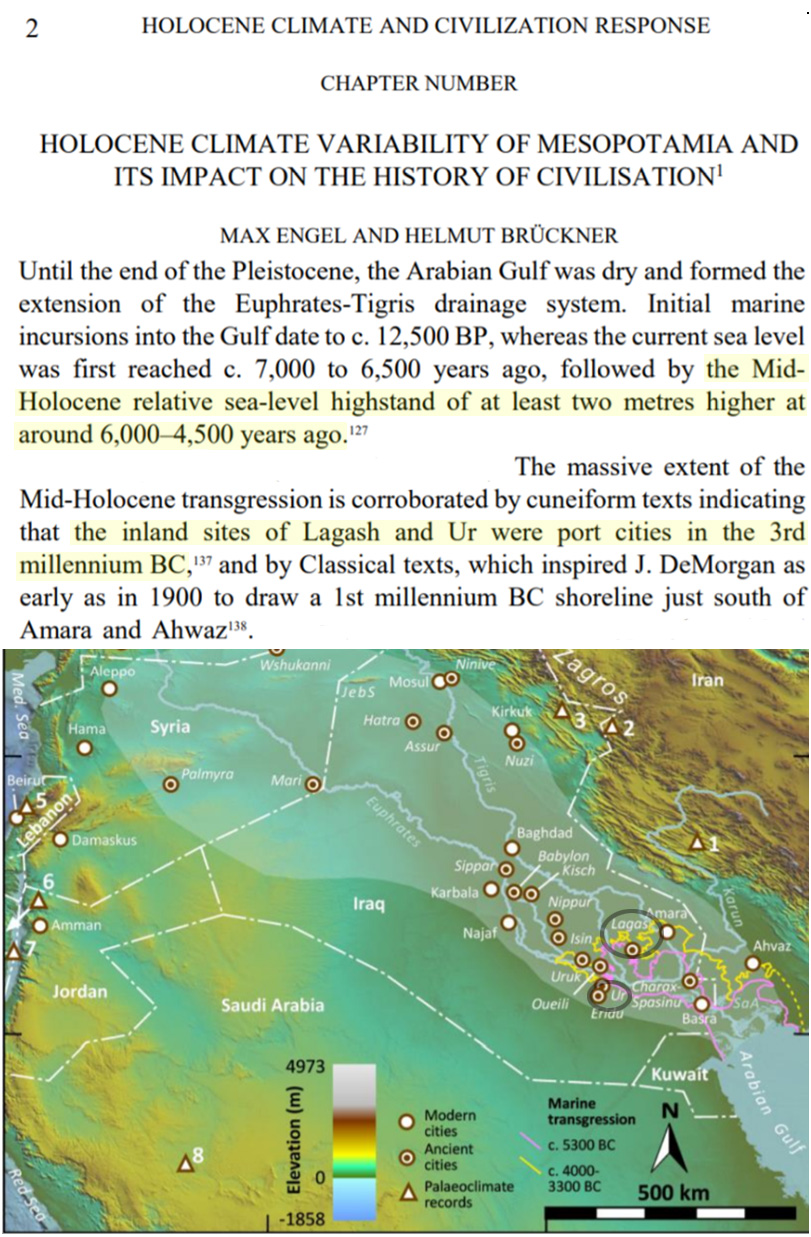
Engel and Brückner, 2021 Arabian Gulf >2 m higher than present (Ur a coastal city ~5,000 years ago, now ~200 km from coast)
Until the end of the Pleistocene, the Arabian Gulf was dry and formed the extension of the Euphrates-Tigris drainage system. Initial marine incursions into the Gulf date to c. 12,500 BP, whereas the current sea level was first reached c. 7,000 to 6,500 years ago, followed by the Mid-Holocene relative sea-level highstand of at least two metres higher at around 6,000–4,500 years ago. … The massive extent of the Mid-Holocene transgression is corroborated by cuneiform texts indicating that the inland sites of Lagash and Ur were port cities in the 3rd millennium BC, and by Classical texts, which inspired J. DeMorgan as early as in 1900 to draw a 1st millennium BC shoreline just south of Amara and Ahwaz.
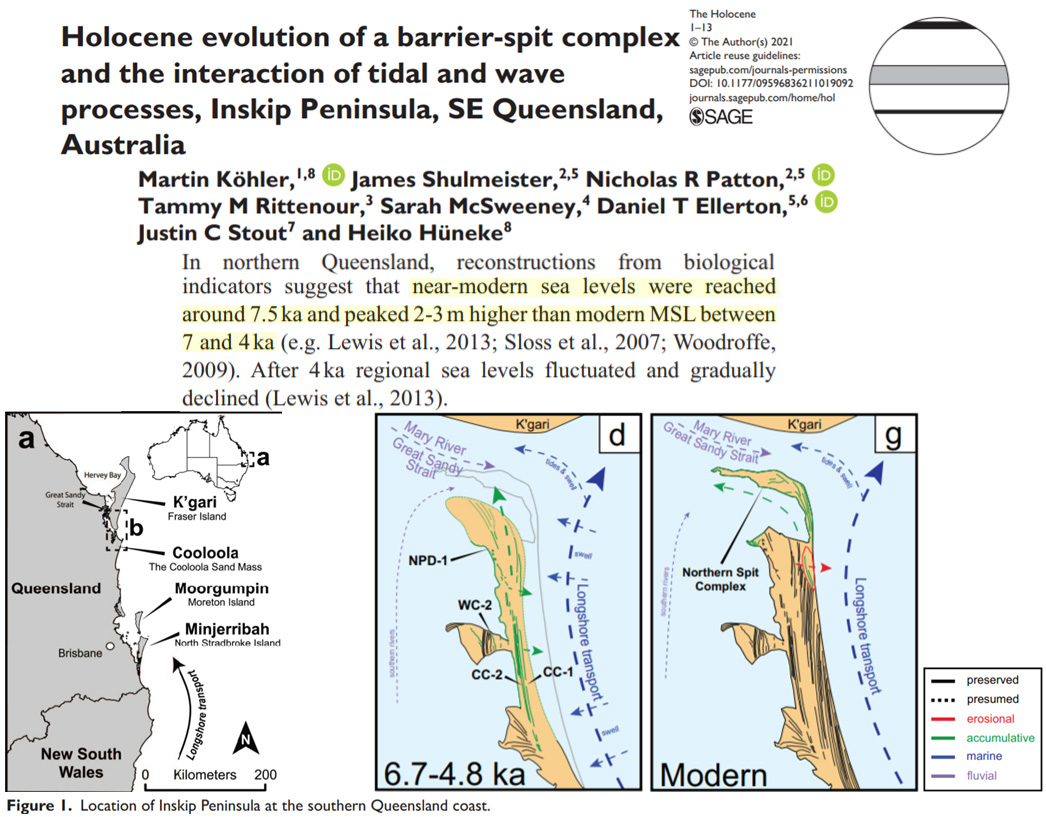
Kohler et al., 2021 Queensland, Australia +2-3 m higher than present
In northern Queensland, reconstructions from biological indicators suggest that near-modern sea levels were reached around 7.5ka and peaked 2-3m higher than modern MSL between 7 and 4 ka (e.g. Lewis et al., 2013; Sloss et al., 2007; Woodroffe, 2009). After 4 ka regional sea levels fluctuated and gradually declined (Lewis et al., 2013).
Kennedy et al., 2021 Victoria, Australia >1.14 m higher than present
Based on regional Holocene eustatic reconstructions (Lewis et al., 2013) and numerical modelling (Bryant, 1992), it is assumed for this study that the Holocene highstand was likely elevated between 1 and 2 m above present sea-level … The contemporary estuary, which occupies the two basins, corresponds to current sea-level and provides direct evidence of mid Holocene sea-levels being elevated at least 1.14 m above present.
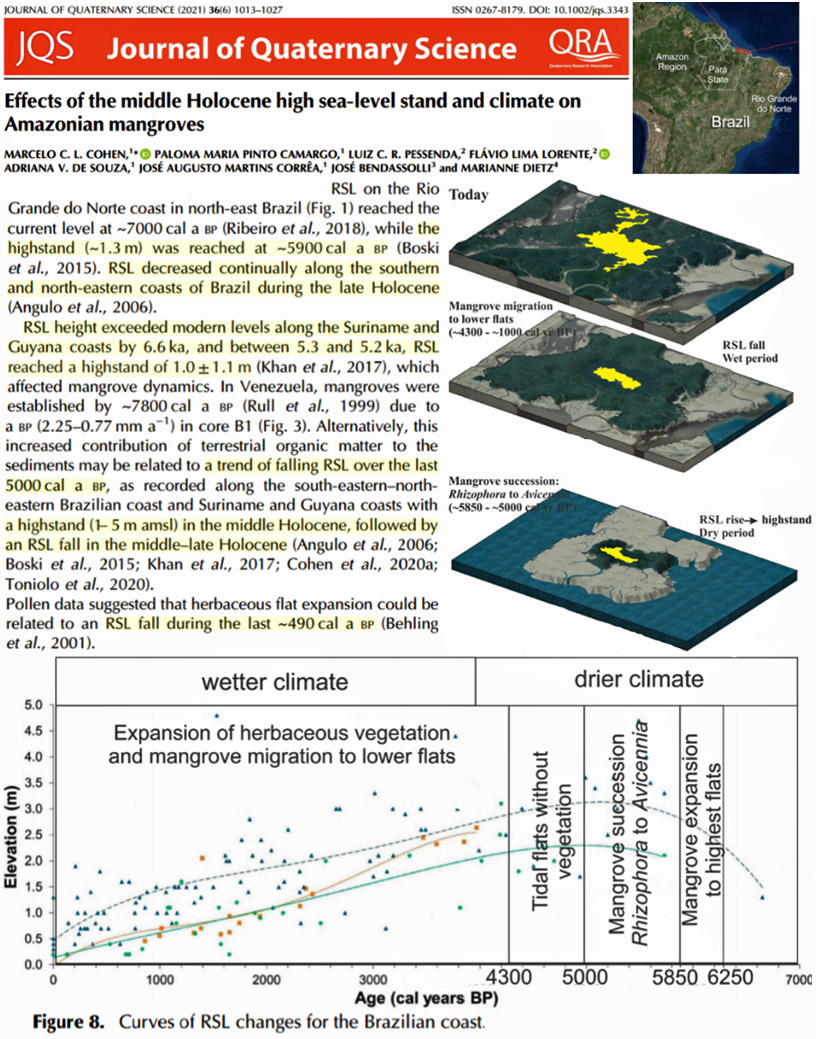
Cohen et al., 2021 Amazon +1 to 5 m higher than present
RSL on the Rio Grande do Norte coast in north‐east Brazil reached the current level at ~7000 cal a BP (Ribeiro et al., 2018), while the highstand (~1.3 m) was reached at ~5900 cal a BP (Boski et al., 2015). RSL decreased continually along the southern and north‐eastern coasts of Brazil during the late Holocene (Angulo et al., 2006). RSL height exceeded modern levels along the Suriname and Guyana coasts by 6.6 ka, and between 5.3 and 5.2 ka, RSL reached a highstand of 1.0 ± 1.1 m (Khan et al., 2017), which affected mangrove dynamics.
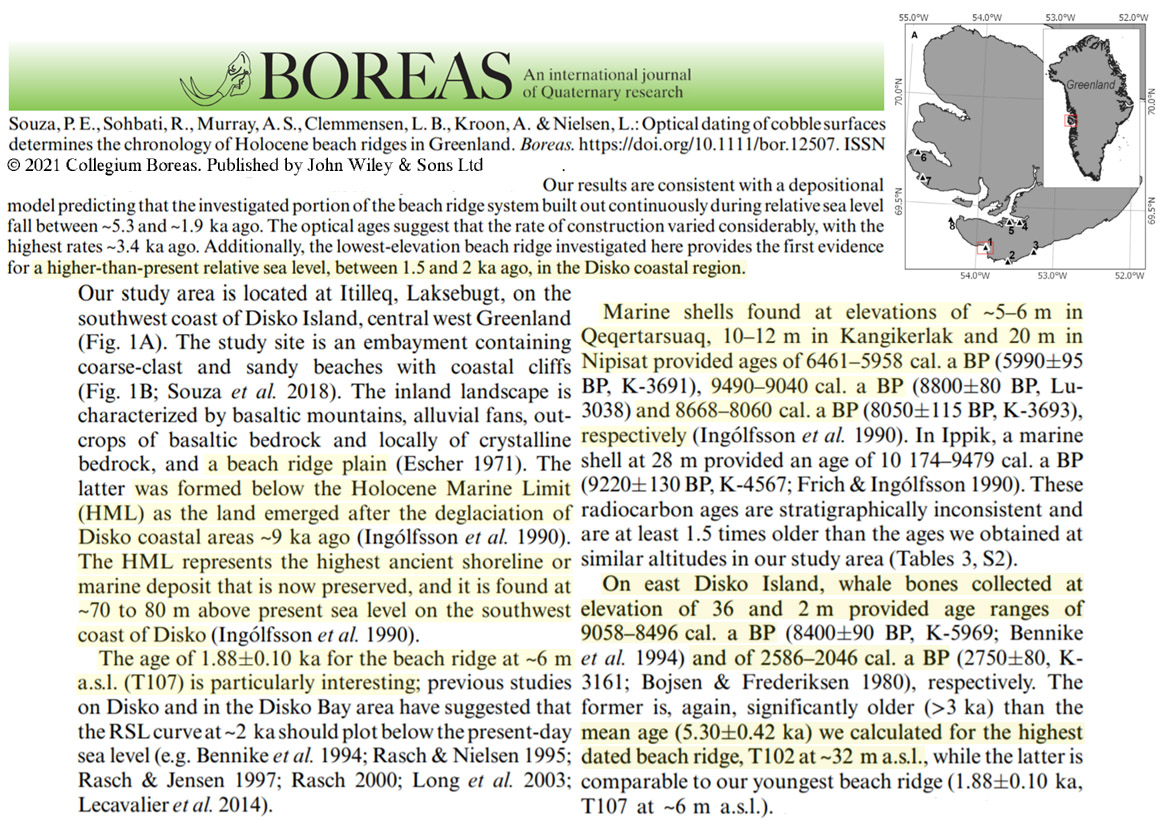
Souza et al., 2021 Greenland +36 m higher 9000 to 8500 years ago, +2 m higher 2500 to 2000 years ago
[H]igher-than-present relative sea level, between 1.5 and 2 ka ago, in the Disko coastal region. … The age of 1.88±0.10 ka for the beach ridge at ~6 m a.s.l. (T107) is particularly interesting; previous studies on Disko Bay area have suggested that the RSL curve at ~2 ka should plot below the present-day sea level … On east Disko Island, whale bones collected at elevation of 36 and 2 m provided age ranges of 9058-8496 cal. a BP…and of 2586-2046 cal. a BP, respectively.
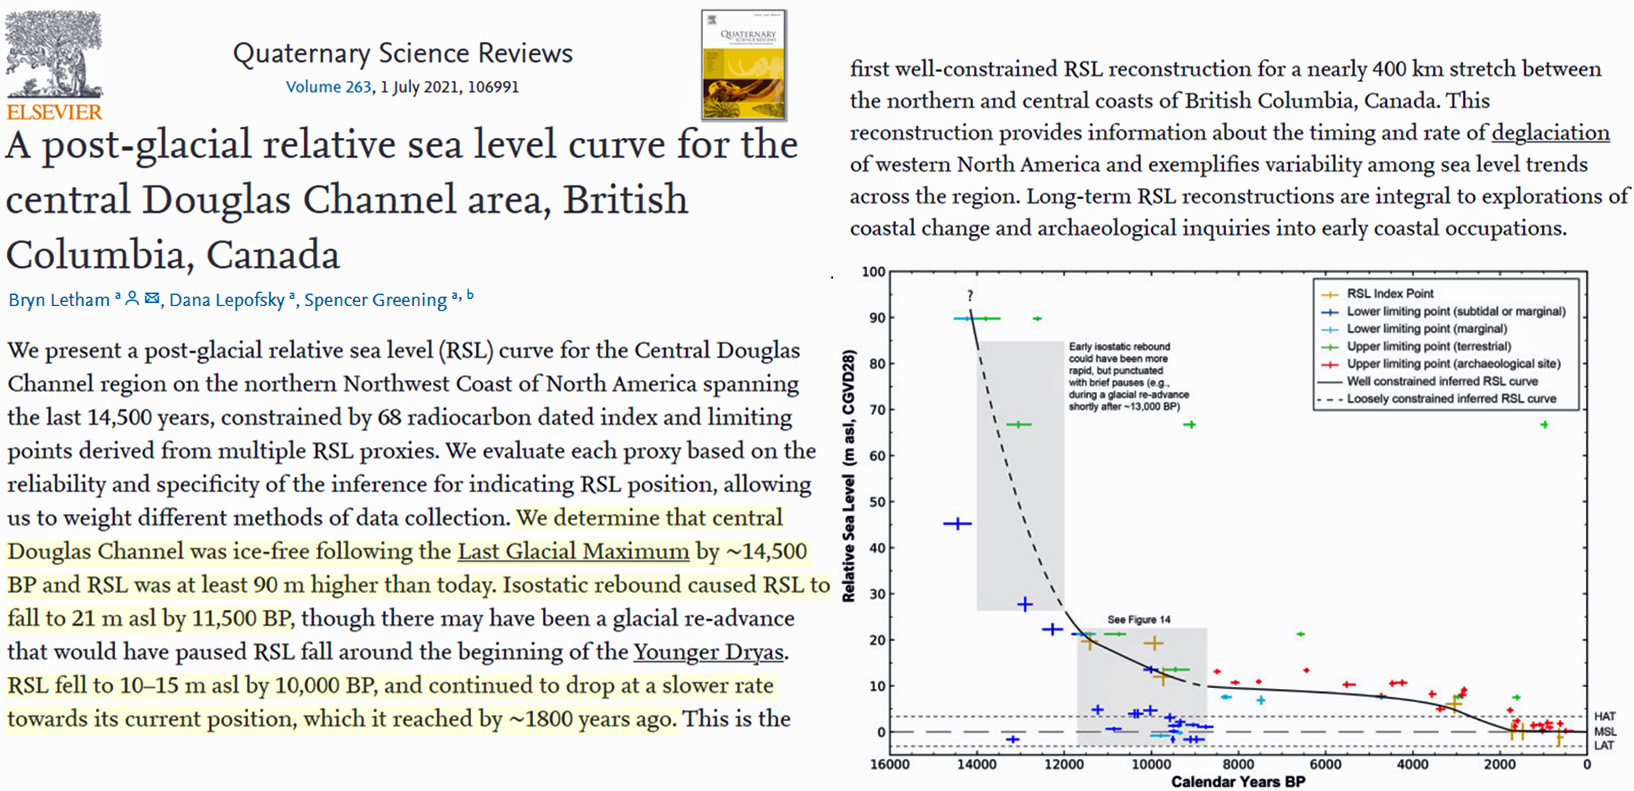
Letham et al., 2021 British Columbia, Canada +10-15 m higher than present ~10,000 years ago
We determine that central Douglas Channel was ice-free following the Last Glacial Maximum by ∼14,500 BP and RSL was at least 90 m higher than today. Isostatic rebound caused RSL to fall to 21 m asl by 11,500 BP, though there may have been a glacial re-advance that would have paused RSL fall around the beginning of the Younger Dryas. RSL fell to 10–15 m asl by 10,000 BP, and continued to drop at a slower rate towards its current position, which it reached by ∼1800 years ago.
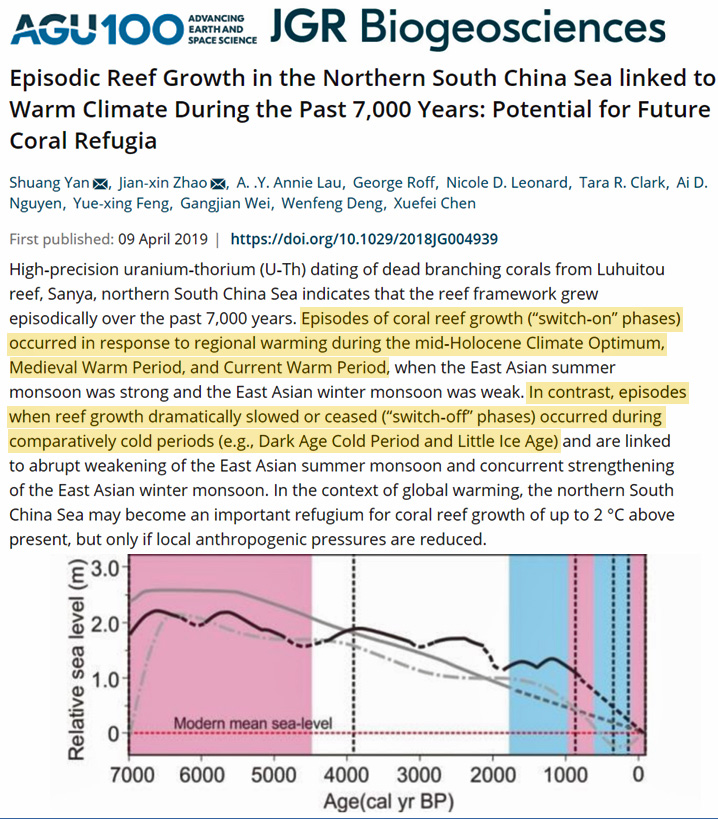
Yan et al., 2021 South China Sea +0.82 to 1.24 m higher than present (Roman and Medieval Warm Periods)
Beachrock is considered a good archive for past sea-levels because of its unique formation position (intertidal zone). To evaluate sea-level history in the northern South China Sea, three well-preserved beachrock outcrops (Beigang, Gongshanbei, and Hengling) at Weizhou Island, northern South China Sea were selected to examine their relative elevation, sedimentological, mineralogical, and geochemical characteristics. Acropora branches with well-preserved surface micro-structures were selected from the beachrocks and used to determine the ages of these beachrocks via U-series dating. The results show that the beachrocks are composed of coral reef sediments, terrigenous clastics, volcanic clastics, and various calcite cements. These sediments accumulated in the intertidal zone of Weizhou Island were then cemented in a meteoric water environment. The U-series ages of beachrocks from Beigang, Gongshanbei, and Hengling are 1712–768 ca. BP, 1766–1070 ca. BP, and 1493–604 ca. BP (before 1950 AD) respectively. Their elevations are 0.91–1.16 m, 0.95–1.24 m, and 0.82–1.17 m higher than the modern homologous sedimentary zones, respectively. Therefore, we concluded that the sea-level in the Meghalayan age (1766–604 ca. BP) was 0.82–1.24 m higher than the present, and that the sea-level over this period showed a declining trend.
Ma et al., 2021 Northern South China Sea +2 m higher than present
[T]he relative sea level near Chenhang Island rose rapidly between 7800 and 6000 yr BP, slowed at ~6000 yr BP, and reached a position of about 2 m above the present-day mean sea level by 3900 yr BP. After 3900 yr BP, the sea level was stable or fell, resulting in a cessation in the reef’s upward development.
Jerardino, 2021 South Africa +1 to 3 m higher than present
The mid-Holocene (ca. 8200–4200 cal BP) brought about important climatic changes and environmental shifts to land and coastal systems, globally. Many of the human groups existing at that time were affected in various degrees by such important modifications to their foraging areas, including shorelines. Higher sea-levels (+1–3 m) were a prominent factor reshaping coastal landscapes and thus affecting coastal foraging in one or more ways.
Hosseinyar et al., 2021 South Africa +3.5 m higher than present
For summarizing Phase III, sedimentological and geochemical analyses of core Qh-B and Bu-A combined with our seismic records show a rapid sea-level rising since 7.1 ka (Fig. 12), resulting in a high-stand around 6 ka, which is the highest sea-level recorded during the past 10,000 years (Fig. 12). … A possible impact of tectonic processes on holocene sea-level fluctuations in the Gulf has indeed been proposed by Wood et al. (2012). In contrast, a few years later another study concluded, however, that the impact of tectonic movements has been negligible, with the implication that eustatic sea level variations have been the primary control of sea level fluctuations in the Gulf (Stevens et al., 2014). … [T]he relative sea-level changes observed in the Persian Gulf are concluded to have been primarily controlled by eustatic changes rather than by local tectonic processes. … Both on the South African and Indian margin of the Indian Ocean Holocene sea-level records demonstrate a well-defined mid-Holocene sea-level highstand reaching a maximum of +3.5 m along the South African coast (Ramsay 1995) and spatially varying between +3 m and +5 m on the Indian margin (Yokoyama et al., 2019; Mann et al., 2019). … In summary, sea-level fluctuations found in our study thus appear to reflect sea-level changes of global character as reported from the Strait of Hormuz area by Regard et al. (2006), Southeast Asia (Stattegger et al., 2013; Horton et al., 2005; Xiong et al., 2018) and the Indian Ocean (Ramsay 1995; Ranasinghe et al., 2013; Yokoyama et al., 2019; Mann et al., 2019).
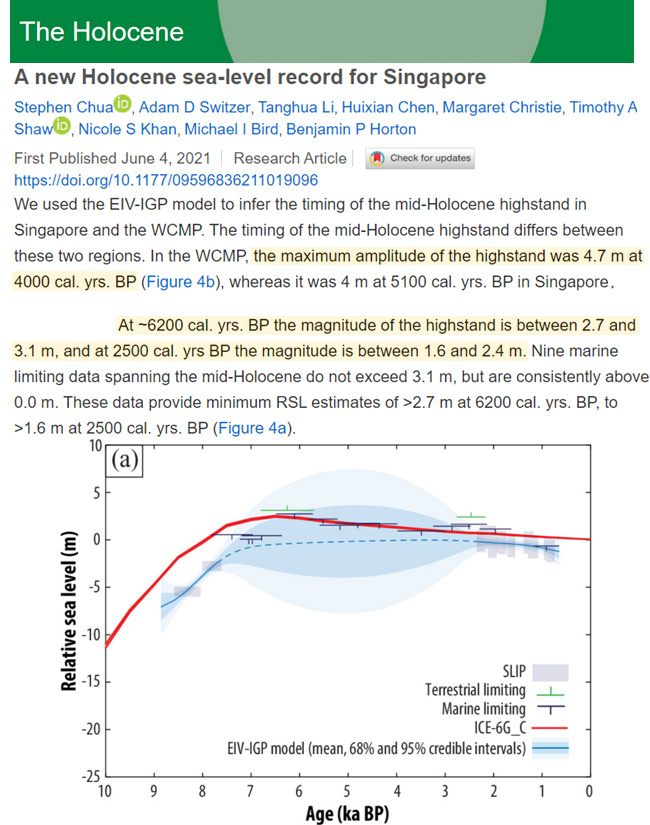
Chua et al., 2021 Singapore +2.7 to 4.7 m higher than present
At ~6200 cal. yrs. BP the magnitude of the highstand is between 2.7 and 3.1 m, and at 2500 cal. yrs BP the magnitude is between 1.6 and 2.4 m. Nine marine limiting data spanning the mid-Holocene do not exceed 3.1 m, but are consistently above 0.0 m. These data provide minimum RSL estimates of >2.7 m at 6200 cal. yrs. BP, to >1.6 m at 2500 cal. yrs. BP (Figure 4a). … We used the EIV-IGP model to infer the timing of the mid-Holocene highstand in Singapore and the WCMP. The timing of the mid-Holocene highstand differs between these two regions. In the WCMP, the maximum amplitude of the highstand was 4.7 m at 4000 cal. yrs. BP (Figure 4b), whereas it was 4 m at 5100 cal. yrs. BP in Singapore (Figure 4c). … Limited evidence of RSL falling below present-day levels during the late-Holocene in far-field regions has been found in northern Brazil (Cohen et al., 2005) and the Maldives (Kench et al., 2019). Kench et al (2019) obtained records showing that sea-level lowstands of up to −1.4 m MSL in the Indian Ocean are coincident with cooler periods during the Late Antiquity Little Ice Age (~1500 to 1300 cal. yrs. BP) and the Little Ice Age (~700 to 100 cal. yrs. BP), but these sea-level variations are too large to be caused by climate-driven thermal contraction/expansion of seawater during the pre-industrial Common Era (Piecuch et al., 2021). The ICE-6G_C GIA model predict a near-linear RSL fall during the late-Holocene without going below 0 m because the model assumes 0 m of sea-level equivalent from the Antarctic ice sheet from 4000 cal. yrs. BP to present (Peltier et al., 2015).
Al-Mikhlafi et al., 2021 Red Sea +0.5 to 1 m higher than present
We demonstrate the utility of wave-cut notches in the southern Red Sea, and present U-series dated sea-level indicators from two locations on the As-Salif Peninsula that suggest a mid-Holocene highstand of ∼0.5–1 m above present mean sea level (apmsl) at about 5–5.4 ka BP.
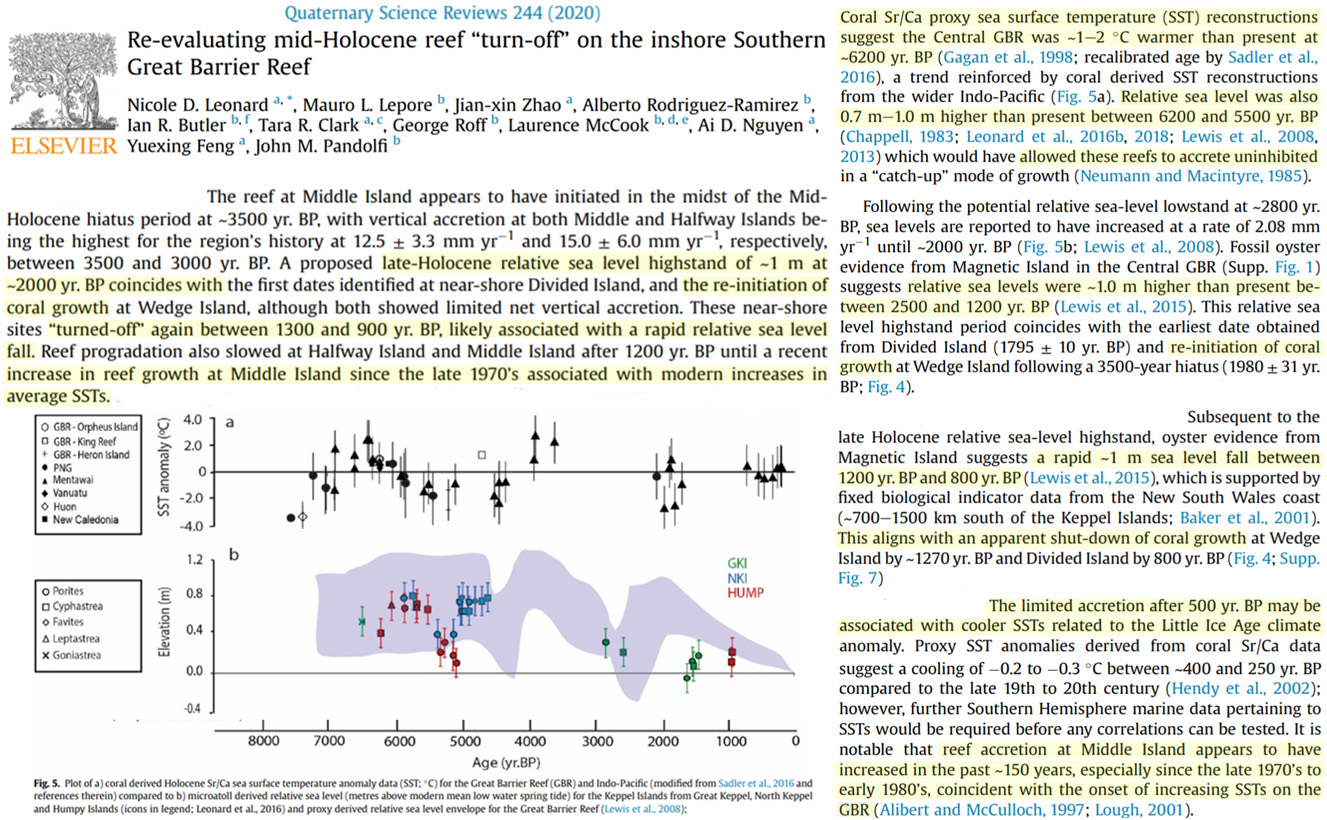
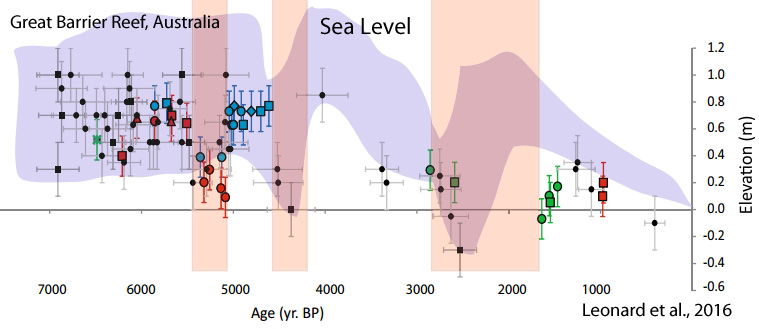
Leonard et al., 2020 Great Barrier Reef, +0.7 to 1 m higher than present
“[L]ate-Holocene relative sea level highstand of ~1 m at ~2000 yr. BP … “Relative sea level was also 0.7 m-1.0 m higher than present between 6200 and 5500 yr. BP“
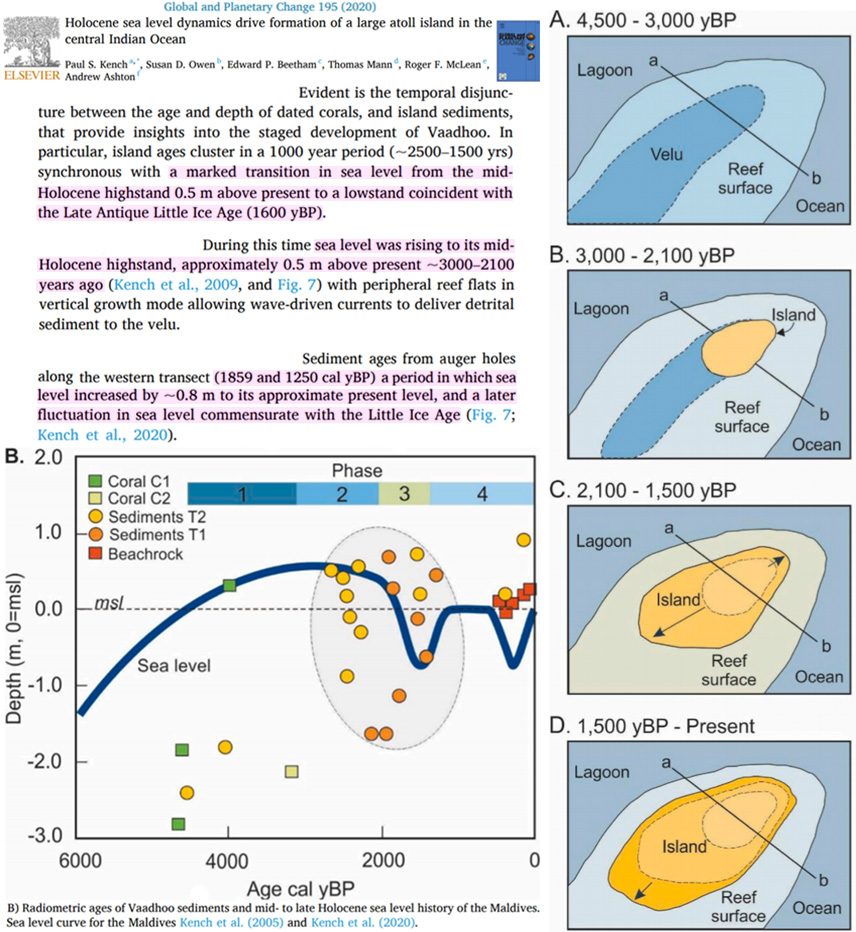
Kench et al., 2020 Maldives, +0.5 m higher than present
“Evident is the temporal disjuncture between the age and depth of dated corals, and island sediments, that provide insights into the staged development of Vaadhoo. In particular, island ages cluster in a 1000 year period (~2500–1500 yrs) synchronous with a marked transition in sea level from the mid-Holocene highstand 0.5 m above present to a lowstand coincident with the Late Antique Little Ice Age (1600 yBP). … Sediment ages from auger holes along the western transect (1859 and 1250 cal yBP) … a period in which sea level increased by ~0.8 m to its approximate present level, and a later fluctuation in sea level commensurate with the Little Ice Age.”
Parker et al., 2020 East Saudi Arabia, +2.8 – 3.75 m higher than present
“The sediments record rapid transgression during the early Holocene with a mid-Holocene high-stand immediately prior to 6880-6560 cal. BP when the upper limit for the palaeo Mean Highest High tide water (MHHW) was 2.8-3.10 m above present day mean sea level. Transgression continued until shortly after 5575-5310 cal. BP with an upper limit to the palaeo-MHHW of 3.75 m above present sea levels.”
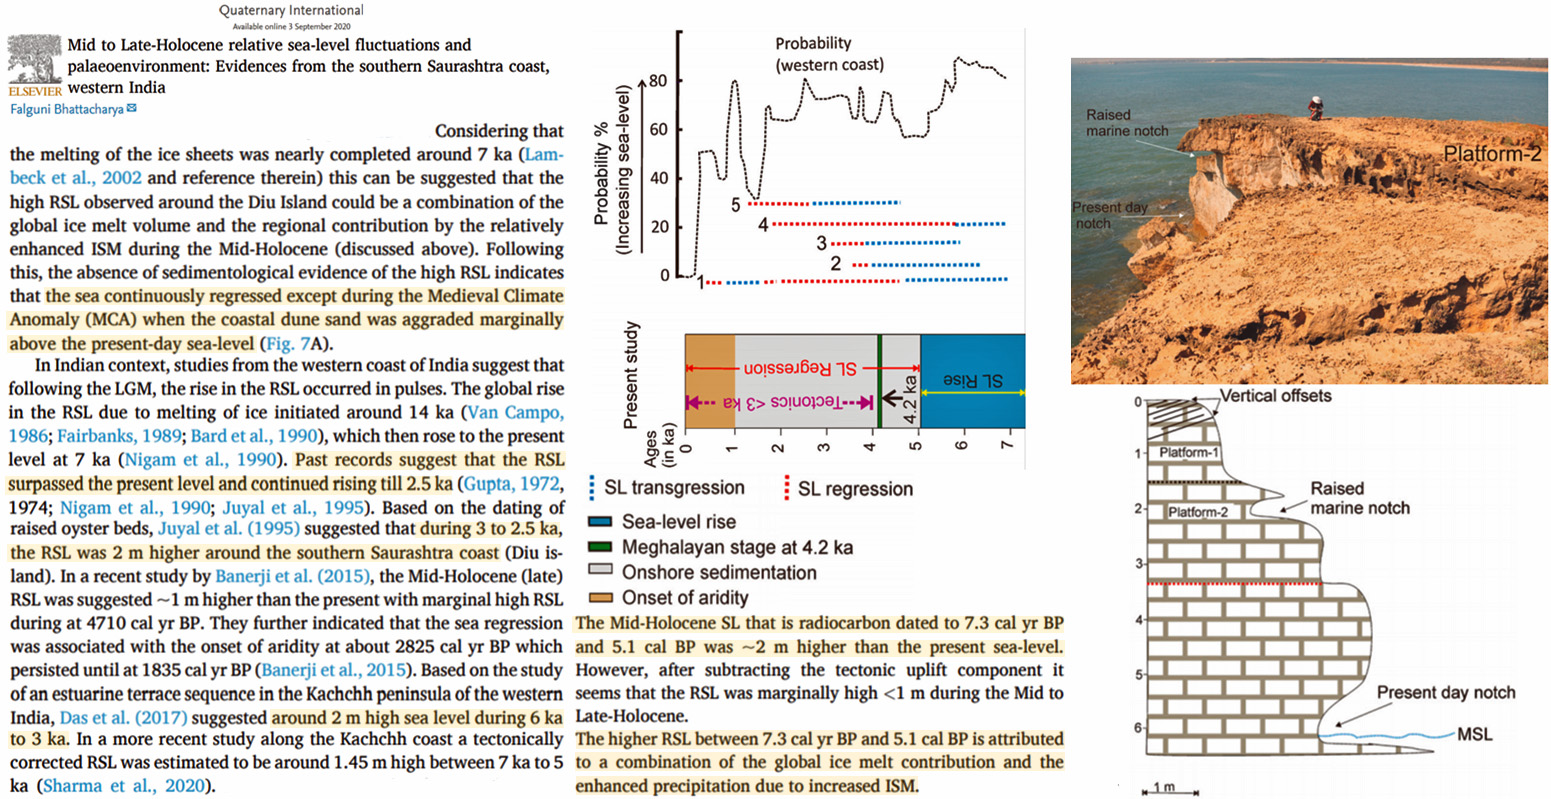
Bhattacharya, 2020 Western India, +2 m higher than present
“The Mid-Holocene SL [sea level] that is radiocarbon dated to 7.3 cal yr BP and 5.1 cal BP was ~2 m higher than the present sea level.”
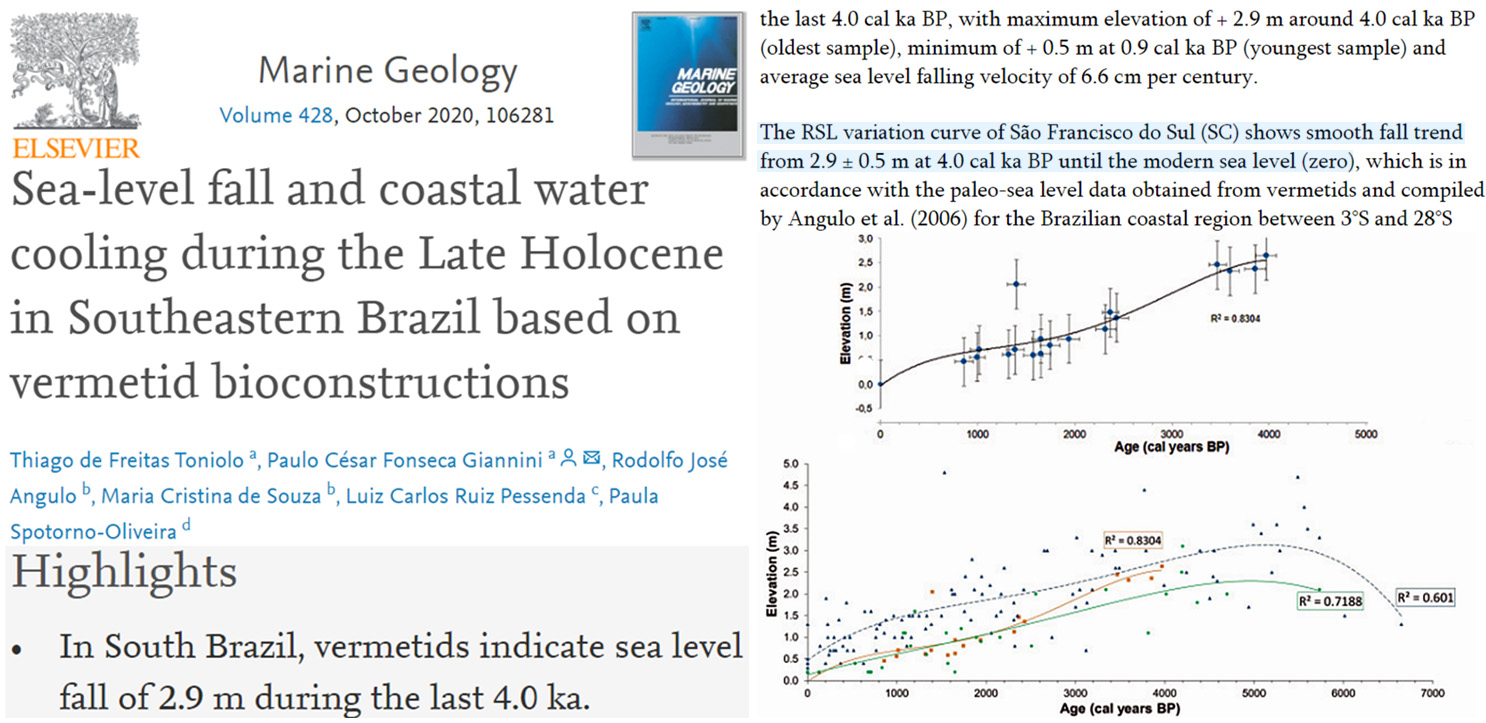
Toniolo et al., 2020 Brazil, +2.9 m higher than present
“In South Brazil, vermetids indicate sea level fall of 2.9 m during the last 4.0 ka. … [T]he last 4.0 cal ka BP, with maximum elevation of + 2.9 m around 4.0 cal ka BP (oldest sample), minimum of + 0.5 m at 0.9 cal ka BP (youngest sample) and average sea level falling velocity of 6.6 cm per century. … The RSL variation curve of São Francisco do Sul (SC) shows smooth fall trend from 2.9 ± 0.5 m at 4.0 cal ka BP until the modern sea level (zero), which is in accordance with the paleo-sea level data obtained from vermetids and compiled by Angulo et al. (2006) for the Brazilian coastal region between 3°S and 28°S (Fig. 6).”
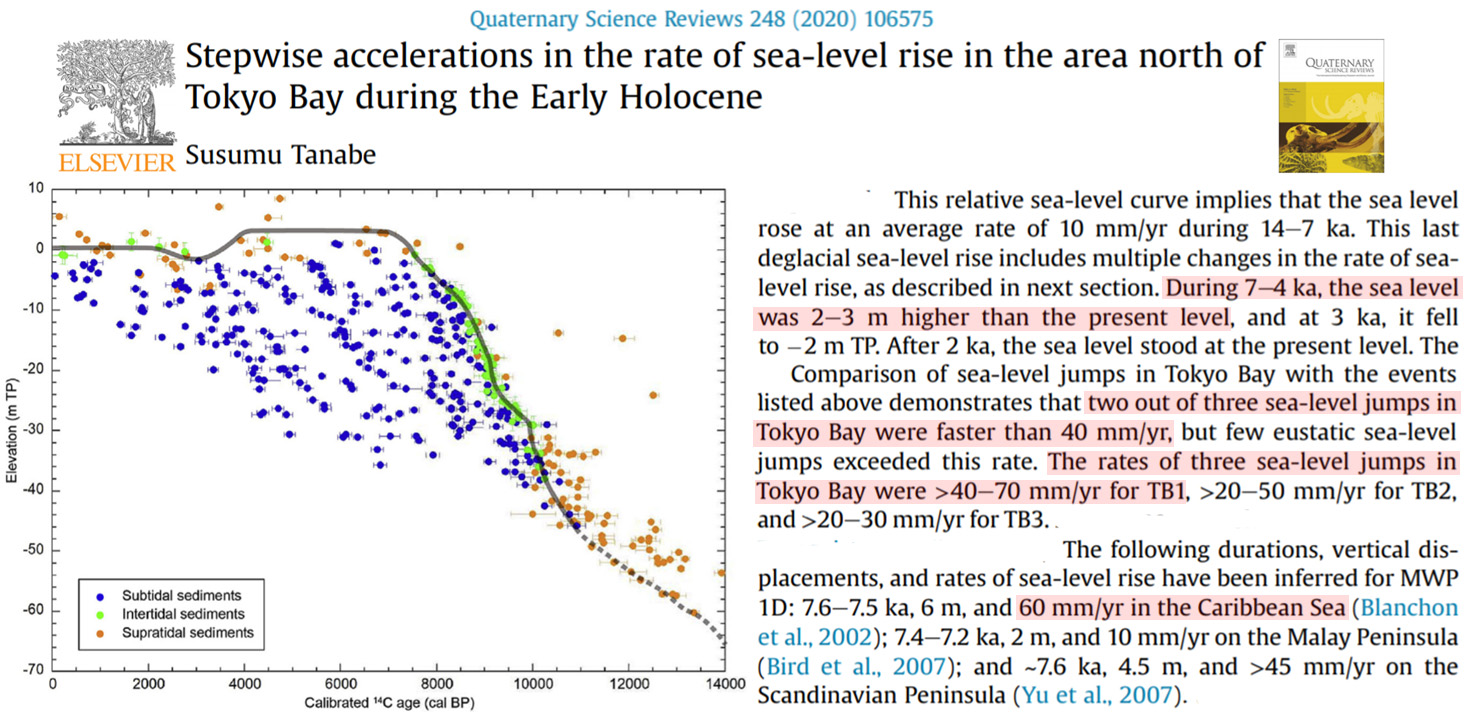
Tanabe, 2020 Japan, +2-3 m higher than present (rate: 40-70 mm/yr)
“During 7-4 ka, the sea level was 2-3 m higher than the present level, and at 3 ka, it fell to -2 m TP. After 2 ka, the sea level stood at the present level. … The following durations, vertical displacements, and rates of sea-level rise have been inferred for MWP1D: 7.6-7.5 ka, 6 m, and 60 mm/yr in the Caribbean Sea (Blanchon et al., 2002) … The rates of three sea-level jumps in Tokyo Bay were >40-70 mm/yr for TB1, >20-50 mm/yr for TB2, and >20-30 mm/yr for TB3.”
Helm et al., 2020 South Africa, +6 to 8 m higher than present last interglacial
“Around 126 ka, sea levels were 6.6-8 m higher than present levels on the Cape south coast [of South Africa]. … Chronological context11 suggests an age of MIS 5e (the Last Interglacial). As sea levels during MIS 5e in this area were up to 6-8 m higher than at present, a warmer climate capable of supporting large reptiles on the Cape south coast can be inferred.”
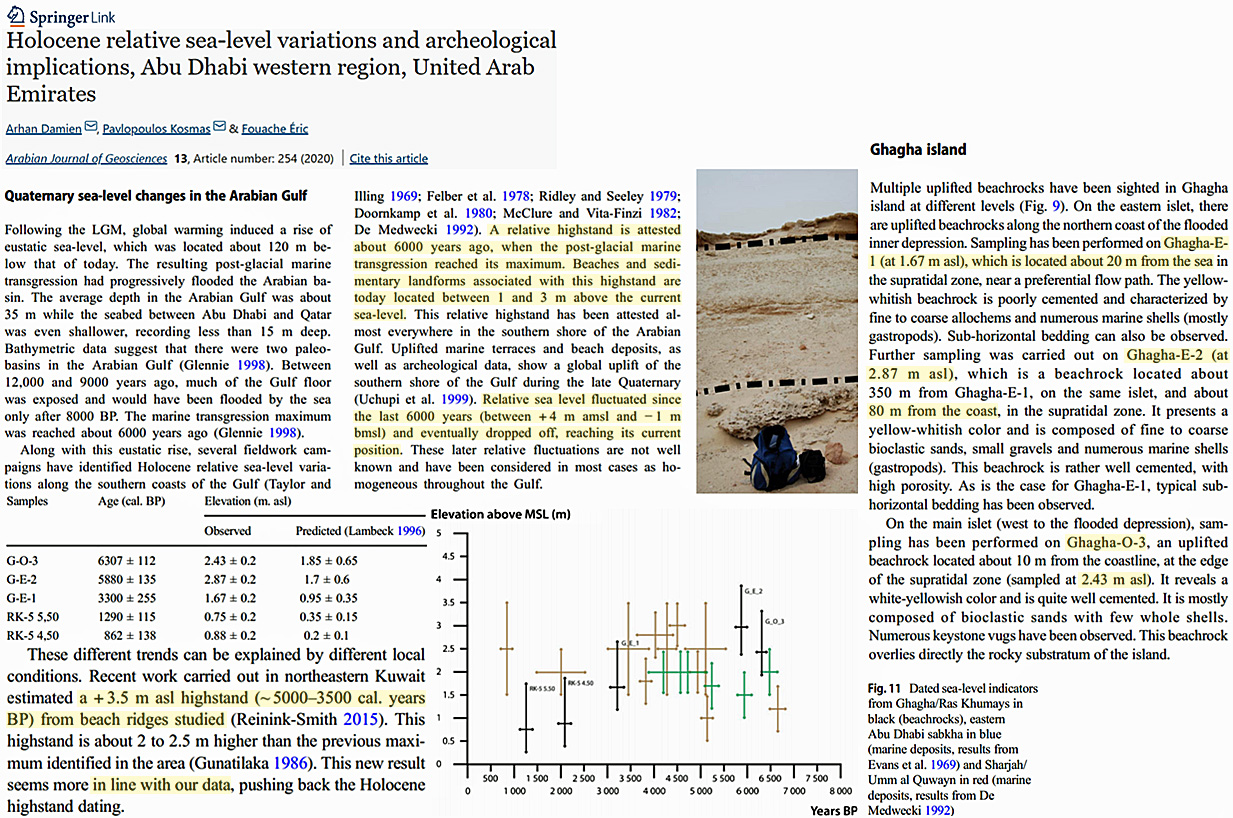
Damien et al., 2020 Arabian Gulf, +2.5 m higher than present
“These different trends can be explained by different local conditions. Recent work carried out in northeastern Kuwait estimated a +3.5 m asl [higher than present] highstand (~ 5000–3500 cal. years BP) from beach ridges studied (Reinink-Smith 2015). This highstand is about 2 to 2.5 m higher than the previous maximum identified in the area (Gunatilaka 1986). This new result seems more in line with our data, pushing back the Holocene highstand dating. … [L]andforms associated with this highstand [about 6000 years ago] are today located between 1 and 3 m above the current sea-level.”
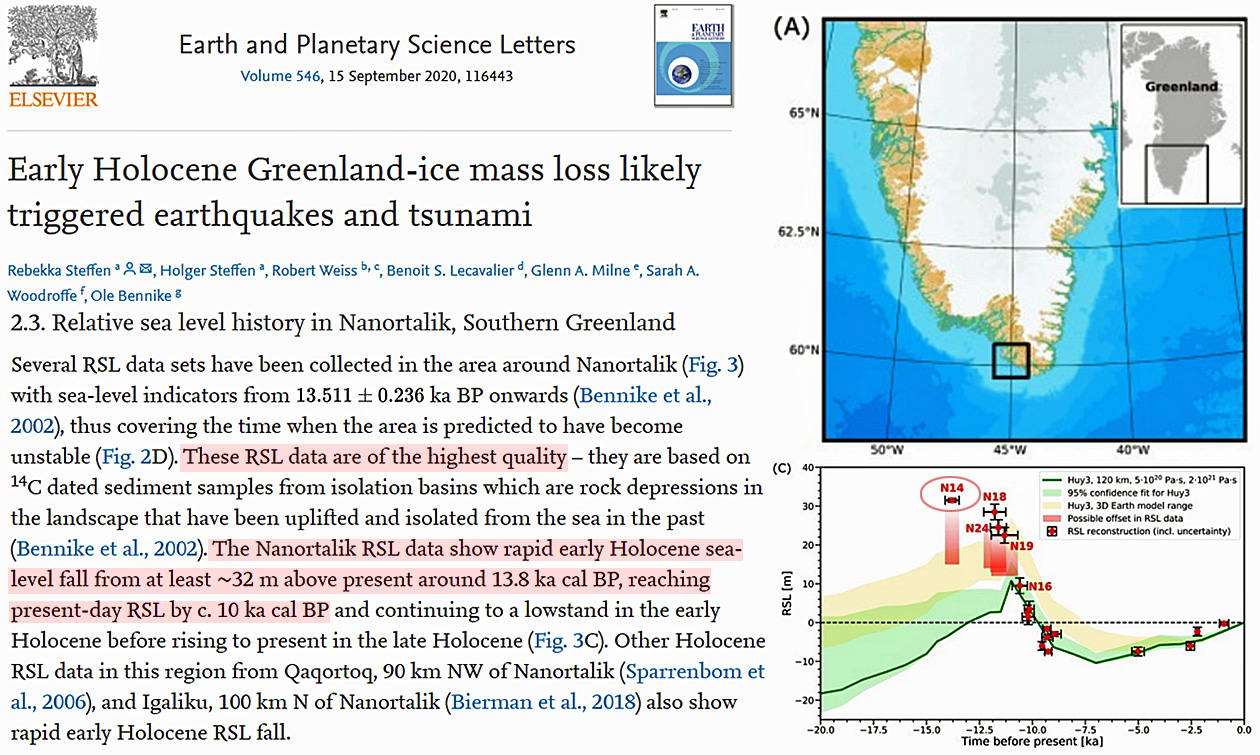
Steffen et al., 2020 Greenland, +32 m above present (13.8 ka)
“The Nanortalik RSL data show rapid early Holocene sea-level fall from at least ∼32 m above present around 13.8 ka cal BP, reaching present-day RSL by c. 10 ka cal BP and continuing to a lowstand in the early Holocene before rising to present in the late Holocene”
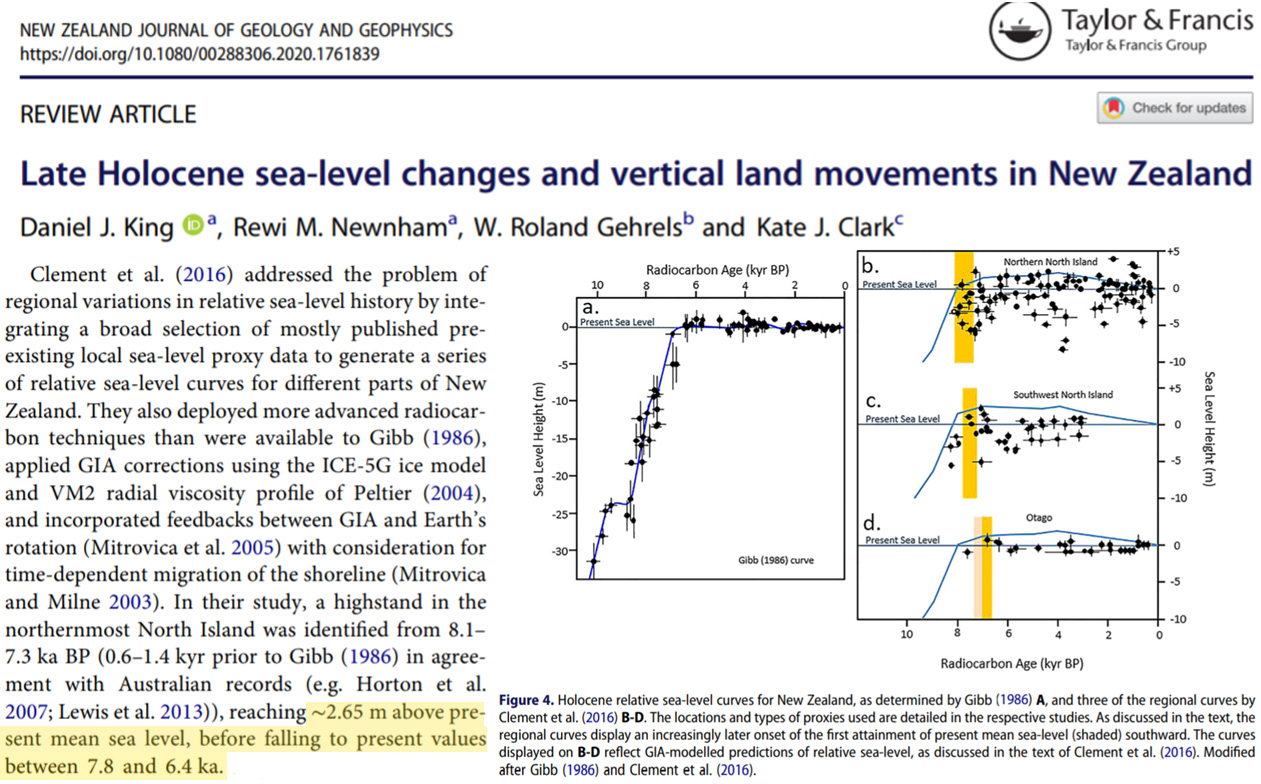
King et al., 2020 New Zealand, +2.65 m above present
“Regional tectonics dominate the relative sea-level signature across much of New Zealand, and trends of uplift and subsidence can vary significantly depending on the timescale of analysis. … Clement et al. (2016) addressed the problem of regional variations in relative sea-level history by integrating a broad selection of mostly published preexisting local sea-level proxy data to generate a series of relative sea-level curves for different parts of New Zealand. … In their study, a highstand in the northernmost North Island was identified from 8.1–7.3 ka BP (0.6–1.4 kyr prior to Gibb (1986) in agreement with Australian records (e.g. Horton et al. 2007; Lewis et al. 2013)), reaching ∼2.65 m above present mean sea level, before falling to present values between 7.8 and 6.4 ka.”
Lopez-Belzunce et al., 2020 Mediterranean, +1-1.2 m higher than present
“Regarding the stabilization of the RSL [relative sea level], our data show it to be 1.20 m above the present-day level at 3000 cal yr BP and 1 m higher at 2000 cal yr BP.”
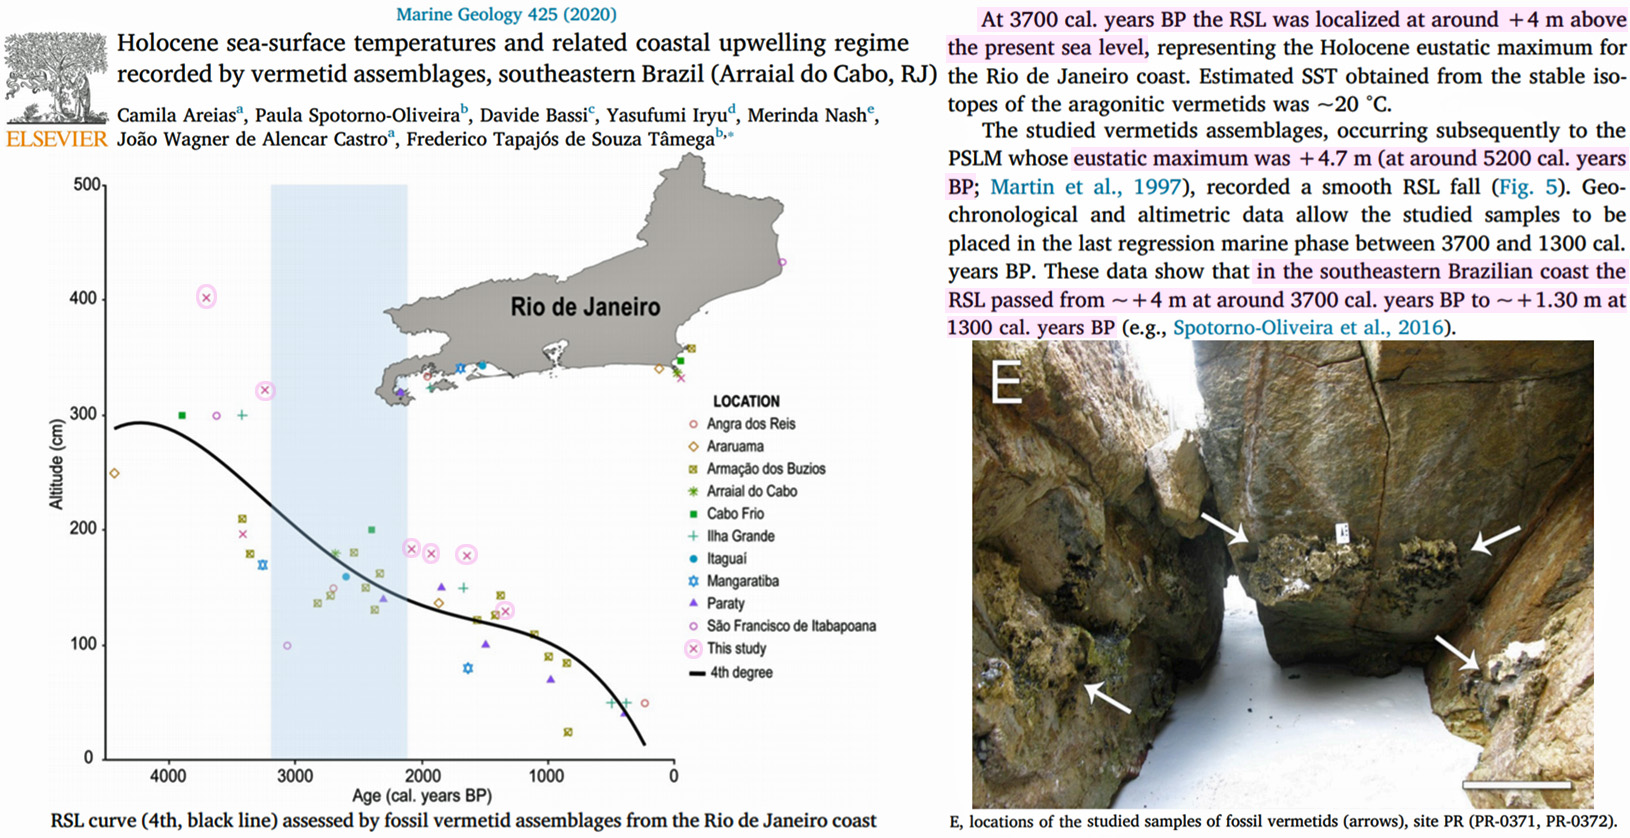
Areias et al., 2020 Brazil, +4 m higher than present
“At 3700 cal. years BP the RSL was localized at around +4 m above the present sea level, representing the Holocene eustatic maximum for the Rio de Janeiro coast. Estimated SST obtained from the stable isotopes of the aragonitic vermetids was ~20 °C. At ~3300 cal. years BP during the RSL fall the SST reached its upper-Holocene maximum temperature of ~22 °C. At ~2000 cal. years BP, the RSL was +2 m and an intensification of the upwelling events brought about lower SST (~17 °C) in the intertidal/supratidal settings than offshore. … The following period (from ~1900 to ~1300 cal. years BP), characterized by a continuous sea-level fall, recorded a SST of ~20.5 °C, higher than before. … These data show that in the southeastern Brazilian coast the RSL passed from ~ + 4 m at around 3700 cal. years BP to ~ + 1.30 m at 1300 cal. years BP (e.g., Spotorno-Oliveira et al., 2016).”
Sissakian et al., 2020 Persian Gulf, +1-2 m above present
“[G]eologists do believe that the Gulf was a dry area and was filled due to melting of huge amounts of ice; accordingly, the shoreline started progressing landwards. After that, due to climate change, the shoreline started retreating downwards due to the delta development of the Tigris, Euphrates and Karun rivers. The present shoreline was reached shortly before 6,000 years ago and exceeded as relative sea level rose (l – 2) m above its present level inundating the low-lying areas of lower Mesopotamia.”
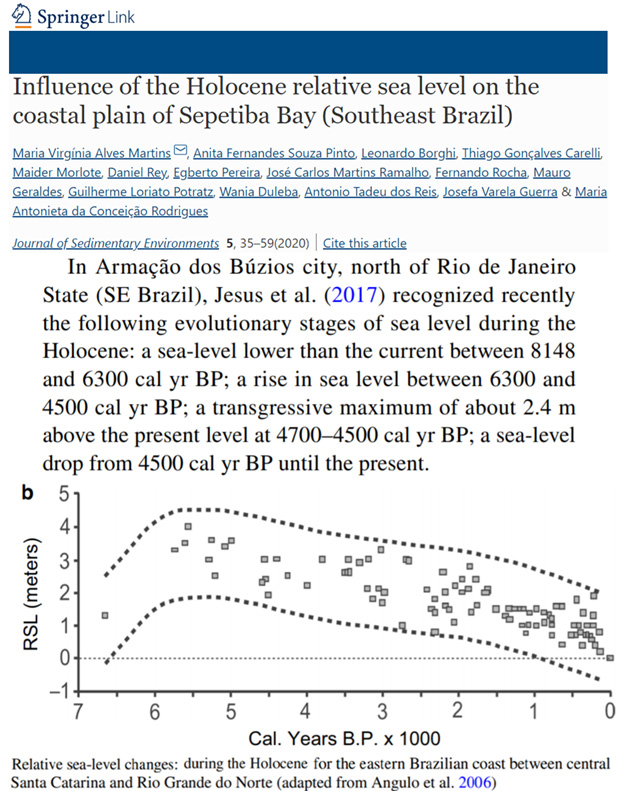
Martins et al., 2020 SE Brazil, +2.4 m above present
“In Armação dos Búzios city, north of Rio de Janeiro State (SE Brazil), Jesus et al. (2017) recognized recently the following evolutionary stages of sea level during the Holocene: a sea-level lower than the current between 8148 and 6300 cal yr BP; a rise in sea level between 6300 and 4500 cal yr BP; a transgressive maximum of about 2.4 m above the present level at 4700–4500 cal yr BP; a sea-level drop from 4500 cal yr BP until the present.”
Garrett et al., 2020 Chile, +3-6 m above present
“GIA model predictions display a high degree of variability along the Chilean coastline. The two northernmost regions are characterised by modelled mid Holocene highstands 1.5-5.5 m above present between 7 ka and 4 ka (Fig. 7a and b). The five central regions between Valparaíso and Isla Mocha share modelled highstands 3-6 m above present at 7 ka or 6 ka (Fig. 7ceg).”
Ma et al., 2020 NE China, +2.3 m above present
“The Bachagou Lagoon plain in the south of Changxing Island reached the high sea level of the Holocene about 6000 years ago, which was 2.2 to 2.4 m higher than the present sea level (Fang et al., 2009).”
Clark et al., 2020 Global sea levels +6-9 m above present (Last Interglacial)
“Although the last interglaciation (LIG) experienced stronger boreal summer insolation forcing than the present interglaciation, understanding why LIG global mean sea level may have been six to nine metres higher than today has proven particularly challenging. Extensive areas of polar ice sheets were grounded below sea level during both glacial and interglacial periods, with grounding lines and fringing ice shelves extending onto continental shelves. This suggests that oceanic forcing by subsurface warming may also have contributed to ice-sheet loss analogous to ongoing changes in the Antarctic and Greenland ice sheets. Such forcing would have been especially effective during glacial periods, when the Atlantic Meridional Overturning Circulation (AMOC) experienced large variations on millennial timescales, with a reduction of the AMOC causing subsurface warming throughout much of the Atlantic basin.”
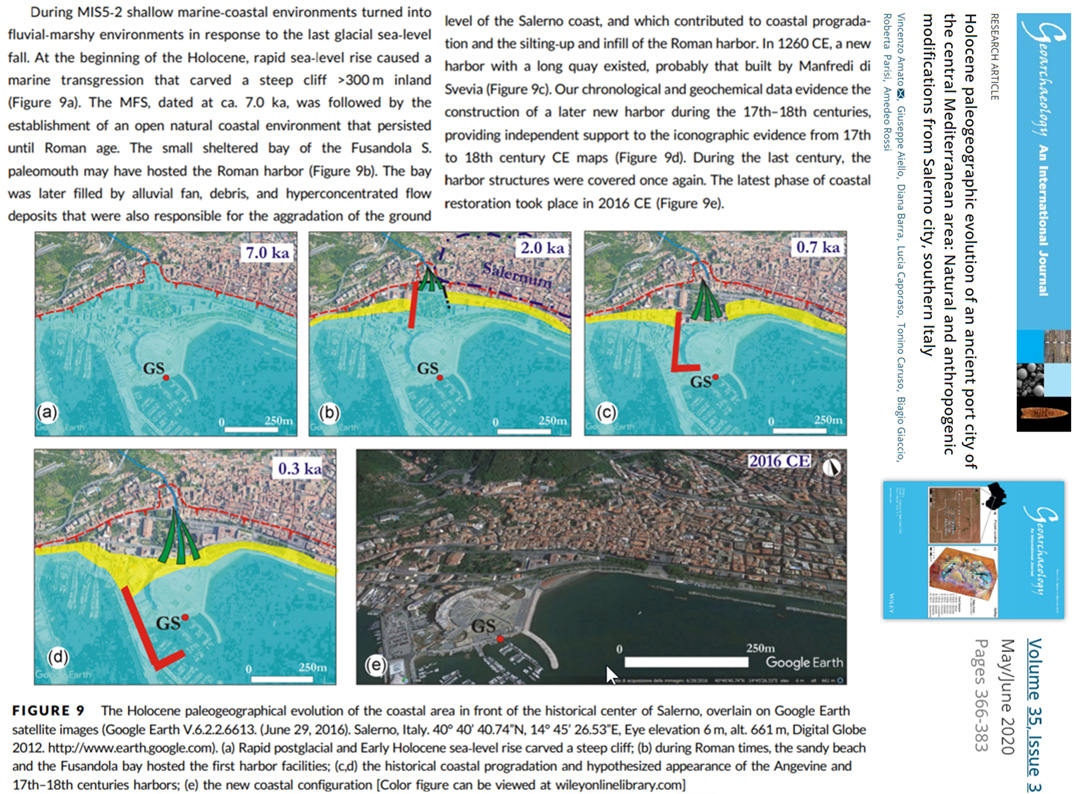
Amato et al., 2020 Italy, current coast still underwater just 300 years ago (0.3 ka)
“During MIS5‐2 shallow marine‐coastal environments turned into fluvial‐marshy environments in response to the last glacial sea‐level fall. At the beginning of the Holocene, rapid sea‐level rise caused a marine transgression that carved a steep cliff >300 m inland (Figure 9a). The MFS, dated at ca. 7.0 ka, was followed by the establishment of an open natural coastal environment that persisted until Roman age. The small sheltered bay of the Fusandola S. paleomouth may have hosted the Roman harbor (Figure 9b). … In 1260 CE, a new harbor with a long quay existed, probably that built by Manfredi di Svevia (Figure 9c). Our chronological and geochemical data evidence the construction of a later new harbor during the 17th–18th centuries, providing independent support to the iconographic evidence from 17th to 18th century CE maps (Figure 9d). During the last century, the harbor structures were covered once again. The latest phase of coastal restoration took place in 2016 CE (Figure 9e).”
Muh et al., 2020 Bahamas and Bermuda, at least +7 to 9 m higher than present, last interglacial
“Corals with closed-system histories collected from patch reefs on NPI have ages of 128-118 ka and ooids/peloids from beach ridges have closed-system ages of 128-116 ka. Elevations of patch reefs indicate a LIG paleo-sea level of at least ∼7 m to ∼9 m above present. Beach ridge sediments indicate paleo-sea levels of ∼5 m to ∼14 m (assuming subsidence, ∼7 m to ∼16 m) above present during the LIG. …. Results of this study show that at the end of the LIG paleo-sea levels could have been as high as 11-13 m above present (at localities close to North American ice sheets) to as little as 5-8 m above present (at localities distant from North American ice sheets).”
Burley et al., 2020 Polynesia, +1.2-1.4 m higher than present
“At the time of first Lapita arrival at Nukuleka, sea levels were 1.2–1.4 m higher than present (Dickinson 2007).”
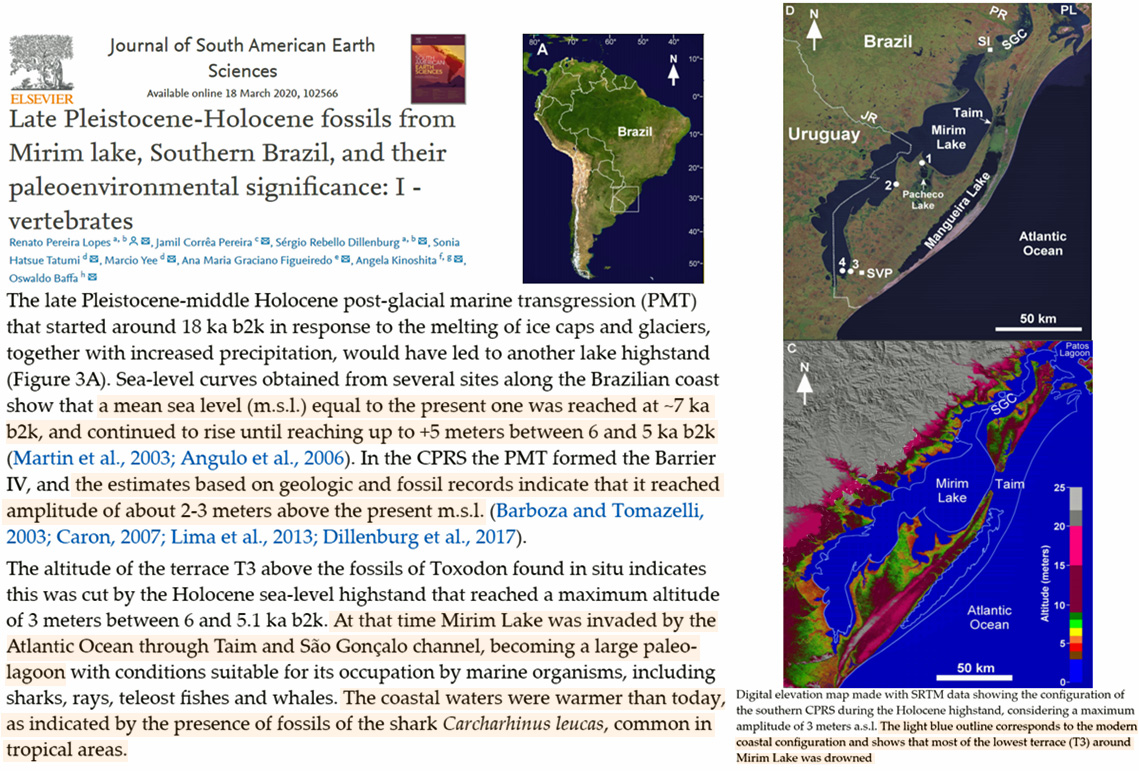
Lopes et al., 2020 Brazil, +3 m higher than present
“The late Pleistocene-middle Holocene post-glacial marine transgression (PMT) that started around 18 ka b2k in response to the melting of ice caps and glaciers, together with increased precipitation, would have led to another lake highstand (Figure 3A). Sea-level curves obtained from several sites along the Brazilian coast show that a mean sea level (m.s.l.) equal to the present one was reached at ~7 ka b2k, and continued to rise until reaching up to +5 meters between 6 and 5 ka b2k (Martin et al., 2003; Angulo et al., 2006). In the CPRS the PMT formed the Barrier IV, and the estimates based on geologic and fossil records indicate that it reached amplitude of about 2-3 meters above the present m.s.l. (Barboza and Tomazelli, 2003; Caron, 2007; Lima et al., 2013; Dillenburg et al., 2017).”
“The altitude of the terrace T3 above the fossils of Toxodon found in situ indicates this was cut by the Holocene sea-level highstand that reached a maximum altitude of 3 meters [above present] between 6 and 5.1 ka b2k. At that time Mirim Lake was invaded by the Atlantic Ocean through Taim and São Gonçalo channel, becoming a large paleo-lagoon with conditions suitable for its occupation by marine organisms, including sharks, rays, teleost fishes and whales. The coastal waters were warmer than today, as indicated by the presence of fossils of the shark Carcharhinus leucas, common in tropical areas.”
Brocx and Semeniuk, 2020 Western Australia, +1 m higher than present
“The Holocene stratigraphy in the Walpole–Nornalup Inlet Estuary shows that mean sea level was 1 m higher than present some 2900–1200 years BP (Semeniuk et al., 2011).”
Helfensdorfer, 2020 Australia, +2 m higher than present
“This study presents a well-constrained model of the geomorphic evolution of the lower Murray River and Murray estuary with a specific focus on the response of the system to the Holocene sea-level highstand. Hydrodynamic modelling of the lower Murray River and Murray estuary was conducted to evaluate the primary drivers of palaeo-environmental change during the Holocene and constrain the plausible response of the Murray estuary to the +2 m higher-than-present sea level of the Holocene sea-level highstand.”
Martin et al., 2020 Western Australia, +2 m higher than present
“Sea level high stands (~2 m higher than present) occurred at ~7 and 4 ka (Gouramanis et al., 2012) that likely caused seawater intrusion events into the aquifer”
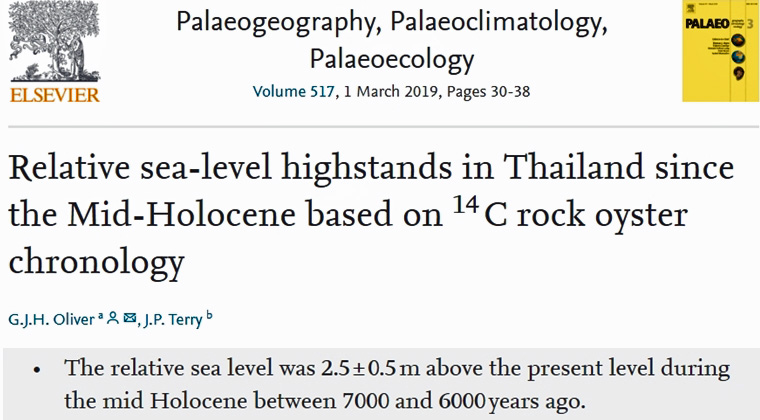
Oliver and Terry, 2019 Thailand, +2.0 to 3.8 m higher than present
“~6000 cal yr B.P. old oysters can be found from between 3.8 ± 0.1 m to 2.5 ± 0.1 m above present day mean sea level. … Dead (fossil) oysters were collected from between 1 and 3 m above the centre of the live oyster band in a more sheltered cleft inside the notch. The oldest sample with an age of 5270–4950 cal yr B.P. was collected at an elevation of 3.01 ± 0.1 m above the apex of the notch. The ages decrease with elevation down to 920–710 cal yr B.P. at 1.03 m. … In all the sites, the 14C age of the dead oysters inside the notches increases with increasing elevation above present day MSL. Clearly, relative sea level was 2 to 3 m higher than present between 6000 and 3000 B.P. and has steadily fallen since.”
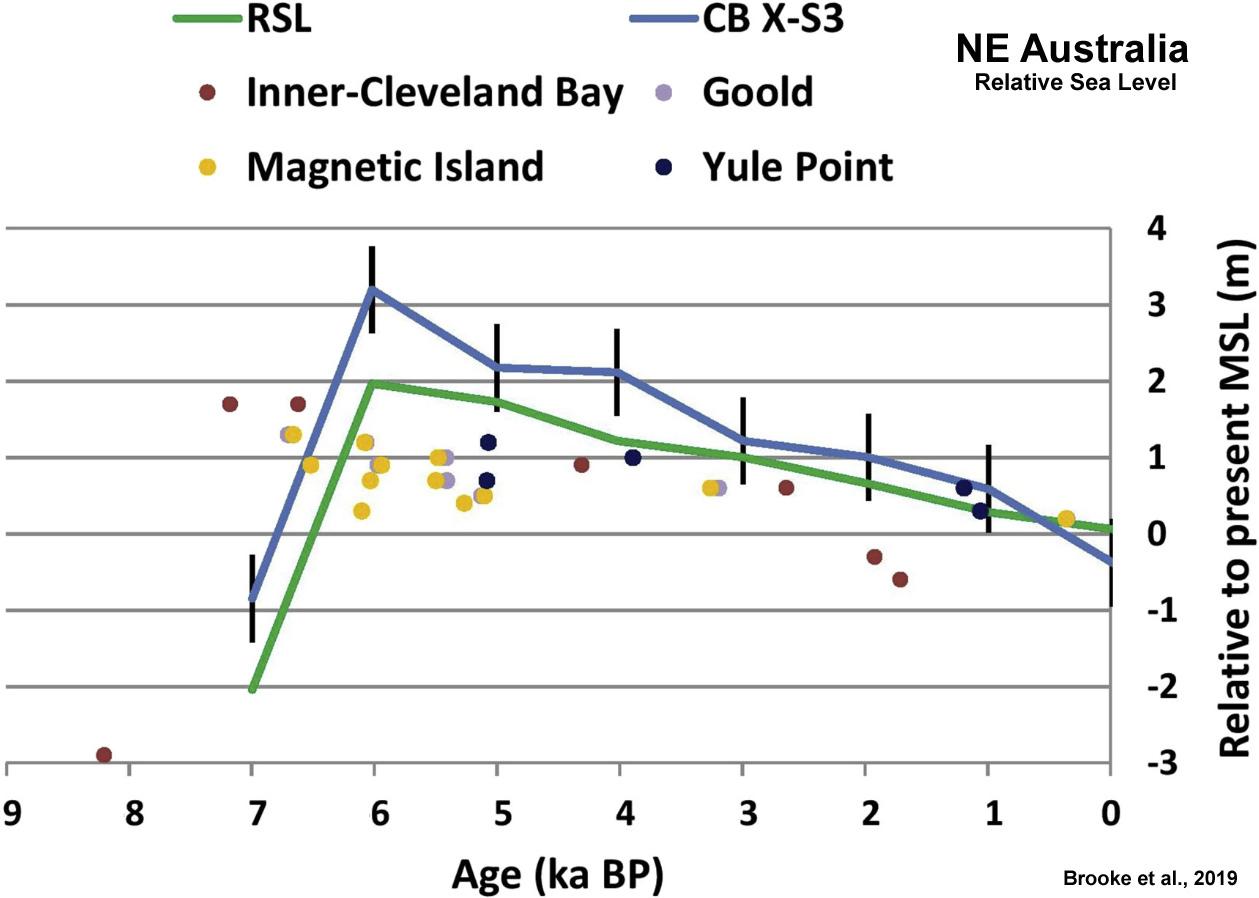
Brooke et al., 2019 Queensland (NE Australia), +1-2 m higher than present
“Indicator data for Queensland have been assessed for their accuracy and robustness by Lambeck et al. (2014), who identified a number of coastal and inner shelf island sites in the northeastern region, in which Cowley Beach is located (Fig. 1), where accurately dated in situ fossil coral, coral microatolls and sediment core samples provide robust sea-level records (Chappell, 1983; Chappell et al., 1983; Horton et al., 2007; Yu and Zhao, 2010; Zwartz, 1995; Fig. 3). Here, relative sea level reached a Holocene highstand between 6770 and 5520 yr BP approximately 1–2 m above the present level (Lewis et al., 2013; Fig. 3). Following the highstand, the data record a gradual fall in sea level to the present position (Perry and Smithers, 2011; Lambeck et al., 2014). … Local and regional records for the Holocene at far-field sites may also reflect the influence of climatic variations on sea level, such as shifts in the El Nino Southern Oscillation (ENSO), that can induce minor (<0.5 m) changes in sea level (Duke et al., 2017; Leonard et al., 2018; Sloss et al., 2018) on annual to multi-decadal, rather than millennial, timescales.”
Yamano et al., 2019 SW Japan, +1.1 to 1.2 m higher than present
“Evidence from the core samples and fossil microatolls suggests sea level reached its present position before 5100 cal yr B.P., and a relative sea-level highstand of 1.1–1.2 m above the present sea level occurred from 5100 to 3600 cal yr B.P. This was followed by a gradual fall in relative sea level. The tectonically corrected sea-level curve indicates a stable sea level after 5100 cal yr BP., with a sea-level highstand of up to 0.4 m between 5100 and 3600 cal yr B.P.”
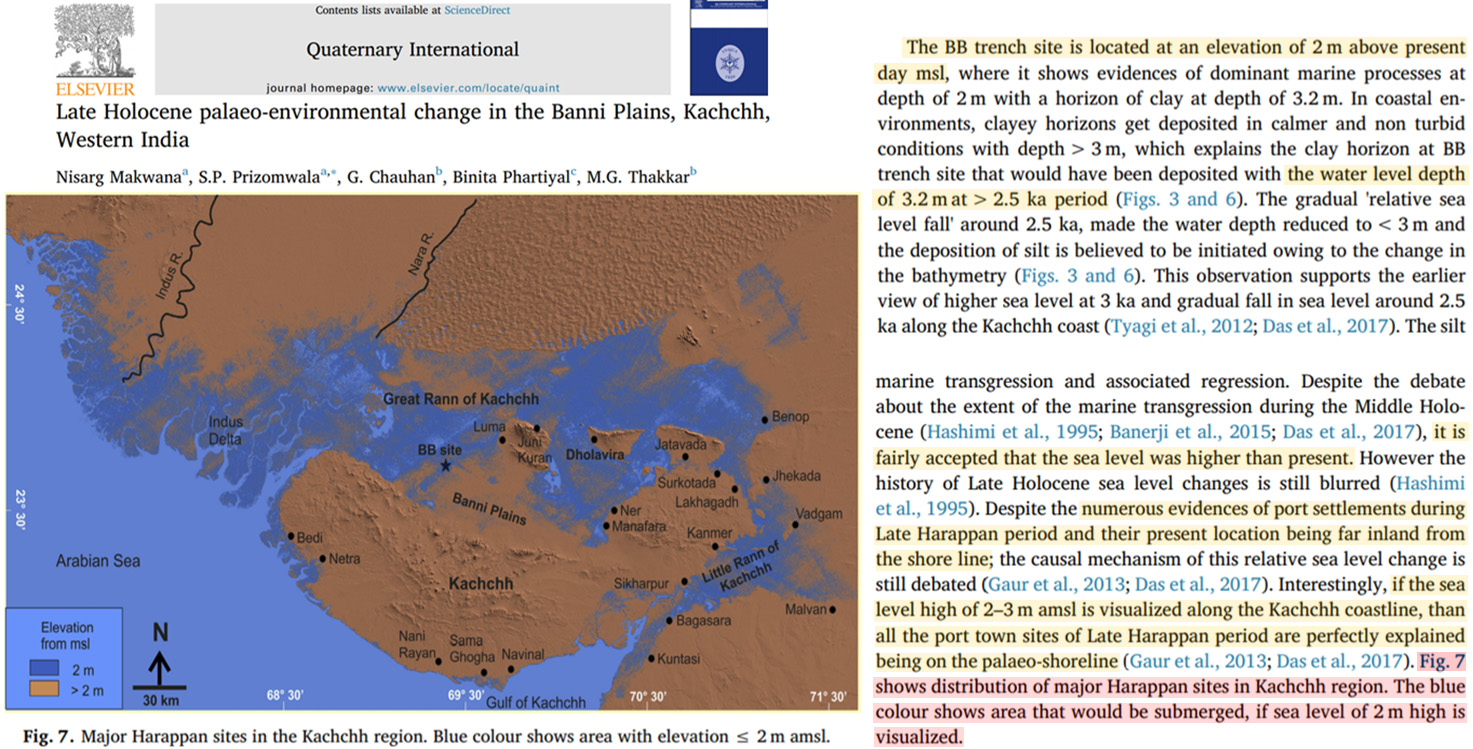
Makwana et al., 2019 Western India, +2 to 3 m higher than present
“The BB trench site is located at an elevation of 2 m above present day msl, where it shows evidences of dominant marine processes at depth of 2 m with a horizon of clay at depth of 3.2 m. In coastal environments, clayey horizons get deposited in calmer and non turbid conditions with depth > 3 m, which explains the clay horizon at BB trench site that would have been deposited with the water level depth of 3.2 m at > 2.5 ka period.”
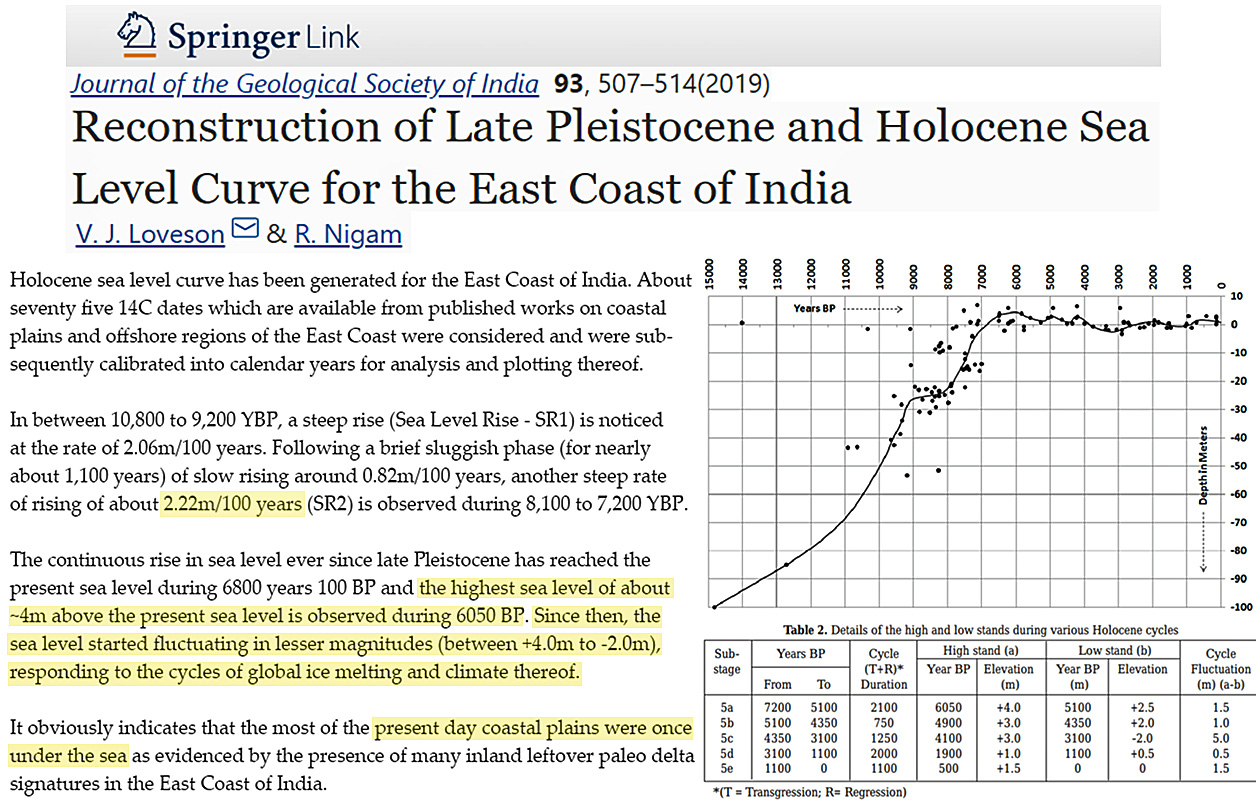
Loveson and Nigam, 2019 Eastern India, +4 m higher than present
“The continuous rise in sea level ever since late Pleistocene has reached the present sea level during 6800 years 100 BP and the highest sea level of about ~4m above the present sea level is observed during 6050 BP. Since then, the sea level started fluctuating in lesser magnitudes (between +4.0m to -2.0m), responding to the cycles of global ice melting and climate thereof. … It is also observed that the magnitude of all five high stands in between 7,200 to the recent has a decreasing trend from +4m to 0m. It obviously indicates that the most of the present day coastal plains were once under the sea as evidenced by the presence of many inland leftover paleo delta signatures in the East Coast of India.”
Oliver et al., 2019 South Australia, +2 m higher than present
“Raised beach strata imaged with Ground Penetrating Radar (GPR) at Rivoli Bay suggest a sea-level highstand of +2 m above present ~3500 years ago, steadily falling and reaching the present ~1000 years ago.”
Kylander et al., 2019 Scotland, +9 m higher than present
“At present, the Laphroaig bog is edged by a dune system, but this sand source may have looked very different at the time peat accumulation started 6670 cal. a BP. A primary control on dune building is RSL. Glacial isostatic modelling, supported by radiocarbon-dated sea-level index points, show that the RSL on Islay was about 9 m higher at 6000 cal. a BP, and fell in a linear fashion to 2.2 m higher than present at 2000–1000 cal. a BP (Fig. 7C;Dawsonet al. 1998; Shennan et al. 2006a,b).”
Meeder and Harlem, 2019 Southeast Florida (USA), +1-1.3 m higher than present
“Sea level was at ca 8 m above present during the last interglacial ca 120,000 yr bp inundating the entire platform during deposition of the Miami Limestone strata (Moore, 1982) … The marls form a leaky seal on the Everglades floor (Figure 14B) slowing water infiltration and storing water, increasing the hydroperiod and providing an environment suitable for peat deposition which started ca 4,500 yr bp (Gleason & Stone, 1994) at elevations between 1 and 1.3 m above present sea level (Wanless et al., 1994). … The historic high‐water stage occurred prior to drainage when the water stage was between 0.6 and 2 m higher than present in the study area (McVoy et al., 2011; Parker, 1975; Parker et al., 1955).”
Cuttler et al., 2019 Western Australia, +1-2 m higher than present
“Ningaloo Reef grew over the last ~8,000 years (Twiggs and Collins, 2010) with rapid reef build up ceasing ~5.8 ka BP when sea level was approximately 1 to 2 m higher than present. During this phase of development, benthic cover was dominated by reef-building corals (Collins et al., 2003; Twiggs and Collins, 2010). After this sea level highstand, reef evolution at Ningaloo was characterised as ‘detrital build-up and aggradational’ as sea level fell to present levels and the reef back-stepped (seaward) to its present location (Twiggs and Collins, 2010).”
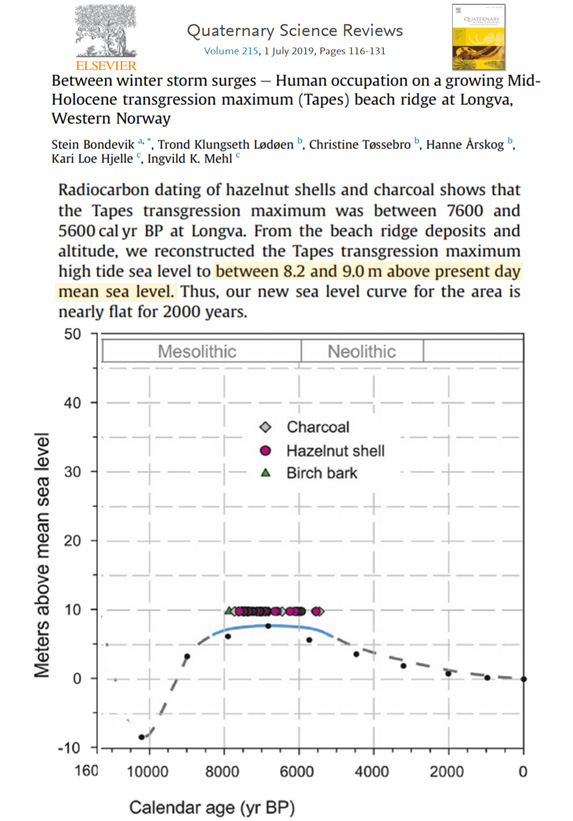
Bondevik et al., 2019 Western Norway, +8.2 to +9 m higher than present
“We conclude that the maximum sea level of the Tapes transgression lasted 2000 years from 7600 cal yr BP and extended into the Early Neolithic, to about 5600 cal yr BP (Fig. 13), with an uncertainty of about 100 years. We estimate that the highest spring tide during the Tapes transgression maximum phase was between 8.2 and 9.0 m above the present mean sea level. … To account for additional uncertainties, we suggest that the spring tide sea level at Longva would have been 8.6 ± 0.4 m above present day mean sea level during the Tapes transgression maximum.”
Yan et al., 2019 South China Sea, +2 m higher than present
Yamada et al., 2019 Japan, +1 m higher than present
“Post-glacial sea level reached about 1 m higher than today around 6000 years ago and then started to fall (Yokoyama et al., 1996). As such, a sudden appearance and increase of marine and brackish diatoms just below PL-b cannot be explained by eustatic sea-level change.”
Montaggioni et al., 2019 French Polynesia, +0.8 m higher than present
“The foundations of islets (motus), namely conglomerate platforms, started to form with deposition of patchy, rubble spreads over the upper reef-rim surfaces from ca 4,500 yr BP as sea level was about 0.80 m above its present mean level. On these platforms, islets started to accrete not before ca 2,300 yr BP, from isolated depocentres located midway between outer-reef and lagoon margins. At that time, sea level at about +0.60 m above present mean sea level was starting to slowly decrease to its present position.”
Brouwers et al., 2019 Dubai, +1.6 to 2.5 m higher than present
“During Pleistocene glaciations, global sea level was 100–120 m below the present level and resulted in most of the Arabian Gulf occurring as a dry basin (Purser 1973; Gunatilaka 1986) … Since late Pleistocene to early Holocene times, the sea level rose gradually until a maximum sea level stand 1.6– 2.5 m higher than today (Gunatilaka 1986).”
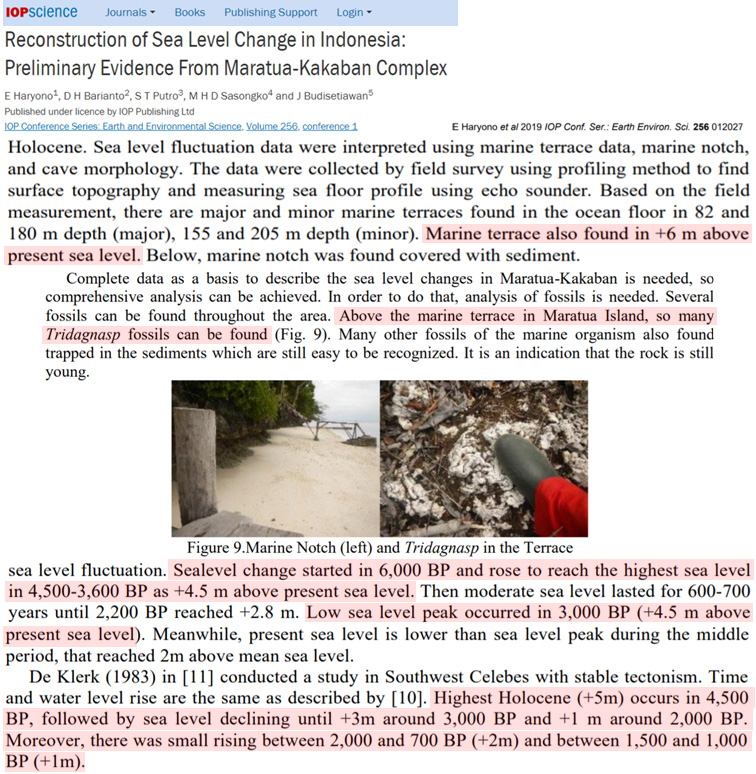
Haryono et al., 2019 Indonesia, +4.5 to 6 m higher than present
“[I]n 5000 BP, sea level increases up to +5 m from the present time; it means it was warmer than the present day. … Sealevel change started in 6,000 BP and rose to reach the highest sea level in 4,500-3,600 BP as +4.5 m above present sea level. Then moderate sea level lasted for 600-700 years until 2,200 BP reached +2.8 m. Low sea level peak occurred in 3,000 BP (+4.5 m above present sea level). Meanwhile, present sea level is lower than sea level peak during the middle period, that reached 2m above mean sea level. … Marine terrace also found in +6 m above present sea level.”
Williams et al., 2019 North Vietnam, +2 to 4 m higher than present
“A freshwater coastal marsh near the mouth of the Cam River in Northern Vietnam stands 2–3 m above mean sea level and is bordered by a coastal barrier that reaches about 6 m above mean sea level. A core from the marsh contains a 14-cm-thick sand and shell layer. The presence of abundant shell fragments suggests inland transport of littoral sediment, and the sand layer is tentatively identified as a washover deposit. The coast of the study area contains a beachrock standing above the modern beach and reaching to ∼4 m above mean sea level. A tentative explanation of this beachrock is that it represents a beach that formed during a mid-Holocene 2–3-m highstand, evidence for which has been reported from Thailand, Malaysia, Singapore, and Vietnam.”
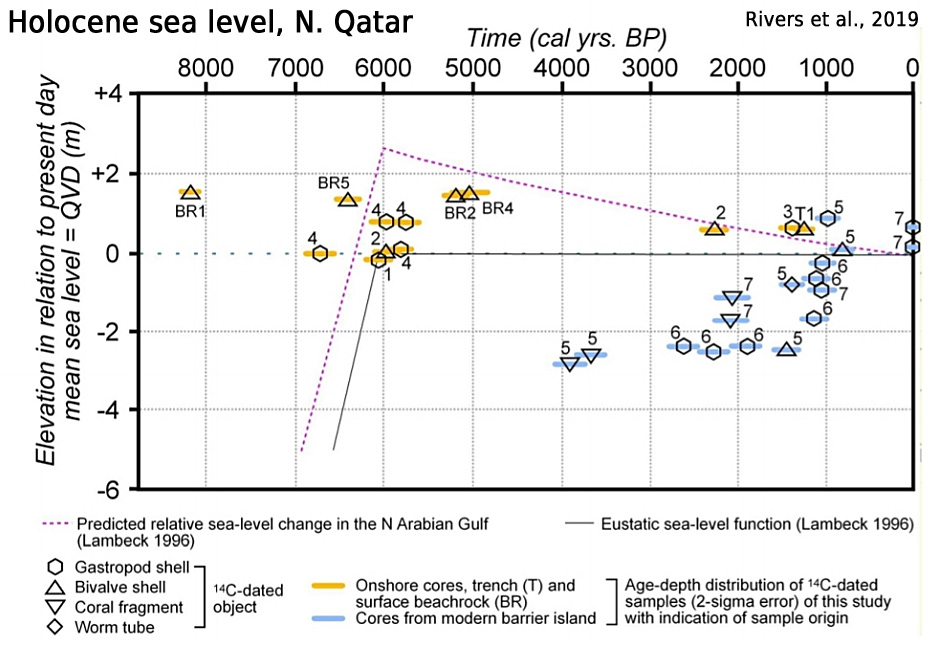
Rivers et al., 2019 Northern Qatar, +1.6 m higher than present
“The Al Ruwais area of northern Qatar has been the site of shallow water carbonate sedimentation since the mid-Holocene. Two distinct depositional packages have been identified. Between ca 7000 and 1400 years ago, when sea-level was up to 1.6 m higher than today, a barrier/back-barrier system was active in an area immediately landward of the modern shoreline. During the same period, a laterally-continuous coral reef flourished in the open waters approximately 3 km to the north. Towards the end of this period sea-level fell to its current position, and the reefal system died, perhaps due to exposure or the influx of detrital sediment. Between 1400 and 800 years ago a new barrier island was established directly on top of the moribund reef, and the old barrier to the south was exposed to the meteoric realm. Over the past ca 800 years the new barrier has retreated landward as much as 1 km to its current position.”
Fachbereich, 2019 Antarctic Peninsula, +14.5 to 16 m higher than present
“Raised beaches along the coasts of Maxwell Bay, located at 7.5 to 4 m amsl (locally termed “6-m-beaches”), interfinger with terminal moraines of the last glacial-readvance (LGR), which occurred between 0.45 and 0.25 ka cal BP (John and Sugden, 1971; Sugden and John, 1973; Clapperton and Sugden, 1988; Yoon et al., 2004; Yoo et al., 2009; Simms et al., 2012). It is therefore likely that these beaches developed during the LGR (John and Sugden, 1971; Sugden and John, 1973; Hall 2010). Recent uplift of KGI was 0.4 mm a-1 during the last decade (Rülke et al., 2015). Average uplift during the entire Holocene, however, is 2.8 to 3 mm a-1 (Bentley et al., 2005; Fretwell et al., 2010). Fall of relative sea level on KGI accelerated during the last 500 years (Bentley et al., 2005, Hall, 2010; Watcham et al., 2011). This was most likely the result of a short-term acceleration in glacio-isostatic rebound after the LGR, with a modeled peak uplift rate of 12.5 mm a-1 between 1700 and 1840 CE (Simms et al., 2012). … Bentley et al. (2005) show that an initial post-glacial sea-level fall was interrupted by a mid-Holocene highstand at about 14.5 to 16 m amsl from 5.8 to 3.0 ka cal BP. In contrast, data presented by Hall (2010) show a continuous sealevel fall, which becomes accelerated between 1.5 and 0.5 ka cal BP.”
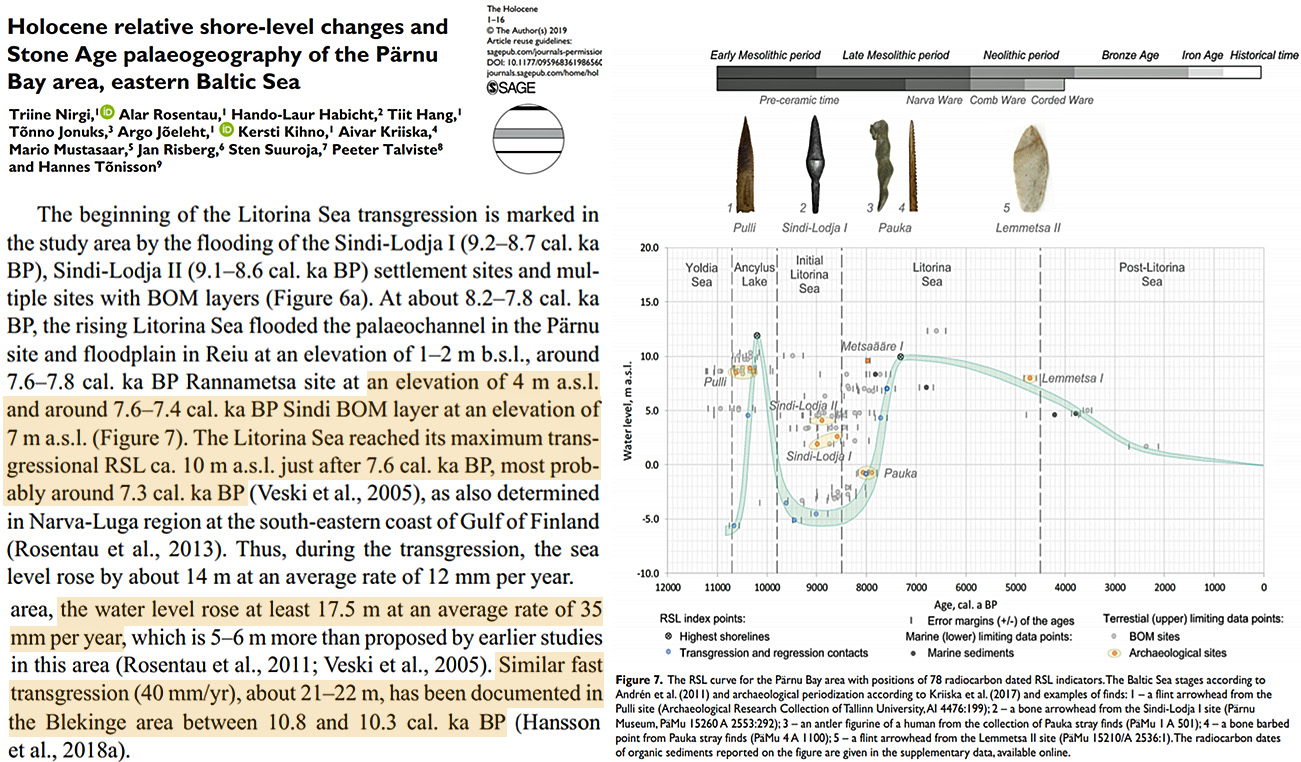
Nirgi et al., 2019 Baltic Sea, +10 m higher than present (rate: +3.5 meters per century)
“Considering the elevations of the pre-Ancylus Lake palaeochannel sediments in the Pärnu site and the highest coastal landforms in the area, the water level rose at least 17.5 m at an average rate of 35 mm per year, which is 5–6 m more than proposed by earlier studies in this area (Rosentau et al., 2011; Veski et al., 2005). Similar fast transgression (40 mm/yr), about 21–22 m, has been documented inthe Blekinge area between 10.8 and 10.3 cal. ka BP (Hansson et al., 2018a). … At about 8.2–7.8 cal. Ka BP, the rising Litorina Sea flooded the palaeochannel in the Pärnu site and floodplain in Reiu at an elevation of 1–2 m b.s.l., around 7.6–7.8 cal. ka BP Rannametsa site at an elevation of 4 m a.s.l. and around 7.6–7.4 cal. ka BP Sindi BOM layer at an elevation of 7 m a.s.l. (Figure 7). The Litorina Sea reached its maximum transgressional RSL ca. 10 m a.s.l. [meters above present sea level] just after 7.6 cal. ka BP, most probably around 7.3 cal. ka BP (Veski et al., 2005), as also determined in Narva-Luga region at the south-eastern coast of Gulf of Finland (Rosentau et al., 2013). Thus, during the transgression, the sea level rose by about 14 m at an average rate of 12 mm per year.”
Rasmussen et al., 2019 Denmark, +3 m higher than present
“Full marine phase (c. 7700–3700 cal. a BP). – The appearance of a high salinity demanding fauna in this phase (several mollusc species, echinoids and Quinqueloculina seminulum) indicates a change to full marine conditions (Figs 4, 11). This marked environmental change coincides with a rapid and significant sea-level rise documented in both the Danish and the Baltic area dated to around 7600 cal. a BP (Fig. 11; Morner 1969; Christensen 1995, 1997; Yu et al. 2007; Lampe et al. 2011; Sander et al. 2015) and probably of global extent related to the so-called ‘global meltwater pulse 3’ documented in Caribbean-Atlantic coral sea-level records c. 7600 cal. a BP (Blanchon & Shaw 1995; Blanchon et al. 2002; Bird et al. 2010; Blanchon 2011a,b). Based on data from a recent study on the island of Samsø in the central Kattegat, Sander et al. (2015) estimated a relative sea-level rise of ~4.5 m between 7600 and 7200 cal. a BP. A high sea level in Aarhus Bay at this stage is supported by an almost complete absence of terrestrial plant macrofossils (Fig. 5) testifying to an increased distance between the core site and the shore. … In the period of greatly increased sedimentation (c. 7700–6300 cal. a BP), the average rate is ~2.8 mm a1 (Fig. 11). The extensive coastal erosion during this sea-level highstand period is manifested in today’s landscape in the form of numerous fossil coastal cliffs situated above present-day sea level that formed during the Mid-Holocene when the relative sea level was ~3 m higher than present along the coasts of the Aarhus Bay area (Mertz 1924). … In a study of the island of Anholt in the central part of the Kattegat, the drop in absolute sea level was estimated to 2.6 m over a 700-year period between 4300 and 3600 cal. a BP (with most of the sea-level fall taking place between 4250 and 3740 cal. aBP; Clemmensenet al. 2012).”
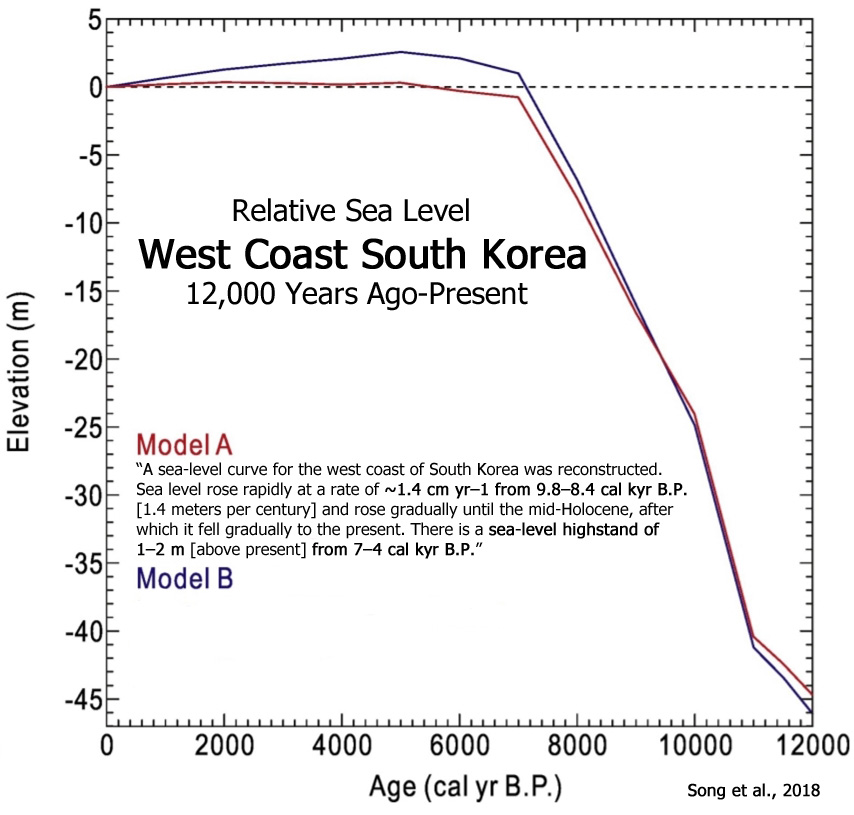
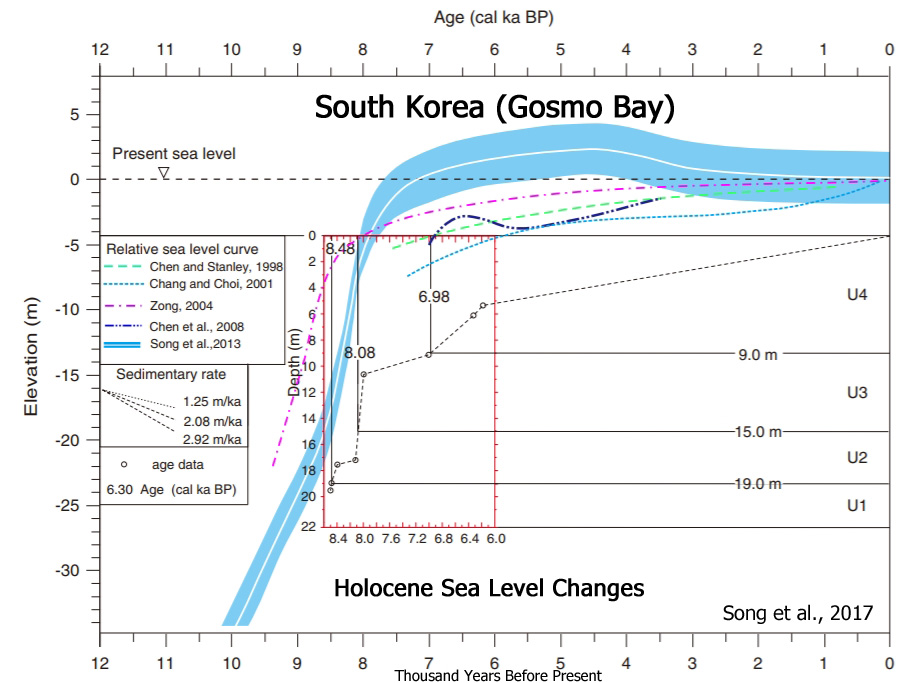
Song et al., 2018 South Korea, +1 to +2 m higher than present (rate: +1.4 meters per century)
“A sea-level curve for the west coast of South Korea was reconstructed. Sea level rose rapidly at a rate of ~1.4 cm yr–1 from 9.8–8.4 cal kyr B.P. [1.4 meters per century] and rose gradually until the mid-Holocene, after which it fell gradually to the present. There is a sea-level highstand of 1–2 m [above present] from 7–4 cal kyr B.P., likely due to hydro-isostatic effects. The rapid sea-level rise during the early Holocene is clearly a manifestation of polar ice sheet decay. The results were supported by the GIA model. The Holocene RSL change on the west coast of South Korea was closely linked to global temperature and ice sheet decay, especially during the early Holocene.”
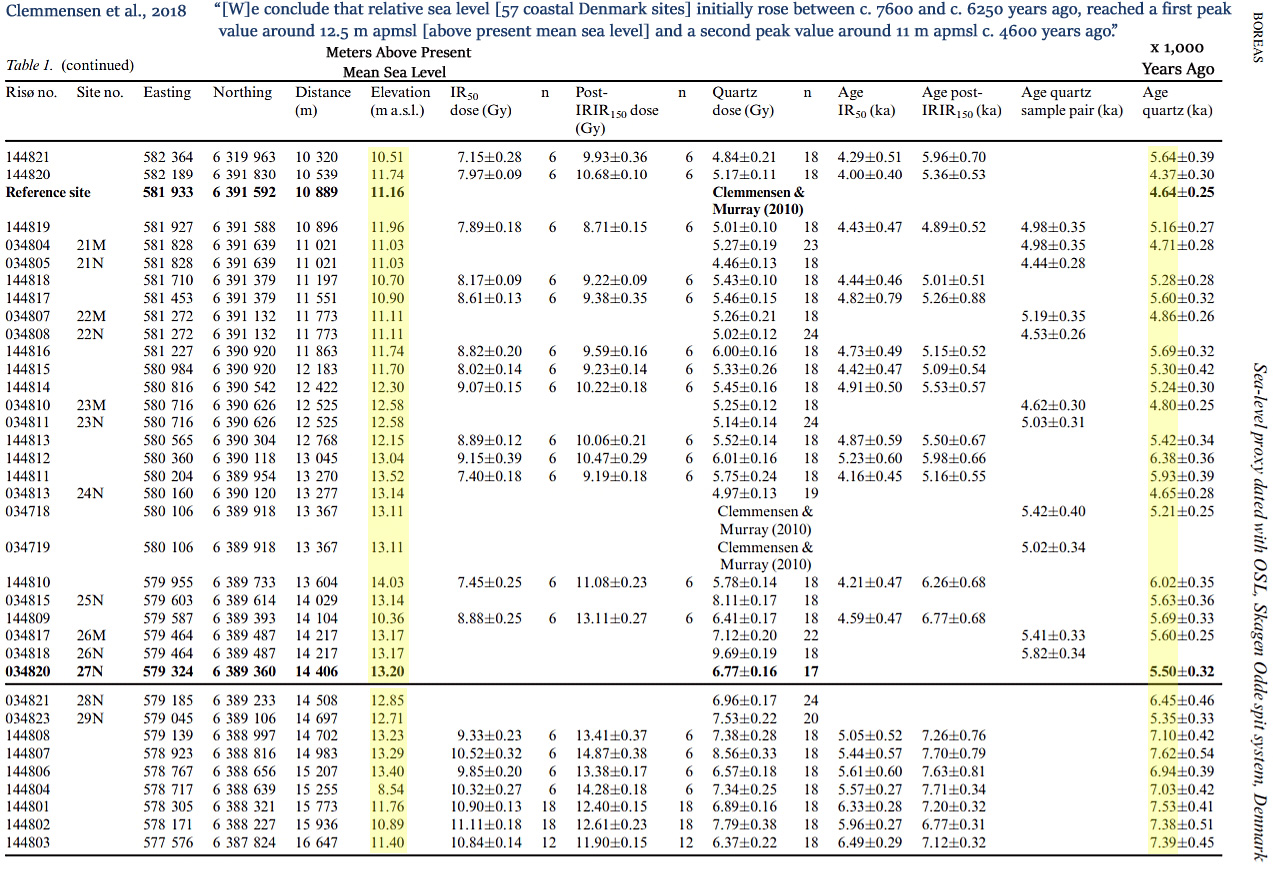
Clemmensen et al., 2018 N Denmark, +11 to +12.5 m higher than present
“The raised spit deposits at Skagen Odde, northern Denmark, offer a unique possibility to study spit evolution over the past 7600 years. The deposits contain well-preserved beach facies including the transition from wave-formed foreshore to aeolian-influenced backshore sediments. After correction foroffset and isostatic spatial gradient, we have been able to use this boundary as a proxy for palaeo-sea level. Measurements at 57 sample sites covering ~17 km along the northwestern coast of the spit indicate that this boundary first rises towards the northeast, then reaches a maximum relative sea level at about 12.5 m above present mean sea level [apmsl] before gradually decreasing toward the most recent part of the spit. By pairing all boundary elevation measurements with an OSL age, the variation in elevation with age has been determined directly. The resulting curve reflects variation in relative sea level with time; we conclude that relative sea level initially rose between c. 7600 and c. 6250 years ago, reached a first peak value around 12.5 m apmsl [above present mean sea level] and a second peak value around 11 m apmsl c. 4600 years ago before it dropped to reach 2 m apmsl c. 2000 years ago.”
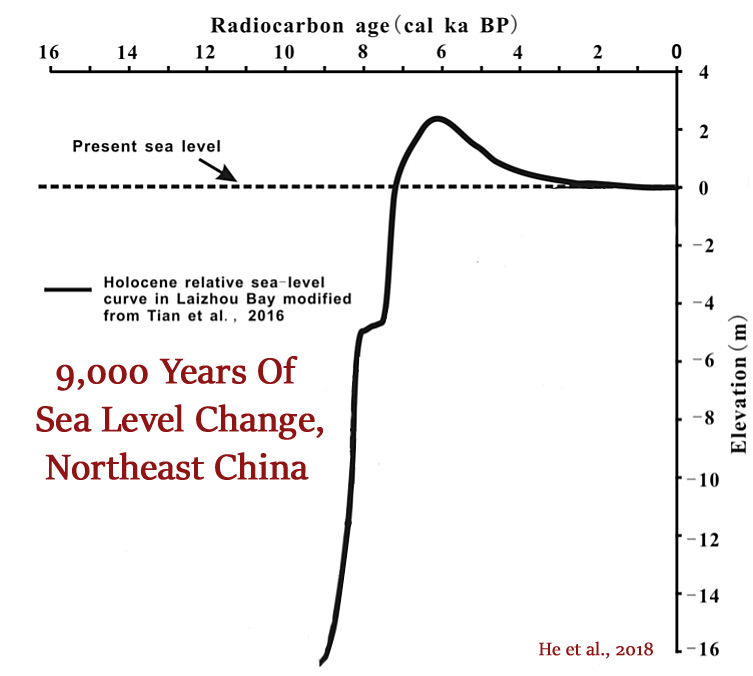
He et al., 2018 Northeast China, +2 m higher than present
Escobar-Torrez et al., 2018 W Borneo, South China Sea, +0.8 to +3.1 m higher than present
“The predictions for a range of earth models show RSL [relative sea level] rising steeply up to 7000 yr BP, slowing thereafter, and peaking at 5000 yr BP with an elevation of 0.80–3.10 m above present.”
Makwana et al., 2018 W India, +2 m higher than present
“The enhanced chemical weathering intensities suggest that the last two millennia witnessed two phases of relatively warm and humid climatic conditions, which probably coincide with the Roman Warm Period and the Medieval Warm Period. The Banni Plains was evolved owing to the Middle Holocene high sea stand and subsequent relative fall during the last 2 ka period. The extent of the relative high sea stand up to 2 m above msl also corroborated well by ancient port settlements of the Late Harappan period. … The BB trench site was experiencing a marine environment at least 2.9 ka BP; which hints at a ‘relative sea level’ higher than 2 m from the present msl.”
Vacchi et al., 2018 Newfoundland, +4.9 m higher than present
“The northwestern portion of Newfoundland differs from the rest of Newfoundland (above ~50 N[…]) and can be classified as uplifting coast. Here, RSL [relative sea level] remained always above the present MSL [mean sea level] in the last ~16 ka. A suite of SLIPs and terrestrial limiting points robustly constrains the RSL evolution in the mid to Late Holocene where RSL dropped from 4.9 ± 3.2 m [above present] at ~5.3 ka to 2.4 ± 2.2 m at ~1.7 ka and finally to the present MSL at ~1.2 ka.”
Razjigaeva et al., 2018 North Pacific (Russia), ~1 m higher than present
“The landscape changes during the Medieval Warm Period were discussed for the Kuril and Sakhalin Islands, Primorye and the Amur River Basin. … In all regions, the warming was accompanied by a minor transgression. The sea level was higher than at present by ∼1 m, which resulted in the formation of low marine and lagoon terraces, the attenuation of eolian processes on the coasts, and the fixation of coastal dunes with the development of a thick soil.”
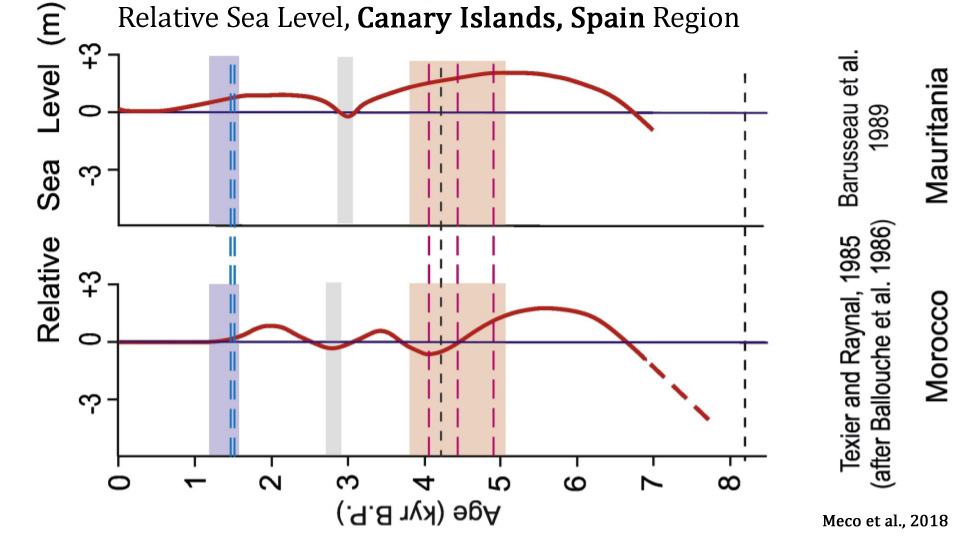
Meco et al., 2018 Canary Islands, Spain, + 3.5 to +4 m higher than present
“The eastern coast of Fuerteventura (Canary Islands, Spain) hosts the most complete and representative emergent Holocene marine deposits in the middle latitudes (27°N to 30°N) of the eastern Atlantic Ocean. The deposits consist of berms of gravel and foreshore sands which form beach rocks comprising >62 bed sets, with each bed set containing dozens of individual laminations suggesting a cyclical cause as, for example, the orbital movement of the Earth. Calibrated radiocarbon ages place a group of older Holocene highstands of Fuerteventura at around the Mid-Late Holocene boundary (around 4.2 kyr B.P.), and another group of more recent highstands in the Dark Age Period (around 1.4 kyr B.P.) of the Northern Hemisphere. They have been recorded at 4 m and 3.5 m apmsl [above present mean sea level] respectively.”
Cooper et al., 2017 Northern Ireland, +2 to +3 m higher than present
“Whitepark Bay is located on the paraglacial north coast of Northern Ireland. … After deglaciation sea-level fell to a low of -30 m by ca. 13.5 ka cal yr BP (Cooper et al., 2002; Kelley et al., 2006) before rising to a mid-Holocene highstand of 2-3 m above present around 6 cal kay r BP (Carter, 1982; Orford et al., 2006).”
Song et al., 2017 South Korea, +2 m higher than present
Yoon et al., 2017 South Korea, +6 m higher than present
“Songaksan is the youngest eruptive centre on Jeju Island, Korea, and was produced by a phreatomagmatic eruption in a coastal setting c. 3.7 ka BP [3,700 years before present]. The 1 m thick basal portion of the tuff ring shows an unusually well-preserved transition of facies from intertidal to supratidal, from which palaeo-high-tide level and a total of 13 high-tide events were inferred. Another set of erosion surfaces and reworked deposits in the middle of the tuff ring, as high as 6 m above present mean sea level, is interpreted to be the product of wave reworking during a storm-surge event that lasted approximately three tidal cycles. … The reworked deposits alternate three or four times with the primary tuff beds of Units B and C and occur as high as 6 m above present mean sea level or 4 m above high-tide level (based on land-based Lidar terrain mapping of the outcrop surface).”
Miklavič et al., 2017 Northern Philippine Sea, +3 m higher than present
“Holocene relative sea level history from phreatic overgrowths on speleothems (POS) on Minami Daito Island, Northern Philippine Sea… The results show that SL [sea level] reached its Holocene maximum between ca. 5.1 and 4.6 ka cal BP [4,600 to 5,100 years ago], after which it remained more or less stable till the present day, with a possible minor sea-level drawdown of ca. 30–35 cm…. The mid Holocene highstand is commonly assumed to have been ca. 3 m above the modern SL [sea level], although the observed heights range between +0.5 m and +4 m.”
Marwick et al., 2017 (full paper) Thailand, +4 to +5 m higher than present
“Sinsakul (1992) has summarised 56 radiocarbon dates of shell and peat from beach and tidal locations to estimate a Holocene sea level curve for peninsula Thailand that starts with a steady rise in sea level until about 6 k BP, reaching a height of +4 m amsl (above [present]mean sea level). Sea levels then regressed until 4.7 k BP, then rising again to 2.5 m amsl at about 4 k BP. From 3.7 k to 2.7 k BP there was a regressive phase, with transgression starting again at 2.7 k BP to a maximum of 2 m amsl at 2.5 k BP. Regression continued from that time until the present sea levels were reached at 1.5 k BP. … Tjia (1996) collected over 130 radiocarbon ages from geological deposits of shell in abrasion platforms, sea-level notches and oyster beds and identified a +5 m [above present] highstand at ca. 5 k BP in the Thai-Malay Peninsula. … Sathiamurthy and Voris (2006) summarise the evidence described above as indicating that between 6 and 4.2 k BP, the sea level rose from 0 m to +5 m [above present] along the Sunda Shelf [+2.8 mm/yr], marking the regional mid-Holocene highstand. Following this highstand, the sea level fell gradually and reached the modern level at about 1 k BP.”
Meltzner et al., 2017 Southeast Asia, +1.9 m higher than present (rate: +1.3 m per century)
“Half-metre sea-level fluctuations on centennial timescales from mid-Holocene corals of Southeast Asia … RSL [relative sea level] history between 6850 and 6500 cal years BP that includes two 0.6 m fluctuations, with rates of RSL change reaching 13±4 mm per year. … Here RSL rose to an initial peak of +1.9 m [above present] at 6,720 cal years BP, then fell rapidly to a lowstand of +1.3 m, remaining at about that level for ∼100 years, before rising to a second peak at +1.7 m shortly after 6,550 cal years BP. Around 6,480 cal years BP, RSL appears to have fallen again to +1.3 m before rising to a third peak at +1.6 m or higher. … RSL then stabilized at a lower elevation, forming a series of low concentric annuli ∼0.6 m higher than present-day analogues; RSL [relative sea level] then rose ∼0.6 m in less than a century, allowing the coral to grow upward to 1.2 m higher than modern living corals.”
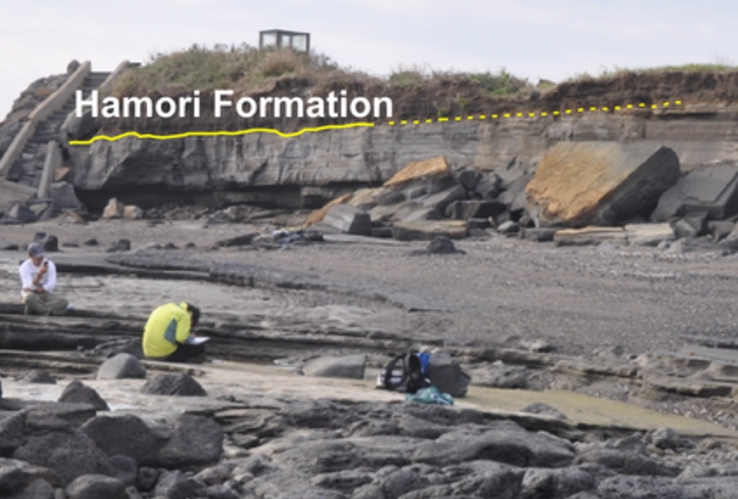
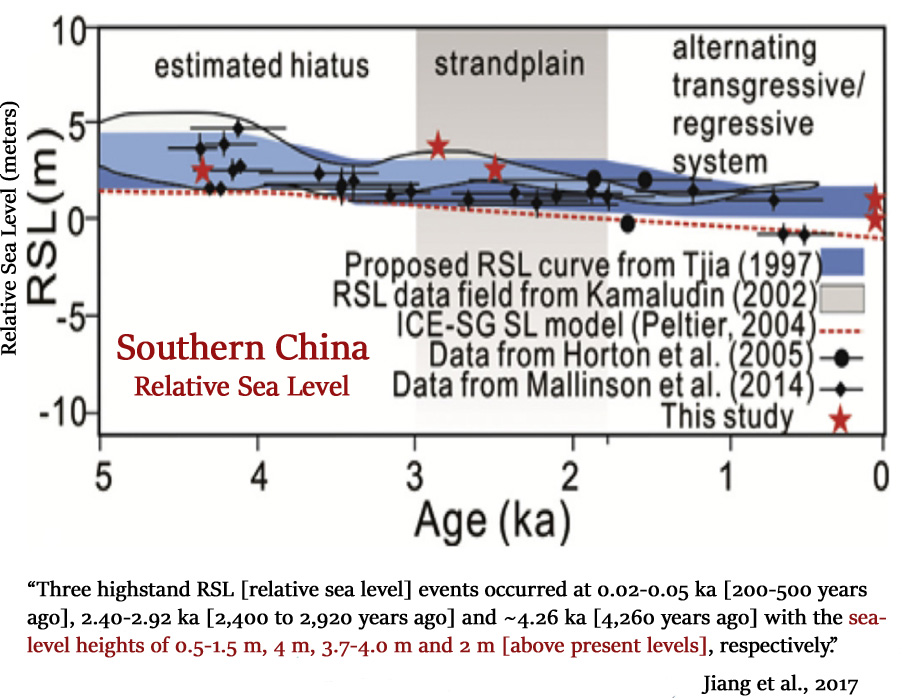
Jiang et al., 2017 Southern China, +2.4 to +4.26 m higher than present
“[T]hree coastal sediments with 4 m, 3.7 m, and 2 m higher than present sea-level were deposited at 2.40 ± 0.05 ka, 2.92 ± 0.17 ka, and 4.26 ± 0.10 ka, respectively [2,400, 2,920, and 4,260 years before present], which indicate that the height of highstand relative sea-level are higher than both mean global sea-level eustacy and those records offshore southern China. … In conclusion, a beach ridge and two marine terraces sediments have been dated at eastern Hainan Island. They were well bleached and can be taken as good indicators of paleo-RSL [relative sea level] highstand records of late Holocene. Three highstand RSL [relative sea level] events occurred at 0.02-0.05 ka [200-500 years ago], 2.40-2.92 ka [2,400 to 2,920 years ago] and ~4.26 ka [4,260 years ago] with the sea-level heights of 0.5-1.5 m, 4 m, 3.7-4.0 m and 2 m [above present levels],respectively. The height of highstand RSLs are higher than both mean global sea-level euastacy and those of offshore southern China.”
Khan et al., 2017 Caribbean, ~+1 m above present (rate: 1.09 meters per century)
“Only Suriname and Guyana [Caribbean] exhibited higher RSL[relative sea level] than present (82% probability), reaching a maximum height of ∼1 m [above present] at 5.2 ka [5,200 years ago]. … Because of meltwater input, the rates of RSL [relative sea level] change were highest during the early Holocene, with a maximum of 10.9 ± 0.6 m/ka [1.09 meters per century] in Suriname and Guyana and minimum of 7.4 ± 0.7 m/ka [0.74 meters per century] in south Florida from 12 to 8 ka [12,000 to 8,000 years ago].”
Sander et al., 2016 Denmark, +2.2 m higher than present
“The data show a period of RSL [relative sea level] highstand at c. 2.2 m above present MSL [mean sea level] between c. 5.0 and 4.0 ka BP [5,000 to 4,000 years before present]. “
Bradley et al., 2016 China, +2 to +4 m higher than present
“In general, the data indicate a marked slowdown between 7 and 8 kyr BP, with sea level rising steadily to form a highstand of ~2-4 m [above present sea level] between 6 and 4 kyr BP [6000 and 4000 years before present]. This is followed by a steady fall, reaching present day levels by ~1 kyr BP.”

Long et al., 2016 Scotland, < +1 m higher than present
“RSL [relative sea level] data from Loch Eriboll and the Wick River Valley show that RSL [relative sea level] was <1 m above present for several thousand years during the mid and late Holocene before it fell to present.”
Chiba et al., 2016 Japan, +1.9 m higher than present
“Highlights: We reconstruct Holocene paleoenvironmental changes and sea levels by diatom analysis. Average rates of sea-level rise and fall are estimated during the Holocene. Relative sea level during Holocene highstand reached 1.9 m [higher than today] during 6400–6500 cal yr BP [calendar years before present]. The timing of this sea-level rise is at least 1000 years earlier in the Lake Inba area by Holocene uplift than previous studies. The decline of sea-level after 4000 cal yr BP may correspond to the end of melting of the Antarctic ice sheet.”
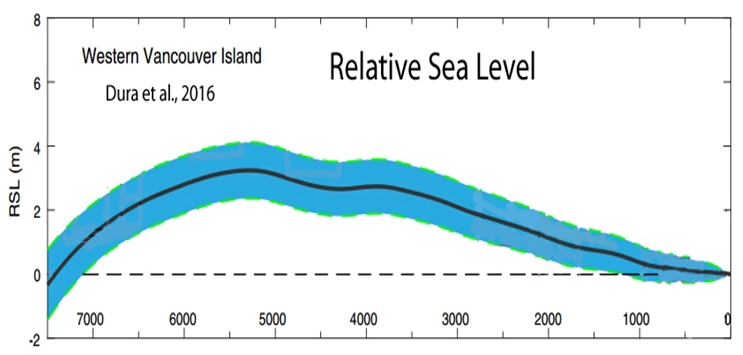
Dura et al., 2016 Vancouver, < +1 to +3 m higher than present
“In northern and western Sumatra, GIA models predict high rates (>5 mm/year) of RSL [relative sea level] rise from ∼12 to ∼7 ka [12000 to 7000 years ago], followed by slowing rates of rise (<1 mm/year) to an RSL [relative sea level] highstand of <1 m (northern Sumatra) and ∼3 m (western Sumatra) between 6 and 3 ka [6,000-3,000 years ago], and then gradual (<1 mm/ year) RSL fall until present.”
Yokoyama et al., 2016 Japan, +2.7 m higher than present
“The Holocene-high-stand (HHS) inferred from oyster fossils (Saccostrea echinata and Saccostrea malaboensis) is 2.7 m [above present sea level] at ca. 3500 years ago, after which sea level gradually fell to present level.”
Lokier et al., 2015 Persian Gulf, > +1 m above present
“Mid-Holocene transgression of the Gulf surpassed today’s sea level by 7100–6890 cal yr BP [~7000 years ago], attaining a highstand of > 1 m above current sea level shortly after 5290–4570 cal yr BP before falling back to current levels by 1440–1170 cal yr BP. These new ages refine previously reported timings for the mid- to late Holocene sea-level highstand published for other regions.”

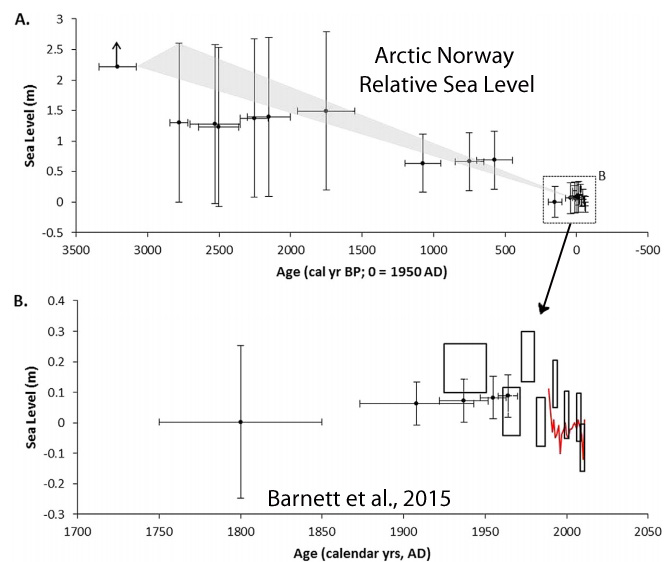
Barnett et al., 2015 Arctic Norway, +2.2 m higher than present
“Relative sea-level fell at −0.7 to −0.9 mm yr−1 over the past 3300 years in NW Norway. … Prior to 3000 cal yr BP the marine limiting date represents an important constraint for the late Holocene sea-level trend and yields a minimum RSL [relative sea level] decline of approximately 2.2 m over 3200 years when assuming a linear trend. The maximum possible linear decline constrained by the data is approximately 2.6 m in 2800 years, providing an estimated late Holocene sea-level trend of ~0.7 to ~0.9 mm yr -1 (shown by the grey shaded region in Fig. 8A).” [Relative sea level was 2.2 m higher ~3,000 years ago in Arctic Norway]
Reinink-Smith, 2015 Kuwait, +3.5 m higher than present
“[A]ssuming the tidal ranges were similar in the middle Holocene, a rough estimate of the MSL [mean sea level] during the middle Holocene highstand is 5.2 m − 1.7 m = +3.5 m above the present MSL [mean sea level]. … The +3.5 m highstand estimate in northeastern Kuwait derived in this study is also higher than the previously reported maximum estimates of +2 to +2.5 m responsible for other Holocene beach ridges in the Arabian Gulf (Gunatilaka, 1986; Lambeck, 1996; Kennett and Kennett, 2007; Jameson and Strohmenger, 2012). Some beach ridges in Qatar and Abu Dhabi are at elevations of 2–4 m above MSL [present mean sea level] as far as 5-15 km inland (Alsharhan and Kendall, 2003).”
Stategger et al., 2013 South Vietnam, +1.4 m higher than present
“The rates of sea-level rise decreased sharply after the rapid early Holocene rise and stabilized at a rate of 4.5 mm/year between 8.0 and 6.9 ka. Southeast Vietnam beachrocks reveal that the mid-Holocene sea-level highstand slightly above +1.4 m was reached between 6.7 and 5.0 ka, with a peak value close to +1.5 m around 6.0 ka.”
Yokoyama et al., 2012 Northern Japan, +2 m higher than present
“A Mid to Late Holocene sea-level record based on combined geomorphological, geological and micropaleontological observations was obtained from well-developed wave cut benches subaerially exposed along the Shimokita Peninsula, northern Japan. Results indicate that the benches were formed during mid to late Holocene sea-level transgressions, reaching a maximum highstand level of 2 m above present at about 4,000 years ago.”
Rashid et al., 2012 Bangladesh, +4.5 to +5 m higher than present
“The abundant marine diatoms and mangrove pollens indicate the highest RSL [relative sea level] transgression in Bangladesh at approximately 6000 cal BP, being at least 4.5 to 5 m higher than the modern m.s.l. [mean sea level]. … The curve indicates that at approximately 5000 cal BP and onwards, the RSL started to fall towards its present position, and the present shoreline of Bangladesh was established at approximately 1500 cal BP and has not noticeably migrated inland since.”
Scheffers et al., 2012 Thailand, +1.5 to +3 m higher than present
“Nevertheless, those from the Laem Son coral profile, as well as those from oysters in the Phang-nga Bay show the same trend and maximum altitude lower than +3 m compared with modern RSL (Figure 6a); the maximum of +2.5–3.0 m was timed to c. 5700 cal. BP. … [W]e tentatively deduce a highstand around 5300 BP in the order of +1.5–2.5 m above [present] RSL [relative sea level].”

Carson, 2011 Guam, Western Pacific, +1.5 to +2 m higher than present
“The case study in Guam may be viewed as representative of a broader region of the Remote Oceanic islands in the western Pacific, where first human settlement occurred around 1500-1000 B.C. (Bellwood, 1997; Kirch, 2000, 2010; Spriggs, 2007), generally at sites that today are broad sandy beaches but once had been small offshore islets, sand berms or spits, narrow beach fringes, and strand-like swampy settings around the end of a mid-Holocene highstand of sea level about 1.5-2 m above the present level (Carson, 2008a, 2008b; Dickinson and Burley, 2007; Gosden and Webb, 1994; Kirch, 1997; Nunn, 2005, 2007; Wickler, 2001).”
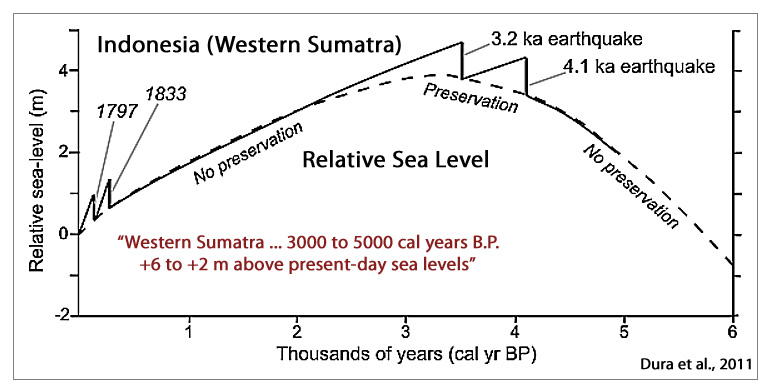
Dura et al., 2011 West Sumatra, Indonesia, +2 to +6 m higher than present
“A prominent feature of southeast Asia Holocene sea level records is the mid-Holocene highstand [Geyh et al., 1979; Tjia, 1996; Scoffin and Le Tissier, 1998; Hanebuth et al., 2000], which in Western Sumatra, varies in timing and magnitude from 3000 to 5000 cal years B.P., and +6 to +2 m above present-day sea levels [Horton et al., 2005].”
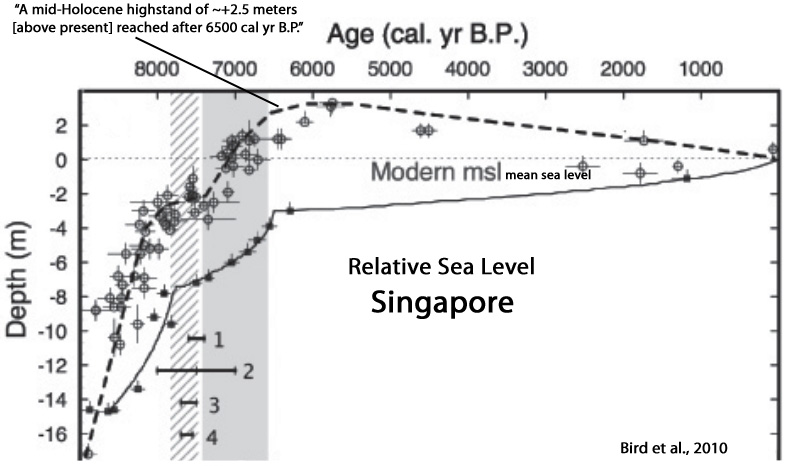
Bird et al., 2010 Singapore, +2.5 m higher than present (rate: +1.8 m per century)
“The sea-level curve, corroborated by the independent proxy records, suggests rapid rise at a rate of 1.8 m/100 yr until 8100 cal (calibrated) yr B.P., a near cessation in the rate of sea level rise between 7800 and 7400 cal yr B.P., followed by a renewed rise of 4–5 m that was complete by 6500 cal yr B.P [0.5 m/100 yr]. … A mid-Holocene highstand of ~+2.5 m [above present] was reached after 6500 cal yr B.P., followed by a lowering, with mangroves prograding over the core site by ca. 1000 cal yr B.P.”
Switzer et al., 2009 SE Australia, +1 to +1.5 m higher than present
“This beach sequence provides new evidence for a period of higher sea level 1–1.5 m higher than present that lasted until at least c. 2000–2500 cal BP and adds complementary geomorphic evidence for the mid to late Holocene sea-level highstand previously identified along other parts of the southeast Australian coast using other methods.”
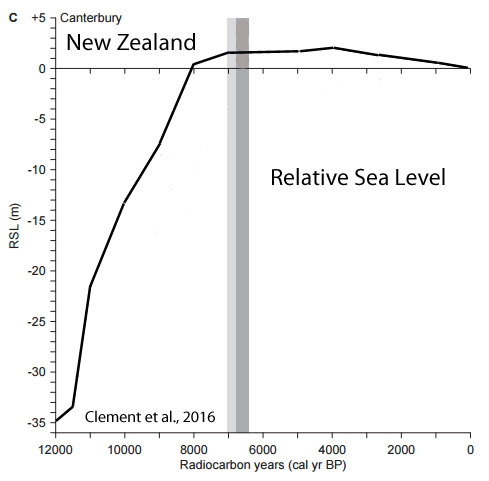
Clement al., 2016 New Zealand, +3 m higher than present
“Holocene relative sea-level (RSL) changes have been reconstructed for four regions within the New Zealand archipelago: the northern North Island (including Northland, Auckland, and the Coromandel Peninsula); the southwest coast of the North Island; the Canterbury coast (South Island); and the Otago coast (South Island). In the North Island the RSL highstand commenced c. 8,100-7,2400 cal yr BP when present mean sea-level (PMSL) was first attained. This is c. 600-1,400 years earlier than has been previously indicated for the New Zealand region as a whole, and is consistent with recent Holocene RSL reconstructions from Australia. In North Island locations the early-Holocene sea-level highstand was quite pronounced, with RSL up to 2.75 m higher than present. In the South Island the onset of highstand conditions was later, with the first attainment of PMSL being between 7,000-6,400 cal yr BP. In the mid-Holocene the northern North Island experienced the largest sea-level highstand, with RSL up to 3.00 m higher than present. This is demonstrably higher than the highstand recorded for the southwest North Island and Otago regions.”
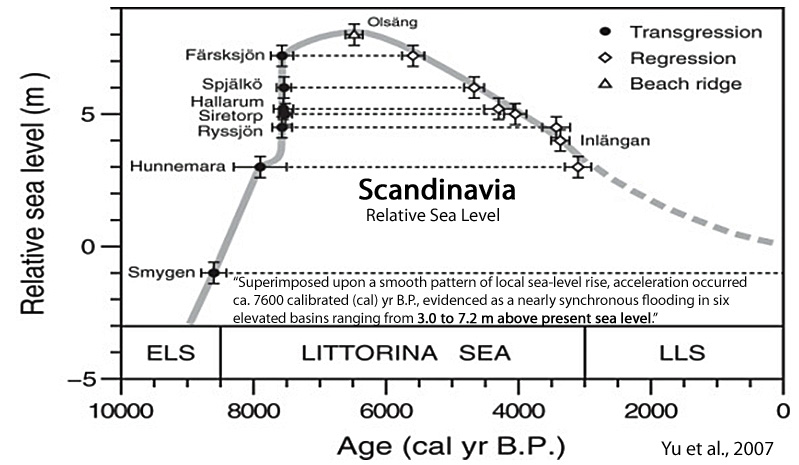
Yu et al., 2007 Scandinavia, +3 to +7.2 m higher than present
“Superimposed upon a smooth pattern of local sea-level rise, acceleration occurred ca. 7600 calibrated (cal) yr B.P., evidenced as a nearly synchronous flooding in six elevated basins ranging from 3.0 to 7.2 m above present sea level. We ascribe this rapid local sea-level rise of ∼4.5 m to a sudden increase in ocean mass, most likely caused by the final decay of the Labrador sector of the Laurentide Ice Sheet. The subsequent monotonic fall of local sea level from ca. 6500 cal yr B.P. to the present is mainly an expression of the slow isostatic adjustment of the mantle.”
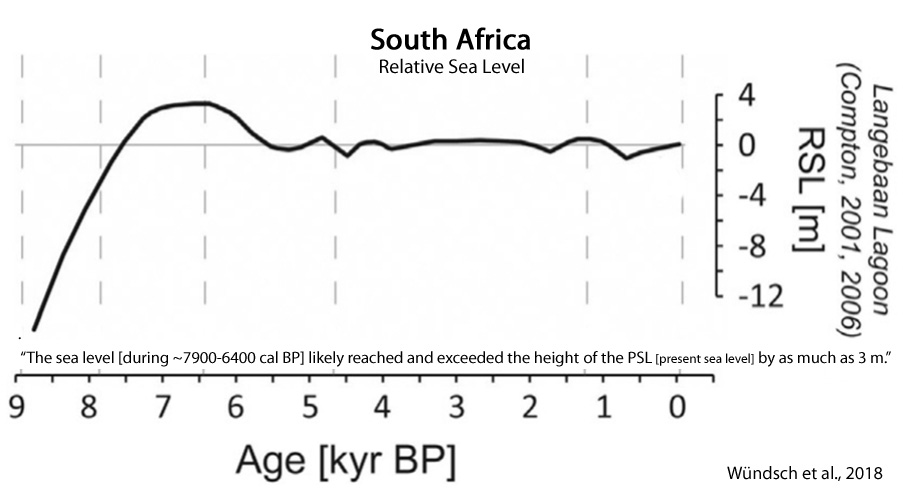
Wündsch et al., 2018 South Africa, +3 m higher than present
“Holocene sea level reconstructions suggest a reduction of the speed of the sea level rise during this time [~7900–6400 cal BP]. The sea level likely reached and exceeded the height of the PSL [present sea level] by as much as 3 m .”
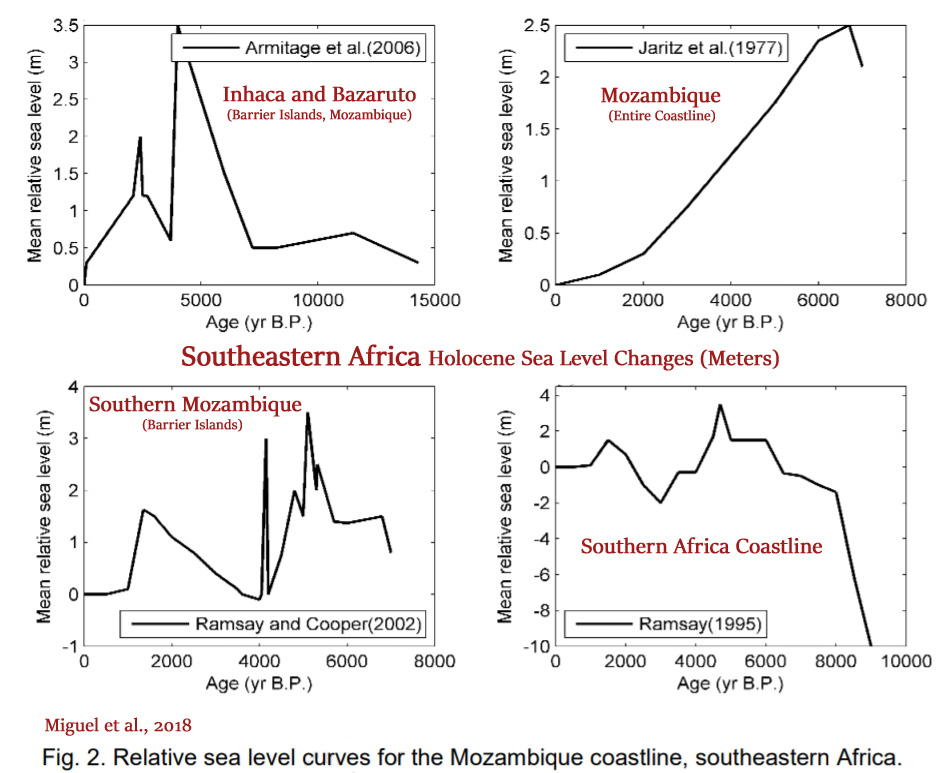
Miguel et al., 2018 Southeastern Africa, ~ +2 to +3 m higher than present
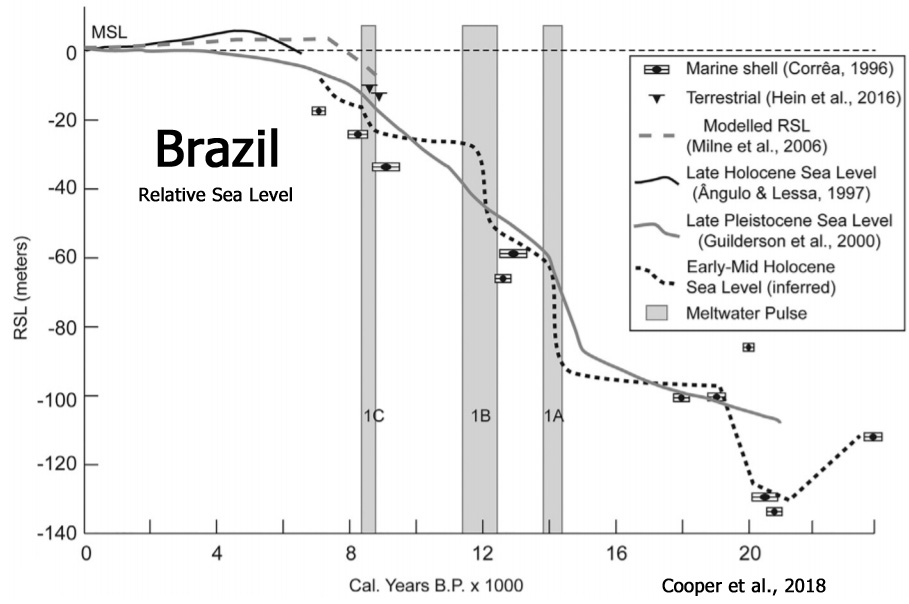
Cooper et al., 2018 Brazil, ~2 m higher than present
“With sea level stabilization a few metres above the present around 5.5 ka cal yr BP (Hein et al., 2016), the longshore drift system was reestablished and sediment accumulation in the littoral zone recommenced.”
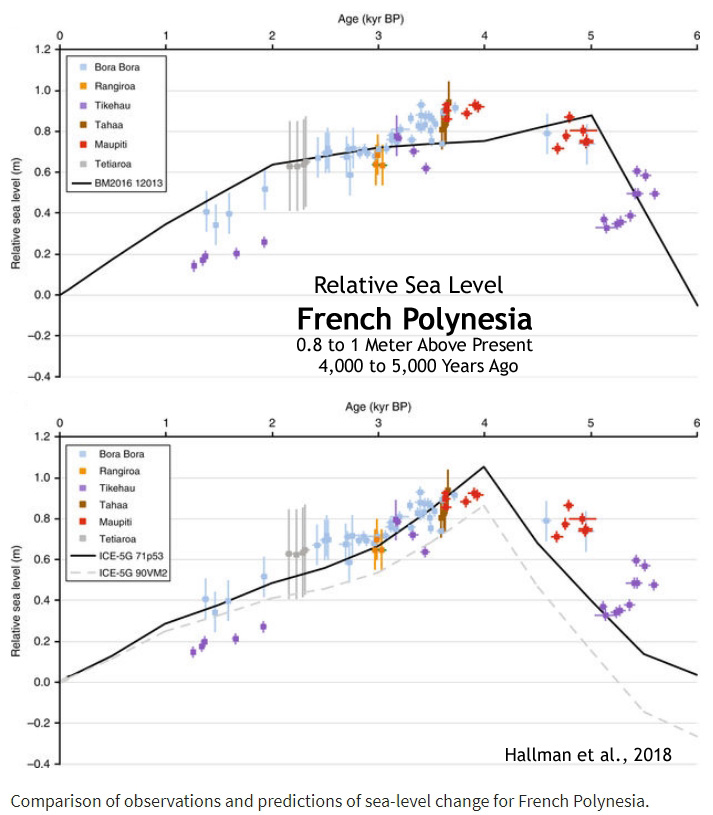
Hallman et al., 2018 French Polynesia, +0.8 to +1 m higher than present
Cooper et al., 2018 Southern Africa, +2 to +4 m higher than present
“Sea-level change around southern Africa (southern Namibia, South Africa, southern Mozambique) since Termination I has been quantified using a variety of indicators. Existing and new data are reviewed to provide a baseline for future studies and identify key research needs and opportunities in the region. While the southern African records broadly agree with other far-field records, detailed Holocene records present as-yet unresolved discrepancies with glacial isostatic adjustment (GIA) model predictions. Two domains, the west coast and east coast are considered. Radiocarbon dated saltmarsh facies and marine shells in life position provide the basis for the west coast sea-level curve back to 9 ka BP. Given the age and elevation uncertainties, a Mid-Holocene highstand of +2 to +4 m [higher than present] is suggested between 7.3 and 6 ka BP, as are several Late Holocene oscillations of <1 m amplitude.”
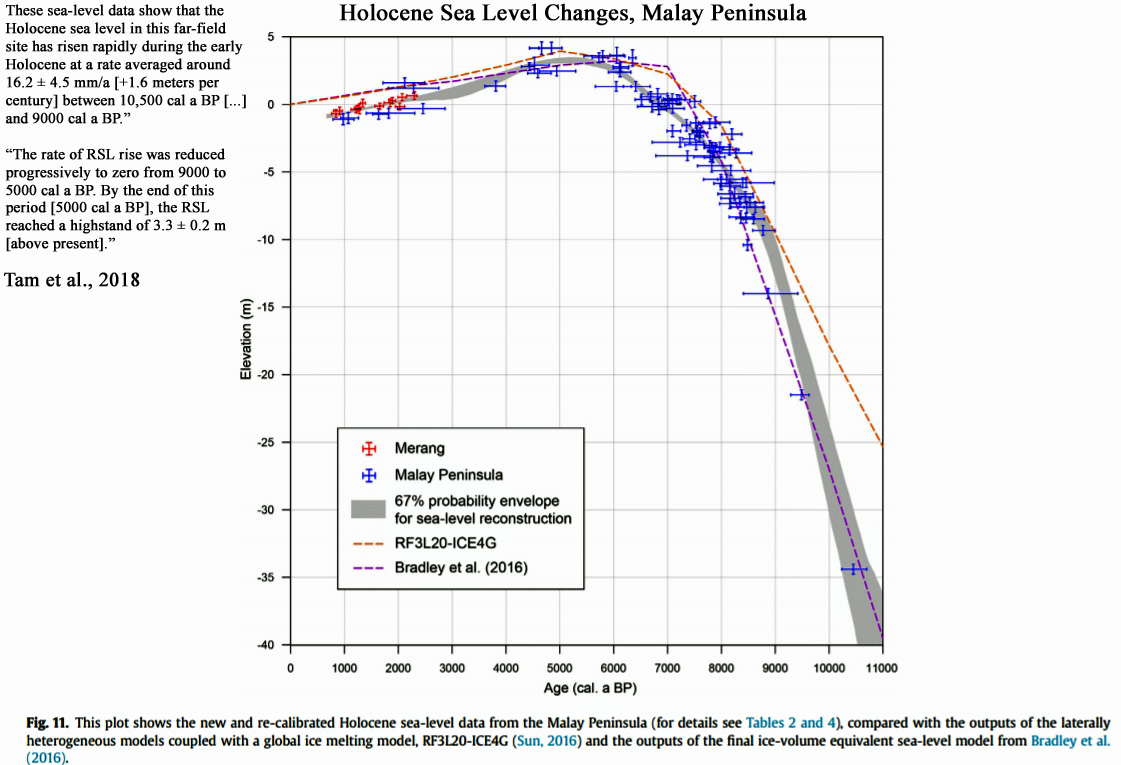
Tam et al., 2018 Malay Peninsula, +3.3 m higher than present
“These sea-level data show that the Holocene sea level in this far-field site has risen rapidly during the early Holocene at a rate averaged around 16.2 ± 4.5 mm/a [+1.6 meters per century] between 10,500 cal a BP at -35.0 ± 4.3 m and 9000 cal a BP at -14.2 ± 1.6 m. The rate of RSL rise was reduced progressively to zero from 9000 to 5000 cal a BP. By the end of this period [5000 cal a BP], the RSL reached a highstand of 3.3 ± 0.2 m [above present]. Since the mid-Holocene, RSL had fallen below-present to -0.60 ± 0.12 m by 800 years ago. This far-field RSL history has been driven by the global ice-volume change that led to the rapid rise in sea level in the early Holocene and by GIA which lifted the RSL for several meters in the mid-Holocene. The gradual fall of RSL during the past 5000 years reflects the diminishing GIA effects and gradual reduction in meltwater input to the oceans.”
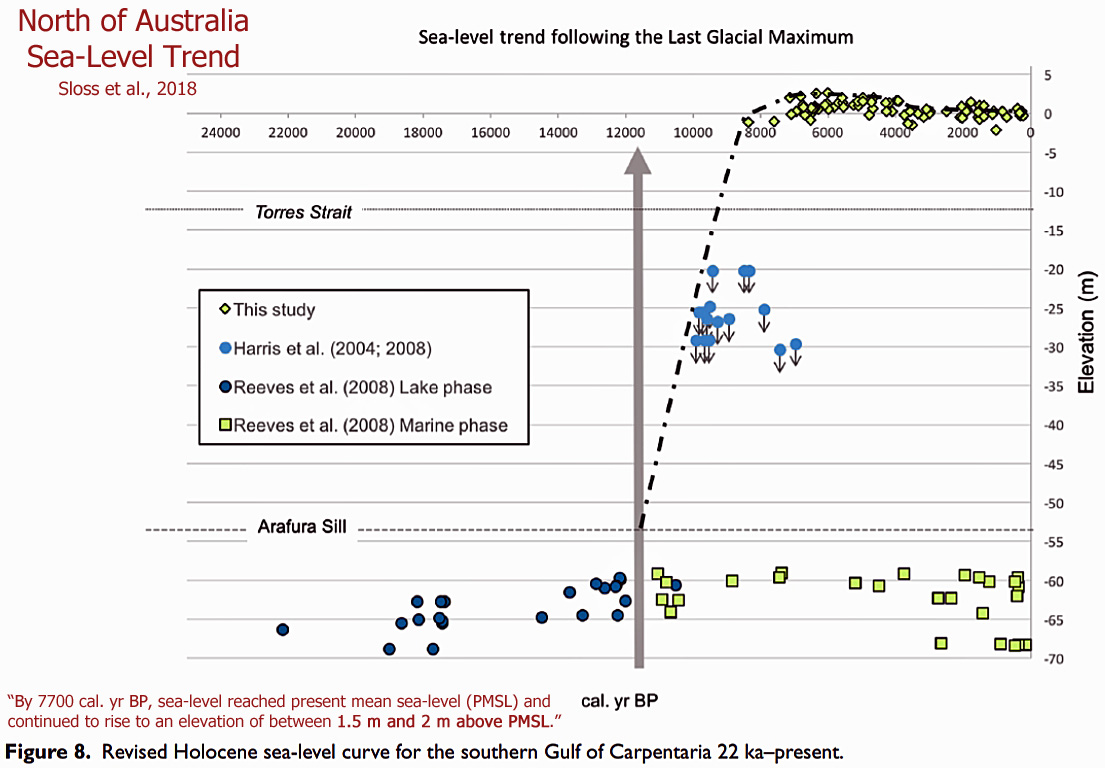
Sloss et al., 2018 North of Australia, +1 to +2 m higher than present
“A revised Holocene sea-level history for the southern Gulf of Carpentaria [north of Australia] is presented based on new data from the South Wellesley Archipelago and age recalibration of previous research. … By 7700 cal. yr BP, sea-level reached present mean sea-level (PMSL) and continued to rise to an elevation of between 1.5 m and 2 m above PMSL [present mean sea-level]. Sea level remained ca. + 1.5 [meters above present mean sea-level] between 7000 and 4000 cal. yr BP, followed by rapid regression to within ± 0.5 m of PMSL by ca. 3500 cal. yr BP. … A full review of Holocene sea-level around the Australian continental margin is provided by Lewis et al. (2013) which shows that, in general, sea-level around the coastal margin of Australia attained PMSL [present mean sea level] between 8000 and 7400 cal. yr BP, with an elevation of between 1 and 2 m above PMSL [present mean sea level].”
Xiong et al., 2018 South China, +2.25 to 3.94 m higher than present, (rate: +3.3 m per century)
“For the period since 7000 cal. a BP, the RSL [relative sea level] from the study area shows almost no deviation from the present mean sea level, whilst a GIA model (e.g. Sun, 2016) suggests a 2.25 m – 3.94 m higher-than-present mid-Holocene sea-level highstand … According to the statistical analysis of far-field postglacial sea-level data by Stanford et al. (2011), there likely exists a broad period of rapid sea-level rise between the end of the Younger Dryas (11,300 cal. a BP) and c. 8800 cal. a BP, which can be called MWP [meltwater pulse] 1b. Within this period, the fast rate of sea-level rise is recorded around 9500 cal. a BP, and the rate reached 20.0 mm/a (95% confidence) or 25.0 mm/a (99% confidence) [+2.0 to 2.5 meters per century]. The result from Stanford et al. (2011) shows a marked decrease in the rate of sea-level rise immediately after 9500 cal. a BP. Coincidentally, our study from the PRD indicates that a phase of rapid rise in RSL in the early Holocene with a peak rate (33.0 ± 7.1 mm/a [~3.3 meters per century], 67% probability) centered at 9500 cal. a BP. In other words, the RSL history reconstructed from the study area is in a good agreement with the global synthesis.”
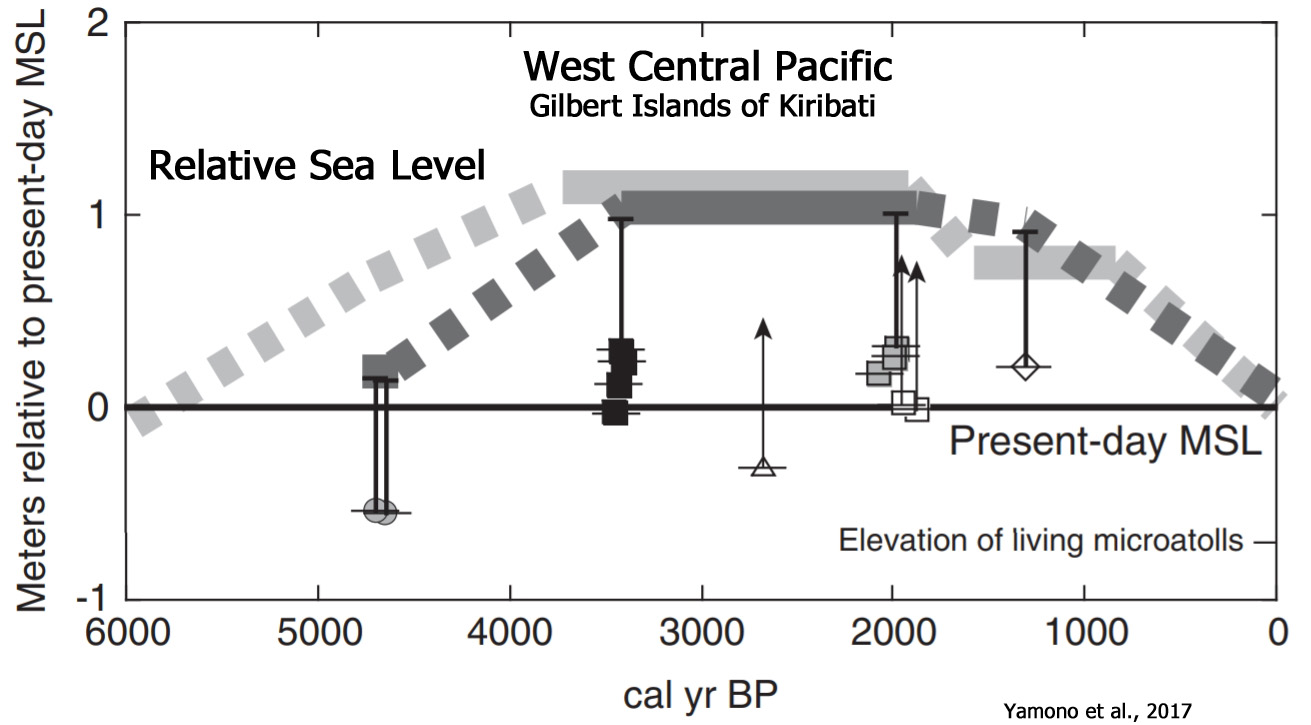
Yamono et al., 2017 Kiribati (Central Pacific), +2.4 m higher than present
“New coral microatoll data allow presenting an updated late Holocene sea-level curve for the Gilbert Islands of Kiribati. Examination of build-up elevation and spatial distribution of microatolls, along with radiocarbon age data from coral samples, suggest an approximately 1 m sea-level high stand [above present], possibly lasting from ~3500 to 1900 cal yr BP. … By radiocarbon dating fossil corals and Tridacna shells at several locations, Schofield (1977) showed that in the late Holocene, sea level in this region was approximately 2.4 m higher than at present, and also suggested that sea-level oscillations have occurred, with six transgressions during the last 5000 yr.”
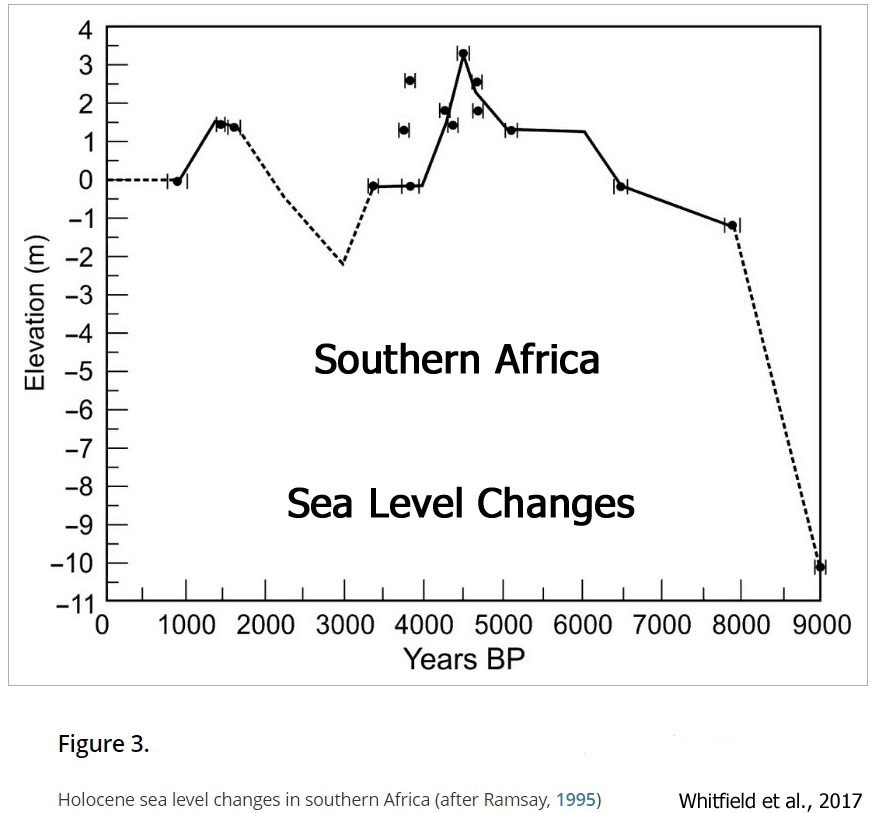
Whitfield et al., 2017 Southern Africa, +1.5 to +3.5 m higher than present
“The estuarine lagoon would have been deeper than the present-day Groenvlei [Southern Africa], especially during the mid-Holocene sea level highstand about 4,500 BP when the sea level was 3.5 m higher than present (Ramsay, 1995), and the lagoon would have been fully tidal in synchrony with the main Swartvlei Estuary to the west. … A subsequent rise in sea level to +1.5 m [above present] about 1,600 years BP (Ramsay, 1995) would have been insufficient to breach the stabilized dune field that was isolating Groenvlei from the Swartvlei Estuary.”
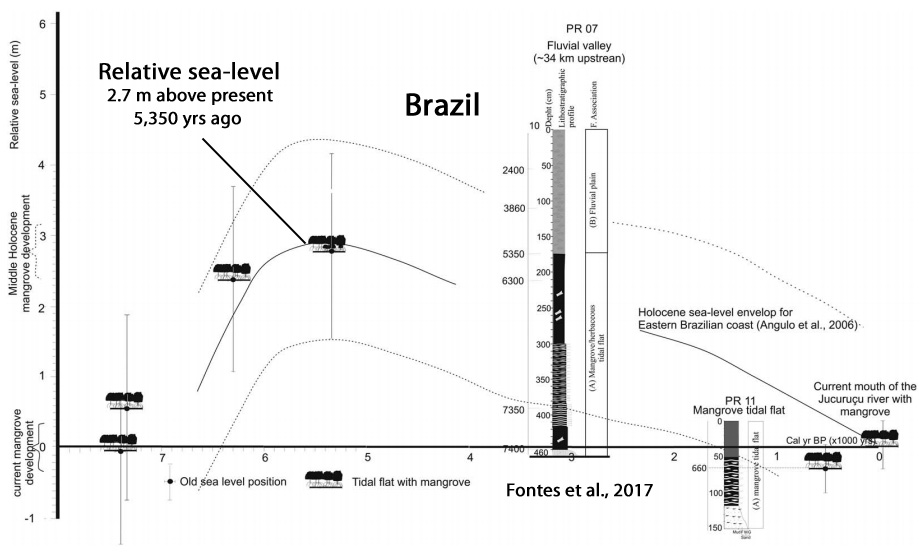
Fontes et al., 2017 Brazil, +2.7 m higher than present
“During the early-middle Holocene there was a rise in RSL [relative sea level] with a highstand at about 5350 cal yr BP [calendar years before present] of 2.7 ± 1.35 m [higher than present], which caused a marine incursion along the fluvial valley.”
Bini et al., 2017 Patagonia (Argentina), +2 to +5 m higher than present
“The main conclusion is that the relative sea-level between c. 7000 and 5300 cal. yr BP was in the range of c. 2–4 m a.s.l. [above present mean sea level], with a mean value of c. 3.5 m a.s.l. … Initial glacio-hydro-isostatic models of the Patagonian coast [Argentina] suggested that the shoreline could be characterized by currently raised beaches, which started to form as soon as ice-sheet melting ceased (Clark et al., 1978). A more recent model (Milne and Mitrovica, 2008) predicted that RSLs [relative sea levels] might have exceeded present by c. 5 m at 6000 cal. yr BP. [T]he altimetric and chronological data of the valleymouth terraces show a highstand between c. 7000 and 6600 cal. yr BP at c. 4 m a.s.l. [4 meters above present mean sea level], followed by a progressive fall to c. 2–2.5 m between 6200 and 5300 cal. yr BP.”
May et al., 2017 Western Australia, +1 to +2 m higher than present
“[T]he mid-Holocene sea-level highstand of Western Australia [was] at least 1–2 m above present mean sea level. … Between approximately 7000 and 6000 years BP, post-glacial RSL [relative sea level] reached a highstand of 1-2 m above the present one, followed by a phase of marine regression (Lambeck and Nakada, 1990; Lewis et al., 2013).”
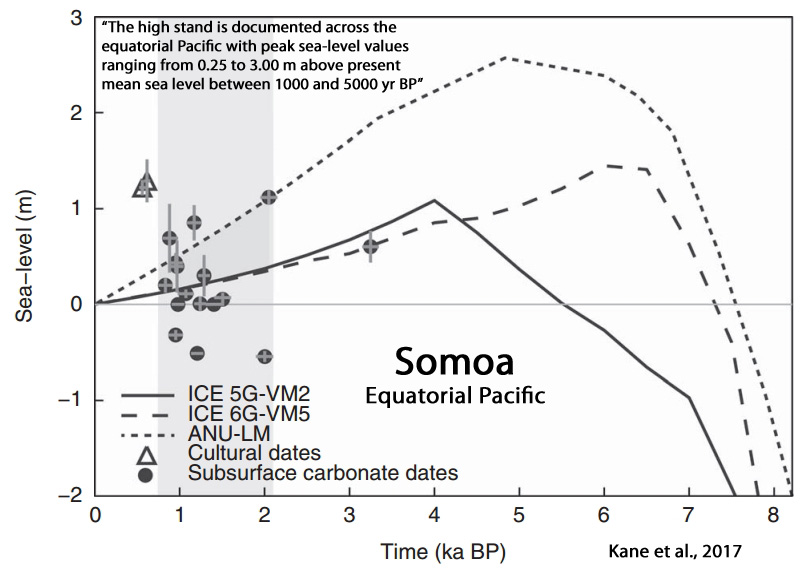
Kane et al., 2017 Equatorial Pacific, +0.25 to 3 m higher than present
“The high stand is documented across the equatorial Pacific with peak sea-level values ranging from 0.25 to 3.00 m above present mean sea level (MSL) between 1000 and 5000 yr BP (Fletcher and Jones, 1996; Grossman et al., 1998; Dickinson, 2003; Woodroffe et al., 2012). Woodroffe et al. (2012) argues that Holocene sea-level oscillations of a meter or greater are likely to have been produced by local rather than global processes.”
Dechnik et al., 2017 Tropical Western Pacific, +1 to +1.5 m higher than present
“[I]t is generally accepted that relative sea level reached a maximum of 1–1.5 m above present mean sea level (pmsl) by ~7 ka [7,000 years ago] (Lewis et al., 2013).”
Leonard, 2017 Great Barrier Reef, +0.75 m higher than present
“The resultant palaeo-sea-level reconstruction revealed a rapid lowering of RSL of at least 0.4 m from 5500 to 5300 yBP following a RSL [relative sea level] highstand of ~0.75 m above present from ~6500 to 5500 yBP. RSL then returned to higher levels before a 2000-yr hiatus in reef flat corals after 4600 yBP. The RSL oscillations at 5500 yBP and 4600 yBP coincide with both substantial reduction in reef accretion and wide spread reef “turn-off”, respectively, thereby suggesting that oscillating sea level was the primary driver of reef shut down on the GBR.”
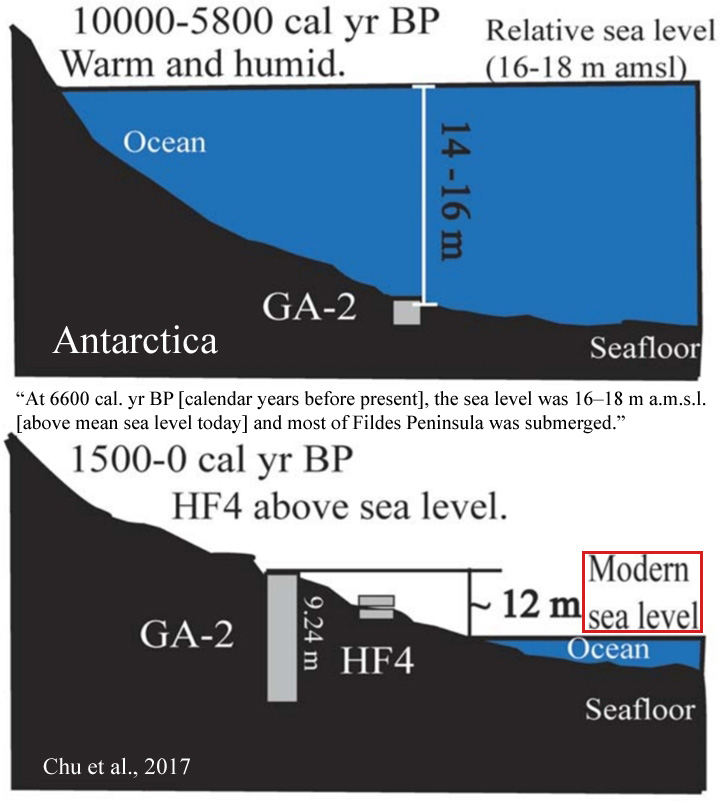
Chu et al., 2017 Antarctica, +16 to +18 m higher than present
“During 10 000–5800 cal. yr BP, Fildes Peninsula was warm and humid, grounded glaciers retreated and icefree regions were formed. At 6600 cal. yr BP, the sea level was 16–18 m a.m.s.l. [above mean sea level today] and most of Fildes Peninsula was submerged.”
Das et al., 2017 India, +2 m higher than present
“In the absence of any evidence of land-level changes, the study suggests that at around 6 ka to 3 ka [6,000 to 3,000 years ago], the sea was approximately 2 m higher than present.”
Lecea et al., 2017 South Africa, South/Northeast Australia, Brazil, +1.7 m to +3.5 m higher than present
“Ramsay (1995) produced a 9 kyr BP record of sea-level changes from the South African east coast, that showed sea levels reached a high stand of +3.5 m [above present] at 4.65 kyr BP. Similar high stands have been recorded elsewhere in the Southern Hemisphere, on the west coast of South Africa (0 – 3 m [above present], Compton, 2001), in south Australia (1 – 3 m [above present], Belperio et al., 2002), south- and north-east Australia (1.7 m [above present], Baker et al., 2001; 2 m [above present], Larcombe et al., 1995, respectively) and Brazil (2.1 m [above present], Angulo et al., 2006). In South Africa this was followed by a drop below present level before rising to another high stand at 1.6 kyr BP (Compton, 2001; Ramsey, 1995). … In Mozambique, Norström et al., (2012) identified a sea-level highstand ~3 m above present at ~ 6.6 kyr BP.”

Zondervan, 2016 Great Barrier Reef, Australia, +2.85 m higher than present
“Preserved fossil coral heads as indicators of Holocene high sea level on One Tree Island [GBR, Australia] … Complete in-situ fossil coral heads have been found on beach rock of One Tree Island, a small cay in the Capricorn Group on the Great Barrier Reef. Measurements against the present low-tide mark provide a [Holocene] high stand of at least +2.85 m [above present sea levels], which can be determined in great accuracy compared to other common paleo sea-level record types like mangrove facies. The sea level recorded here is higher than most recent findings, but supports predictions by isostatic adjustment models. … Although the late Holocene high stand has been debated in the past (e.g. Belperio 1979, Thom et al. 1968), more evidence now supports a sea level high stand of at least + 1- 2 m relative to present sea levels (Baker & Haworth 1997, 2000, Collins et al. 2006, Larcombe et al. 1995, Lewis et al. 2008, Sloss et al. 2007).”
Prieto et al., 2016 Argentina, Uruguay, +4 to +6.5 m higher than present
“Analysis of the RSL [relative sea level] database revealed that the RSL [relative sea level] rose to reach the present level at or before c. 7000 cal yr BP, with the peak of the sea-level highstand c. +4 m [above present] between c. 6000 and 5500 cal yr BP [calendar years before present] … This RSL [relative sea level] curve was re-plotted by Gyllencreutz et al. (2010) using the same index points and qualitative approach but using the calibrated ages. It shows rising sea-levels following the Last Glacial Termination (LGT), reaching a RSL [relative sea level] maximum of +6.5 m above present at c. 6500 cal yr BP [calendar years before present], followed by a stepped regressive trend towards the present.”

Hodgson et al., 2016 East Antarctica, +8 m higher than present (rate: +1.2 to +4.8 m per century)
“Rapid early Holocene sea-level rise in Prydz Bay, East Antarctica … The field data show rapid increases in rates of relative sea level rise of 12–48 mm/yr [1.2 to 4.8 meters per century] between 10,473 (or 9678) and 9411 cal yr BP in the Vestfold Hills and of 8.8 mm/yr between 8882 and 8563 cal yr BP in the Larsemann Hills. … The geological data imply a regional RSL [relative sea level] high stand of c. 8 m [above present levels], which persisted between 9411 cal yr BP and 7564 cal yr BP [calendar years before present], and was followed by a period when deglacial sea-level rise was almost exactly cancelled out by local rebound.”

Spotorno-Oliveira et al., 2016 Brazil, +4 m higher than present
“The transgressing sea rapidly rose until reaching the ~ +4 m highstand [above present] level around 5000 years BP.”
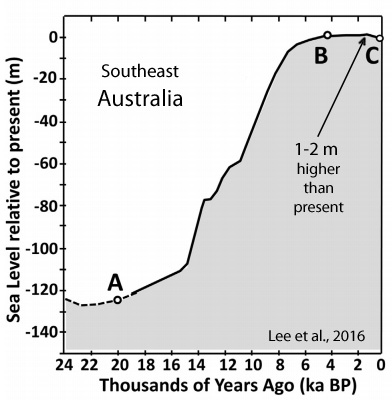
Lee et al., 2016 Southeast Australia, +1-2 m higher than present
“The configuration suggests surface inundation of the upper sediments by marine water during the mid-Holocene (c. 2–8 kyr BP), when sea level was 1–2 m above today’s level.”
May et al., 2016 Western Australia, +1-2 m higher than present
“Beach ridge evolution over a millennial time scale is also indicated by the landward rise of the sequence possibly corresponding to the mid-Holocene sea-level highstand of WA [Western Australia] of at least 1-2 m above present mean sea level.”
Accordi and Carbone, 2016 Kenya, Africa, +3.5 m to +6 m higher than present
“Then, the skeletal carbonate storage on the shelf reached its maximum 5 to 4 ka BP [5000 to 4000 years before present] (Ramsay, 1995) during a highstand about 3.5 m above the present sea level, when shallow marine accommodation space was greater than at present. … Along the Kenyan coast, a sea level stand above the present one during the mid-Holocene is documented in many places along the coast by various authors (Hori, 1970; Toyah et al., 1973; Åse, 1981, 1987; Oosterom, 1988), where the sea level might have reached +6 m above the Kenyan Datum between 2 and 3 ka BP [2000 and 3000 years before present].”

Mann et al., 2016 Indonesia, +0.5 m higher than present
“Radiometrically calibrated ages from emergent fossil microatolls on Pulau Panambungan indicate a relative sea-level highstand not exceeding 0.5 m above present at ca. 5600 cal. yr BP [calendar years before present].”
Leonard et al., 2016 Great Barrier Reef, Australia, +0.75 m higher than present
“RSL [relative sea level] was at least 0.75 m above present from ~6500 to 5500 yr before present (yr BP; where “present” is 1950). Following this highstand, two sites indicated a coeval lowering of RSL of at least 0.4 m from 5500 to 5300 yr BP which was maintained for ~200 yr. After the lowstand, RSL returned to higher levels before a 2000-yr hiatus in reef flat corals after 4600 yr BP at all three sites. A second possible RSL lowering event of ~0.3 m from ~2800 to 1600 yr BP was detected before RSL stabilised ~0.2 m above present levels by 900 yr BP. While the mechanism of the RSL instability is still uncertain, the alignment with previously reported RSL oscillations, rapid global climate changes and mid-Holocene reef “turn-off” on the GBR are discussed.”
Macreadie et al., 2015 Austalia, Eastern, +2 m higher than present
“[R]esults from other studies … suggest that high-stand, at perhaps 2 m above present msl [mean sea level] was achieved as early as 7000 radiocarbon years BP (7800 cal. years BP) [before present] and that sea-level has exceeded the present value for much of the mid- to late-Holocene [~7000 to ~1000 years ago].”
Lewis et al., 2015 Australia, Northeastern, +1 to +2 m higher than present
“[D]ata show a Holocene sea-level highstand of 1–2 m higher than present which extended from ca. 7500 to 2000 yr ago (Woodroffe, 2003; Sloss et al., 2007; Lewis et al., 2013). The hydro-isostatic adjustment is thought to account for these 1–2 m sea-level changes [falling] to present levels over the past 2000 yr (Lambeck and Nakada, 1990; Lambeck, 2002). … [R]eliable SLI data such as coral pavements and tubeworms from Western Australia suggest that relative sea-level was 0.86 m and 0.80 m above present at 1060 ± 10 and 1110 ± 170 cal. yr BP [~1100 calendar years before present], respectively (Baker et al., 2005; Collins et al., 2006).”
Harris et al., 2015 Great Barrier Reef, Australia, +1 to +1.3 m higher than present
“This hiatus in sediment infill coincides with a sea-level fall of ∼1–1.3 m during the late Holocene (ca. 2000 cal. yr B.P.), which would have caused the turn-off of highly productive live coral growth on the reef flats currently dominated by less productive rubble and algal flats, resulting in a reduced sediment input to back-reef environments and the cessation in sand apron accretion. Given that relative sea-level variations of ∼1 m were common throughout the Holocene, we suggest that this mode of sand apron development and carbonate production is applicable to most reef systems. … Microatoll death was most likely caused by a fall in sea level that stranded the microatolls on the reef flat due to their location in open-water unmoated environments. This suggests that paleo–sea level between 3900 and 2200 cal. yr B.P. was 1–1.3 m higher than present (based on an offset from MLWS tidal level to fossil microatoll elevation; Fig. 2). This paleo–sealevel elevation is similar to the ranges of 1–1.5 m suggested by Lewis et al. (2013) and Sloss et al. (2007) and data from Moreton Bay in southern Queensland of an elevation of 1.3 m (Leonard et al., 2013).”
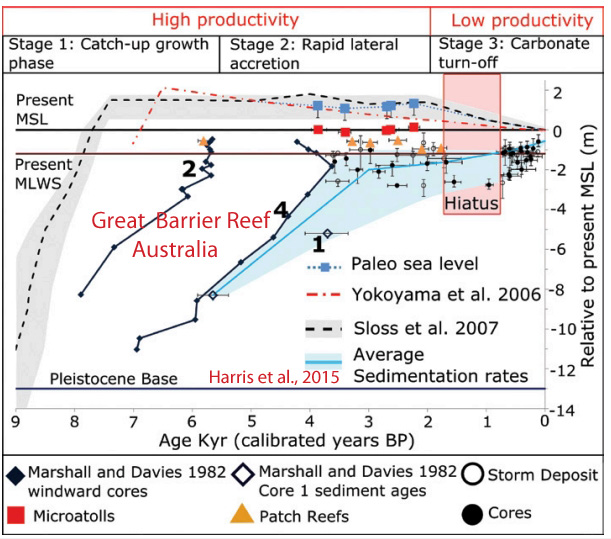
Hein et al., 2015 Brazil, +1 to +4 m higher than present
“In southern Brazil, falling RSL [relative sea level] following a 2–4 m [above present sea level] highstand at 5 to 6 ka [5,000 to 6,000 years ago] forced coastal progradation. … Relative SL [sea level] along the southern Brazil coast reached a highstand elevation of 1–4 m above MSL [mean sea level] at ca. 5.8 ka [5800 years ago].”
Engel et al., 2015 Western Australia, +1.5 m higher than present
“The foredunes overlie upper beach deposits located up to >2 m above the present upper beach level and provide evidence for a higher mid-Holocene RSL [relative sea level]. … [O]bservations made near Broome by Lessa and Masselink (2006) [indicate] the deposition of backshore deposits up to c. 1.5 m above present MHW [mean high water] between c. 2100–800 cal BP [2100-800 calendar years before present].”
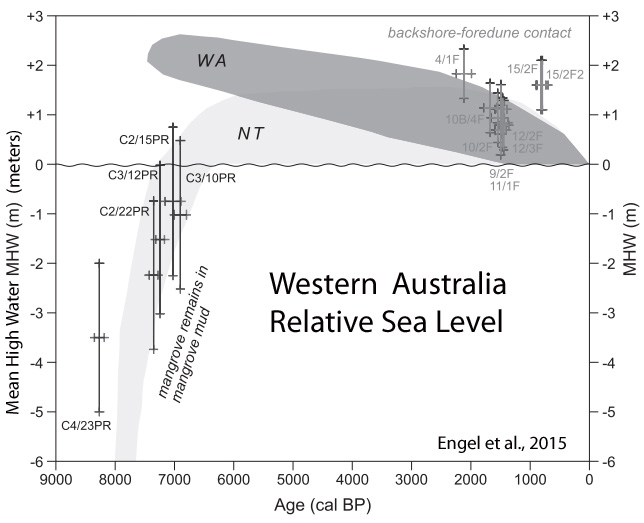
Rashid et al., 2014 French Polynesia, +1.5 m higher than present
“Upon correction for isostatic island subsidence, we find that local relative sea level was at least ~1.5±0.4 m higher than present at ~5,400 years ago.”
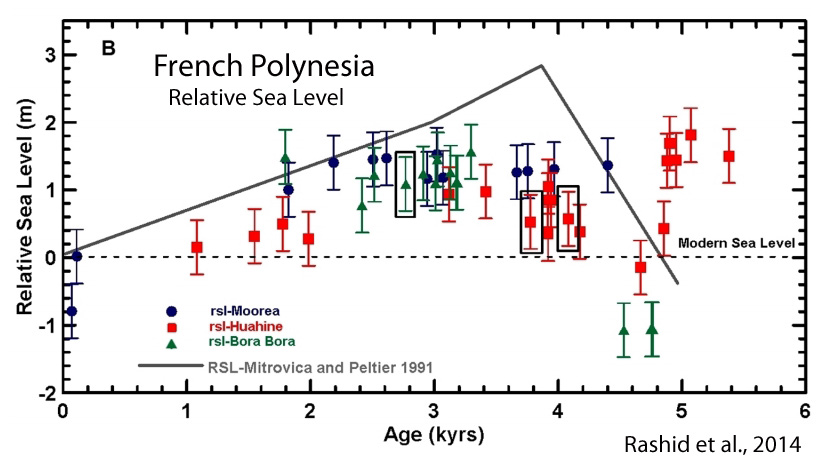
Strachan et al., 2014 South Africa, +3 m higher than present
“During the last 7000 years, southern African sea levels have fluctuated by no more than ±3 m. Sea-level curves based on observational data for southern Africa indicate that Holocene highstands occurred at 6000 and again at 4000 cal years BP, followed by a lowstand from 3000 to 2000 cal years B P. The mid-Holocene highstands culminated in a sea-level maximum of approximately 3 m above mean sea level (MSL) from 7300 to 6500 cal years BP [calendar years before present] and of 2 m above MSL at around 4000 cal years BP. Thereafter, RSL dropped to slightly below the present level between 3500 and 2800 cal years BP. Sea-level fluctuations during the late Holocene in southern Africa were relatively small (1-2 m); however, these fluctuations had a major impact on past coastal environments. Evidence from the west coast suggests that there was a highstand of 0.5 m above MSL from 1500 to 1300 cal years BP [calendar years before present] or possibly earlier (1800 cal years BP), followed by a lowstand (-0.5 m above MSL) from 700 to 400 cal years BP [during the Little Ice Age].”
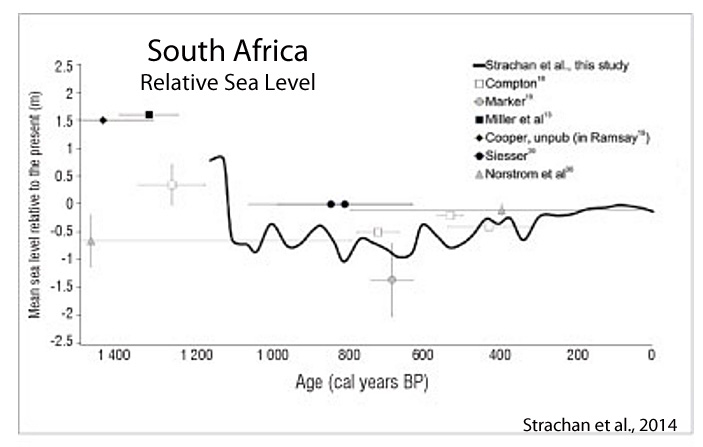
Yamano et al., 2014 Southwest Pacific Ocean, +1.1 m higher than present
“Mba Island initially formed around ~ 4500 cal yr B.P. [4500 calendar years before present], when sea level was ~ 1.1 m higher than at present.”
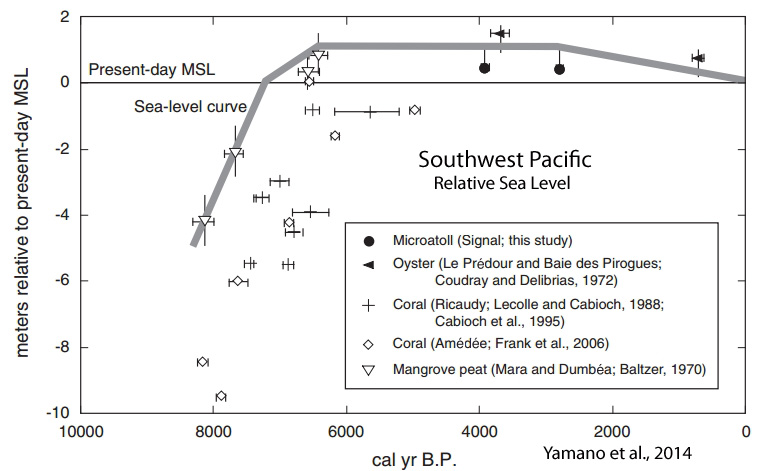
Kench et al., 2014 Marshall Islands (Central Pacific), +1.1 m higher than present
“[T]he mid-Holocene [sea level] highstand is reported to have peaked at approximately +1.1 m above present and was sustained until approximately 2000 years B.P. [before present] in the Marshall Islands.”
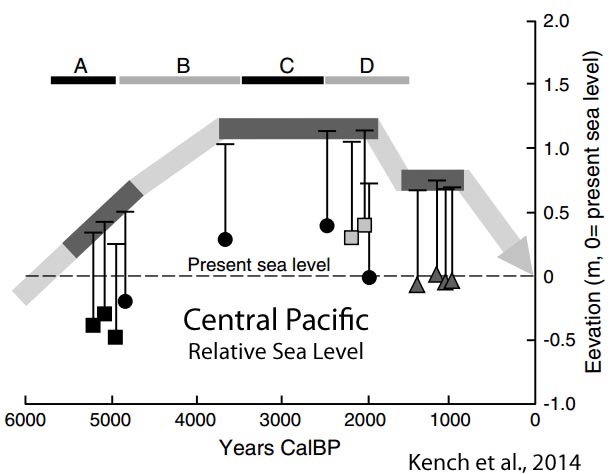
Hein et al., 2014 Brazil, +1 to +4 m higher than present
“Along the eastern and southern Brazilian coasts of South America, 6000 years of sea-level fall have preserved late-stage transgressive and sea-level highstand features 1–4 m above present mean sea level and several kilometers landward of modern shorelines.”

Bracco et al., 2014 Uruguay, +3 to +4 m higher than present
“Highlights: We present a sea level change curve for mid Holocene in Uruguay. Sea level reached 4 m amsl [above present mean sea level] between 6000 and 5500 yr BP [before present]. A rapid sea level fall to about 1 m amsl [above present mean sea level] was inferred for 4700-4300 yr BP. A further sea level increase to about 3 m amsl [above present mean sea level] was inferred after 4300 yr BP. After 4300 yr BP there was a constant sea level a decline.”
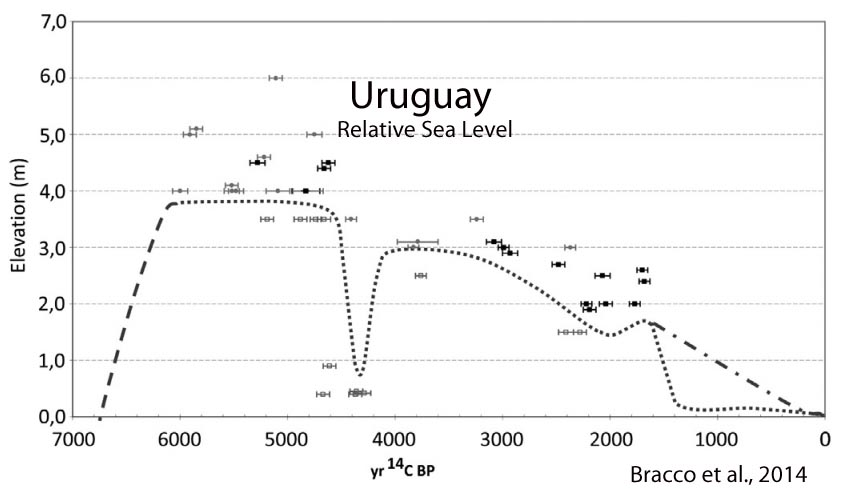
Lewis et al., 2013 SE Australia, ~ +1.3 to +1.6 m higher than present
“Sea-level estimates based on coral microatoll evidence places relative sea level at ~1.3 to 1.5 m [above present] between 6770 and 5750 cal. yr BP (original ages provided in Chappell et al., 1983; Yu and Zhao, 2010), in good accord with that derived from oyster bed data at ~1.6 m between 6280 and 5720 cal. yr BP (Beaman et al., 1994; Higley, 2000; Lewis et al., 2008).”
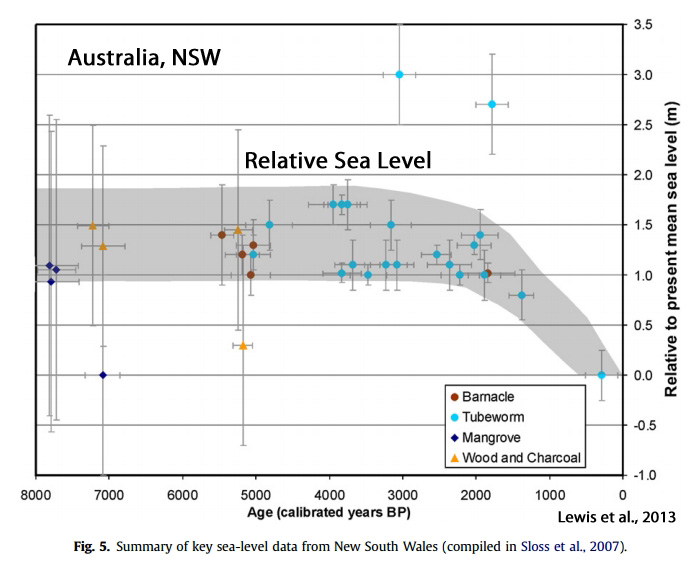
Watcham et al., 2011 Antarctic Peninsula, +15.5 meters higher than present
“The curve shows a mid-Holocene RSL highstand on Fildes Peninsula at 15.5 m above mean sea level between 8000 and 7000 cal a BP.”
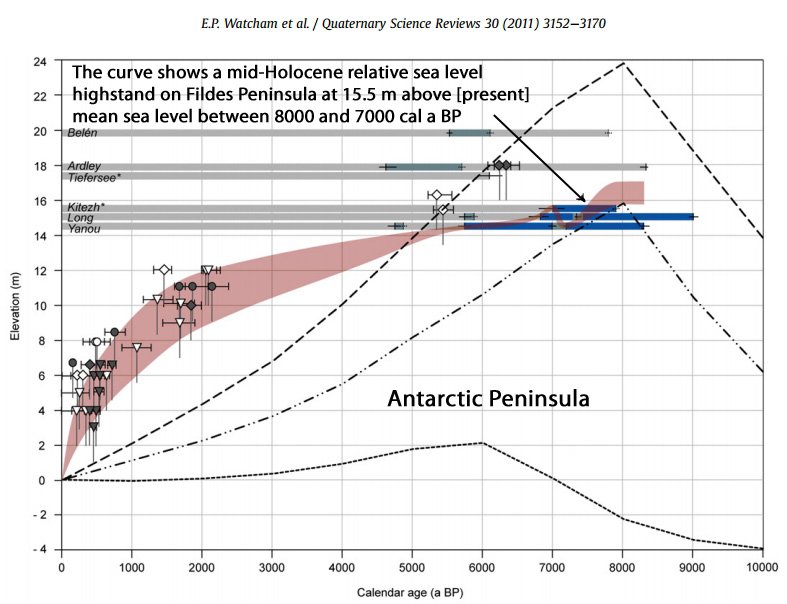


Recent Comments