
![]()
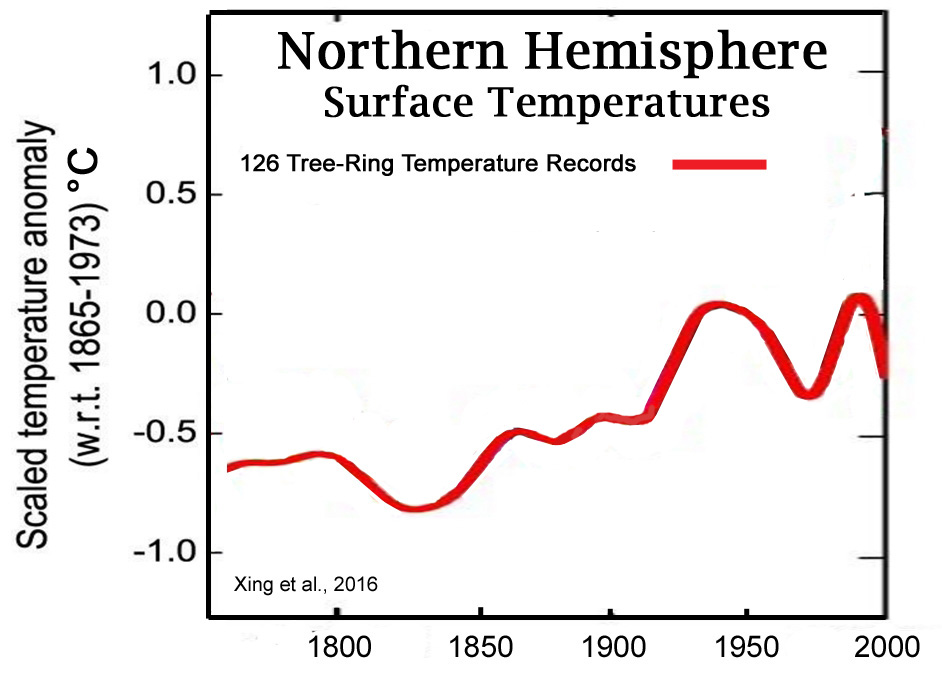
Xing et al., 2016 as adapted from Figure 7
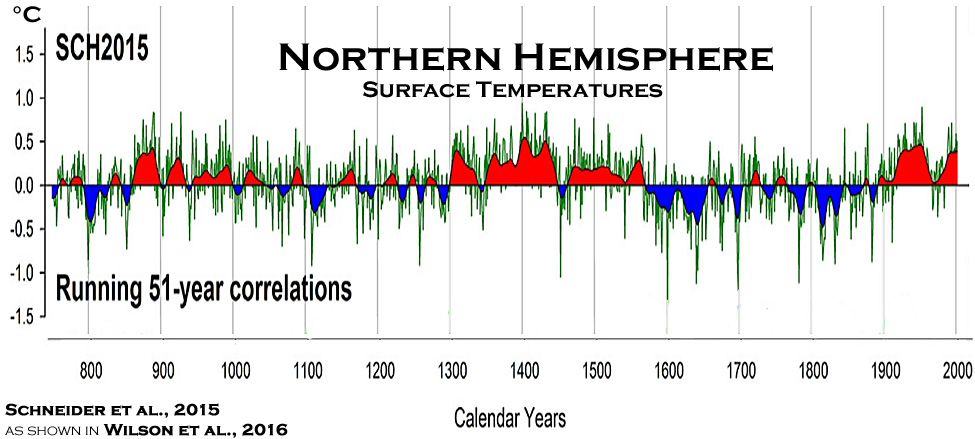
Wilson et al., 2016
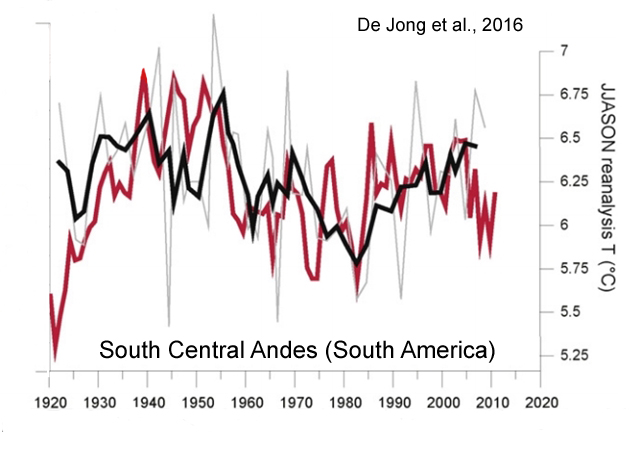
De Jong et al., 2016
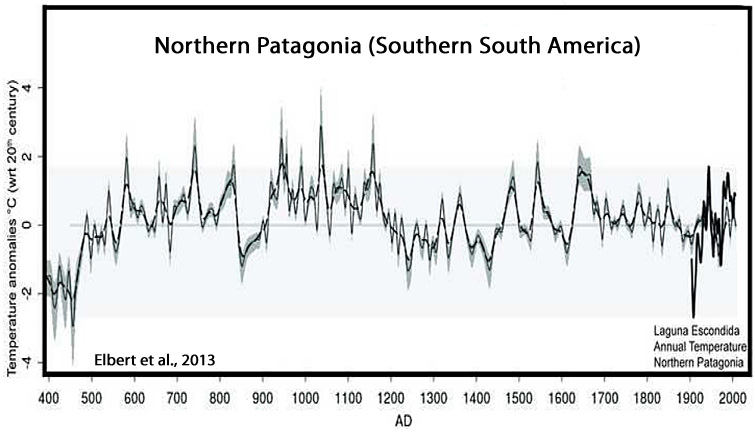
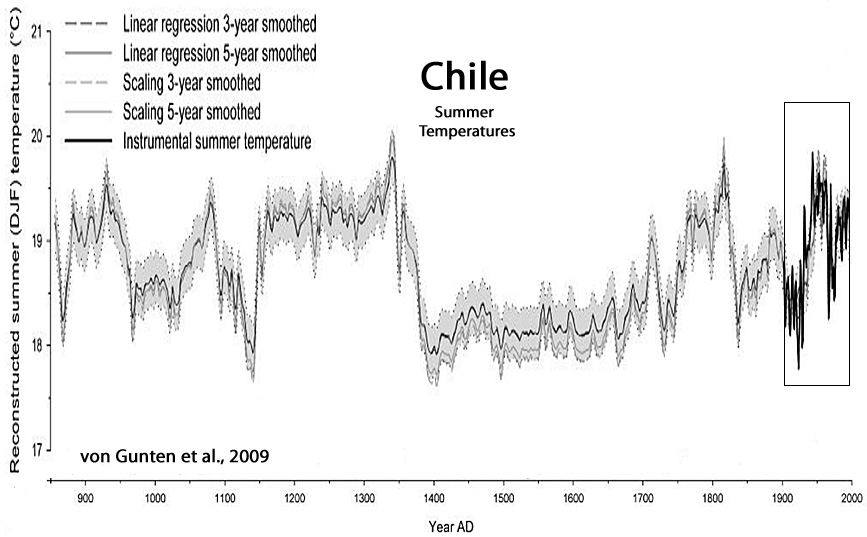
“[T]he reconstruction…shows that recent warming (until AD 2009) is not exceptional in the context of the past century. For example, the periods around AD 1940 and from AD 1950–1955 were warmer. This is also shown in the reanalysis data for this region and was also observed by Neukom et al. (2010b) and Neukom and Gergis (2011) for Patagonia and central Chile. Similarly, based on tree ring analyses from the upper tree limit in northern Patagonia, Villalba et al. (2003) found that the period just before AD 1950 was substantially warmer than more recent decades.”
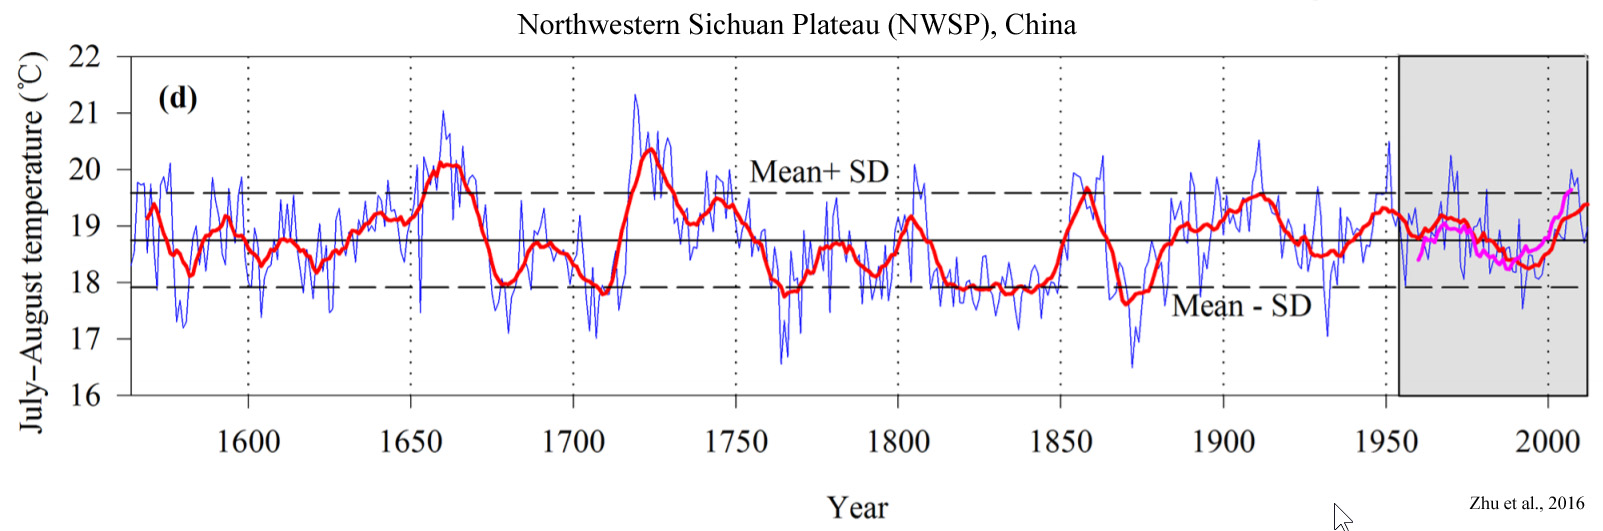
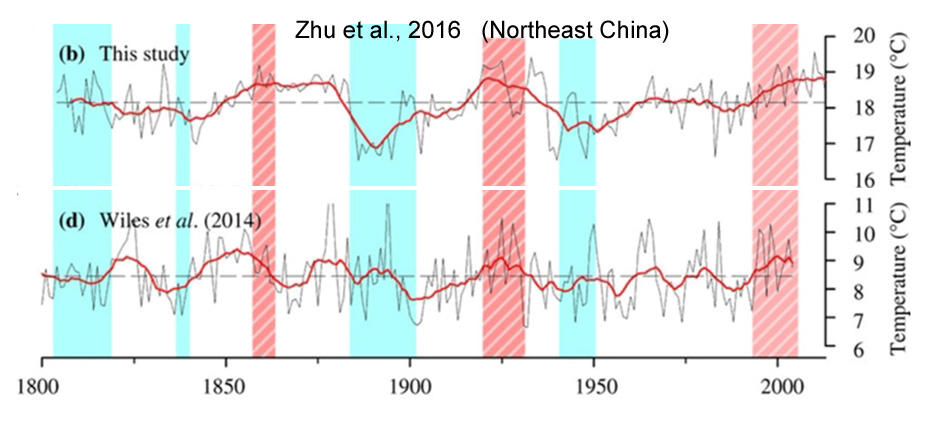
Zhu et al., 2016
“[W]e should point out that the rapid warming during the 20th century was not especially obvious in our reconstructed RLST [surface temperatures].”
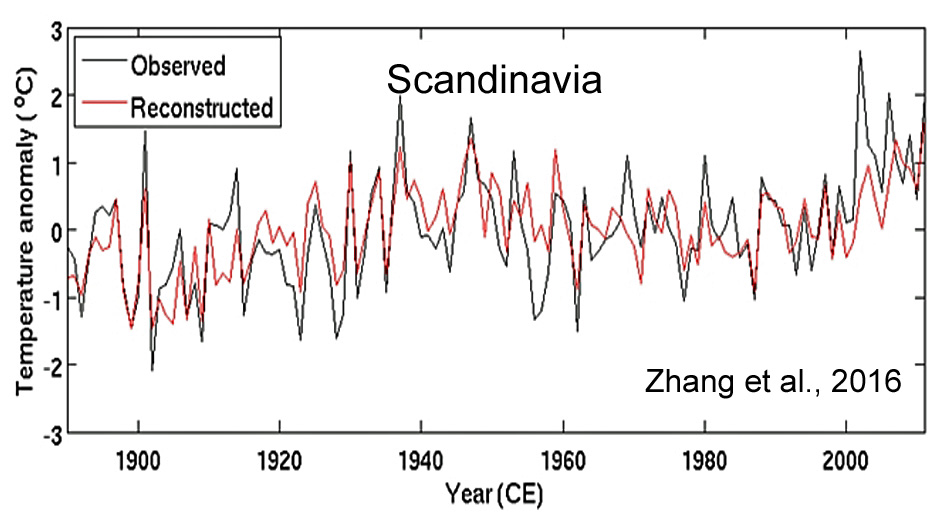
Zhang et al., 2016
“[P]resent-day global mean air temperatures may have been equally high around 1000 years ago during the so-called Medieval Climate Anomaly (MCA; Lamb, 1969; Grove and Switsur, 1994). However, since regional temperature reconstructions display large variability in the timing and magnitude of the MCA (PAGES 2k Consortium, 2013), this issue has not yet been adequately settled. Hence, there is still a great need to produce and improve empirical proxy data to further our understanding of near and distant climate changes.”
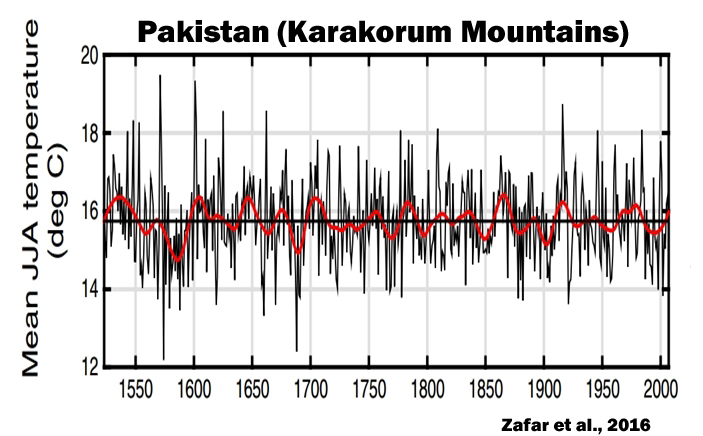
Zafar et al., 2016
“[O]ur results indicate that Karakorum temperature has remained decidedly out of phase with hemispheric temperature trends for at the least the past five centuries”
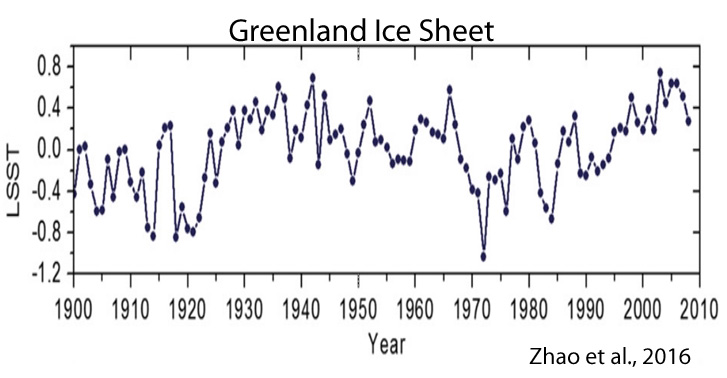
Zhao et al., 2016
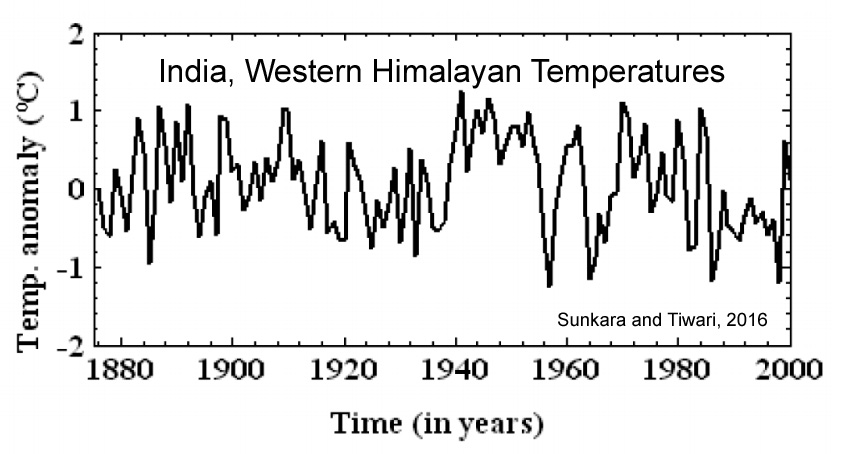
Sunkara and Tiwari, 2016
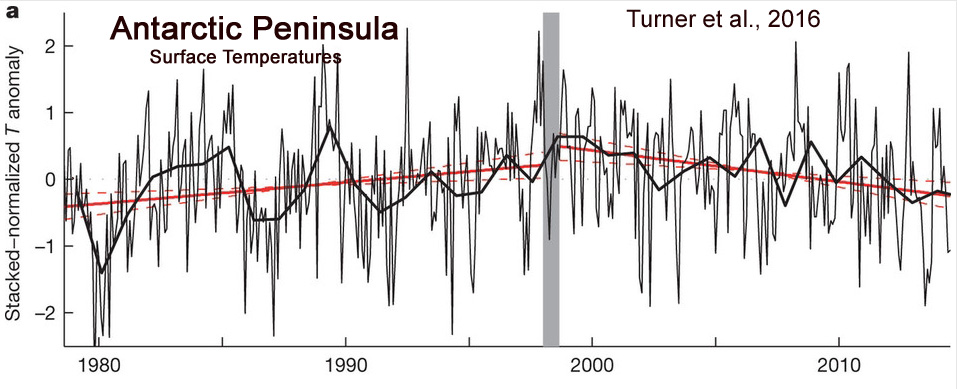
Turner et al., 2016
“Absence of 21st century warming on Antarctic Peninsula consistent with natural variability”
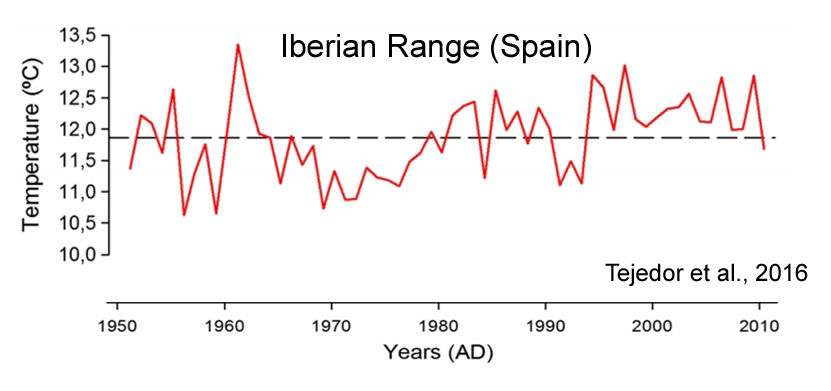
Tejedor et al., 2016
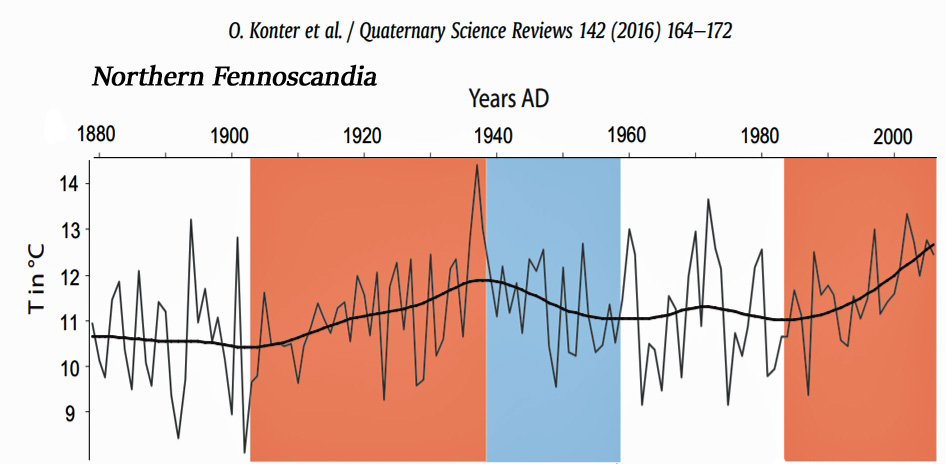
Konter et al., 2016
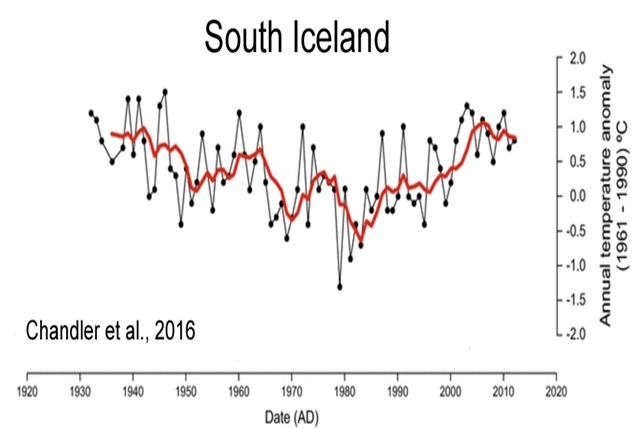
Chandler et al., 2016
“Analysis of climate data for SE Iceland also indicates that the three periods of ice-frontal retreat [1936-’41, 1951-’56, and 2006-’11] identified are associated with similar summer air temperature values, which has previously been shown to be a key control in terminus variations in Iceland. We, therefore, demonstrated that the coincidence of the most recent phase of ice-frontal retreat at Skálafellsjökull (2006–2011) and warming summer temperatures is not unusual in the context of the last ~80 years. This highlights the need to place observations of contemporary glacier change in a broader, longer-term (centennial) context.”
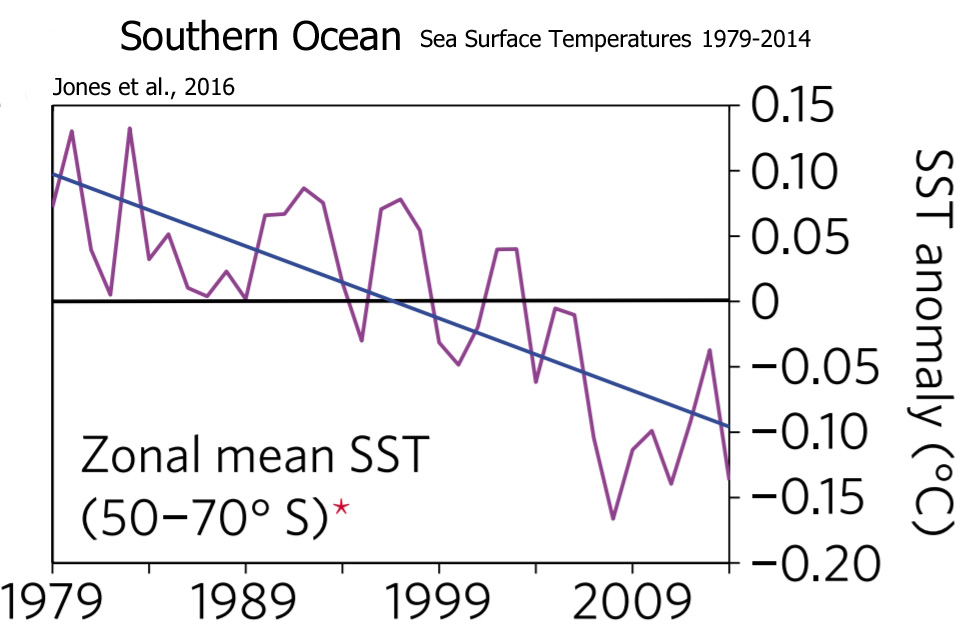
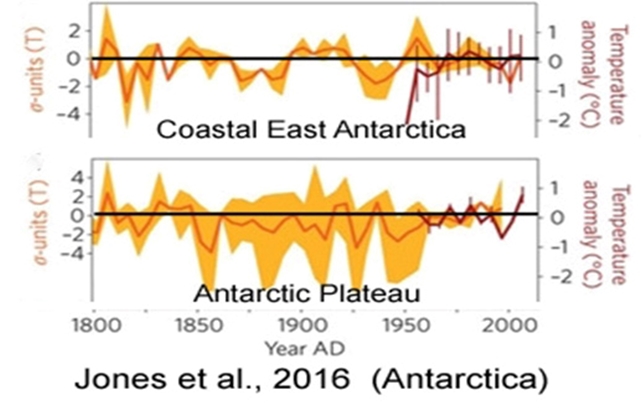
Jones et al., 2016
“[C]limate model simulations that include anthropogenic forcing are not compatible with the observed trends. … Over the 36-year satellite era, significant linear trends in annual mean sea-ice extent, surface temperature and sea-level pressure are superimposed on large interannual to decadal variability. Most observed trends, however, are not unusual when compared with Antarctic palaeoclimate records of the past two centuries.”
Zhu et al., 2016
“We identified four major cold periods (1839–1846, 1884–1901, 1906–1908 and 1941–1958) and three major warm periods (1855–1880, 1918–1932 and 1998–2013) in the past 211 years. The multi-taper method spectral analysis revealed significant cycles at 48.8, 11.5, 8.9, 3.9, 3.5 and 2–3 years, which might be associated with global climate oscillations and land-sea thermal contrasts, such as the sea surface temperatures, El Niño-Southern Oscillation, Atlantic Multidecadal Oscillation and solar activity.”
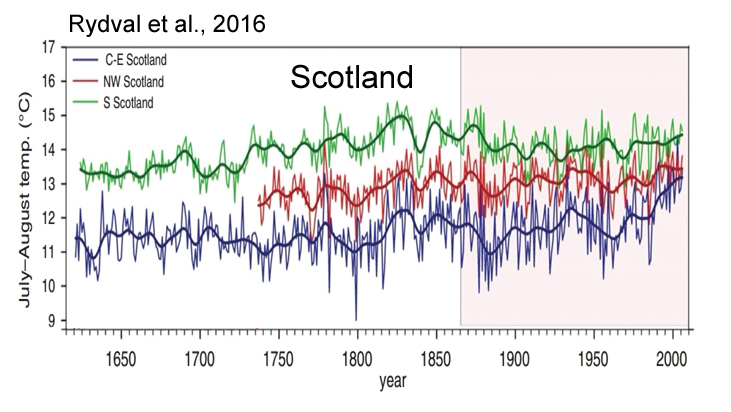
Rydval et al., 2016
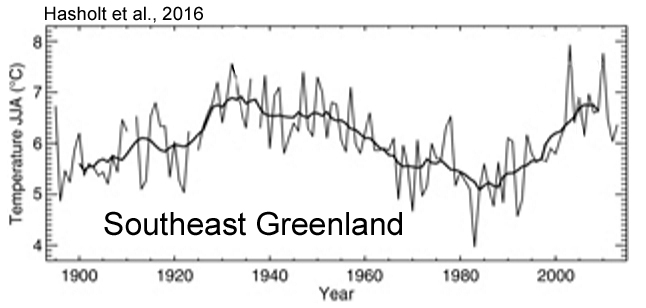
Hasholt et al., 2016
“We determined that temperatures for the ablation measurement periods in late July to early September were similar in both 1933 and the recent period [1990s – present], indicating that the temperature forcing of ablation within the early warm period and the present are similar.”
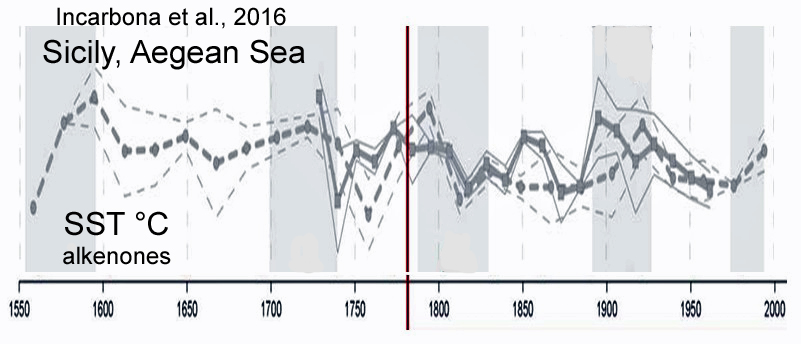
Incarbona et al., 2016
“Solar activity modulates patterns in surface temperature and pressure that resemble NAO phases, through dynamical coupling processes between the stratosphere and the troposphere that transmit the solar signal to the Earth’s surface.”
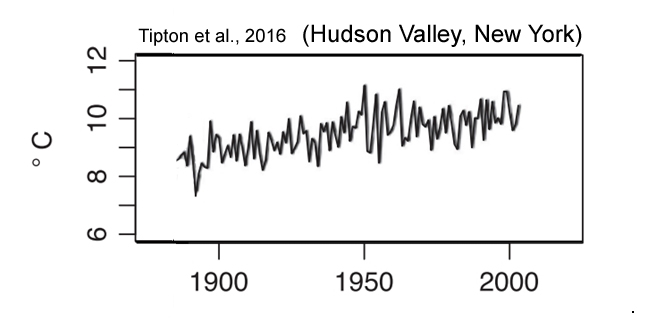
Tipton et al., 2016
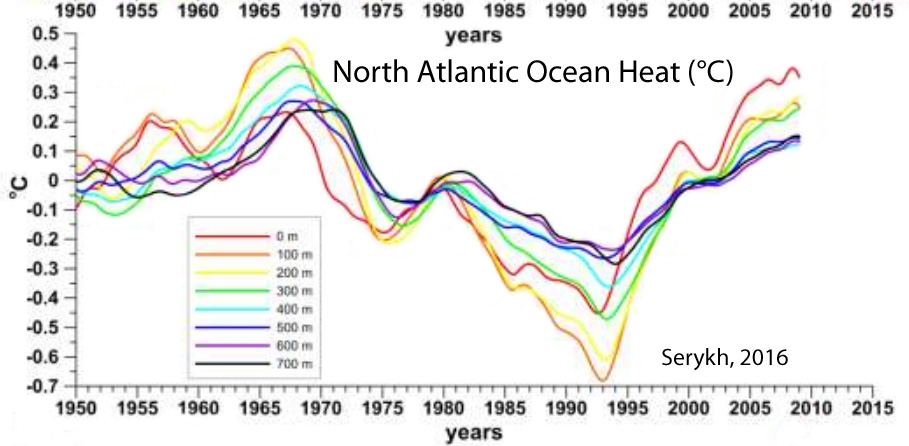
Serykh, 2016
“The very fast climate warming of the Euro-Asian continent that began in the 1970s may be associated with the enhanced heat transport from the North Atlantic in this period. This is evident from the fields and time series obtained in the present paper. The hiatus of this warming after 1999 may be due to the decreased heat transfer from the North Atlantic Ocean to the Eurasian territory.”
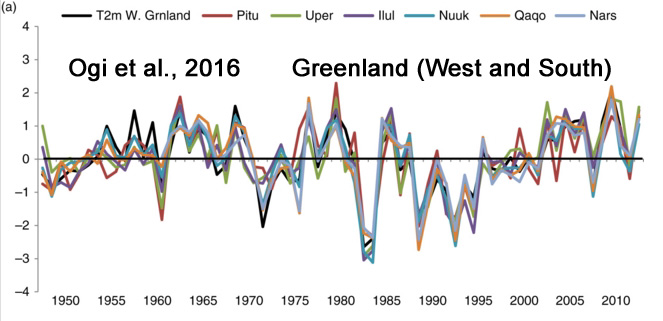
Ogi et al, 2016
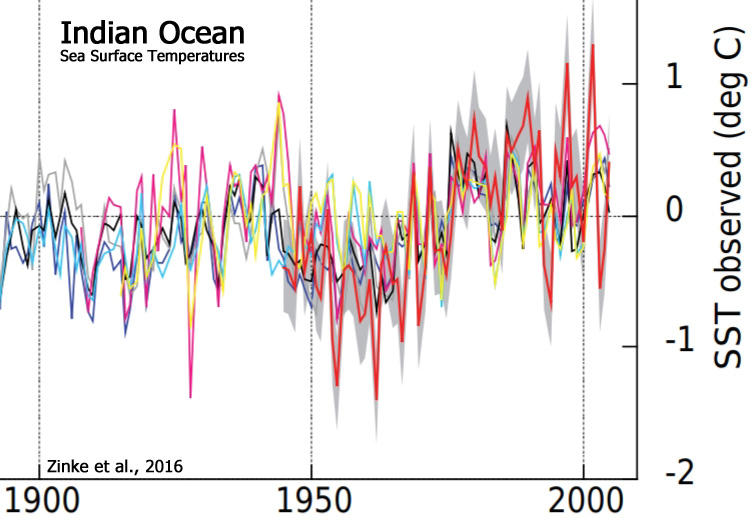
Zinke et al., 2016
“We calibrate individual robust Sr / Ca records with in situ SST and various gridded SST products. The results show that the SST record from Cabri provides the first Indian Ocean coral proxy time series that records the SST signature of the PDO in the south-central Indian Ocean since 1945. … Marked negative Sr /Ca anomalies (warmer) are observed during the first half of the 20th century centred at 1918/19, 1936–1941 and in the period 1948–1951 that exceed anomalies in the 1961 to 1990 reference period.”
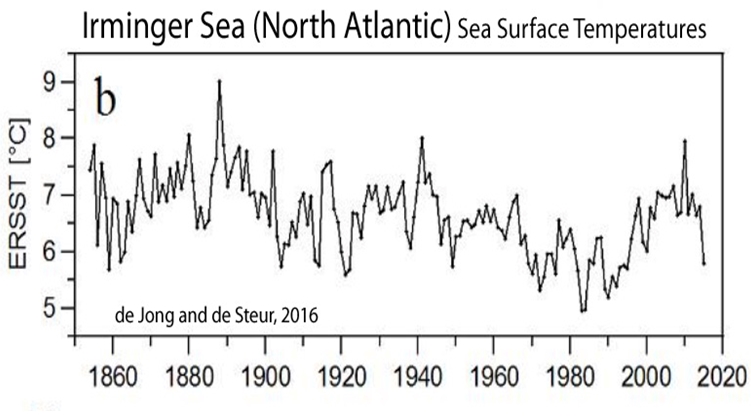
de Jong and de Steur, 2016
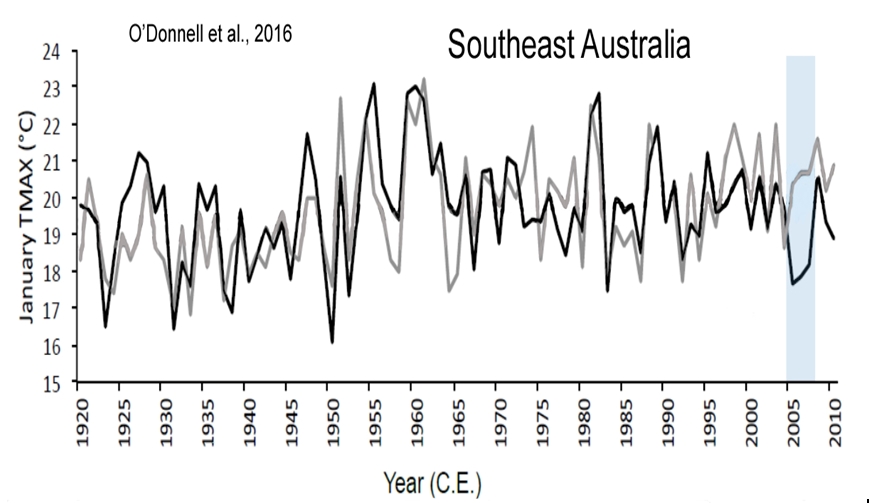
O’Donnell et al., 2016
Christy and McNider, 2016
“The time frame is 1883-2014. … Varying the parameters of the construction methodology creates 333 time series with a central trend-value based on the largest group of stations of -0.07 °C decade-1 with a best-guess estimate of measurement uncertainty being -0.12 to -0.02 °C decade-1. This best-guess result is insignificantly different (0.01 C decade-1) from a similar regional calculation using NOAA nClimDiv data beginning in 1895. … Finally, 77 CMIP-5 climate model runs are examined for Alabama and indicate no skill at replicating long-term temperature and precipitation changes since 1895.”

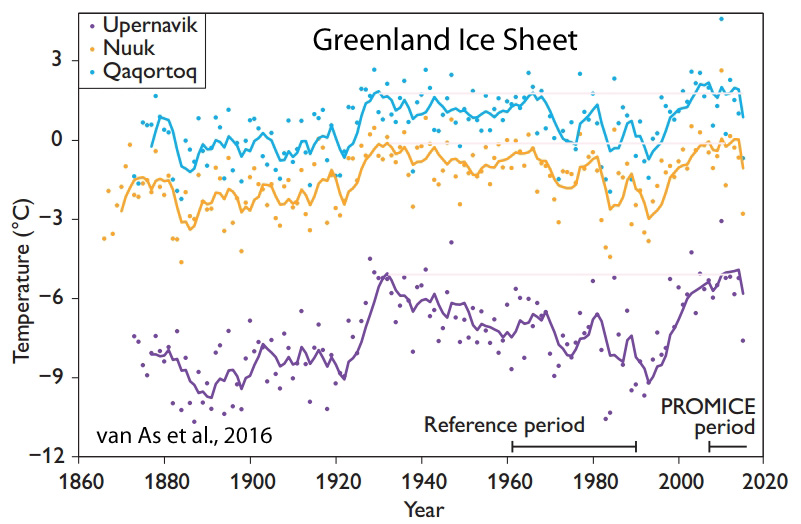
van As et al., 2016
“We conclude that at our study sites annual net ablation is likely to be larger in recent years than during any previous period in the instrumental era, covering up to 150 years. … [I]n southern Greenland ablation peaked significantly around 1930. While most of Greenland underwent relatively warm (summer) conditions in the 1930s (Cappelen 2015), this was most notable at the more southern locations, resulting in amplified ablation values according to our estimates. JJA [summer] temperatures were higher in 1928 and 1929 than in any other year of the Qaqortoq record, both attaining values of 9.2°C. This suggests that ablation in those years may have exceeded the largest net ablation measured on the Greenland ice sheet ( 2010).”
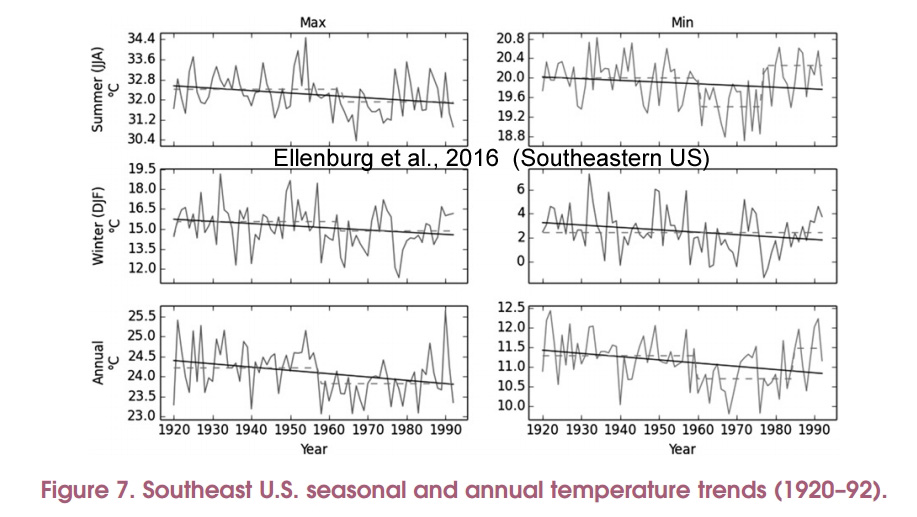
Ellenburg et al., 2016
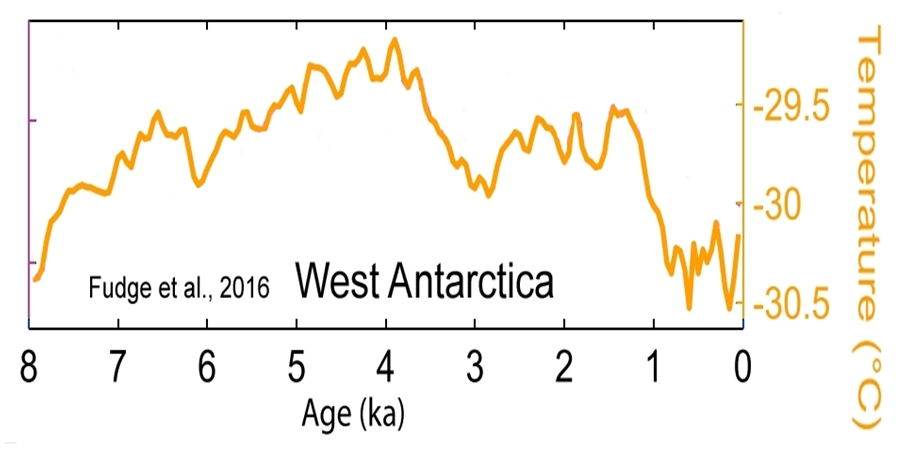
Fudge et al., 2016
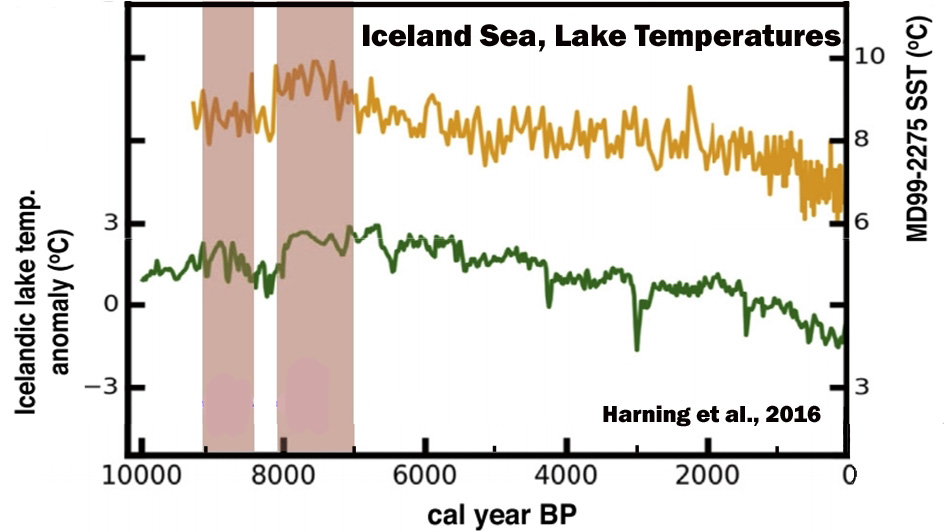
Harning et al., 2016
“Distal lakes document rapid early Holocene deglaciation from the coast and across the highlands south of the glacier. Sediment from Skorarvatn, a lake to the north of Drangajokull, shows that the northern margin of the ice cap reached a size comparable to its contemporary limit by ~10.3 ka. Two southeastern lakes with catchments extending well beneath modern Drangajokull confirm that by ~9.2 ka, the ice cap was reduced to ~20% of its current area.”
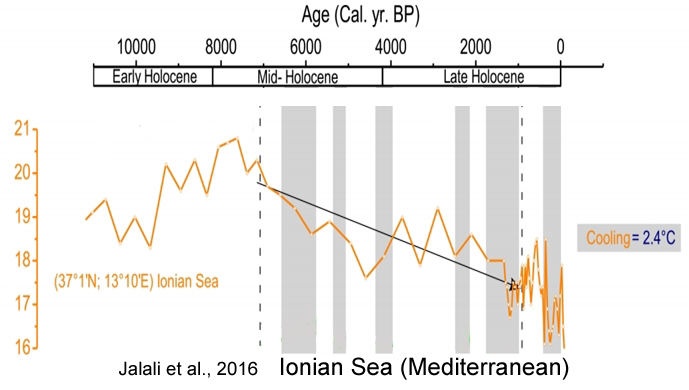
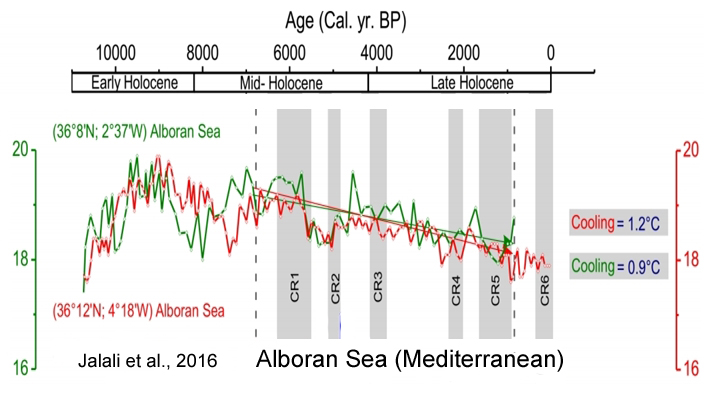
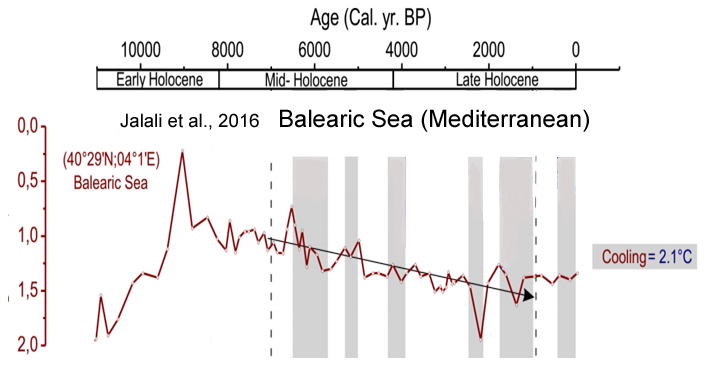
Jalali et al., 2016
“Several proxy records have documented surface water variability of the Mediterranean Sea during the Holocene (Kallel et al., 1997a, b, 2004; Cacho et al., 2001; Guinta et al., 2001; Rohling et al., 2002; Emeis et al., 2003; Essalami et al., 2007; Frigola et al., 2007; Castañeda et al., 2010; Boussetta et al., 2012; Martrat et al., 2014). Most of them reveal that Mediterranean Sea surface temperatures (SSTs) have undergone a long-term cooling punctuated by several cold relapses (CRs; Cacho et al., 2001; Frigola et al., 2007). While orbital forcing likely explains this long-term tendency, solar activity and volcanism contribute to forced variability (Mayewski et al., 2004; Wanner et al., 2011) together with internal variability (i.e. Atlantic multi-decadal variability (AMV), North Atlantic Oscillation; NAO) all together embedded in the multi-decadal scale variability seen in paleorecords.”
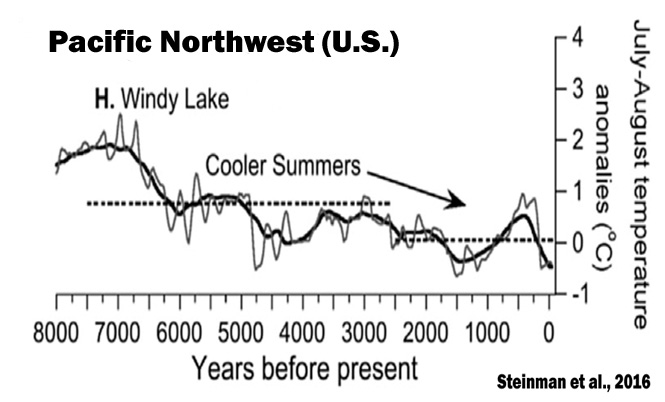
Steinman et al., 2016
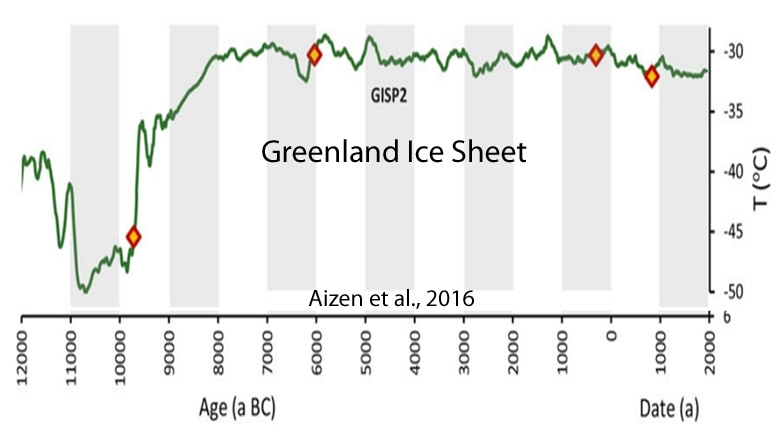
Aizen et al., 2016
“[R]ecent air temperatures (1993–2003) are, on average, 0.5 °C lower than air temperatures estimated during the MWP [Medieval Warm Period] and Holocene Climate Optimum. … [P]eriods warmer than modern periods occurred for ∼6.5 ka [6,500 years] including during the HCO and Medieval Warm Period.”
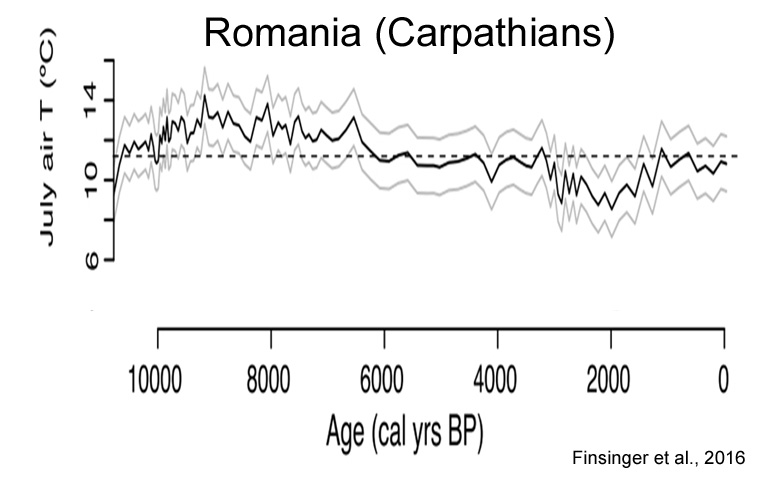
Finsinger et al., 2016
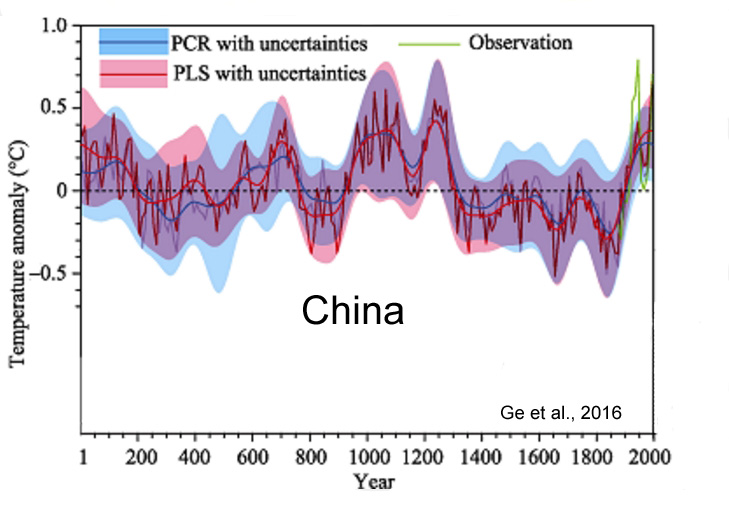
Ge et al., 2016
“Results of this study show that warm intervals over the last 2000 years were in AD 1-200, AD 551-760, AD 951-1320, and after AD 1921, while cold intervals were in AD 201-350, AD 441-530, AD 781-950, and AD 1321-1920. Interestingly, temperatures during AD 981-1100 and AD 1201-1270 were comparable to those of our Present Warm Period, but have an uncertainty of 0.28°-0.42°C at 95% confidence level. Temperature variations over the whole of China are typically in phase with those of the Northern Hemisphere (NH) after AD 1000, the period which covers the Medieval Climate Anomaly, the Little Ice Age (LIA), and the Present Warm Period.”
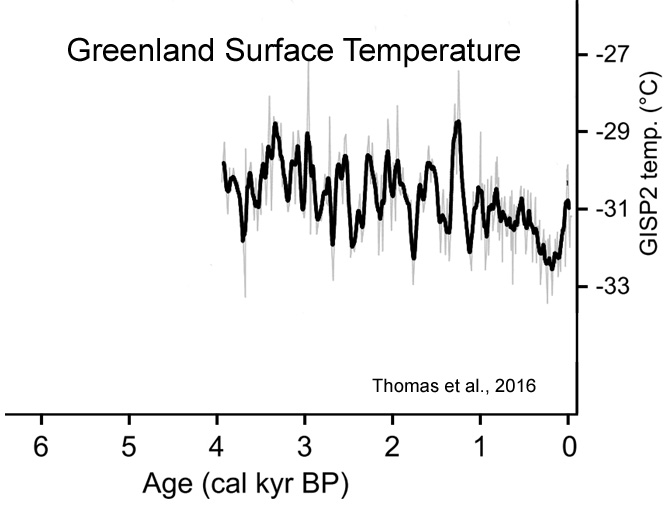
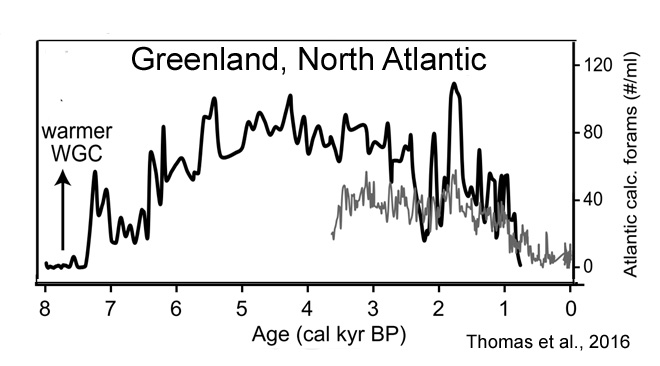
Thomas et al., 2016
Paired climate and ice sheet records from previous warm periods can elucidate the factors influencing GrIS mass balance on time scales longer than the observational record [Briner et al., 2016]. During the middle Holocene, temperature on Greenland was ~ 2°C higher than present [Cuffey and Clow, 1997; Axford et al., 2013].
Thirumalai et al., 2016

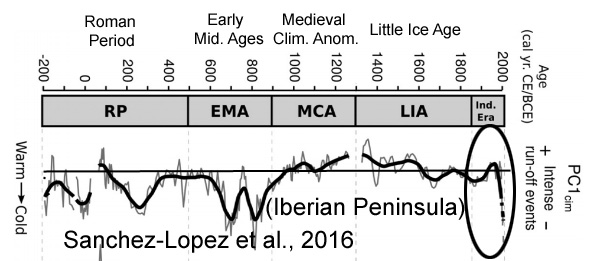
Sanchez-Lopez et al., 2016
“The dominant warm and arid conditions during the MCA [Medieval Climate Anomaly, 900-1300 CE], and the cold and wet conditions during the LIA [Little Ice Age, 1300-1850 CE] indicate the interplay of the NAO+, EA+ and NAO- , EA- [positive/negative North Atlantic Oscillation, East Atlantic phases], respectively. Furthermore, the higher solar irradiance during the [“warm conditions”] RP [Roman Period, 200 BCE – 500 CE] and MCA [Medieval Climate Anomaly, 900-1300 CE] may support the predominance of the EA+ [positive East Atlantic] phase, whereas the opposite scenario [“colder temperatures”] during the EMA [Early Middle Age, 500-900 CE] and LIA [Little Ice Age, 1300-1850 CE] may support the predominance of the EA- [negative East Atlantic] phase, which would favour the occurrence of frequent and persistent blocking events in the Atlantic region during these periods.”
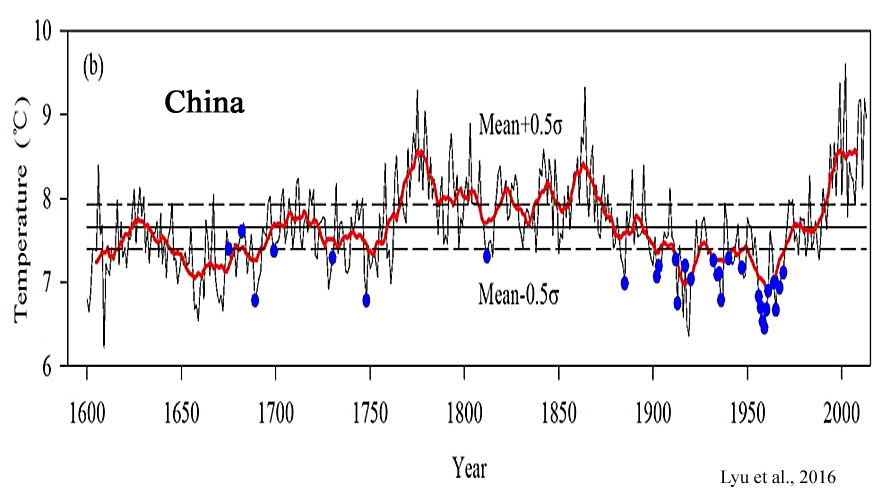
Lyu et al., 2016
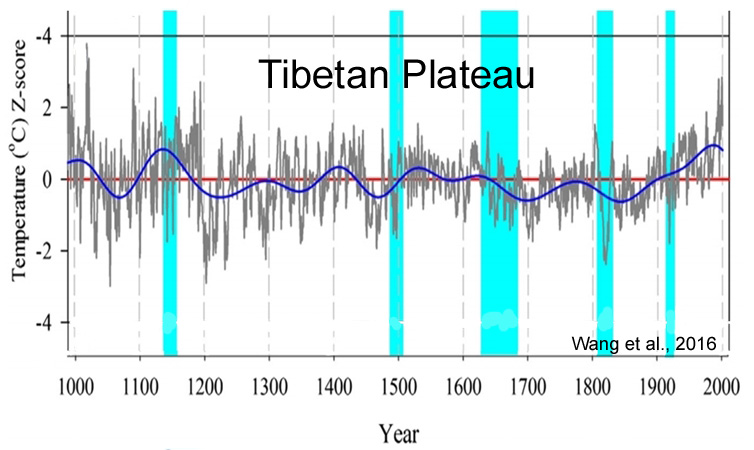
Wang et al., 2016
.
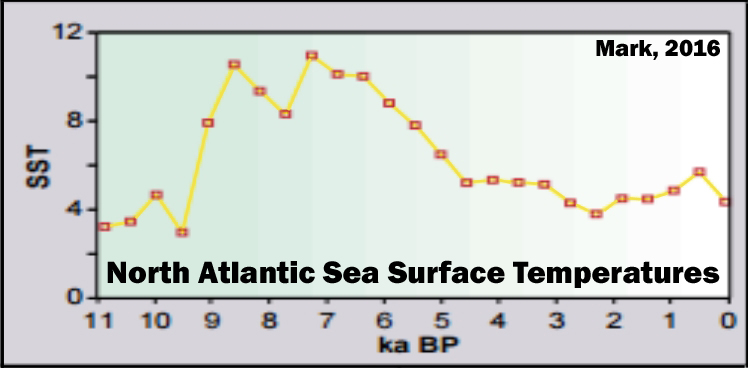
Mark, 2016
“Much of the North Atlantic shows a maximum between 5000-8000 years B.P. Bradley et. al (2003) compiled a number of marine and terrestrial paleoclimatic proxies from throughout the Holocene which show fairly consistent broad trends in the climatic history of the North Atlantic region. Drawing from isotopic concentrations in ice cores, diatoms, pollen, and dendrochronological analyses, a clear period of elevated temperature, beginning at about 10,000 B.P and concluding at about 6,000 B.P precedes a slow and steady trend of cooling until present day.”
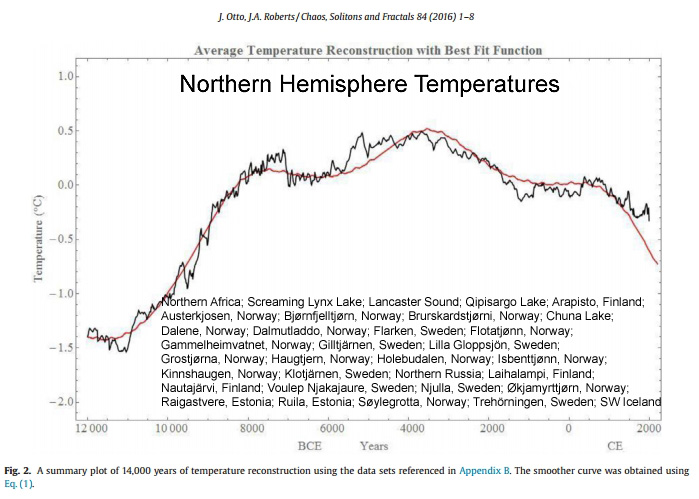
Otto and Roberts, 2016
“In addition to temperature records limited to the past 4000 years, data for the past few thousand years were tested. When the data were explored over the past 10,000 years, greater fluctuations in the temperature can be seen with a significant rise in temperature beginning at about 11,000 BCE and ending at 2000 CE with a maximum at about 5,000 BCE.”
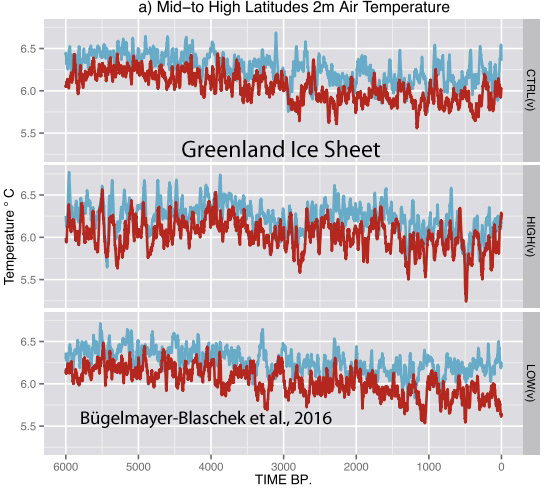
Bügelmayer-Blaschek et al., 2016
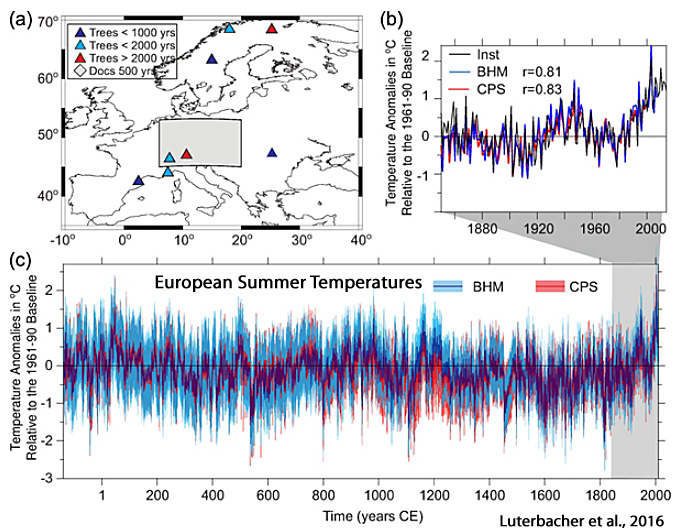
Luterbacher et al., 2016
![]()
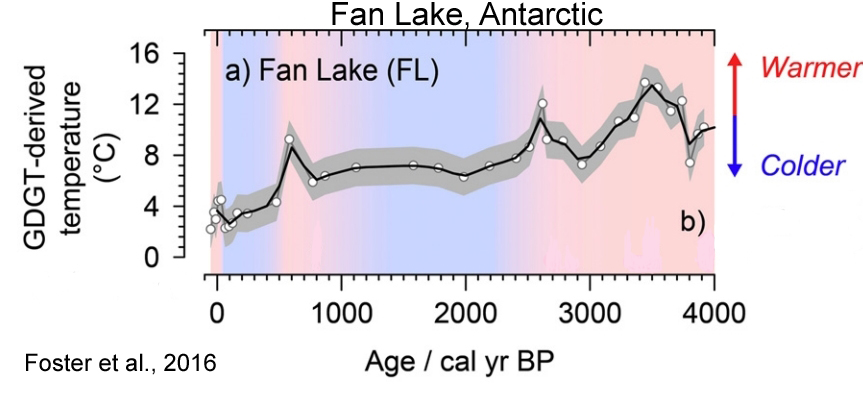
Foster et al., 2016
“The Antarctic and sub-Antarctic GDGT–temperature reconstruction for Fan Lake showed the warmest conditions between c. 3800 to 3300 cal yr BP with additional peaks in temperature at c. 2600 and 600 cal yr BP.”
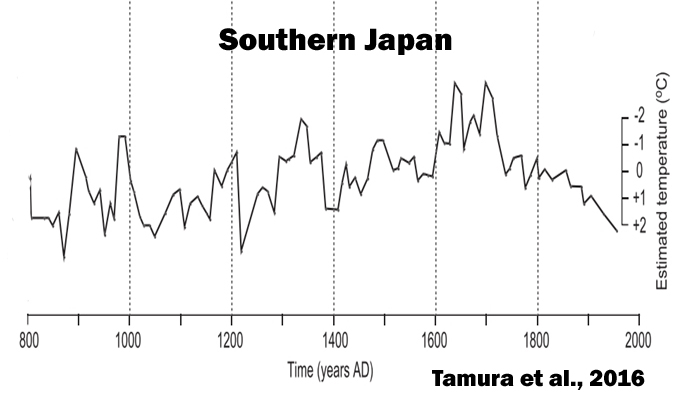
Tamura et al., 2016
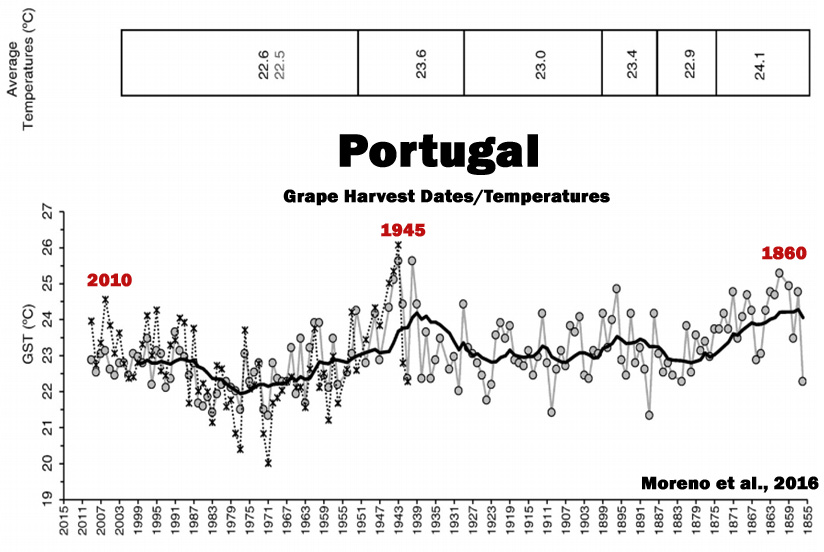
Moreno et al., 2016
“The major external forcing of the climate system derives from the Sun. A solar signature has been found in global mean surface temperatures, with evidence directly related to two noticeably different features of the Sun’s dynamics: its short-term irradiance fluctuations and secular patterns of 22-year and 11-year cycles (Scafetta and West, 2008). … [I]t is recognized that solar forcing manifestations denote a strong spatial and seasonal variability (Usoskin et al., 2006), and this would be the reason why it might be illusive to seek a single global relationship between climate and solar activity (de Jager, 2005). Thus, Le Mouël et al. (2009) stated that a regional approach may allow one to identify specific forms of solar forcing, where and when the solar input is most important. … [S]olar footprints on terrestrial temperatures [are] due to the strong non-linear hydrodynamic interactions across the Earth’s surface, and the accepted longerterm solar activity influence creating temperature oscillations for tens or even hundreds of years (Scafetta and West, 2003, 2007, 2008). … These spectral analysis results appear to support a solar forcing with regards to Minho GHD [grape harvest dates]”
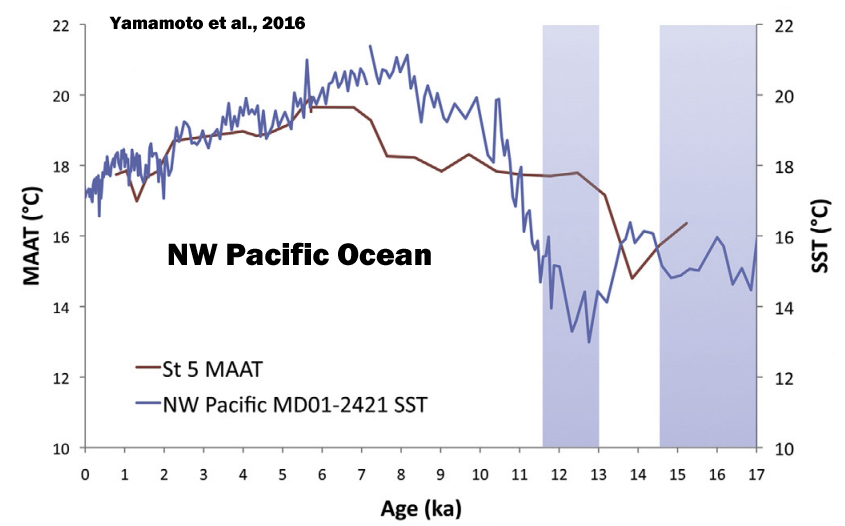
Yamamoto et al., 2016
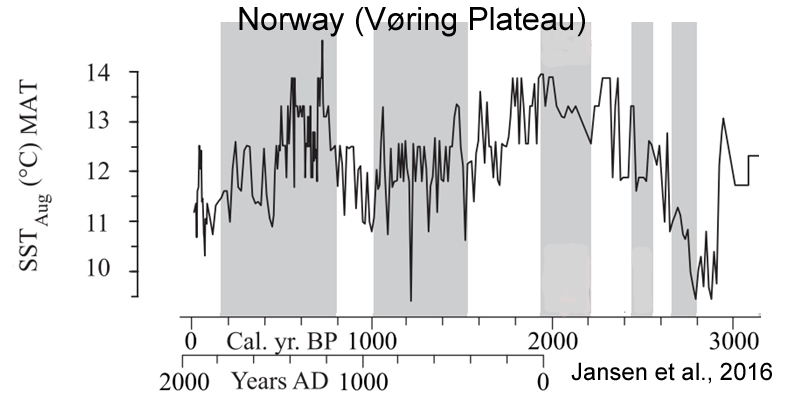
Jansen et al., 2016
“We suggest that deviations in ELA fluctuations between Scandinavian maritime and continental glaciers around 7150, 6560, 6000, 5150, 3200 and 2200 cal. yr BP reflect the different response of continental and maritime glaciers to drops in total solar irradiance (TSI).”
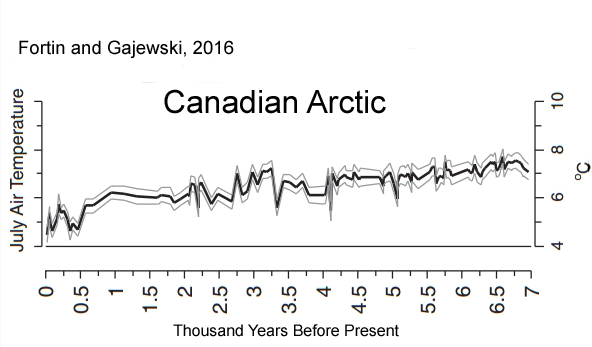
Fortin and Gajewski, 2016
“A study of chironomid remains in the sediments of Lake JR01 on the Boothia Peninsula in the central Canadian Arctic provides a high-resolution record of mean July air temperatures for the last 6.9 ka …. Biological production decreased again at ~ 2 ka and the rate of cooling increased in the past 2 ka, with coolest temperatures occurring between 0.46 and 0.36 ka [460 and 360 years ago], coinciding with the Little Ice Age. Although biological production increased in the last 150 yr, the reconstructed temperatures do not indicate a warming during this time. … Modern inferred temperatures based on both pollen and chironomids are up to 3°C cooler than those inferred for the mid-Holocene.”
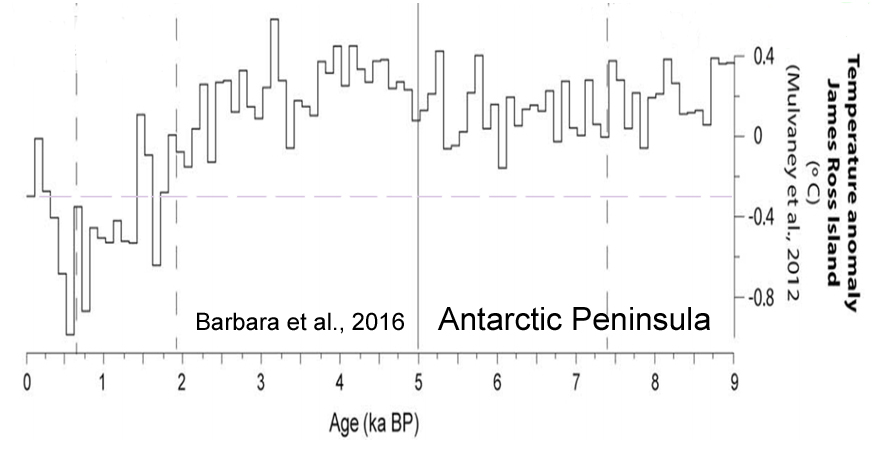
Barbara et al., 2016
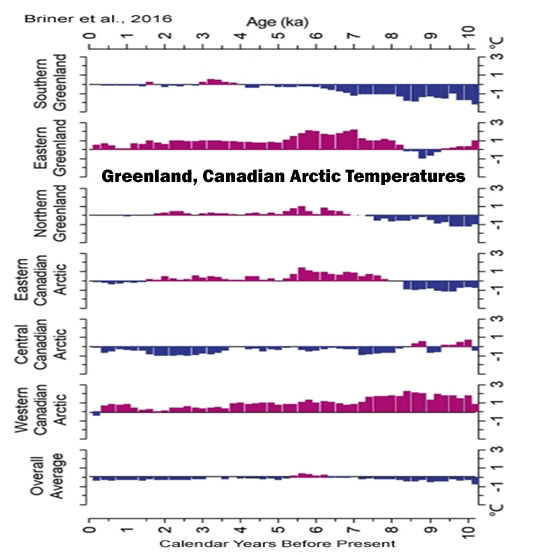
Briner et al., 2016
“The temperature decrease from the warmest to the coolest portions of the Holocene is 3.0 ± 1.0 °C on average (n = 11 sites). The Greenland Ice Sheet retracted to its minimum extent between 5 and 3 ka [5,000 and 3,000 years ago], consistent with many sites from around Greenland depicting a switch from warm to cool conditions around that time.”
“The temperature record, which integrates all seasons, shows rapid warming from the onset of the Holocene until ~9.5 ka [9,500 years ago], relatively uniform temperature at the millennial scale until ~7 ka [7,000 years ago], followed by ~3.5 °C temperature decline to the Little Ice Age [1250-1850 C.E.], followed by ~1.5 °C warming to today. [Today’s Greenland Ice Sheet temperatures are 2.0 °C colder than the Early and Middle Holocene] . The record also shows centennial-scale variability on the order of 1-2 °C, and a ~3 °C temperature oscillation during the 8.2 ka event.”
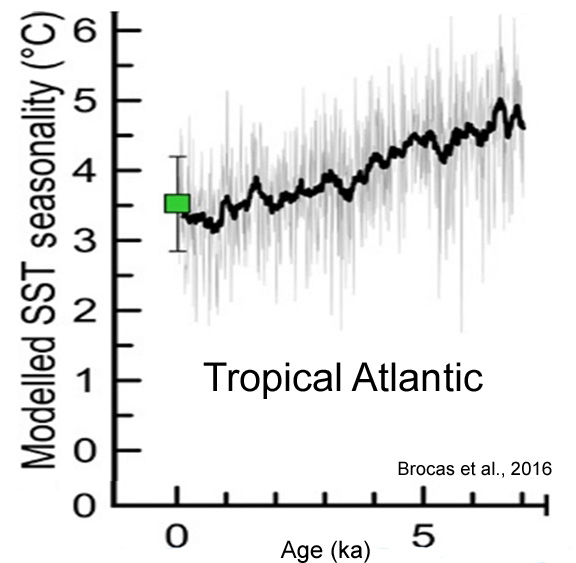
Brocas et al., 2016
“[W]ithin the mid-LIG [Last Interglacial, ~125,000 years ago], a significantly higher than modern SST seasonality of 4.9°C (at 126 ka) and 4.1°C (at 124 ka) is observed. These findings are supported by climate model simulations and are consistent with the evolving amplitude of orbitally induced changes in seasonality of insolation throughout the LIG, irrespective of wider climatic instabilities that characterised this period.”
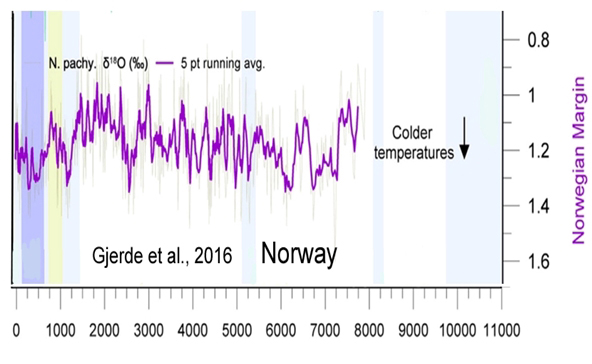
Gjerde et al., 2016
“The resulting Pw record is of higher resolution than previous reconstructions from glaciers in Norway and shows the potential of glacier records to provide high-resolution data reflecting past variations in hydroclimate. Complete deglaciation of the Ålfotbreen occurred ~9700 cal yr BP, and the ice cap was subsequently absent or very small until a short-lived glacier event is seen in the lake sediments ~8200 cal yr BP. The ice cap was most likely completely melted until a new glacier event occurred around ~5300 cal yr BP, coeval with the onset of the Neoglacial at several other glaciers in southwestern Norway. Ålfotbreen was thereafter absent (or very small) until the onset of the Neoglacial period ~1400 cal yr BP. The ‘Little Ice Age’ (LIA) ~650-50 cal yr BP [1350 to 1950] was the largest glacier advance of Ålfotbreen since deglaciation, with a maximum extent at ~400-200 cal yr BP, when the ELA was lowered approximately 200 m relative to today.”
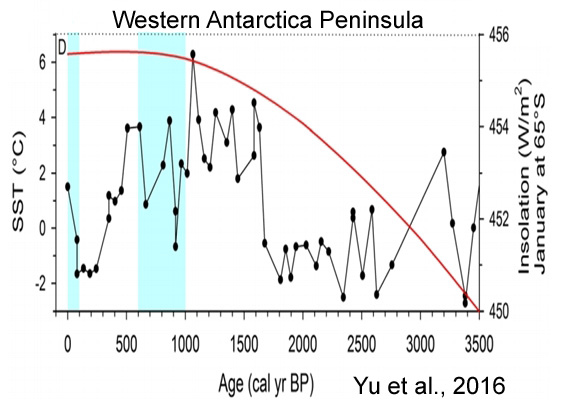
Yu et al, 2016
“The period at 900–600 cal B.P. was coldest as indicated by ice advance, abundance of kill ages from ice-entombed mosses exposed recently from retreating glacial ice, and apparent gap in peatbank initiation. Furthermore, the discovery of a novel Antarctic hairgrass (Deschampsia antarctica) peatland at 2300–1200 cal B.P. from the mainland Antarctic Peninsula suggests a much warmer climate than the present. … [T]he sea surface temperature record from Palmer Deep off Anvers Island suggests a pronounced climate warming of ~3°C at 1600–500 cal B.P. [Shevenell et al., 2011].”
Solomina et al., 2016 (Caucasus Mountains)
“The climate was warmer and glaciers were likely receding in the beginning of the past millennium CE (the “Arkhyz break in glaciation”). … In this pass, remains of wood radiocarbon dated to 700 ± 80 BP (1180–1420 CE) were buried in a 1.5-m-thick layer of alluvium (Kaplin et al., 1971; Kotlyakov et al., 1973). Currently, the upper tree limit is located 800–900 m below this elevation. … According to indirect estimates based on pollen analyses, the upper tree limit in the “Arkhyz” period was 200–300 m higher than today (Tushinsky, Turmanina, 1979). The remains of ancient buildings and roads were also found in the Klukhorsky pass at an elevation of 2781 a.s.l. [above sea level] (Tushinsky et al., 1966), and the glacier was still present at this elevation in the mid 20th century. … [I]n Central and East Transcaucasia, there are artificial terraces at elevations where agriculture is not currently possible and that there are remnants of forests in places where forests have not grown since the 16th century CE.”
“Turmanina (1988), based on pollen analysis, suggested that, in the Elbrus area, the climate during the “Arkhyz” time was dryer and warmer than in the late 20th century by 1–2 °C. … Solomina et al. (2014) determined the Medieval warming in the Caucasus to be approximately 1 °C warmer than the mean of the past 4500 years. According to the Karakyol palynological and geochemical reconstructions, the warm period was long and lasted for five centuries. Considering the suggestion of Turmanina (1988) that it was also less humid, the likelihood that many glaciers, especially those located at relatively low elevation, disappeared is very high. … The maximum glacier extent in the past millennium was reached before 1598 CE. The advance of the 17th century CE, roughly corresponding to the Maunder Minimum, is recorded at Tsey Glacier. … General glacier retreat started in the late 1840s CE and four to five minor readvances occurred in the 1860s–1880s CE. In the 20th century CE, the continued retreat was interrupted by small readvances in the 1910s, 1920s and 1970s–1980s.”
Lundeen and Brunelle, 2016 (Idaho, United States)
“Together, the proxies suggest that the early Holocene experienced larger than average snowpacks but very warm summers. Warmer than modern summer temperatures were maintained through much of the mid-Holocene, but snowpacks decreased dramatically, creating the most extreme xeric conditions in the Holocene between ~7100 and 6000 BP.”
Spolaor et al., 2016 (Arctic Ocean, Region)
“Researchers have found that 8000 years ago the Arctic climate was 2 to 3 degrees warmer than now, and that there was also less summertime Arctic sea ice than today.”
MacGregor et al., 2016 (Greenland Ice Sheet)
“[T]he interior of the GrIS [Greenland Ice Sheet] is flowing 95% slower now than it was on average during the Holocene [the last 9,000 years].”
Sun et al., 2016 (Xi’an, China)
“Comparing the climate between the mid-Holocene and present in the Xi’an area, the MAT [mean annual temperature] was about 1.1°C higher than today and the AP [annual precipitaion] was about 278 mm higher than today, similar to the modern climate of the Hanzhong area in the southern Qinling Mountains.”
Paus and Haugland, 2016 (Scandinavia)
“Around [9,500 years ago], pine suddenly established vertical belts of at least 200 m. These represent the highest pine-forests during the Holocene, ca. 210–170 m higher than today when corrected for land uplift. By this, summer temperatures at least 1–1.3°C warmer than today are indicated for the early Holocene thermal maximum around [8,500 to 9,500 years ago].”
Easterbrook, 2016 (Greenland)
“In the past 500 years, Greenland temperatures have fluctuated back and forth between warming and cooling about 40 times, with changes every 25–30 years. … Comparisons of the intensity and magnitude of past warming and cooling climate changes show that the global warming experienced during the past century pales into insignificance when compared to the magnitude of profound climate reversals over the past 25,000 years. At least three warming events were 20–24 times the magnitude of warming over the past century, and four were 6–9 times the magnitude of warming over the past century.”

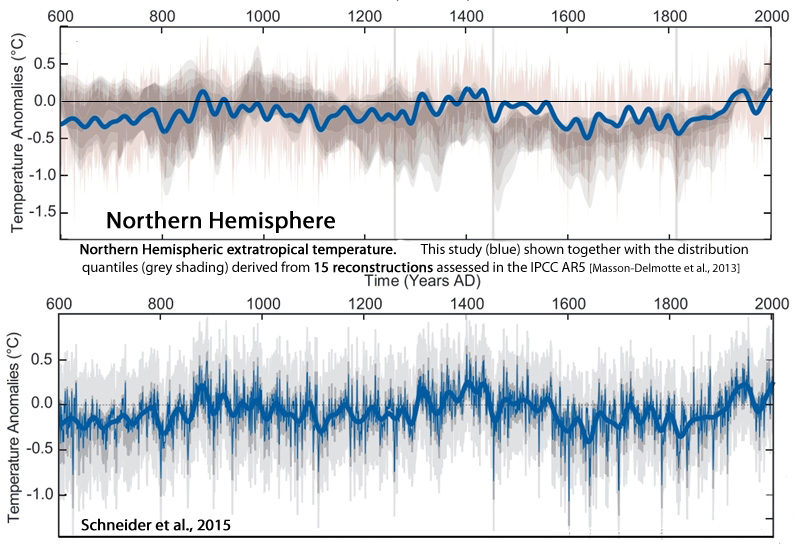
![]()
Schneider et al., 2015
Stoffel et al., 2015

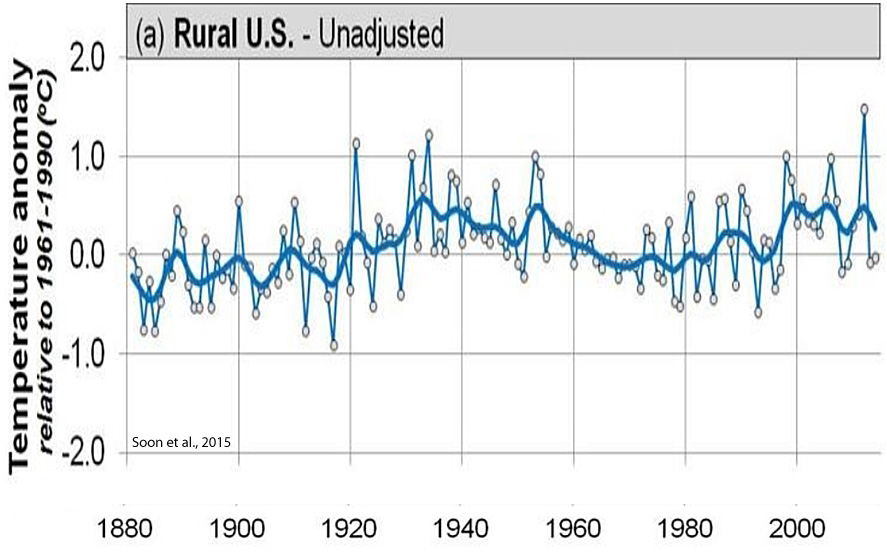
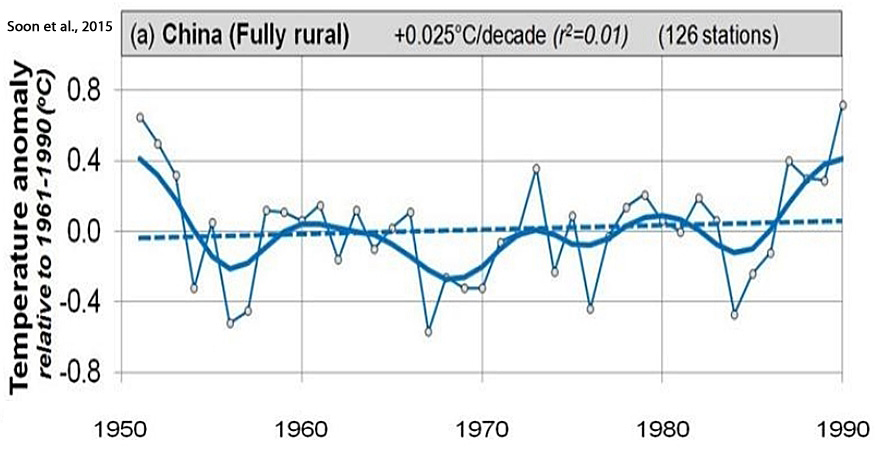
Soon et al., 2015
“[M]ost of the temperature trends since at least 1881 can be explained in terms of solar variability, with atmospheric greenhouse gas concentrations providing at most a minor contribution.”
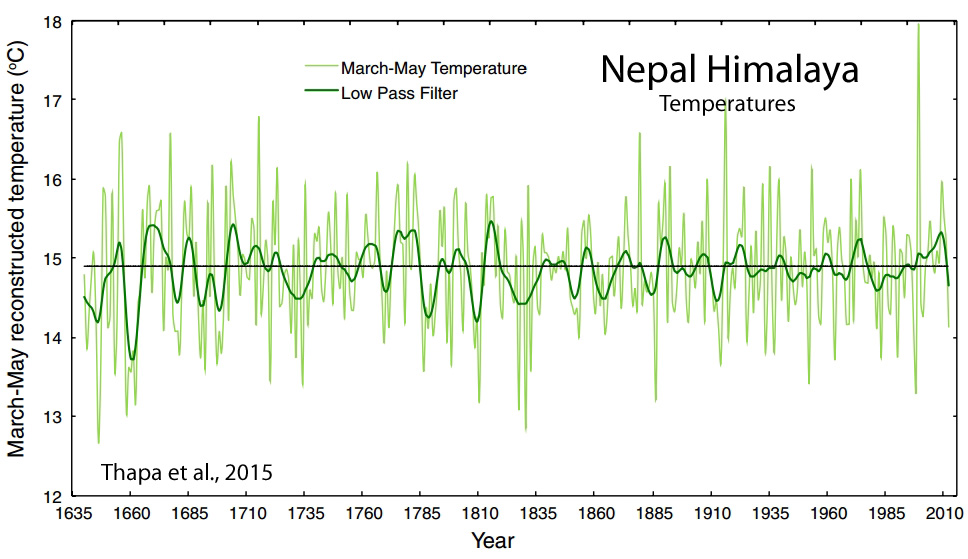
Thapa et al., 2015
“[T]emperature in Central Asia and northern Hemisphere revert back towards cooling trends in the late twentieth century.”
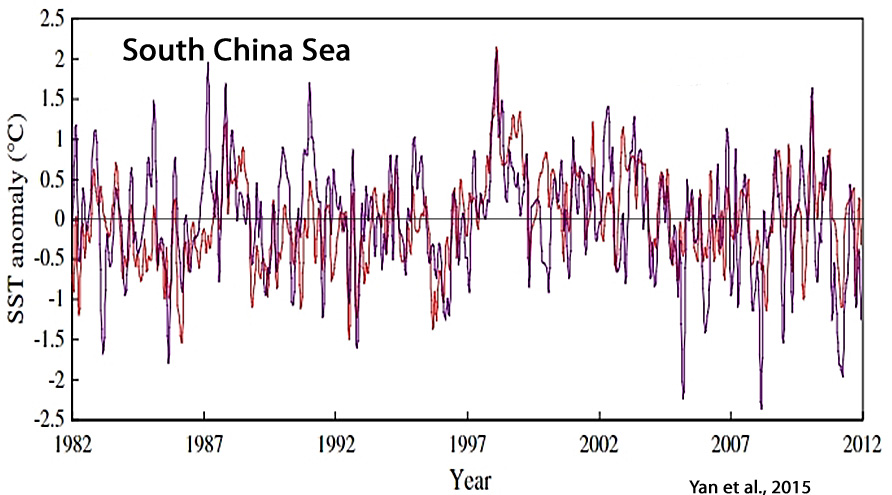
Yan et al., 2015
Boldt et al., 2015

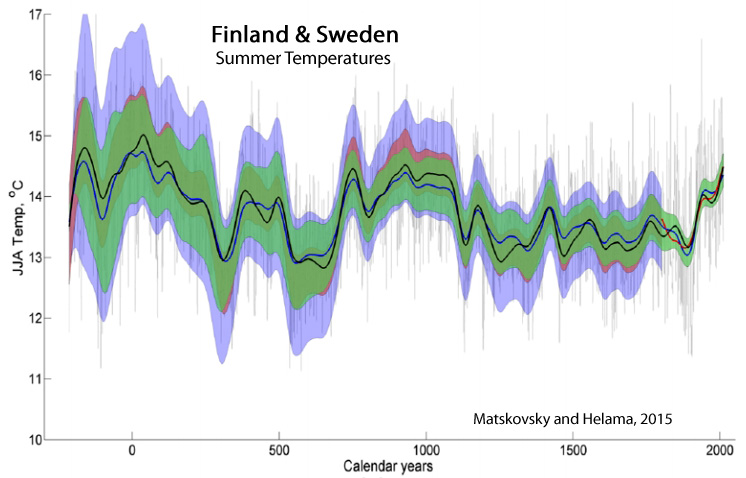
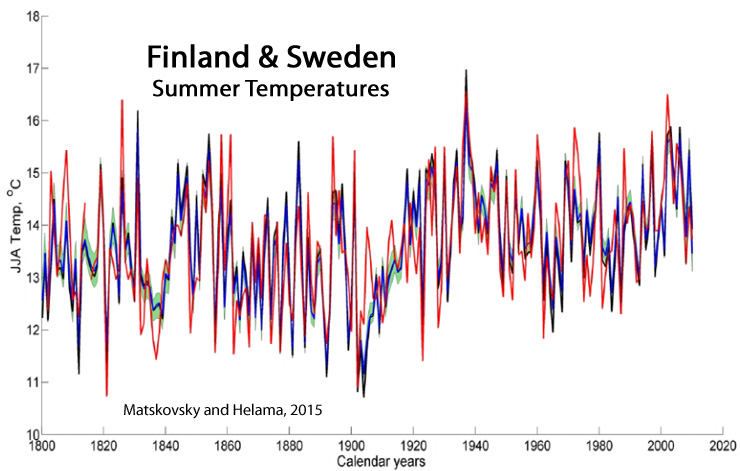
Matskovsky and Helama, 2015
“The DIRECT reconstruction reveals long-term cooling during the LIA [Little Ice Age, 1300-1900 AD] and considerable warming during the MCA [Medieval Climate Anomaly/Medieval Warm Period, 800-1200 AD]. The 20th century marks a period of generally warm temperatures; however, the temperatures of the MCA were reconstructed to be warmer and the long duration of the former makes the MCA incomparable to the 20th-century warmth (Matskovsky and Helama, 2014).”
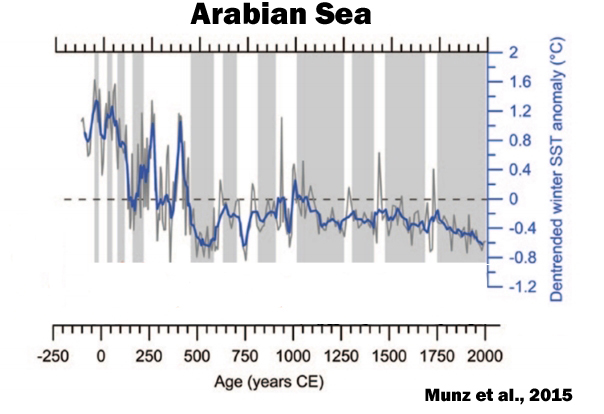
Munz et al., 2015
Wei et al., 2015

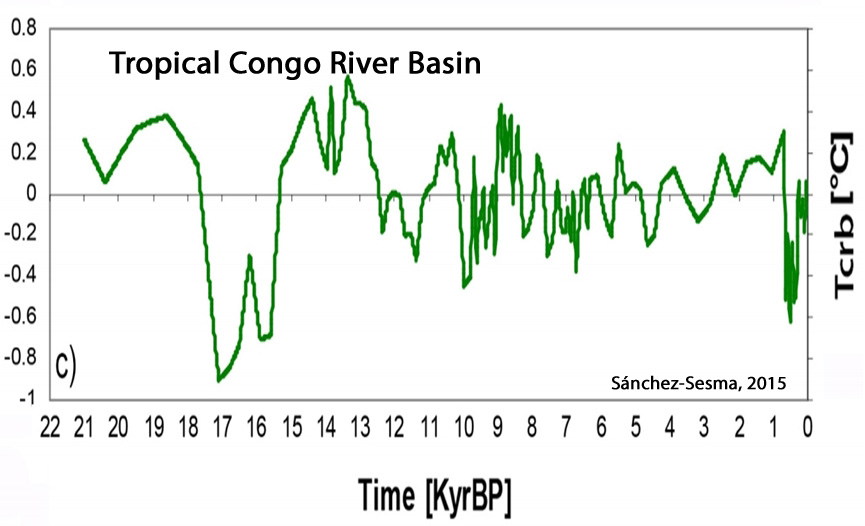
Sánchez-Sesma, 2015
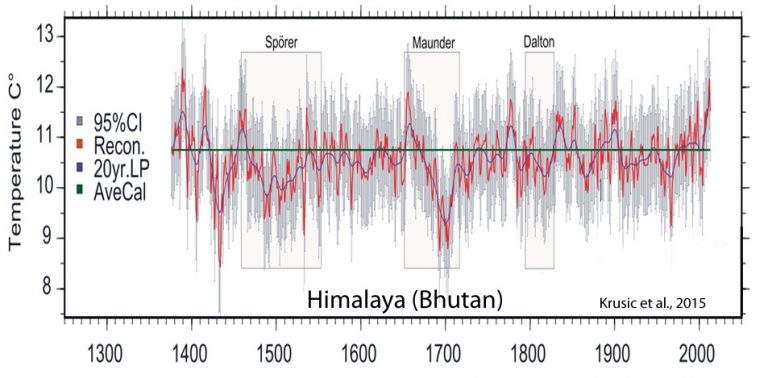
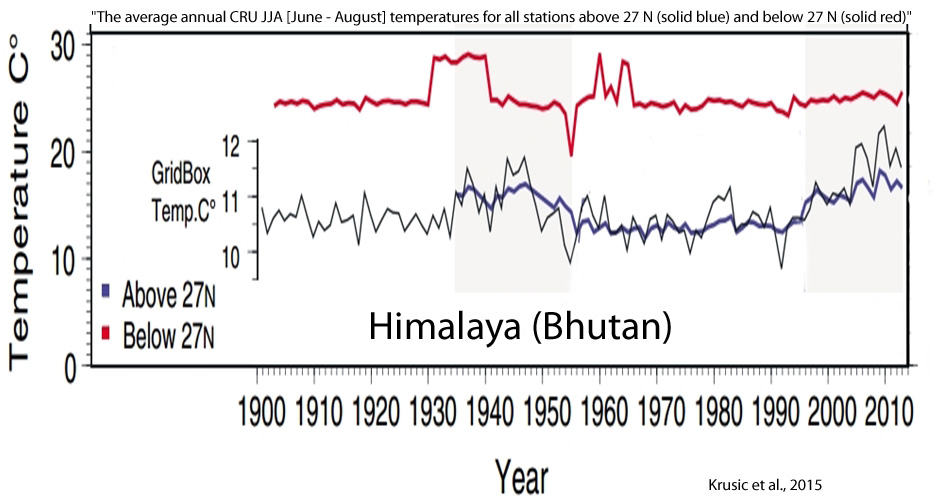
Krusic et al., 2015
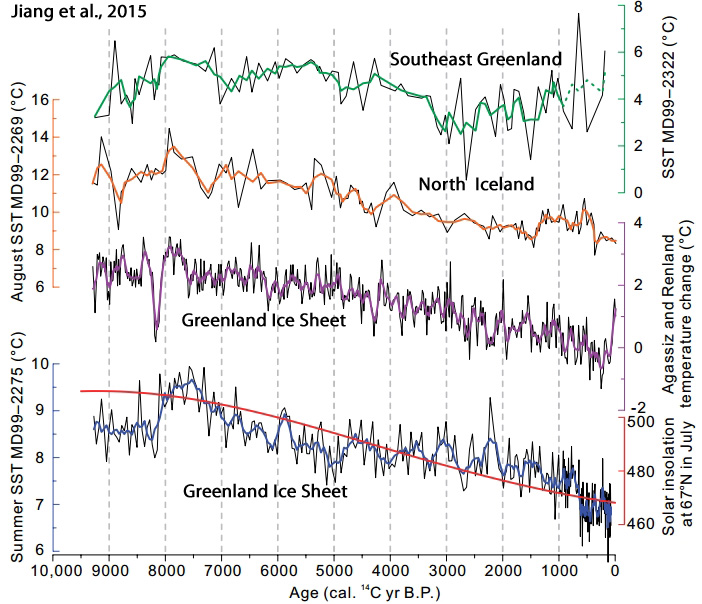
Jiang et al., 2015
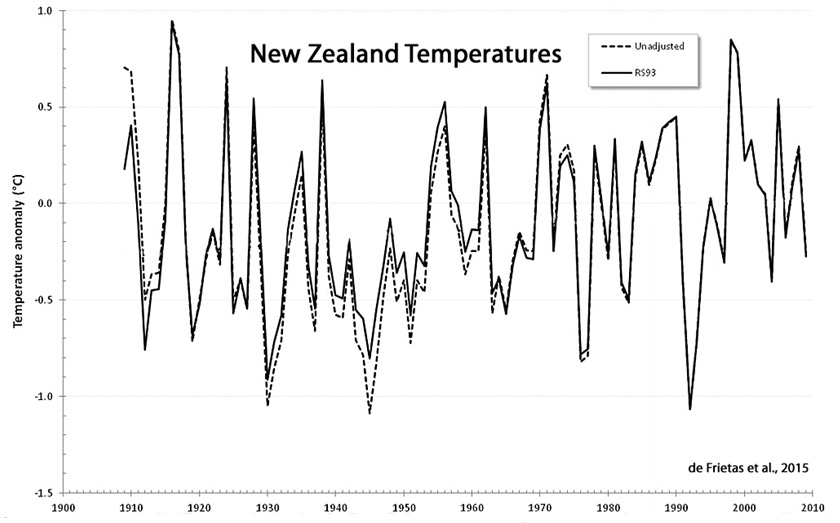
de Frietas et al., 2015
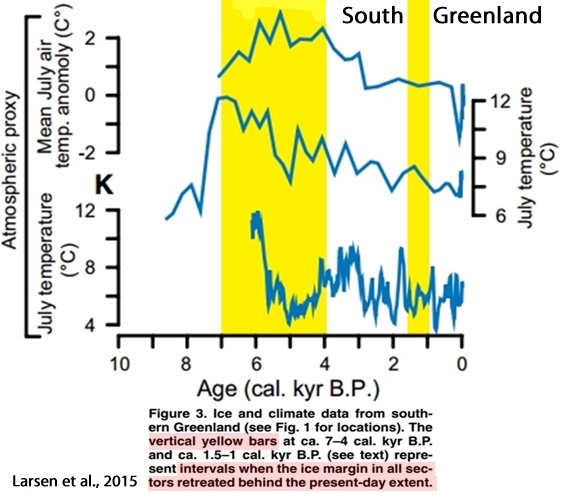
Larsen et al., 2015
“Southern Greenland proxy-inferred atmospheric temperatures also peaked between ca. 7 and 4 cal. kyr B.P. at 2–4 °C higher than present, followed by a Neoglacial cooling reaching a minimum during the LIA [Little Ice Age] (Fréchette and de Vernal, 2009; D’Andrea et al., 2011; Axford et al., 2013). The second phase of ice retreat behind the present-day extent in southwest and south Greenland was from ca. 1.5 to 1 cal. kyr B.P.”
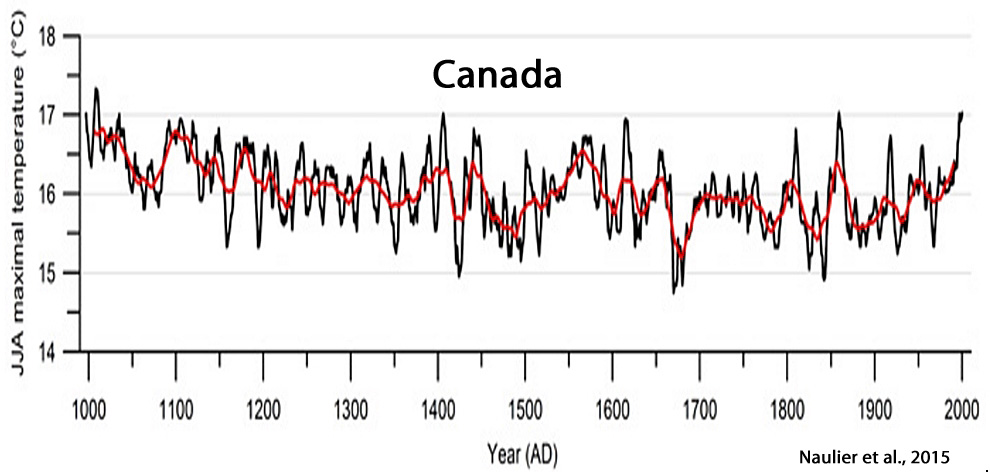
Naulier et al., 2015
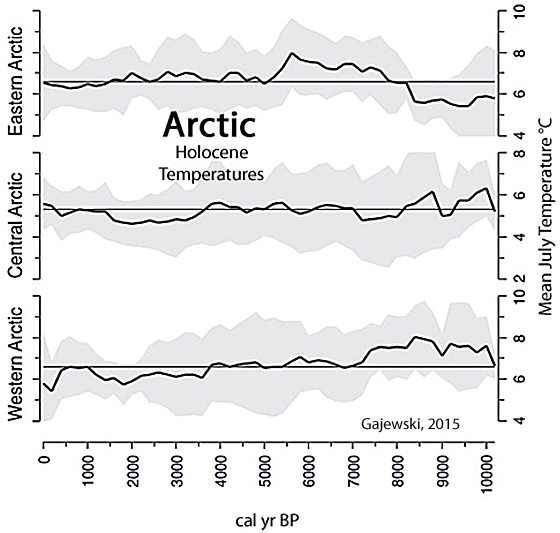
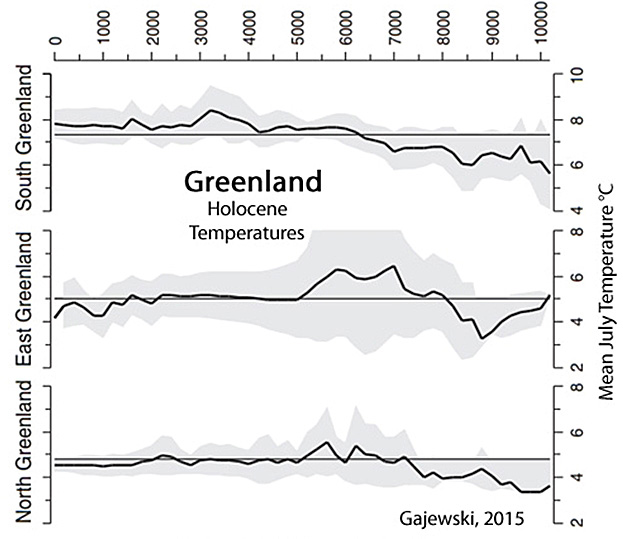
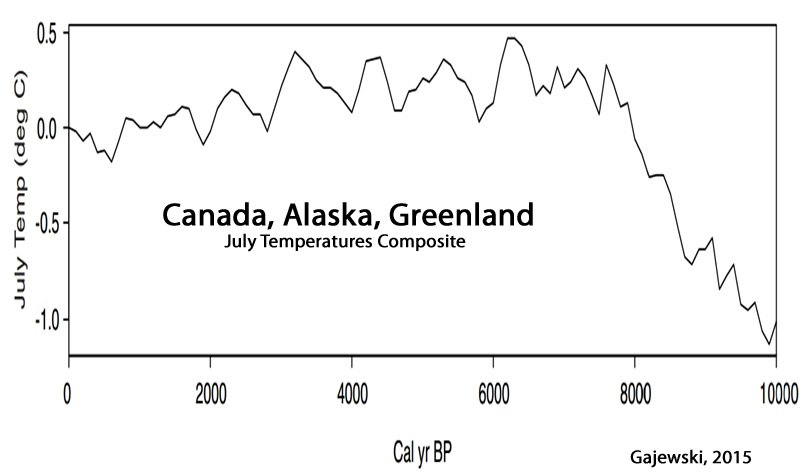
Gajewski, 2015
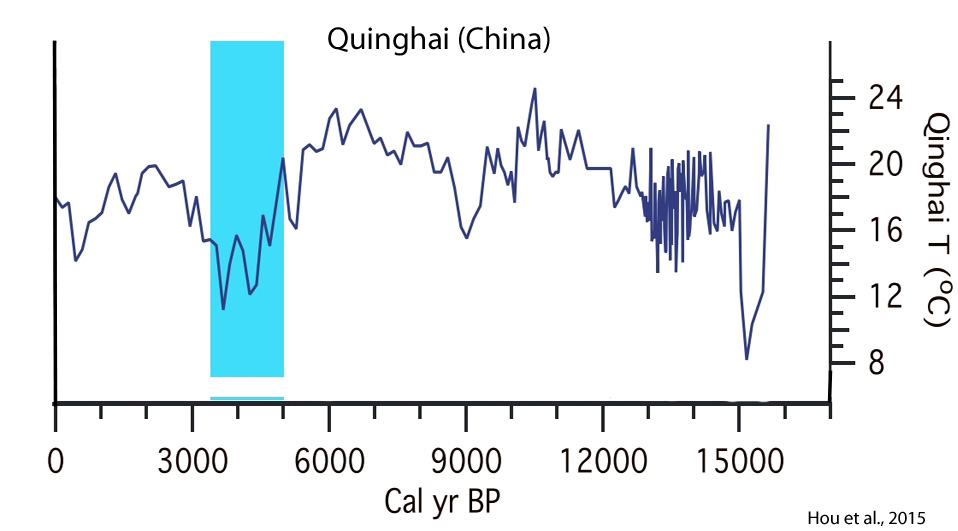
Hou et al., 2015
“Lake Qinghai also displays significant temperature oscillations in the past 3000 years, which may reflect an amplified response to volcanic and/or solar forcings [Stuiver et al., 1995]. The warm period peaking around 2 ka coincides with the Roman warm period, which is followed by cooling into the little ice age, peaking at about 500 years ago (Figure 2). The most distinct and unusual feature of Lake Qinghai summer temperature record is a temperature decrease of more than 4°C between 5 and 3.5 ka. Such temperature changes have not been observed in ice core records in Greenland and speleothem records in China and East Asia. Here we show, however, that this “unusual” feature is in fact prevalent in regional records.”
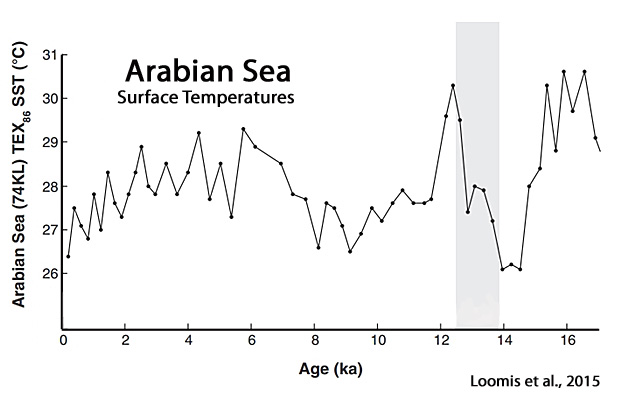
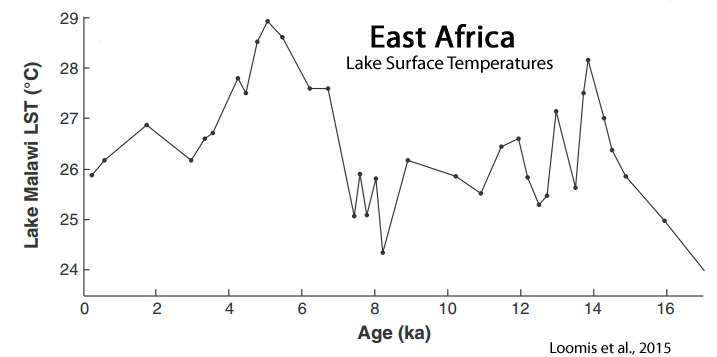
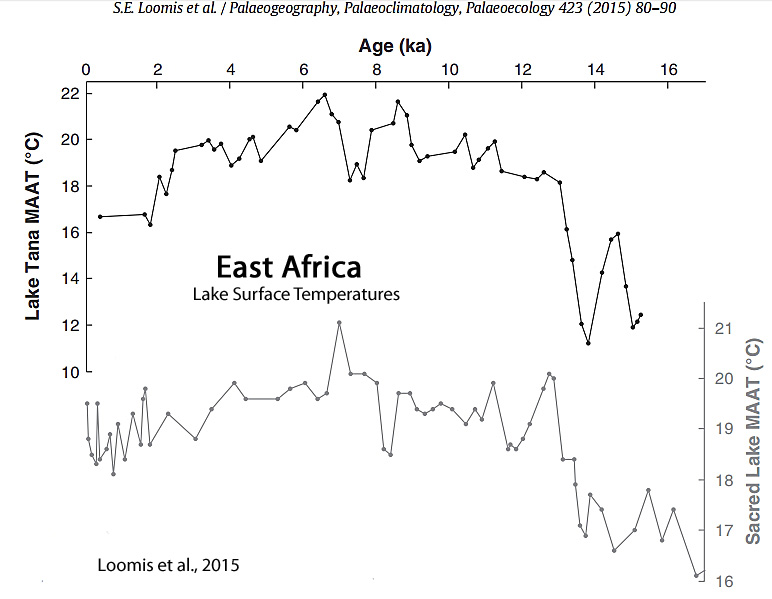
Loomis et al., 2015
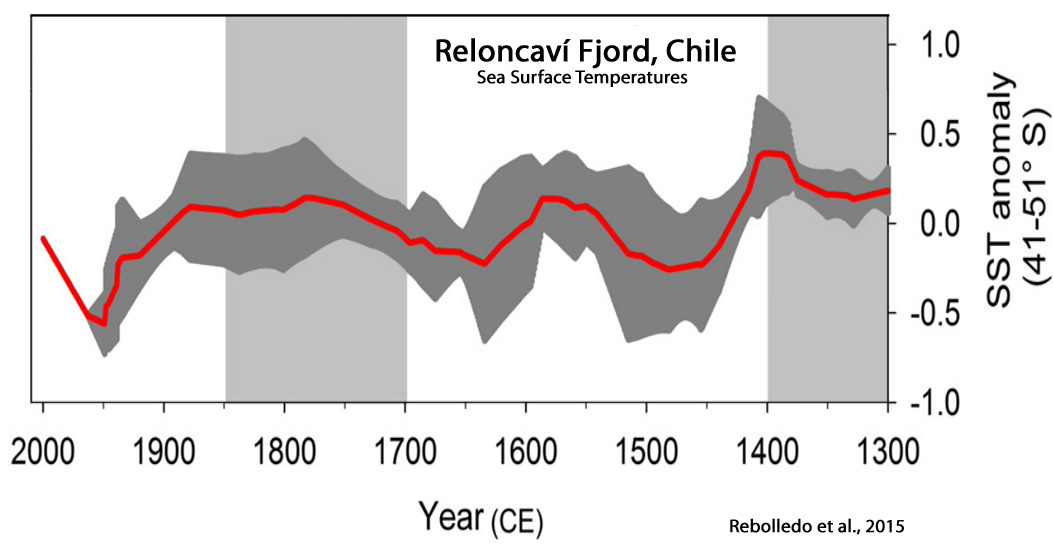
Rebolledo et al., 2015
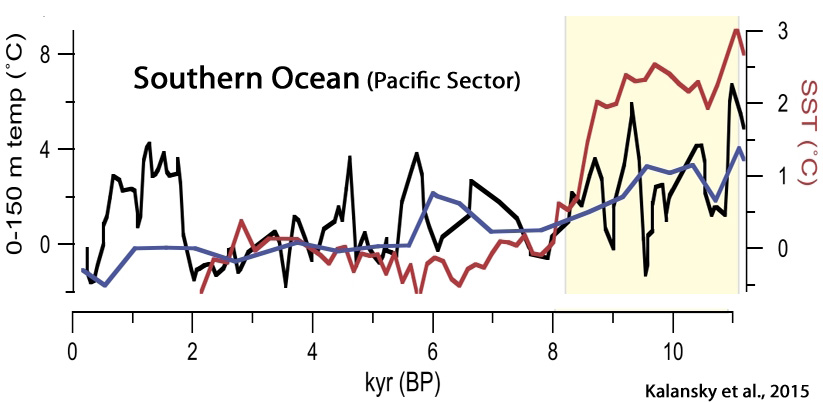
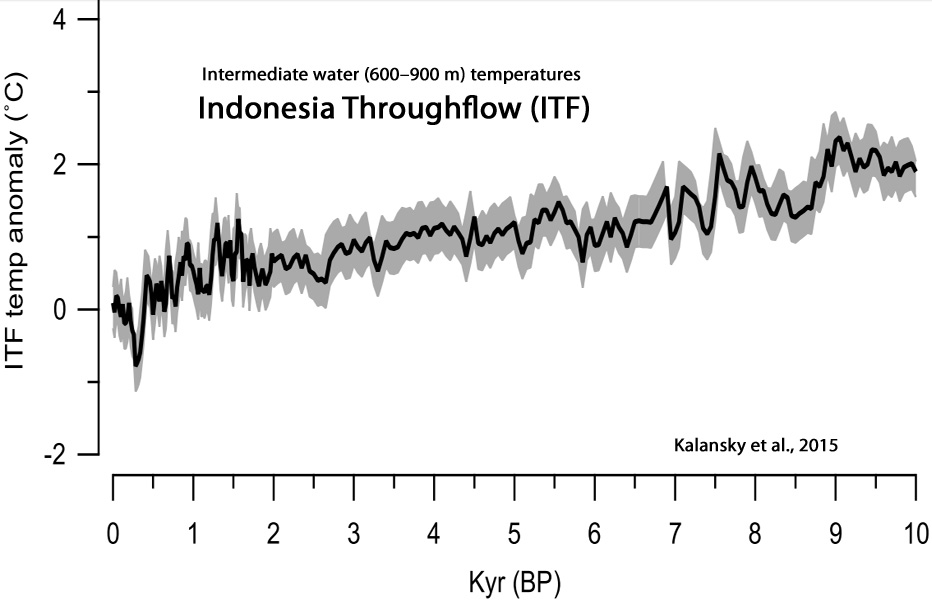
Kolansky et al., 2015

![]()
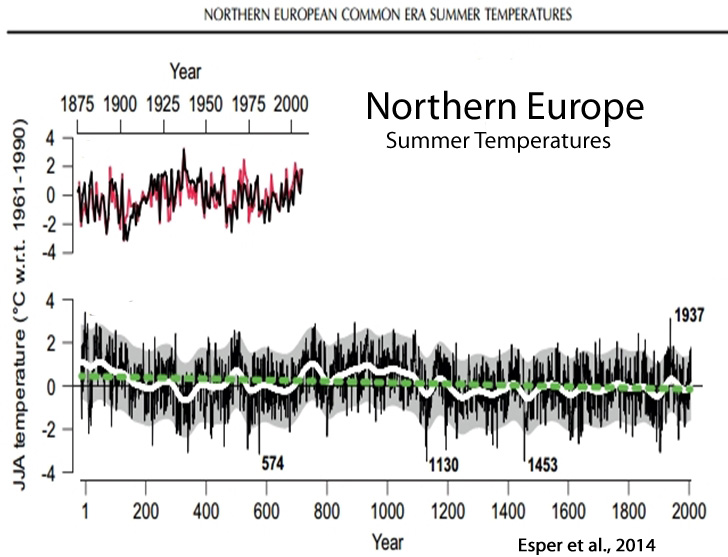
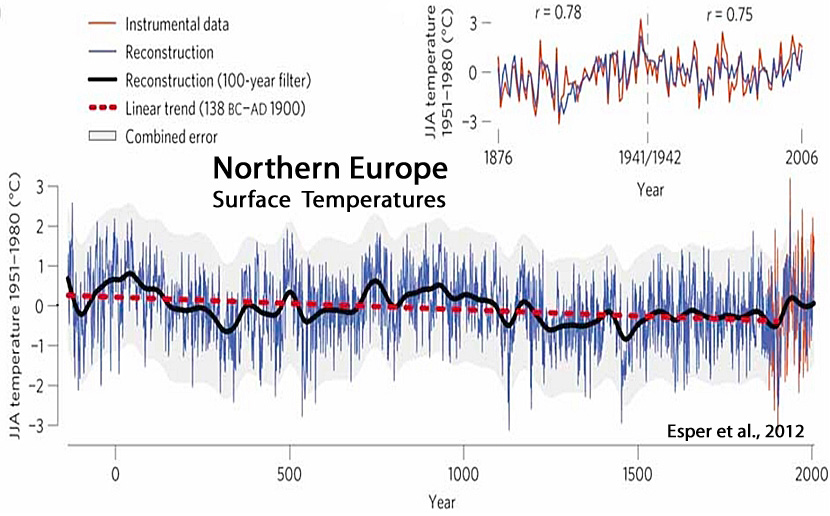
Esper et al., 2014
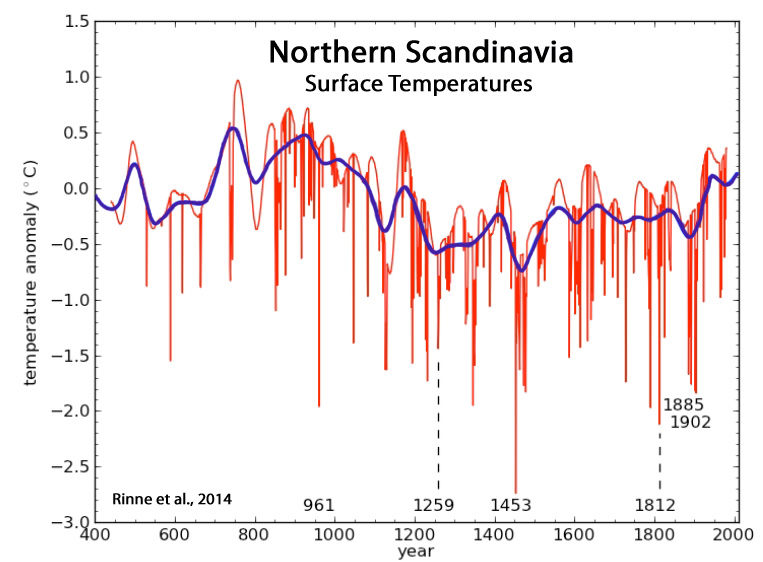
Rinne et al., 2014
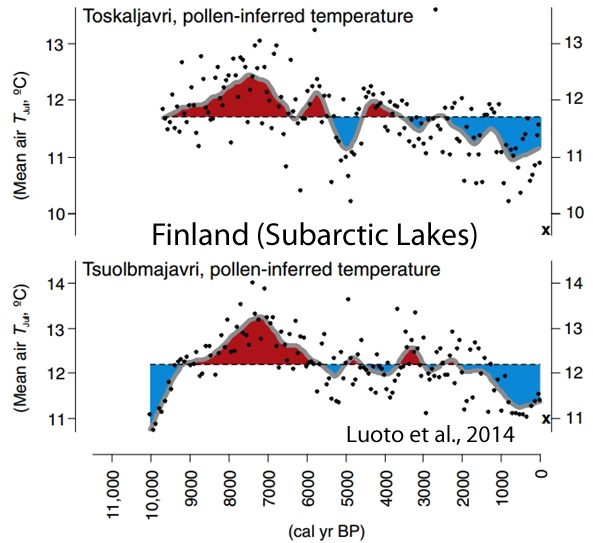
Luoto et al., 2014
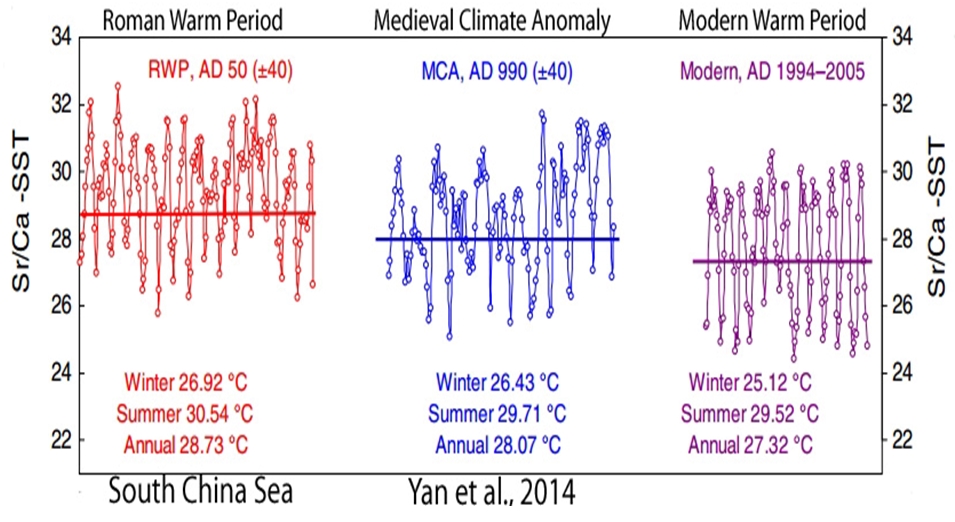
Yan et al., 2014
“The results suggested that the mean SSTs around AD 990 (±40) and AD 50 (±40) were 28.1 °C and 28.7 °C, 0.8 °C and 1.4 °C higher than that during AD 1994–2005, respectively. These records, together with the tree ring, lake sediment and literature records from the eastern China and northwest China, imply that the temperatures in recent decades do not seem to exceed the natural changes in MCA [Medieval Climate Anomaly], at least in eastern Asia from northwest China to northern SCS.”
Gennaretti et al., 2014
Zinke et al., 2014
Bertrand et al., 2014

Silveira and Pezzi, 2014
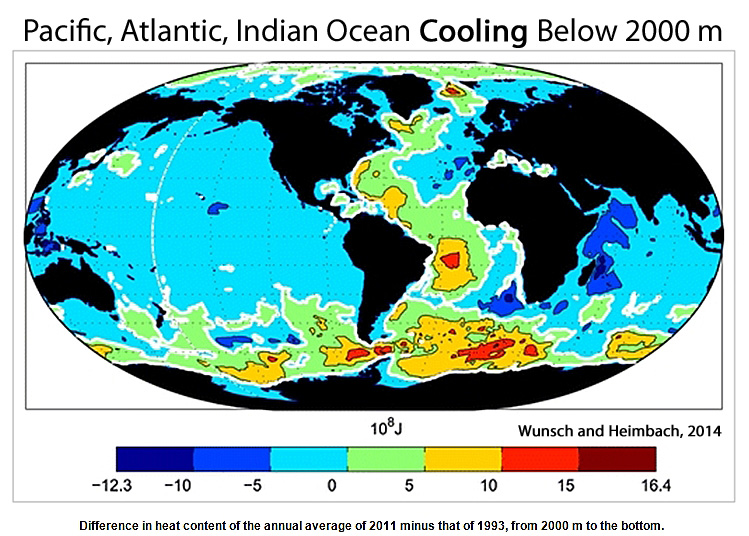
Wunsch and Heimbach, 2014
“A very weak long-term [1993-2011] cooling is seen over the bulk of the rest of the ocean below that depth [2000 m], including the entirety of the Pacific and Indian Oceans, along with the eastern Atlantic basin.”
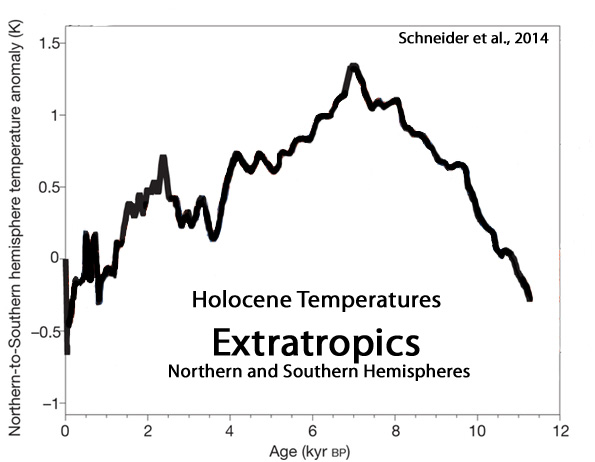
Schneider et al. 2014
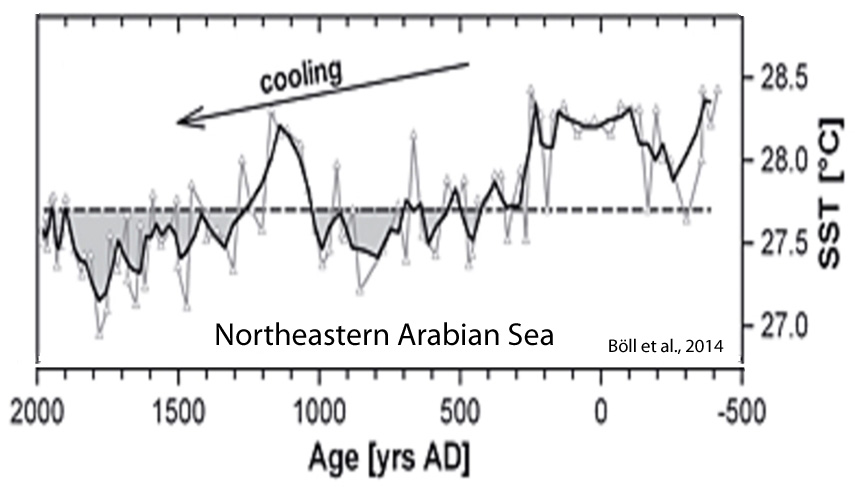
Böll et al., 2014
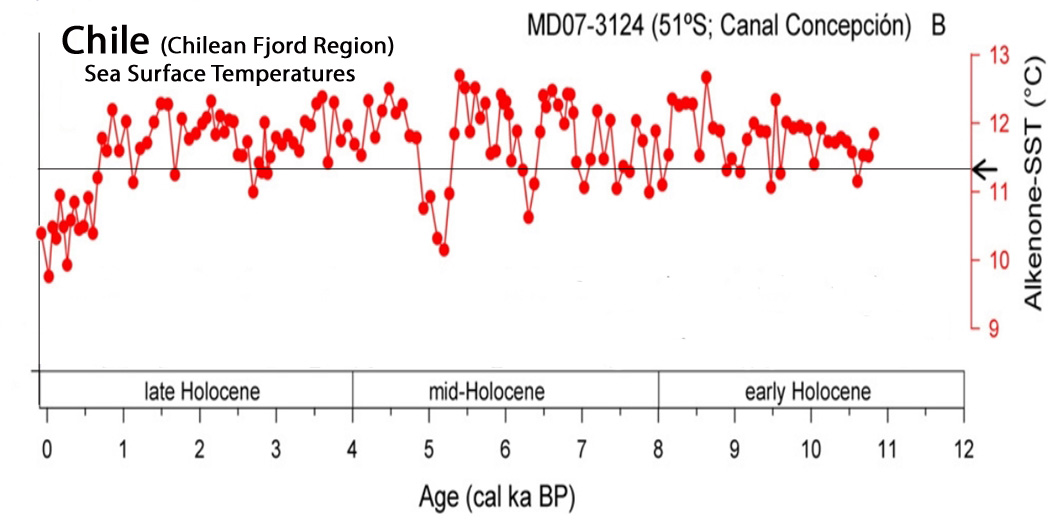
Caniupán et al., 2014
Rella and Uchida, 2014

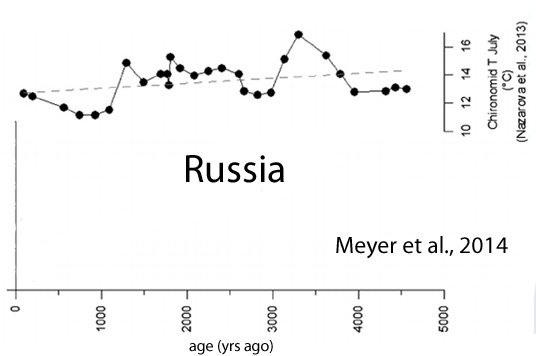
Meyer et al., 2014
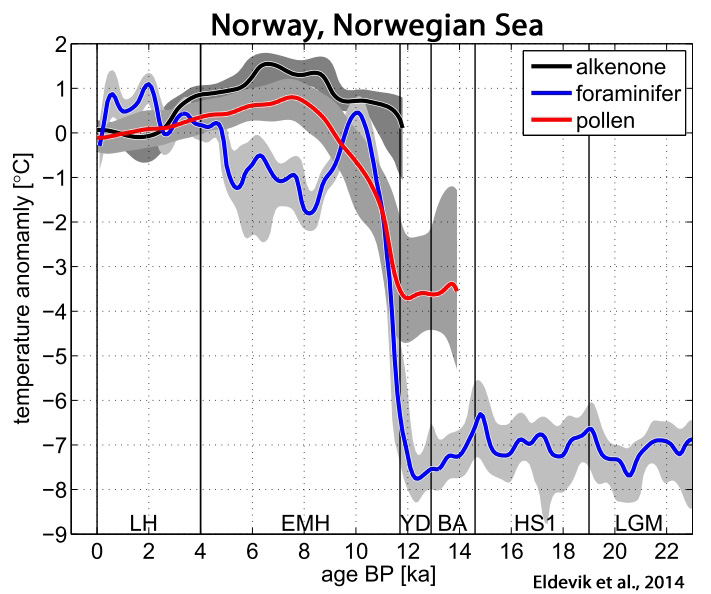
Eldevik et al., 2014
“Through the LH [Late Holocene], ocean temperatures [North Atlantic, Nordic Seas] are comparable to the present, but up to 1°C warmer“

![]()
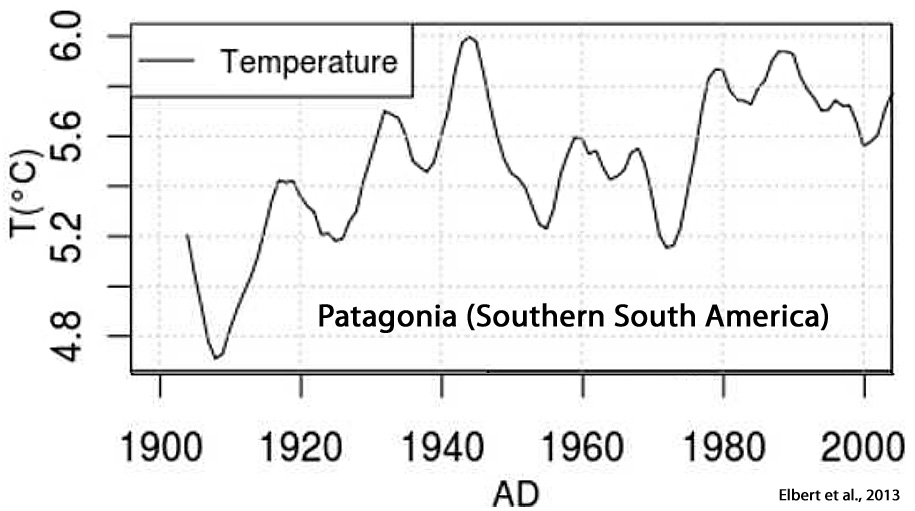
Elbert et al., 2013
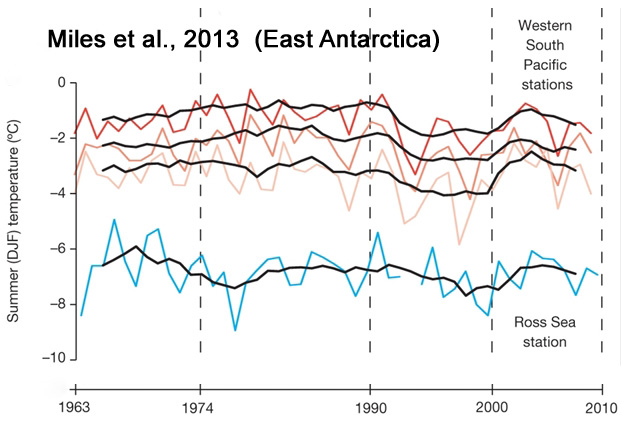
Miles et al., 2013
Lecavalier et al., 2013

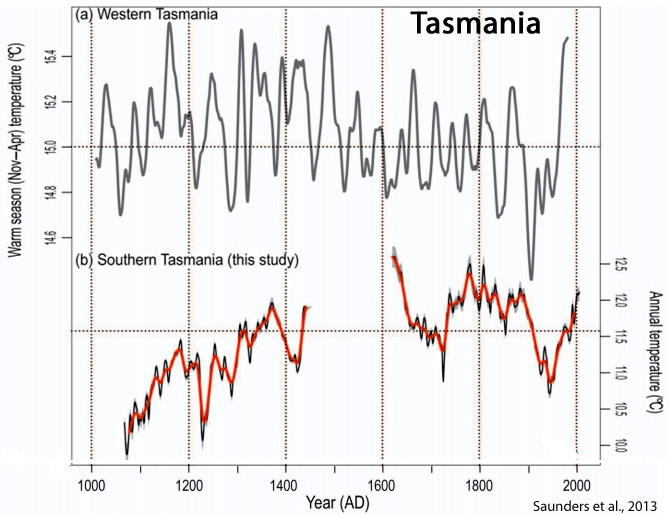
Saunders et al., 2013
Ault et al., 2013

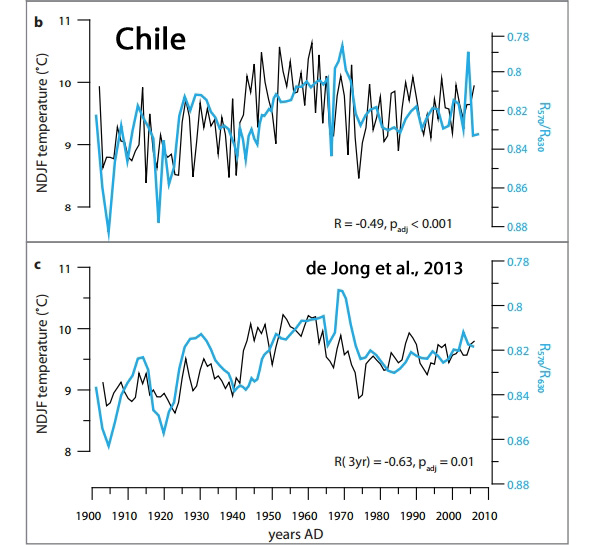
de Jong et al., 2013
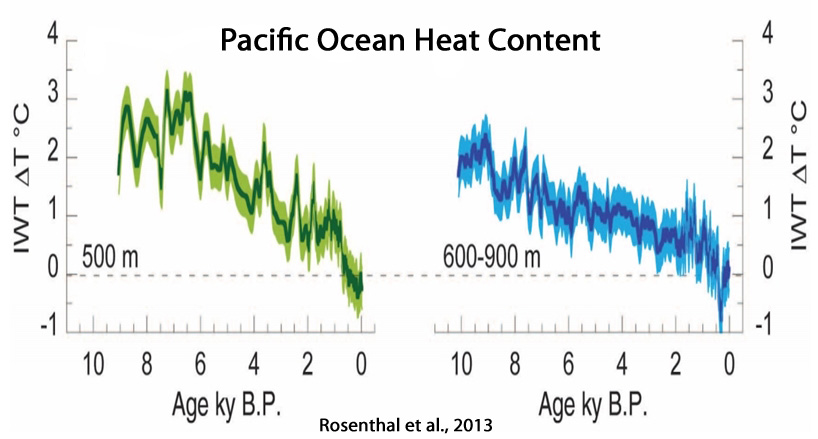
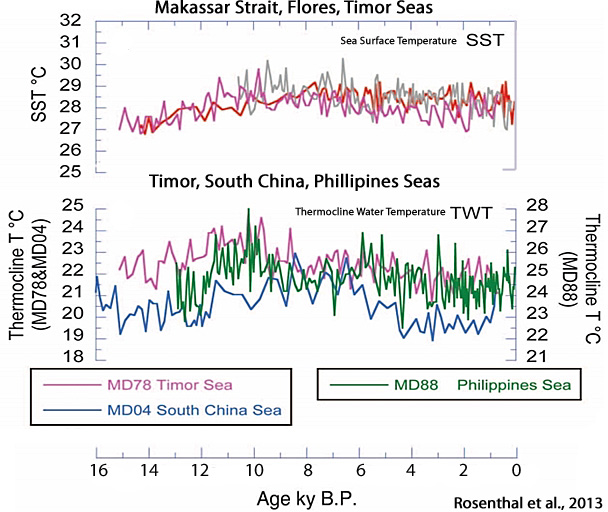
Rosenthal et al., 2013
“We show that water masses linked to North Pacific and Antarctic intermediate waters were warmer by 2.1°C and 1.5°C, respectively, during the middle Holocene Thermal Maximum than over the past century. Both water masses were ~0.9°C warmer during the Medieval Warm period than during the Little Ice Age and ~0.65° warmer than in recent decades.”
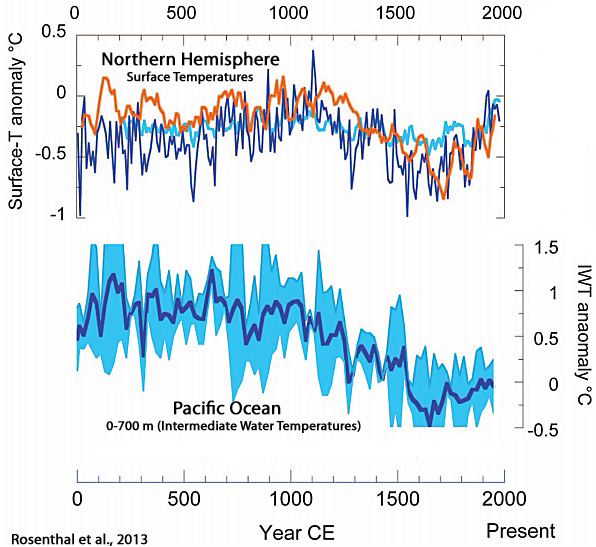
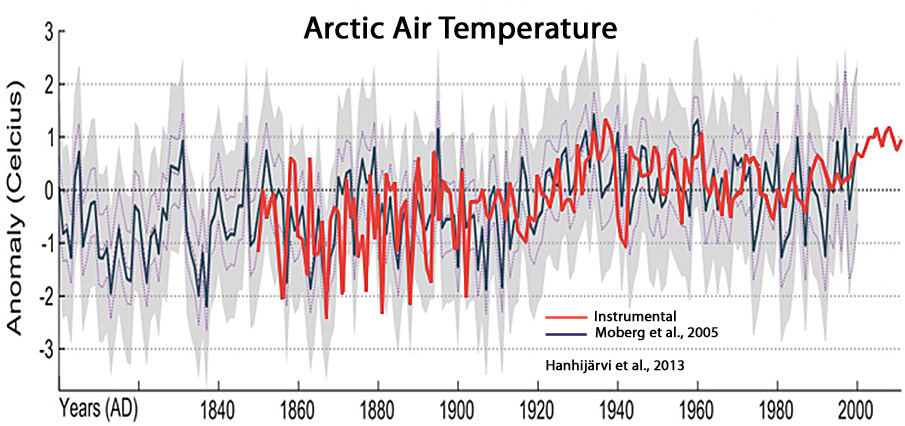
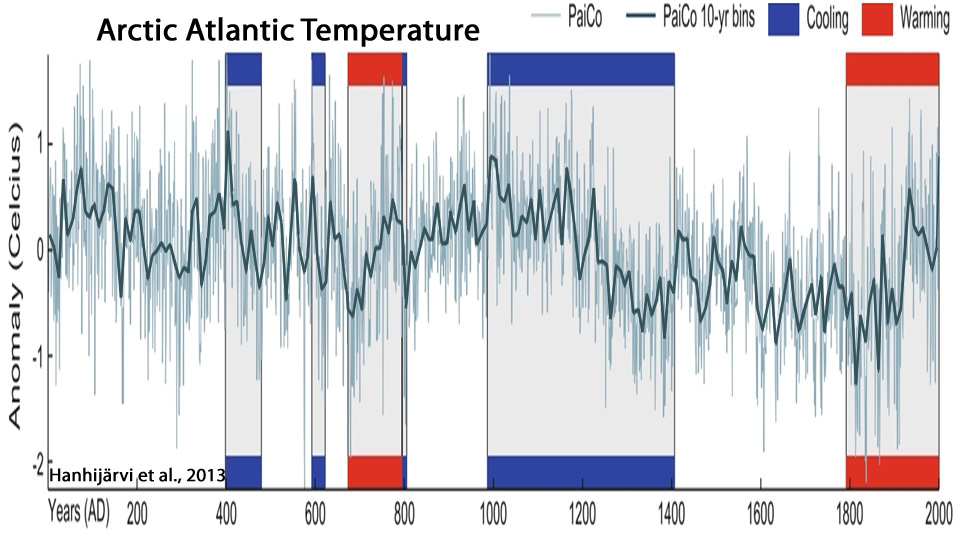
Hanhijärvi et al., 2013
“According to Chylek et al. (2009), the Arctic warming from 1900 to 1940 proceeded at a significantly faster rate than the warming during the more recent decades and was highly correlated with the Atlantic Multi-decadal Oscillation (AMO) suggesting that the Arctic temperature variability is highly linked to the Atlantic Ocean thermohaline circulation at various temporal scales.”
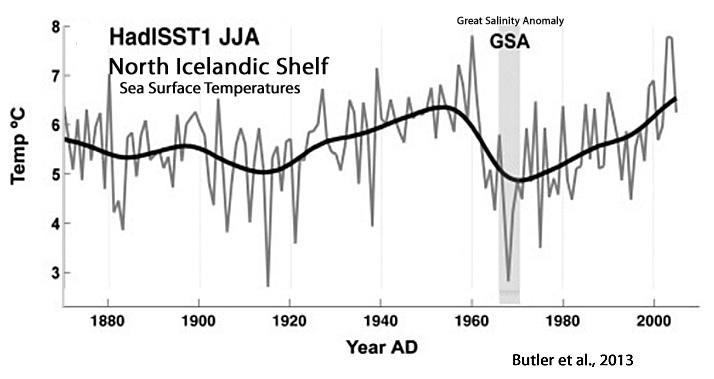
Butler et al., 2013
![]()
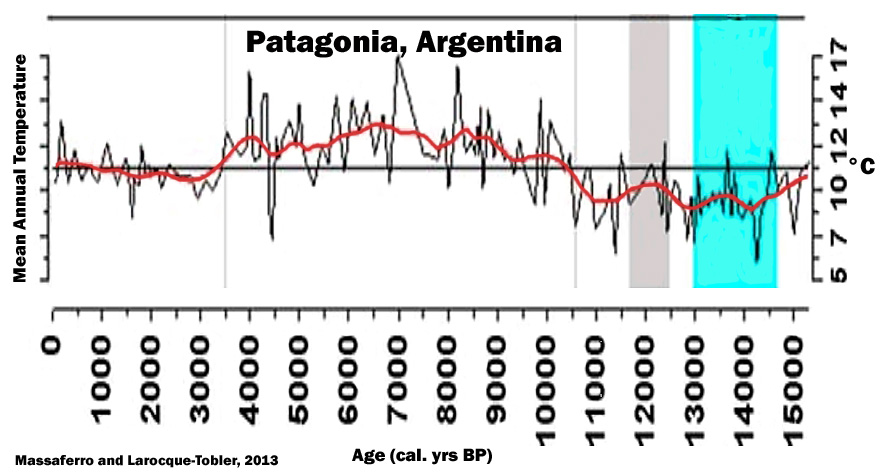
Massaferro and Larocque-Tobler, 2013
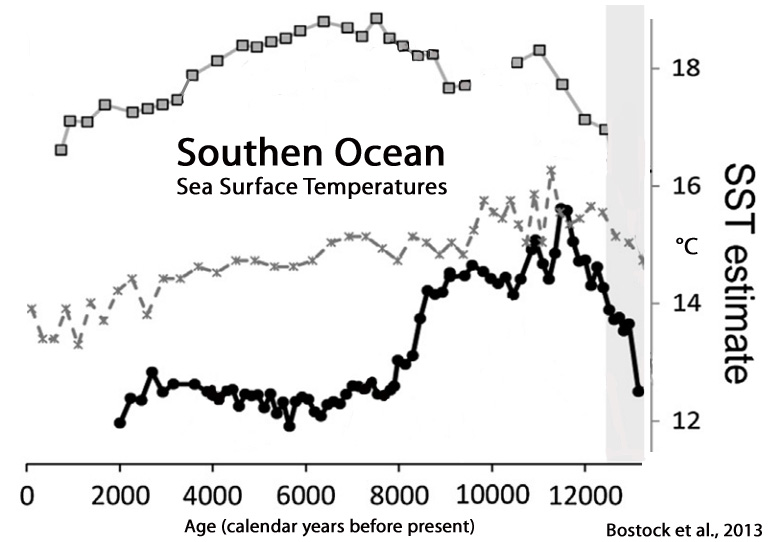
Bostock et al., 2013
Levy et al., 2013

Kylander et a., 2013

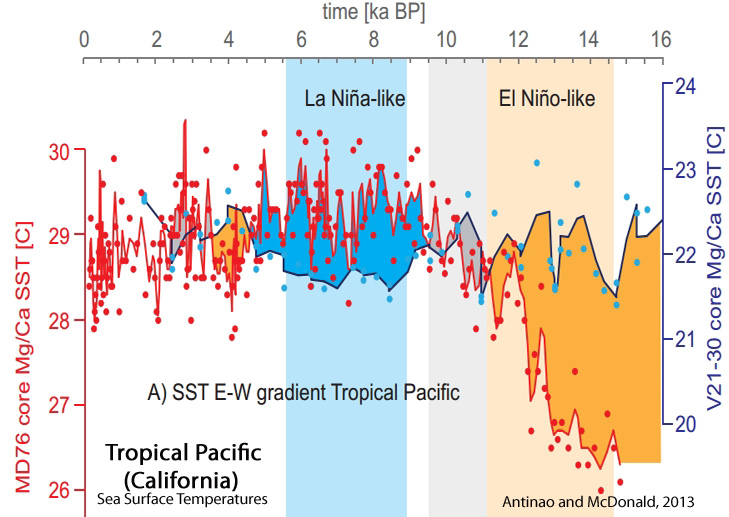
Antinao and McDonald, 2013

![]()
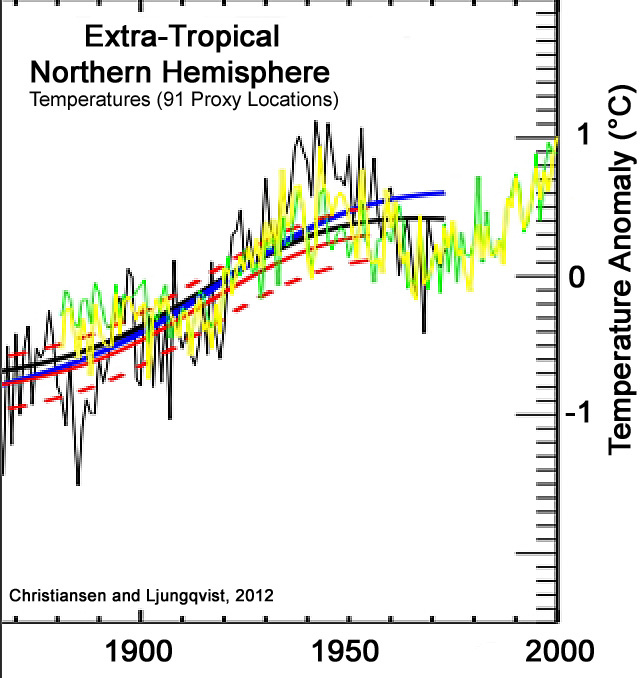
Christiansen and Lungqvist (2012)
Sinclair et al., 2012
“A 125-yr ice core record of climate from the Whitehall Glacier ice divide provides exceptionally highresolution stable isotope data from the northwest margin of the Ross Sea, Antarctica. … Reconstructed mean annual temperatures show no significant change between 1882 and 2006. However, a decrease in cold season [April–September (AMJJAS)] temperatures of -1.59°C ±0.84°C decade -¹(at 90% confidence) is observed since 1979.”

Esper et al., 2012
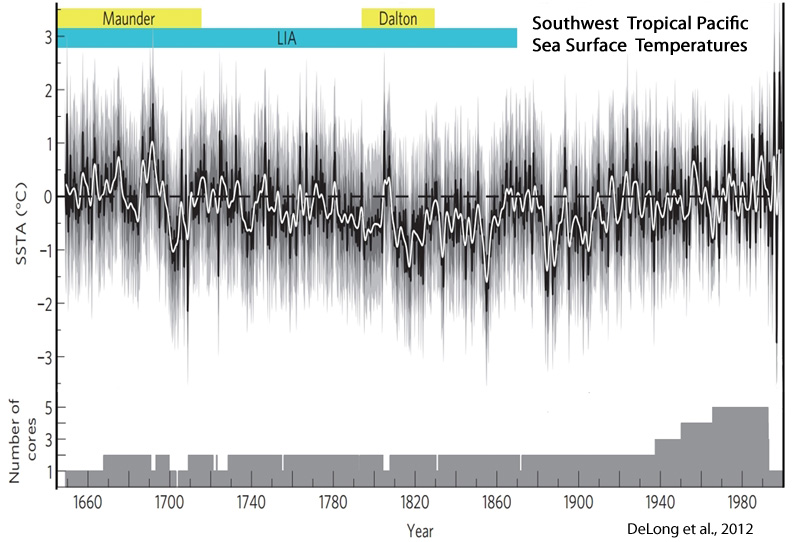
Delong et al., 2012
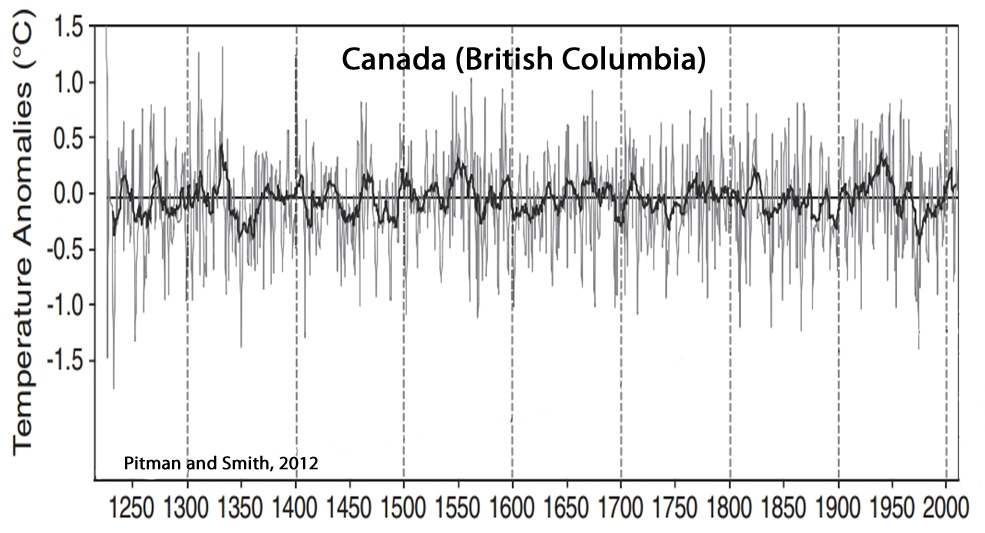
Pitman and Smith, 2012
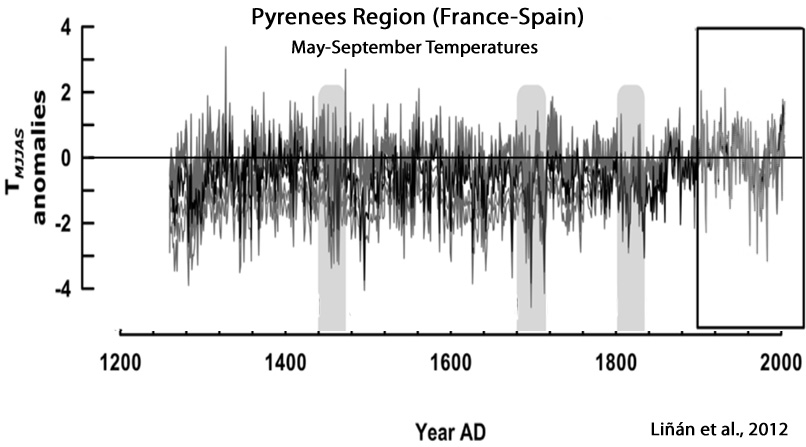
Liñán et al., 2012
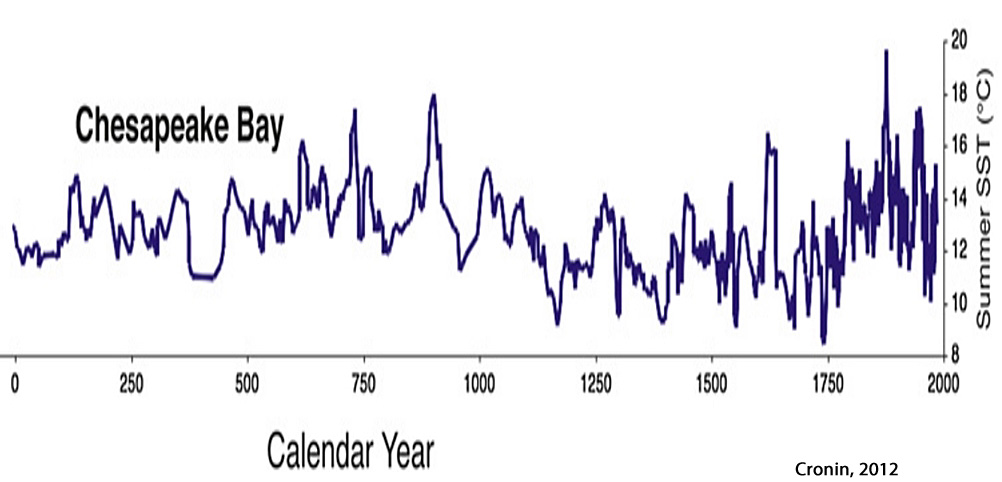
Cronin, 2012
Esper et al., 2012

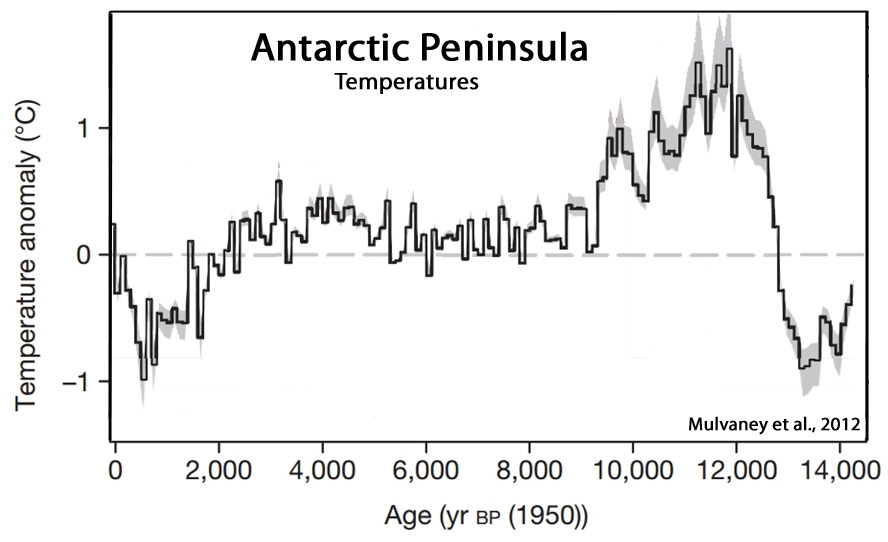
Mulvaney et al., 2012
“A marine sediment record from off the shore of the western Antarctic Peninsula also shows an early Holocene optimum during which surface ocean temperatures were determined to be 3.5°C higher than present. Other evidence suggests that the George VI ice shelf on the southwestern Antarctic Peninsula was absent during this early-Holocene warm interval but reformed in the mid Holocene.”
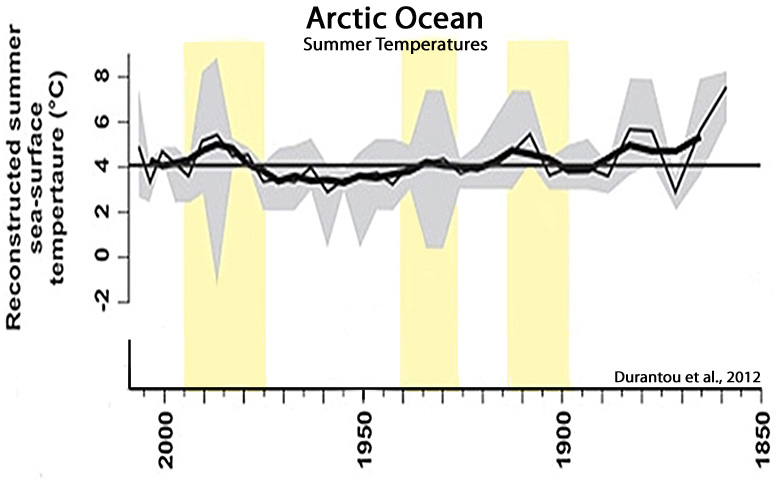
Durantou et al., 2012
“Sea surface temperature [Arctic Ocean] between ∼ AD 1885–1935 are warmer by up to 3°C with respect to the average modern temperature at the coring site. For the period ∼ AD 1887–1945, reconstructed sea ice cover values are on average 8.3 months per year which is 1.1 months per year lower than the modern values.”
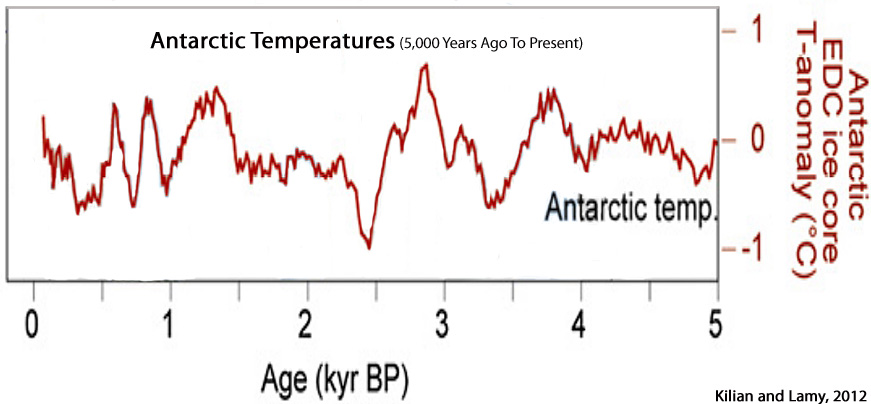
Kilian and Lamy, 2012


![]()
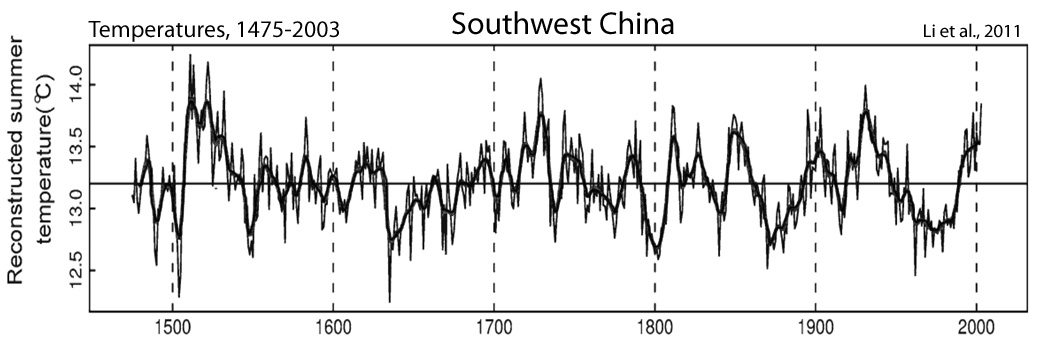
Li et al., 2011
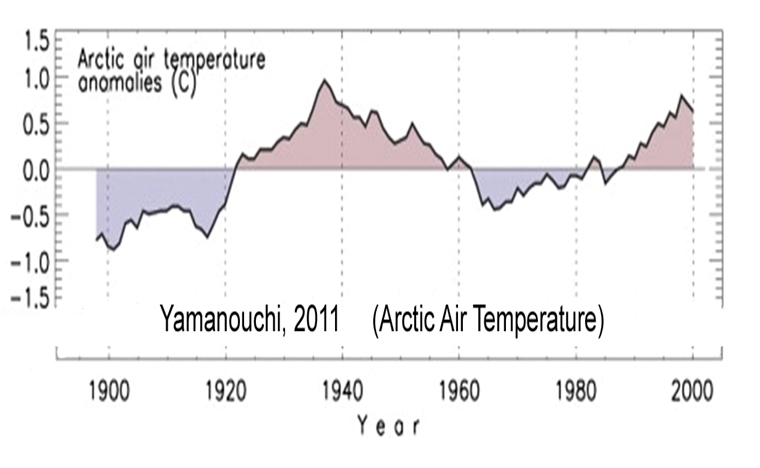
Yamanouchi, 2011
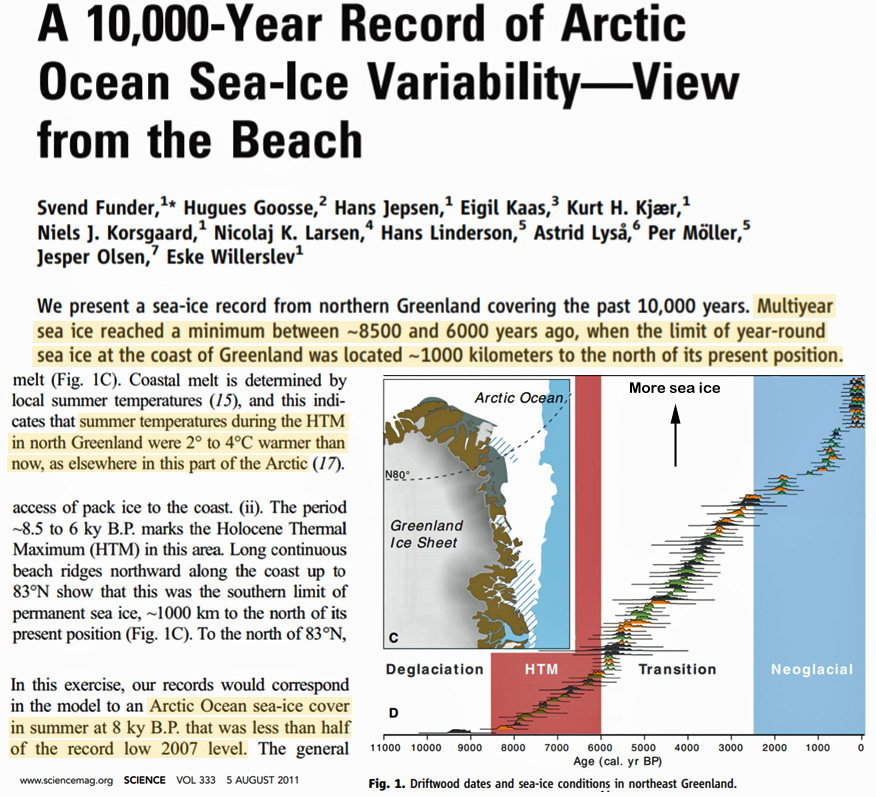
Funder et al., 2011
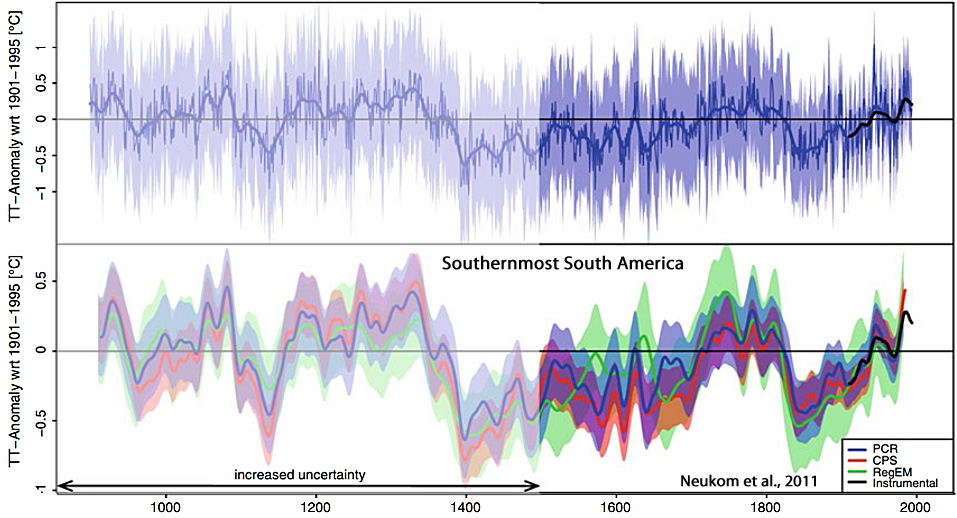
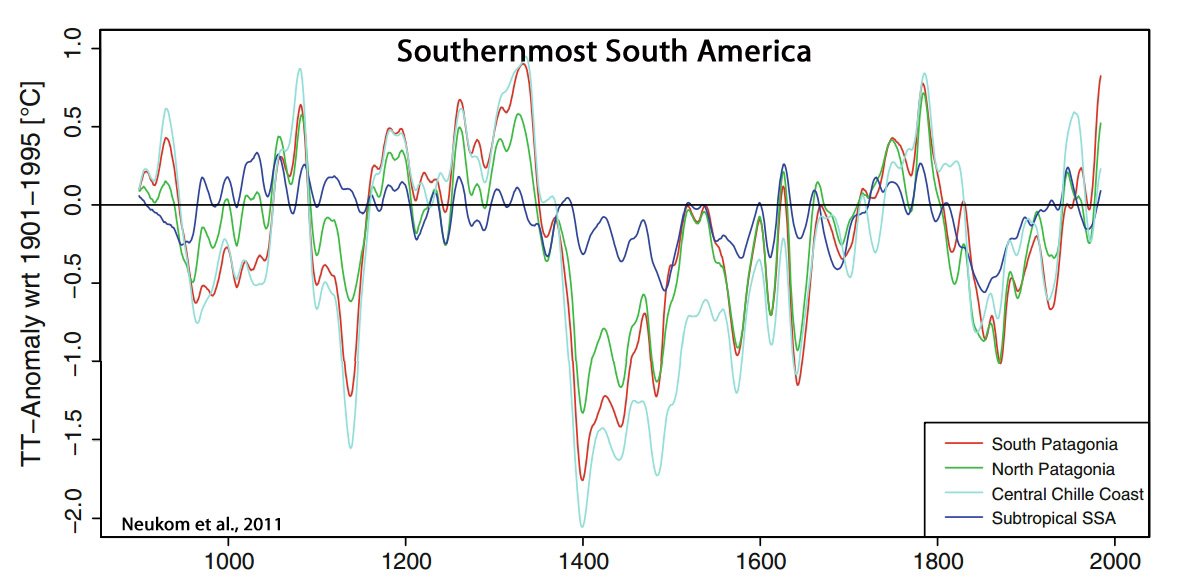
Neukom et al., 2011
“The reconstructed SSA [Southernmost South America] mean summer temperatures between 900 and 1350 are mostly above the 1901–1995 climatology. After 1350, we reconstruct a sharp transition to colder conditions, which last until approximately 1700. The summers in the eighteenth century are relatively warm with a subsequent cold relapse peaking around 1850. In the twentieth century, summer temperatures reach conditions similar to earlier warm periods.”
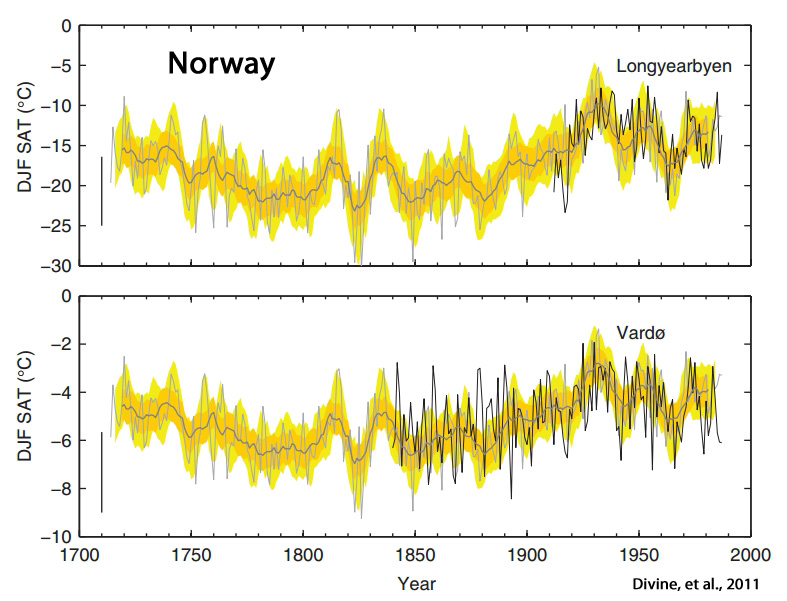
Divine et al, 2011
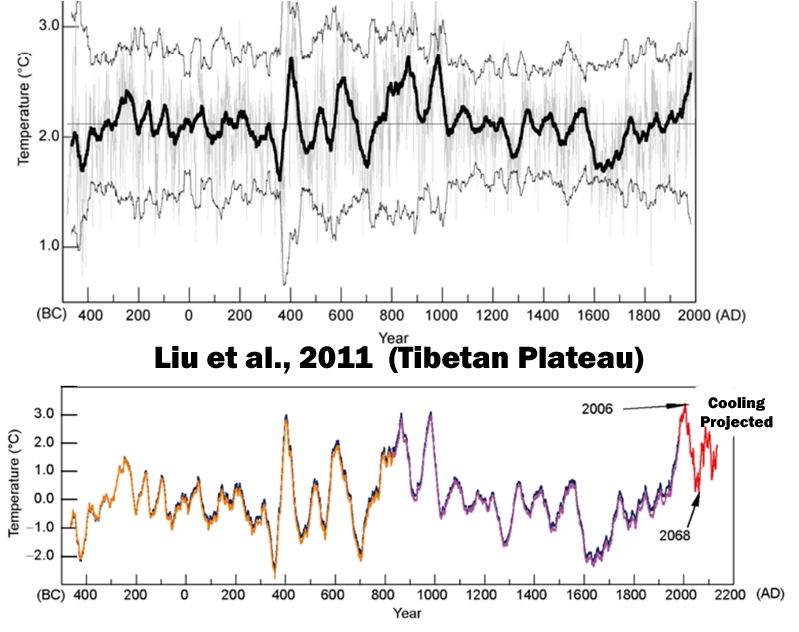
Liu et al., 2011
“Climate events worldwide, such as the MWP and LIA, were seen in a 2485-year temperature series. The largest amplitude and rate of temperature both occurred during the EJE [Eastern Jin Event (343–425 AD)], but not in the late 20th century. The millennium-scale cycle of solar activity determined the long-term temperature variation trends, while century-scale cycles controlled the amplitudes of temperature. Sunspot minimum events were associated with cold periods. The prediction results obtained using caterpillar-SSA showed that the temperature would increase until 2006 AD on the central-eastern Plateau, and then decrease until 2068 AD, and then increase again.”
Bird et al., 2011

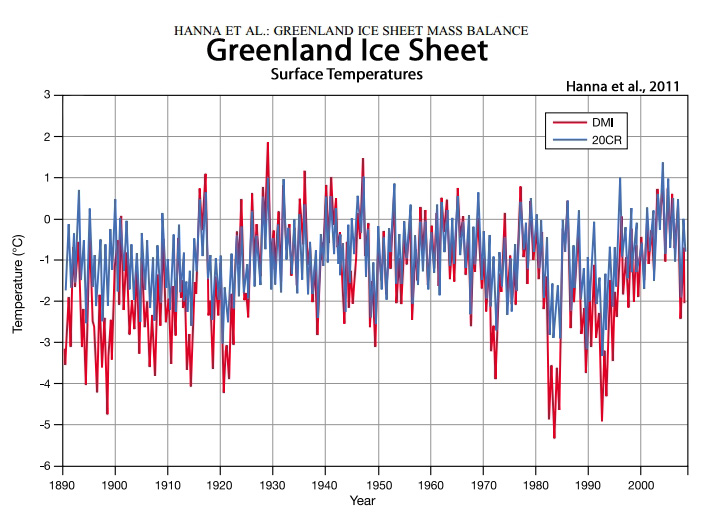
Hanna et al., 2011
![]()
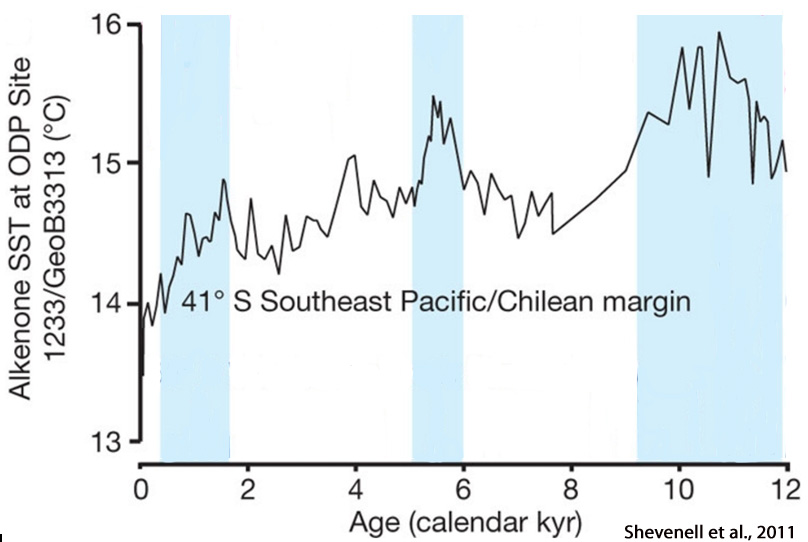
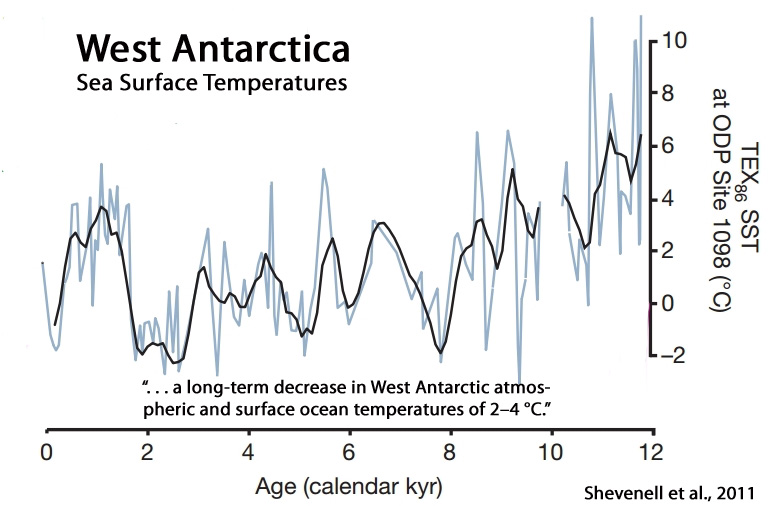
Shevenell et al., 2011
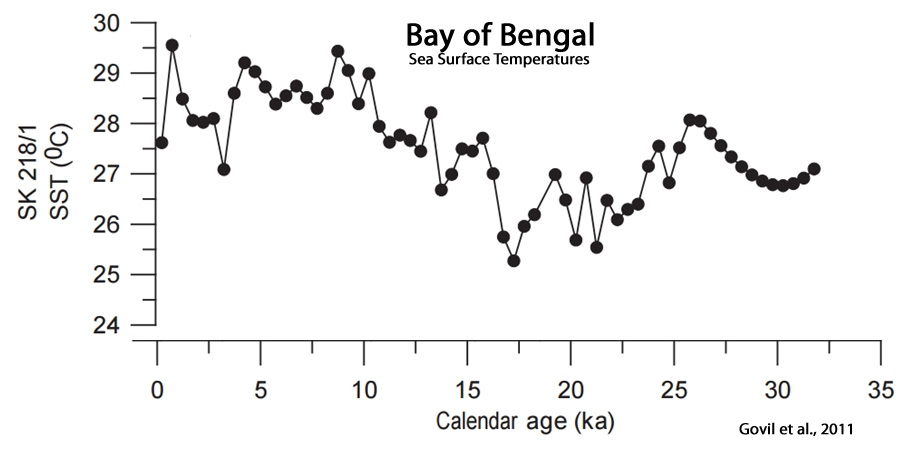
Govil et al., 2011
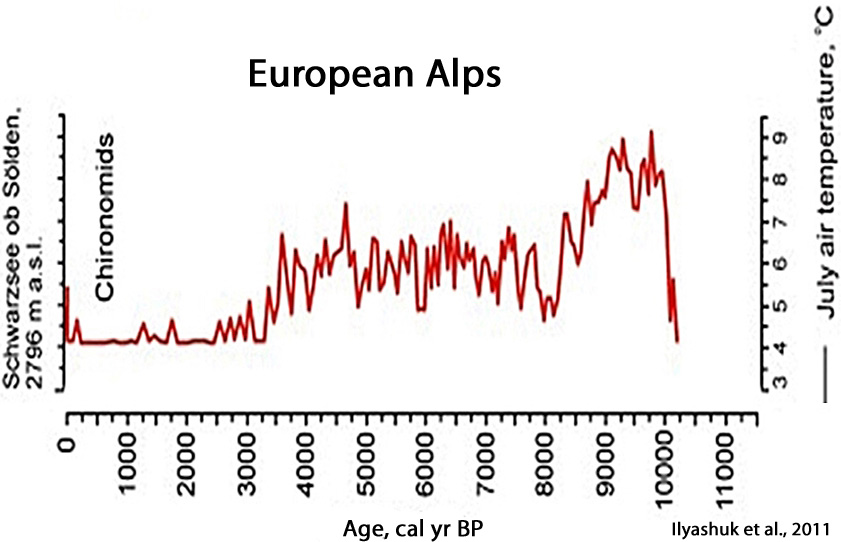
Ilyashuk et al. 2011
Shevenell et al., 2011
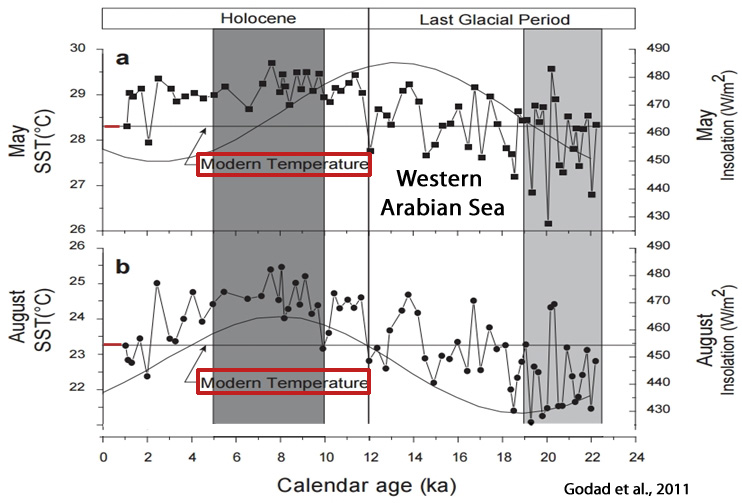
Godad et al., 2011
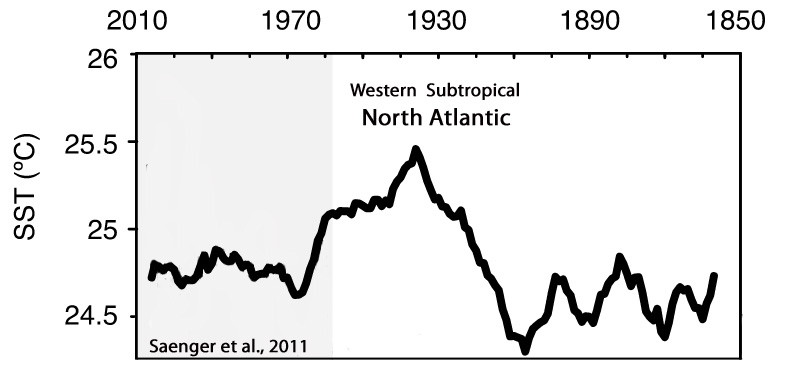
Saenger et al., 2011
“A prominent feature of this record is the ∼1°C warm anomaly that occurred between 1930 and 1950. … Carolina Slope SST does not exhibit the warming trend seen in the AMO since the 1970s suggesting that other factors also impact SST variability at our site.”

![]()
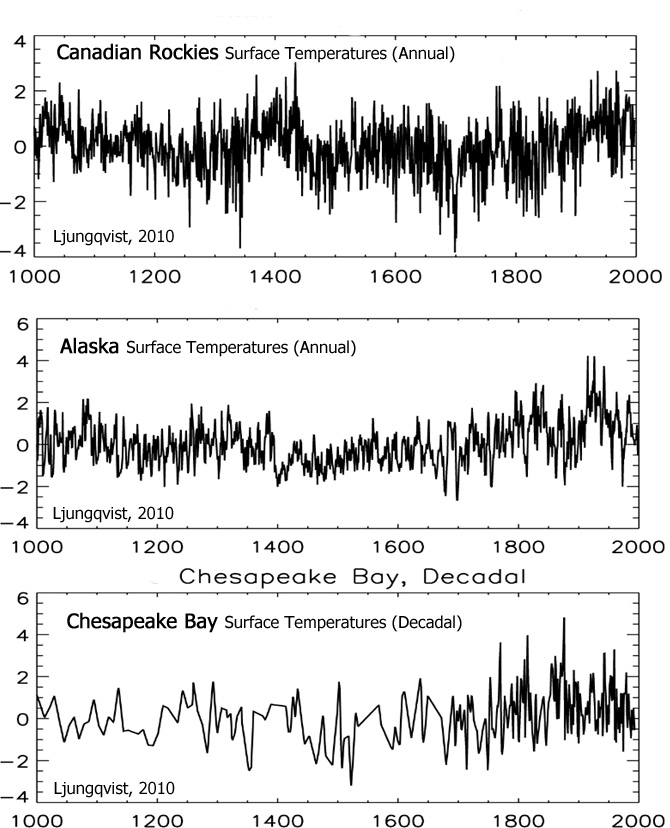
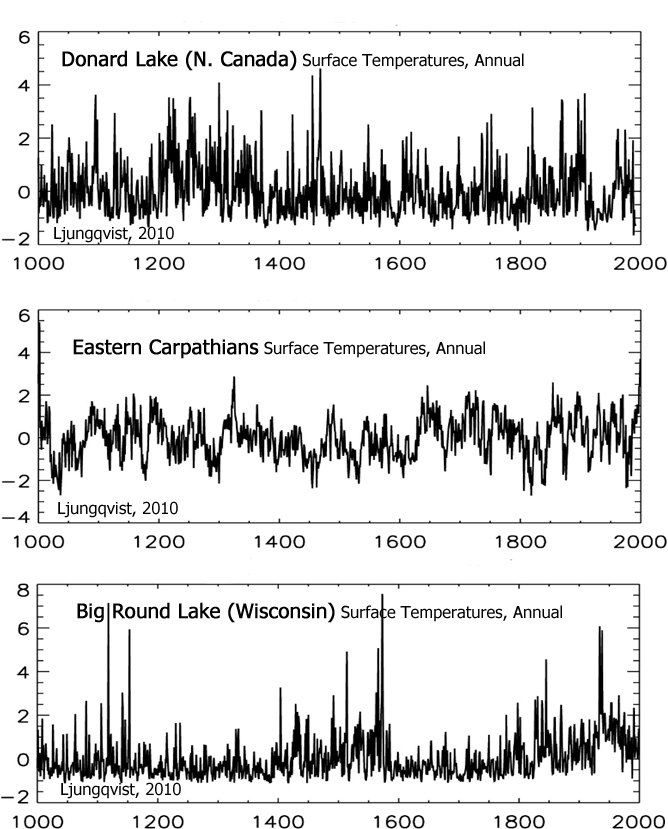
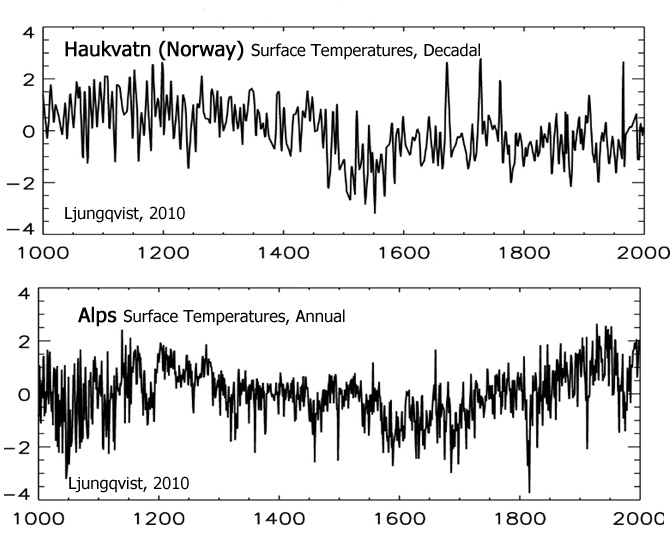
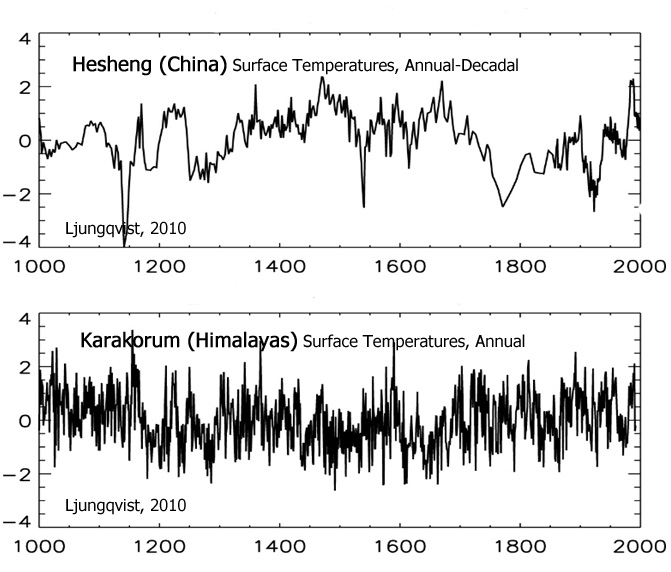
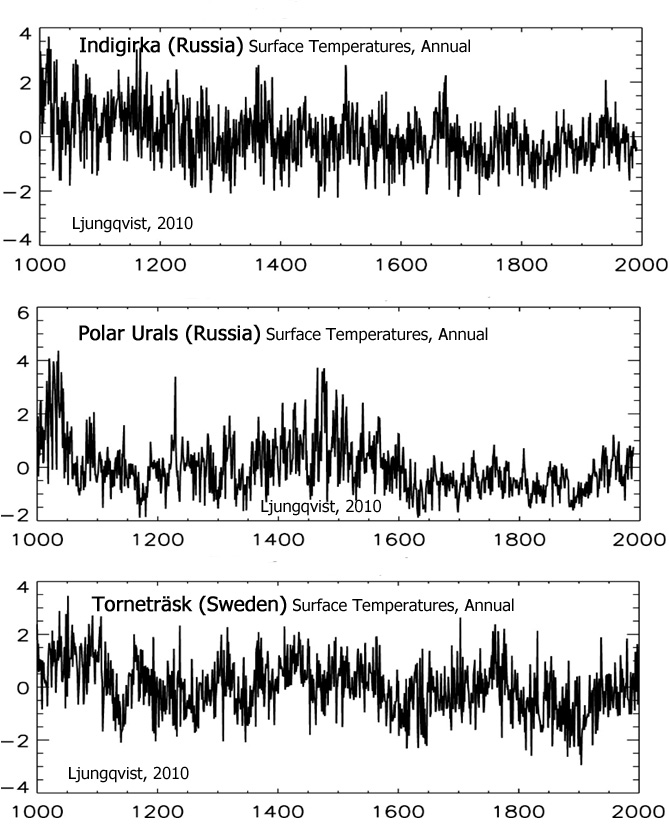
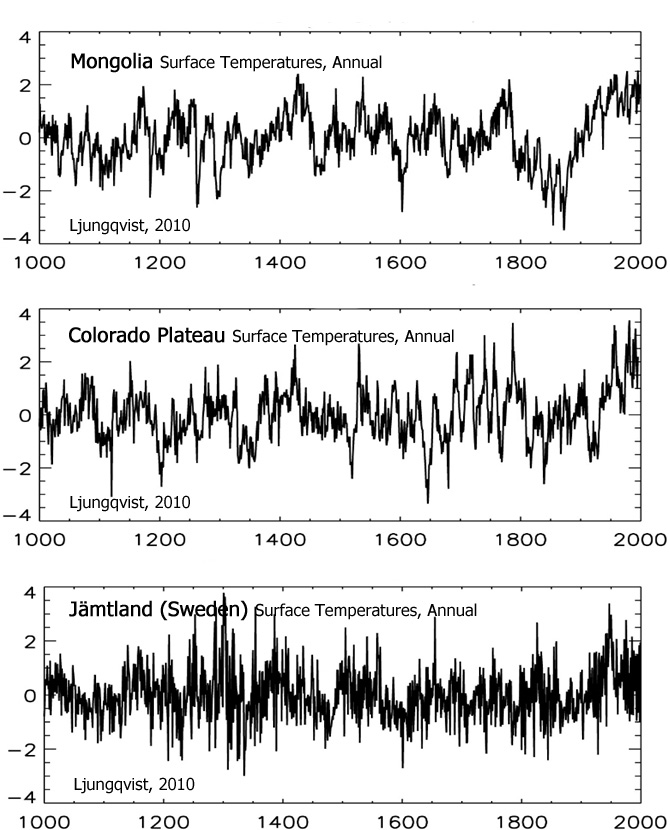
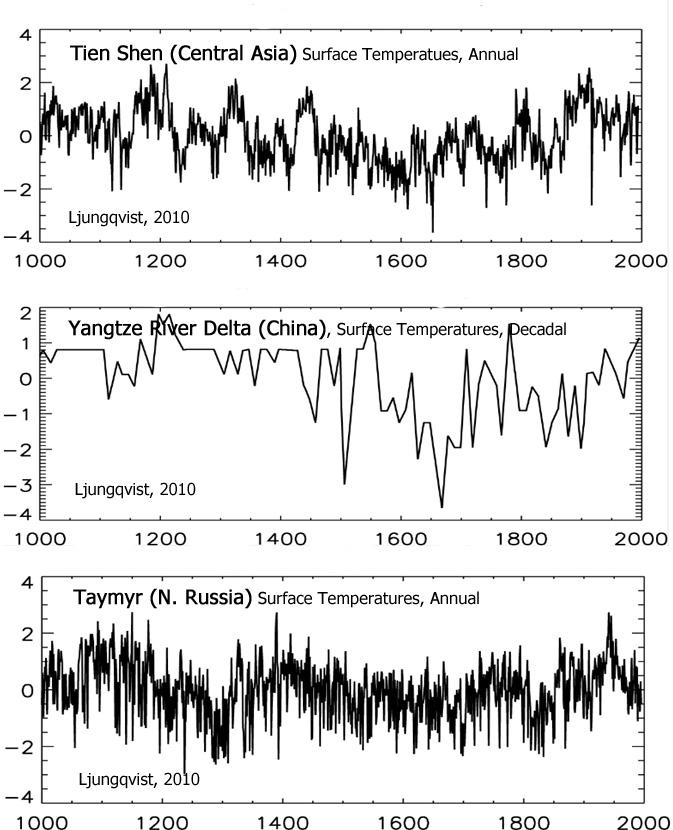
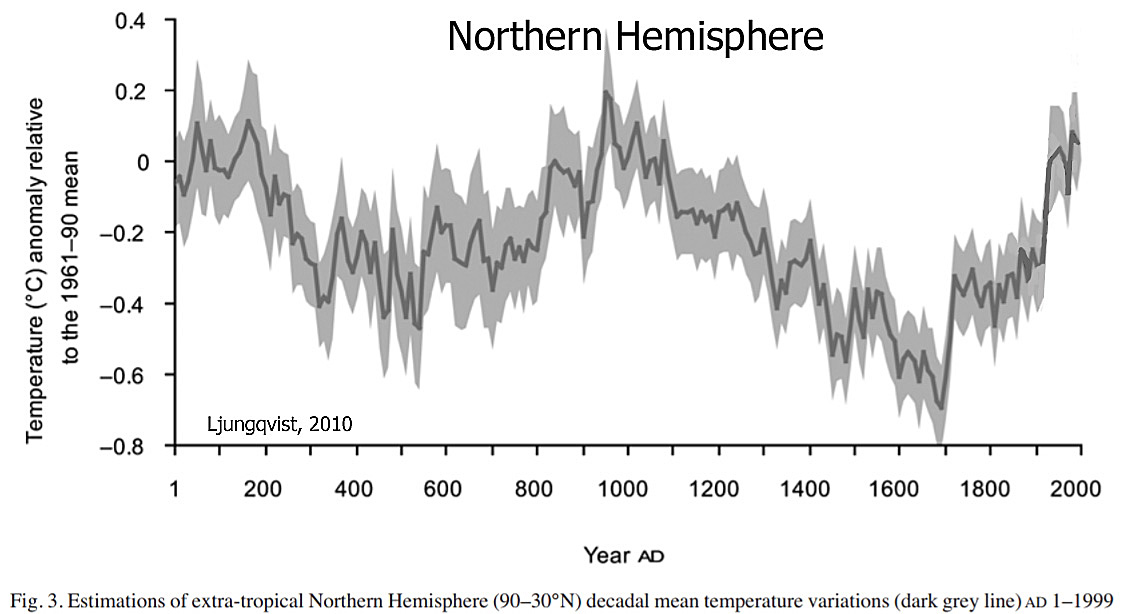
Ljungqvist, 2010
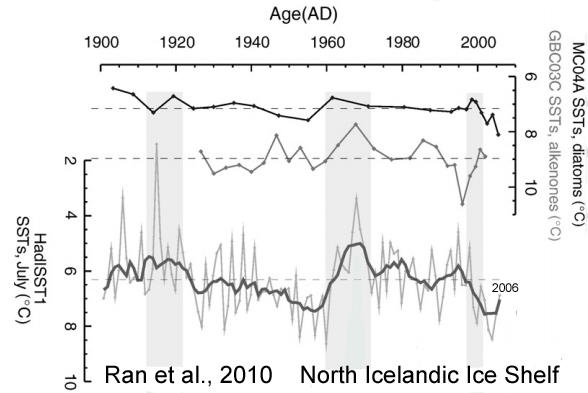
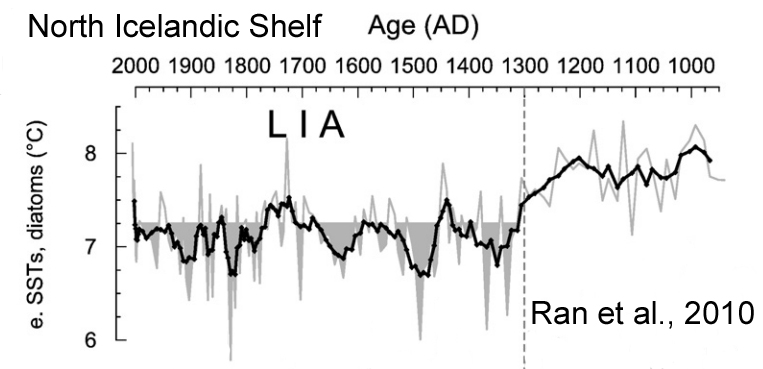
Ran et al., 2010
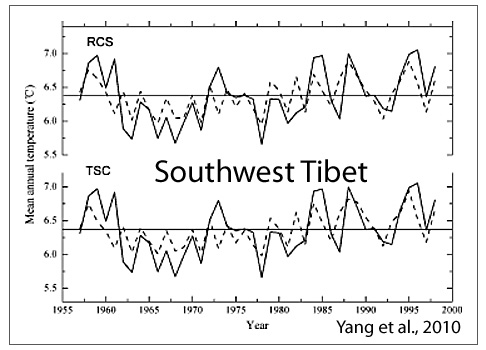
Yang et al., 2010
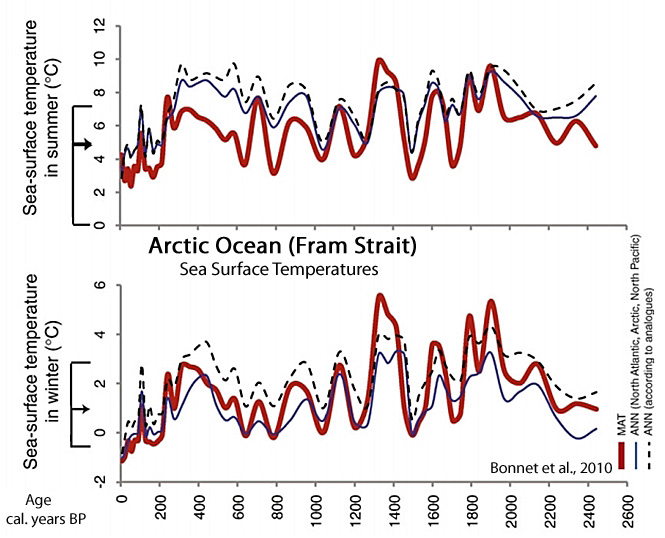
Bonnet et al., 2010
“Sea-surface temperature (SST) estimates suggest warmer conditions than present (anomaly∼+2 °C) averaging at 7 °C in summer until 300 cal. years BP, although cooling pulses are recorded around 1700, 1500, 1200 and 800 cal. years BP. The last 300 years were marked by a cooling from 7.6 to 3.5 °C and sea-ice cover increasing up to 7 months/yr. … From 2500 to 300 cal. years BP, SSTs were relatively high with mean values of about 2 °C and 7 °C in winter and summer, respectively. Warm phases are recorded around 1900, 1600, 1320, 1120 and 325 cal. years BP, with an optimum centered at 1320 cal. years BP. After 300 cal. years BP, SSTs were significantly lower with mean values of about 0 °C and 3.5–4 °C in winter and summer, respectively. … The record of sea-surface conditions from core JM04 indicates warmer winter SSTs during the last 2500 years than the modern average. The only exception is the interval spanning from 250 to 50 years BP, which is characterized by particularly low temperatures both in winter and summer.”
Ran et al., 2010

![]()
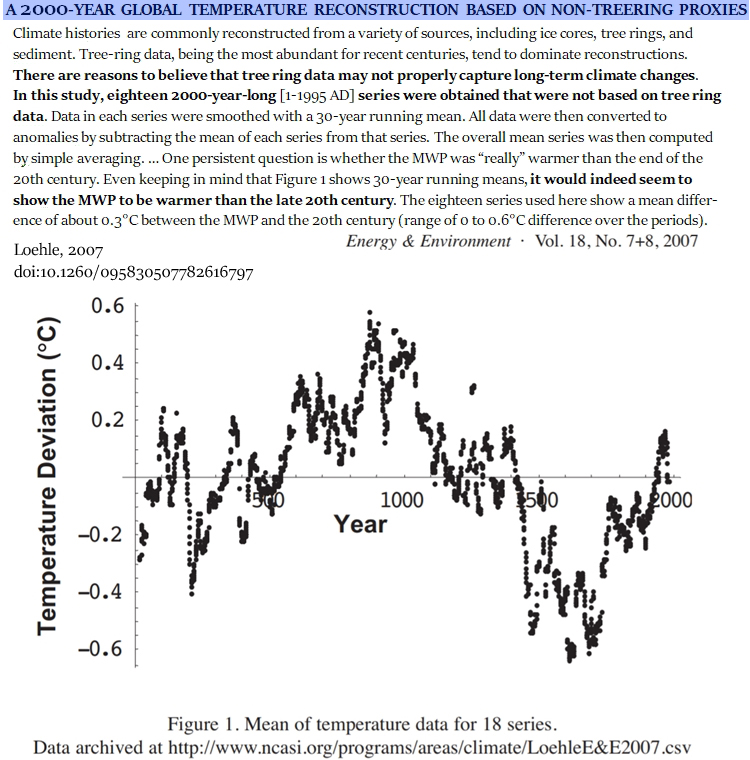
Loehle, 2007
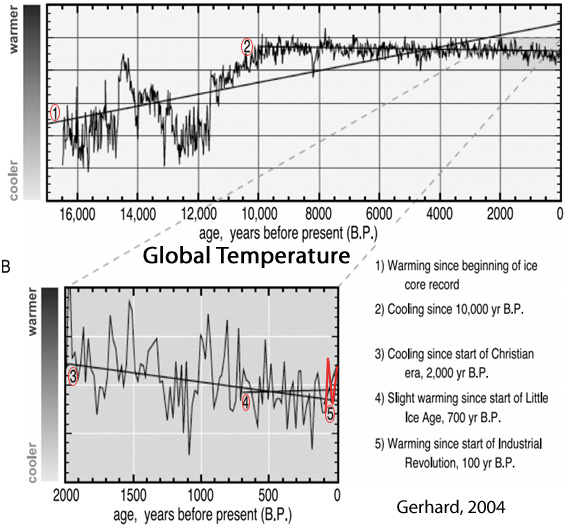
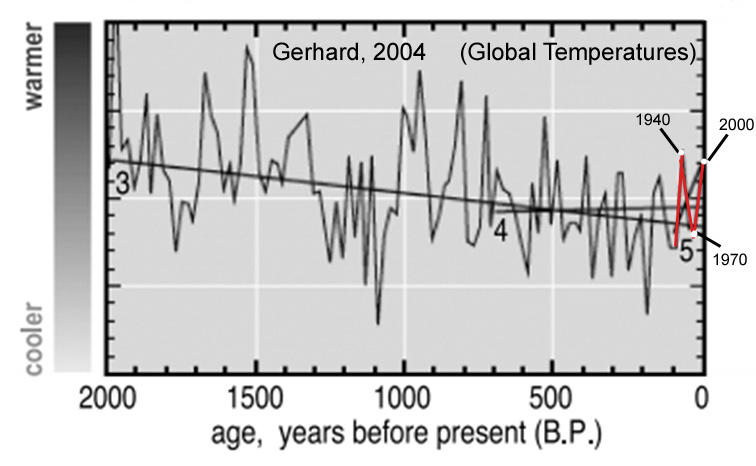
Gerhard, 2004
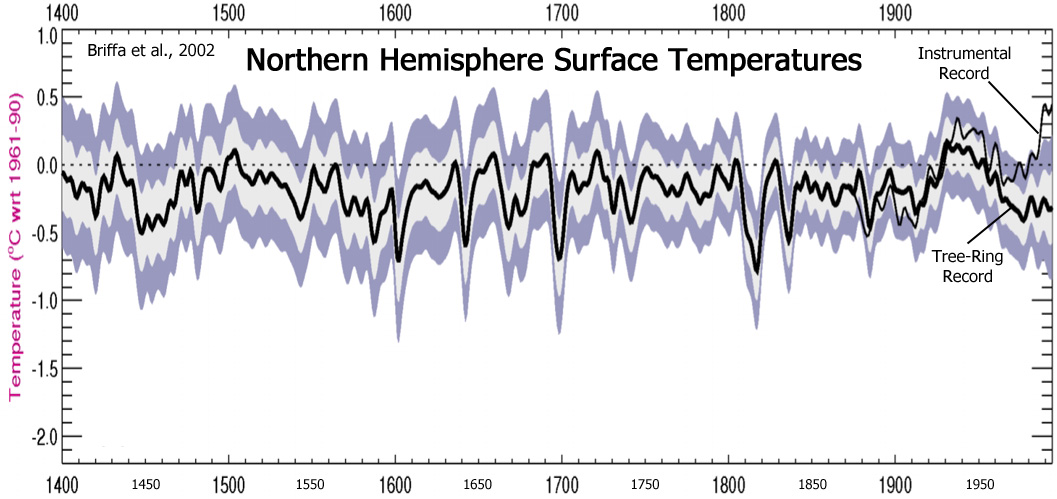
Briffa et al., 2002
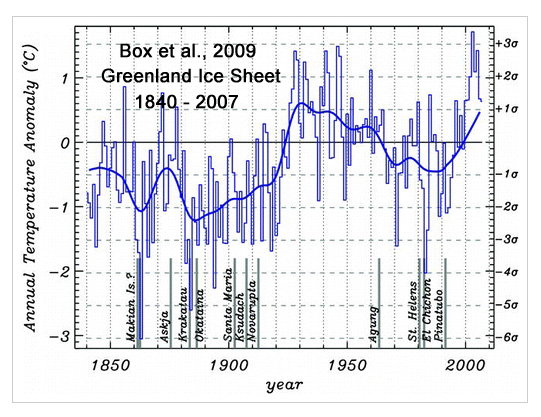
Box et al., 2009
“Meteorological station records and regional climate model output are combined to develop a continuous 168-yr (1840–2007) spatial reconstruction of monthly, seasonal, and annual mean Greenland ice sheet near-surface air temperatures. The annual whole ice sheet 1919–32 warming trend is 33% greater in magnitude than the 1994–2007 warming.”
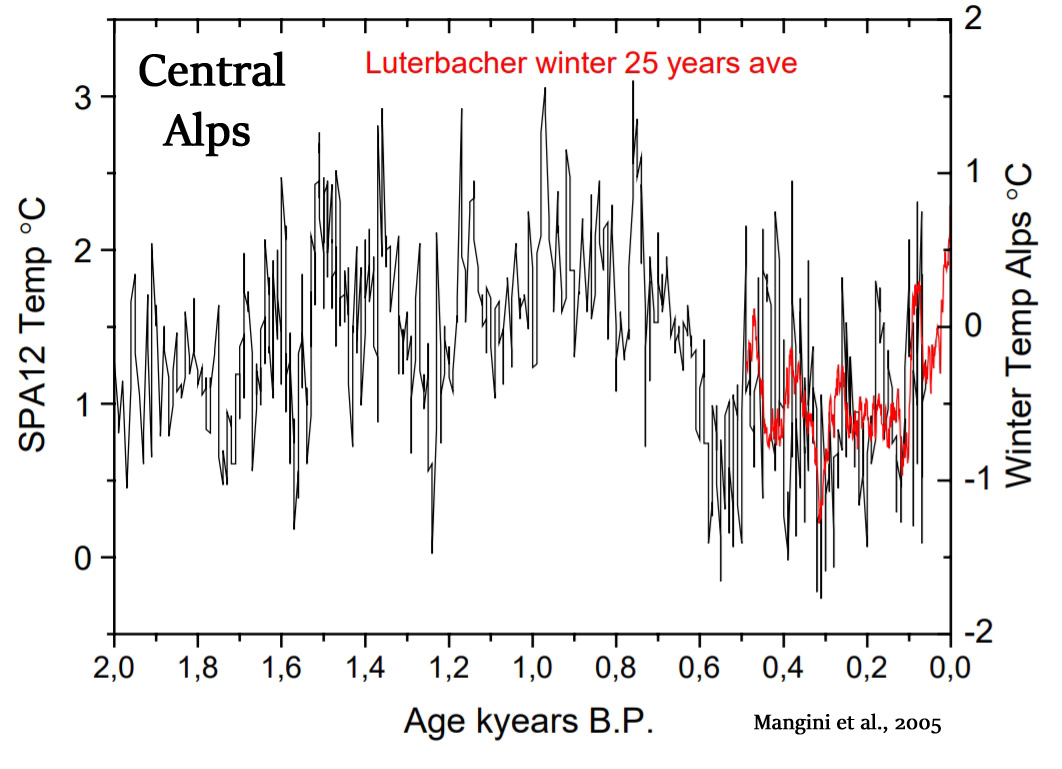
Mangini et al., 2005
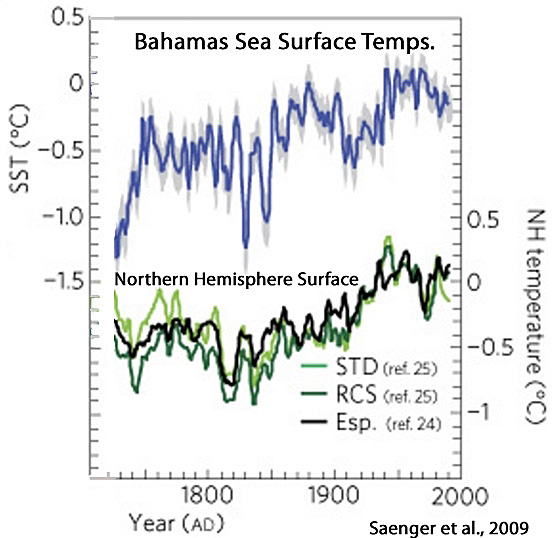
Saenger et al, 2009
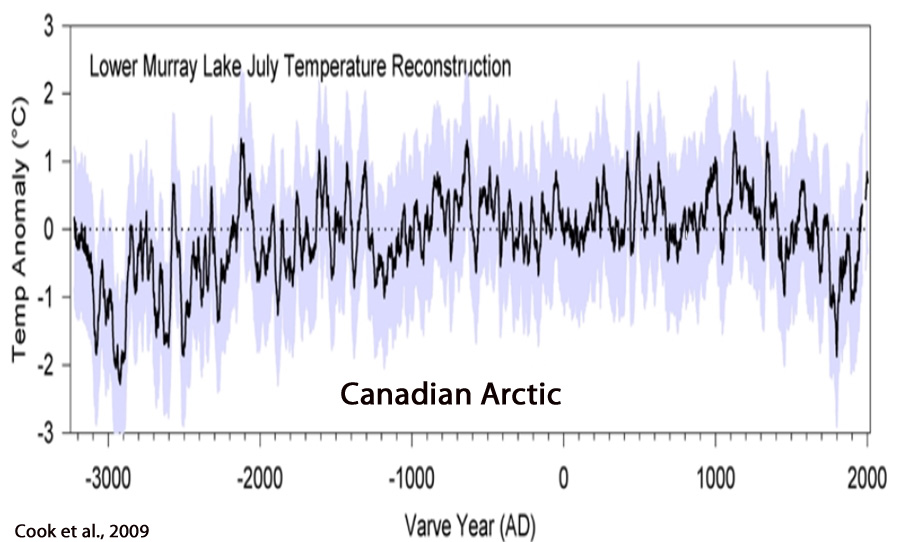
Cook et al., 2009
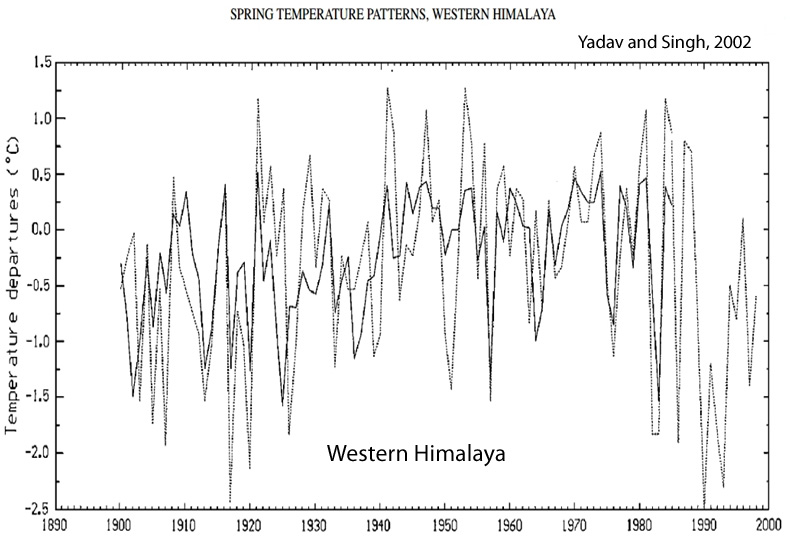
Yadav and Singh, 2002
“The 1945–1974 period was the warmest 30-yr mean period of the 20th century. However, this warming, in the context of the past four centuries, appears well within the range of normal limits. The 30-yr mean temperature anomaly for 1662–1691 (0.19°C) exceeds in magnitude (although not significantly, p = 0.23) the 1945–1974 mean (0.05°C).”
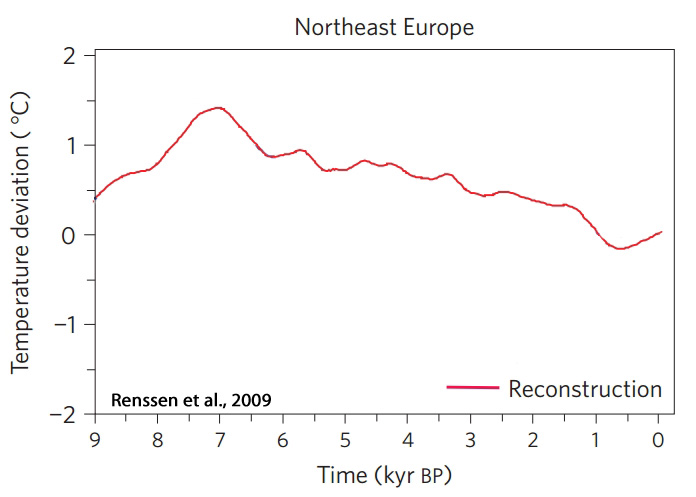
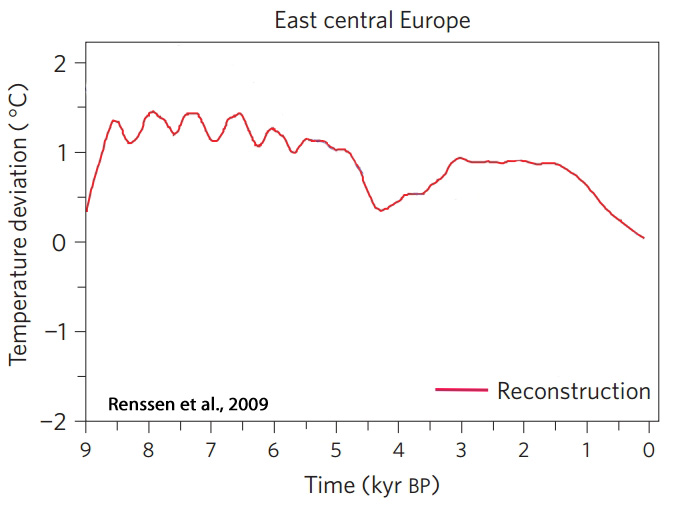
Renssen et al., 2009

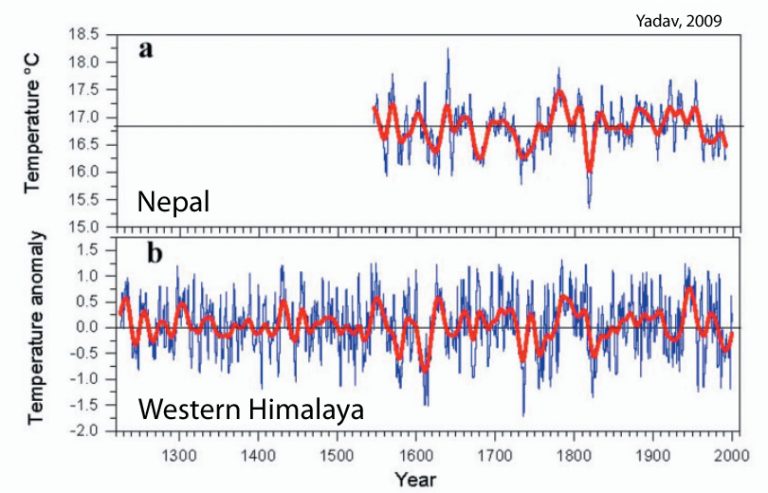
Yadav, 2009
“The decreasing temperature trend in late 20th century is consistent with trends noted in Nepal (Cook et al. 2003), Tibet (Briffa et al. 2001) and Central Asia (Briffa et al. 2001).”
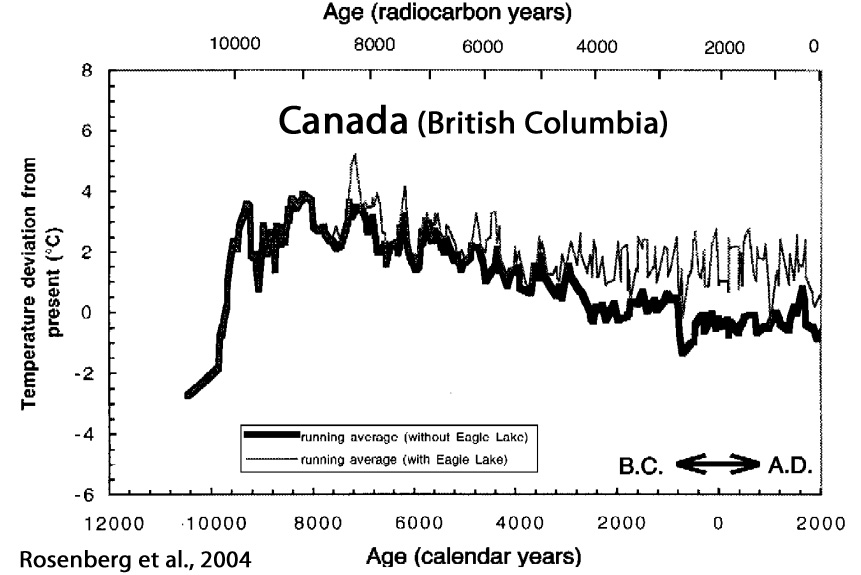
Rosenberg et al., 2004
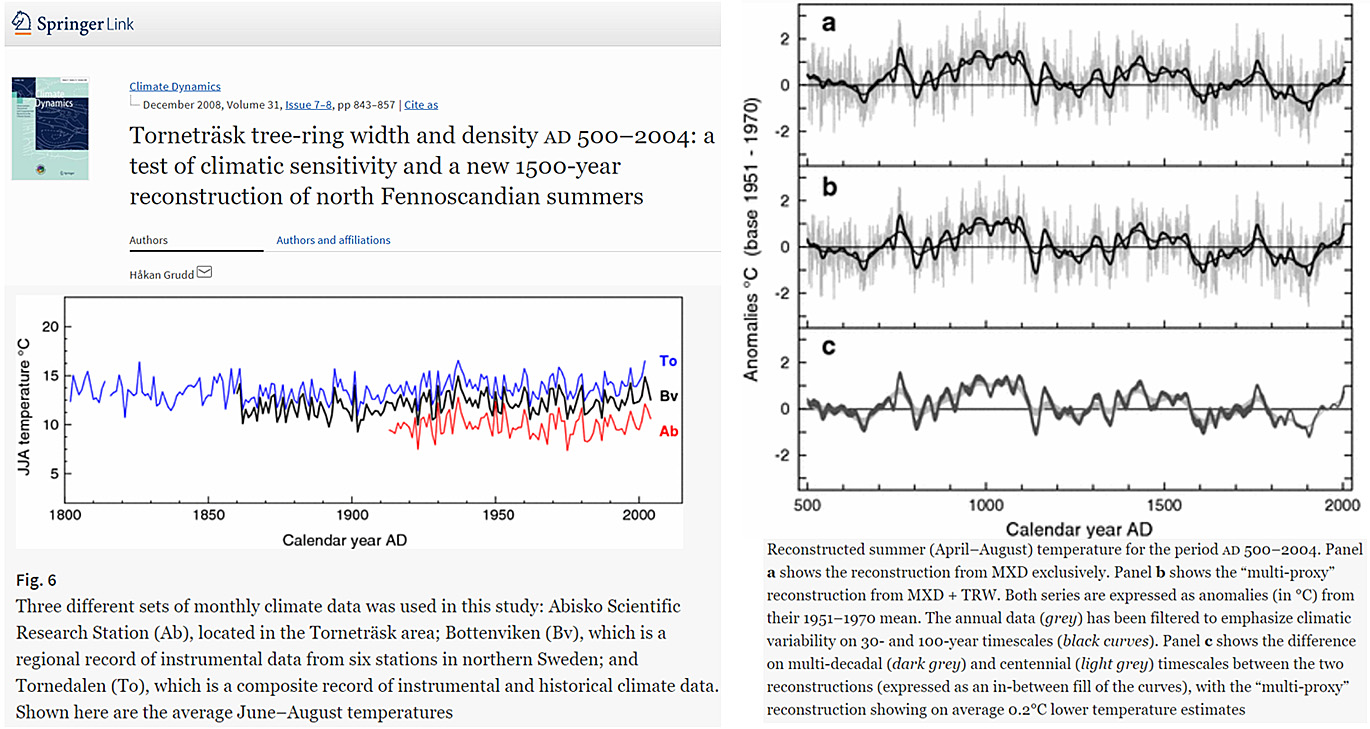
Grudd, 2008
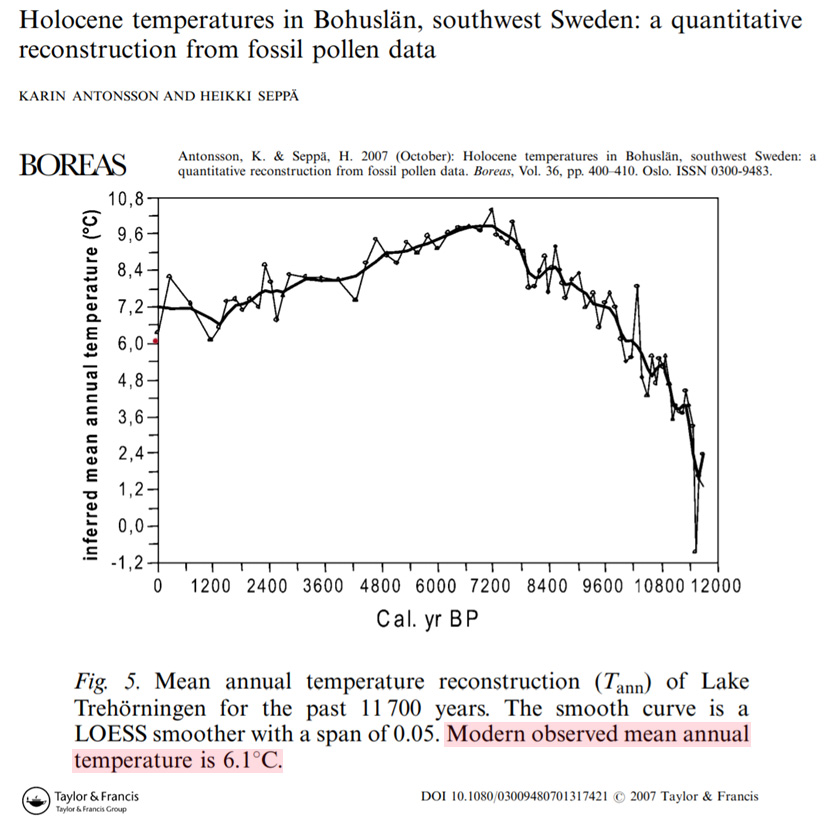
Antonsson and Seppä, 2007
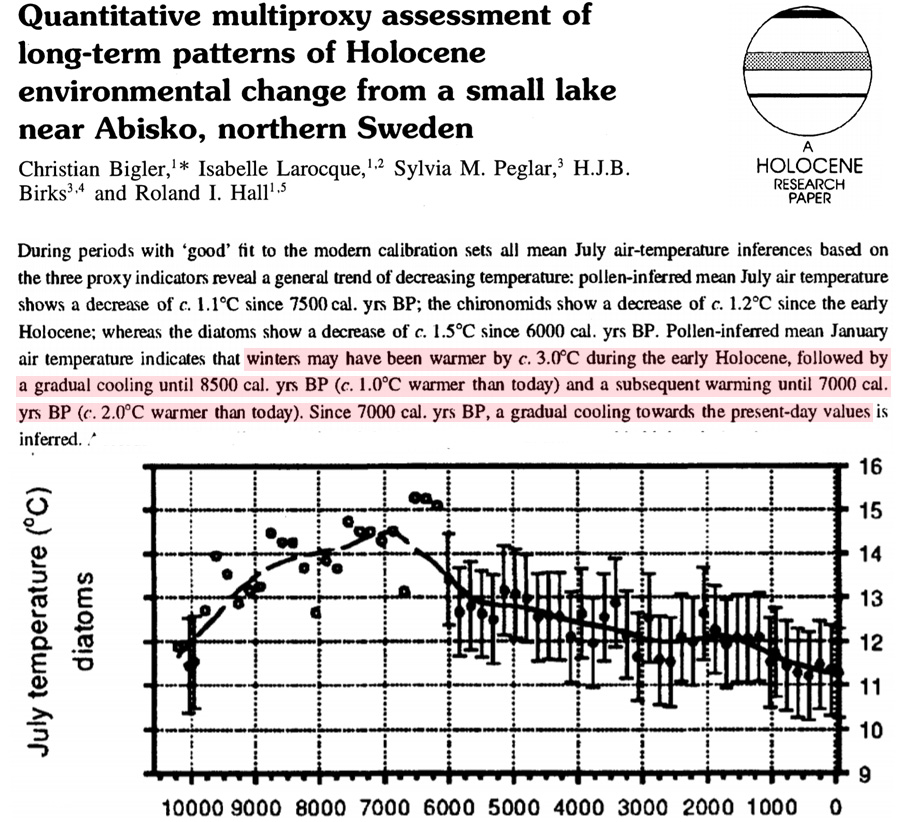
Bigler e tal., 2002
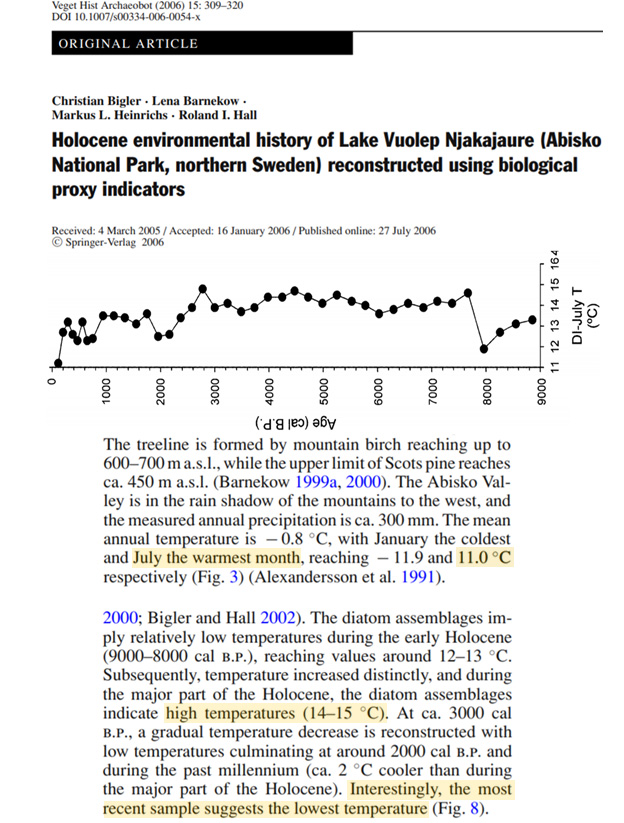
Bigler et al., 2006
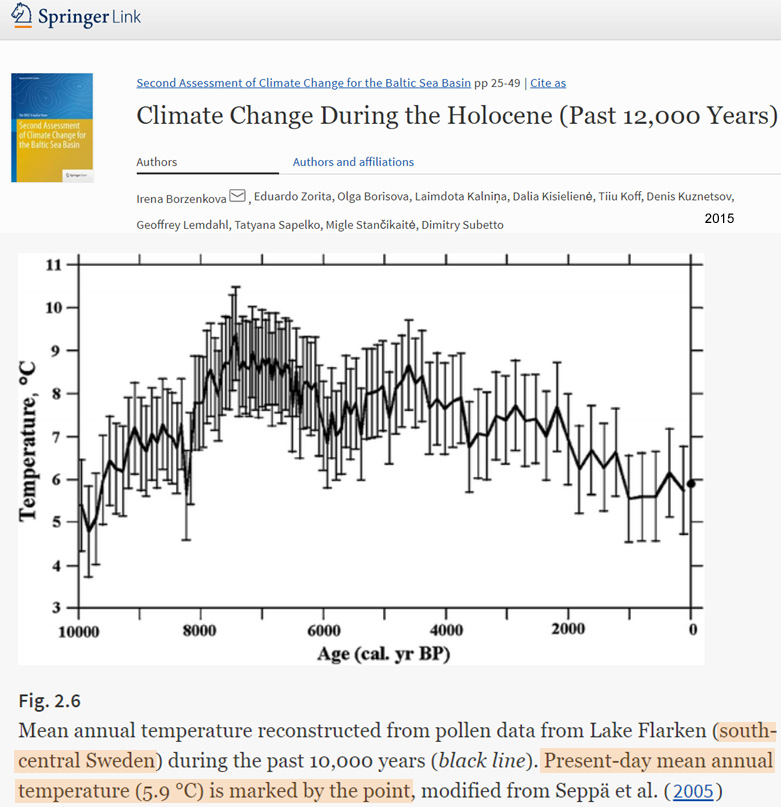
Borzenkova et al., 2015
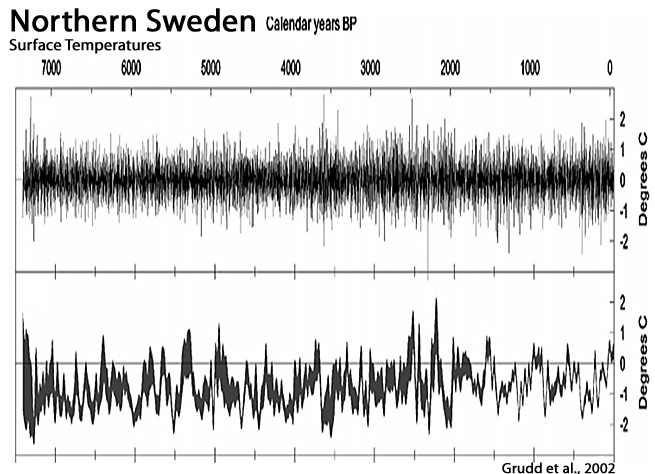
Grudd et al., 2002
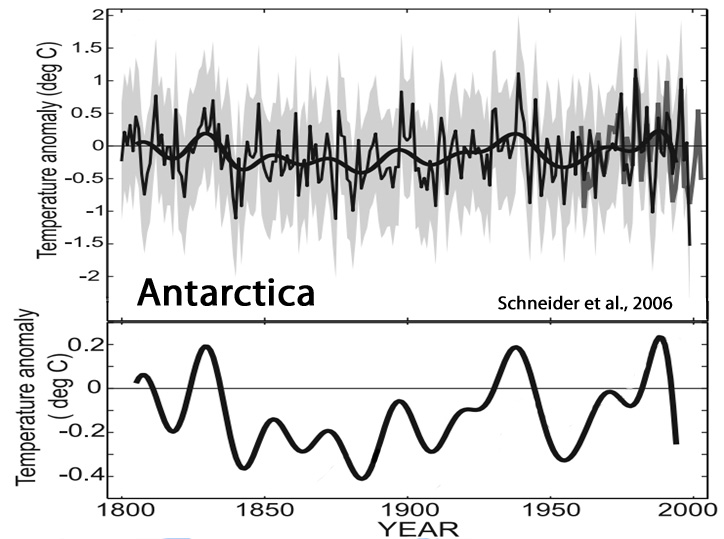
Schneider et al., 2006
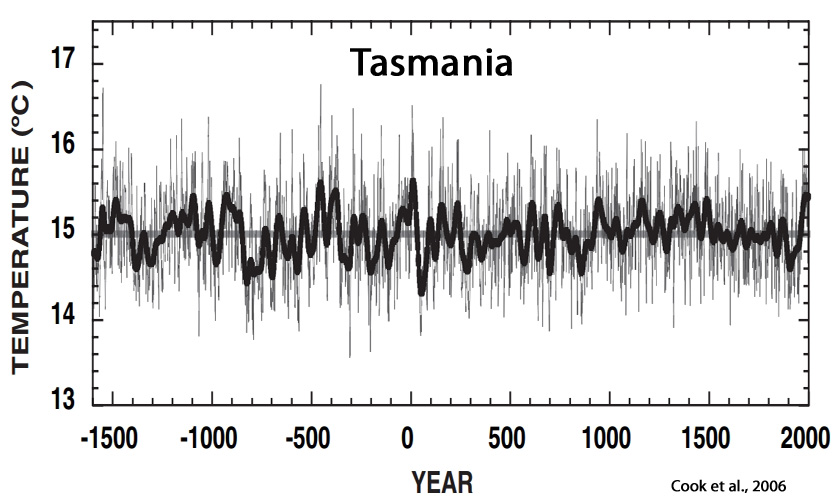
Cook et al., 2006
von Gunten et al., 2009
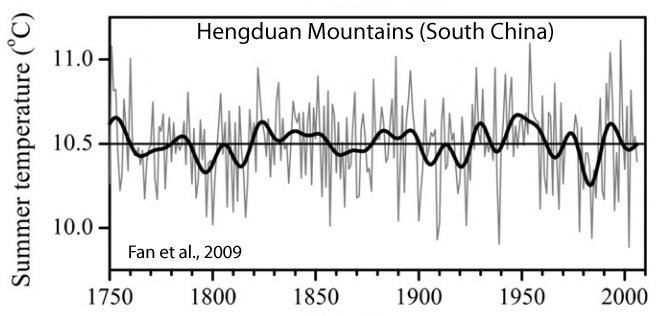
Fan et al., 2009
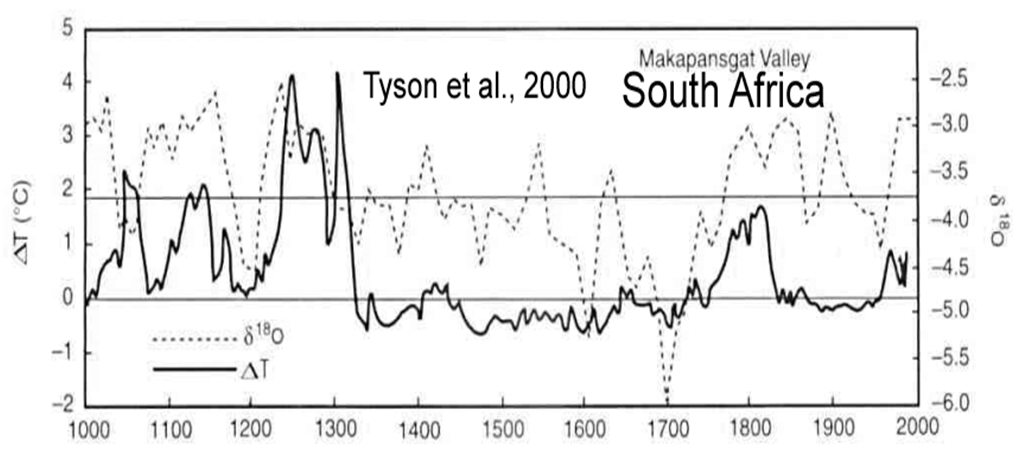
Tyson et al., 2000
“The climate of the interior of South Africa was around 1°C cooler in Little Ice Age [AD 1300 to 1800] and may have been over 3°C higher than at present during the extremes of the medieval warm period [AD 1000 to 1300]. … It was variable throughout the millennium, but considerably more so during the warming of the eleventh to thirteenth centuries. The lowest temperature events recorded during the Little Ice Age in South Africa are coeval with the Maunder and Sporer Minima in solar irradiance. The medieval warming is shown to have coincided with … the Medieval Maximum in solar radiation.”

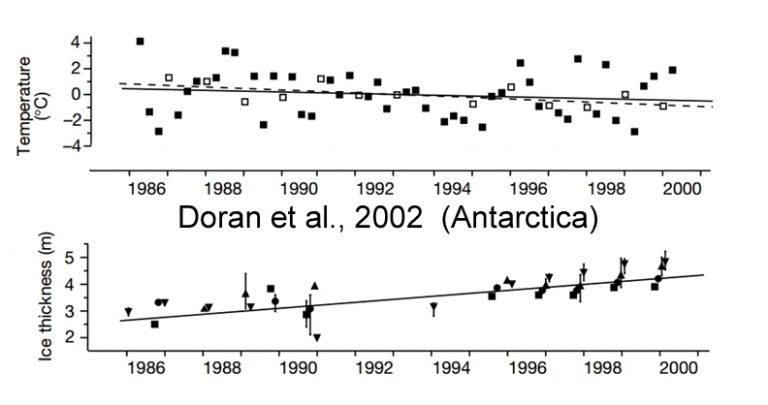
Doran et al., 2002
“[O]ur spatial analysis of Antarctic meteorological data demonstrates a net cooling on the Antarctic continent between 1966 and 2000, particularly during summer and autumn.”
Cook et al., 2002
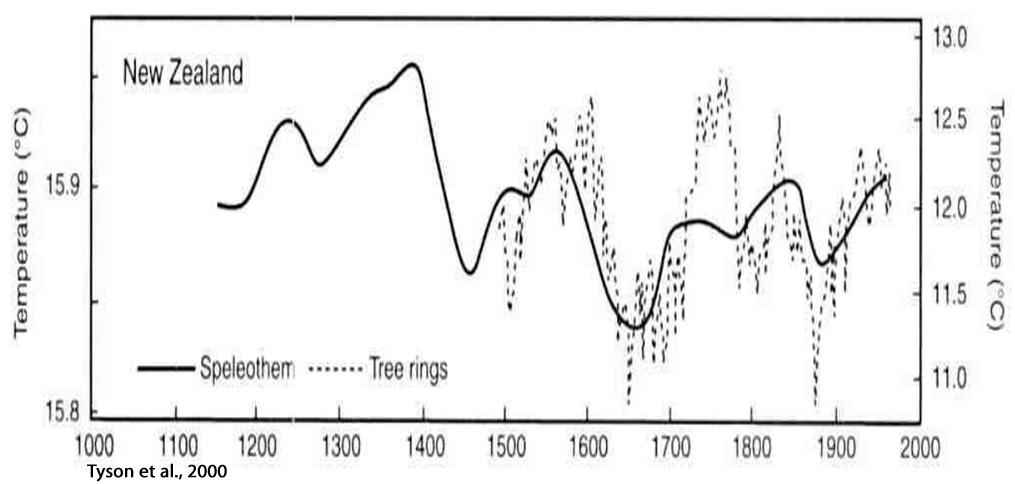
“This record is the longest yet produced for New Zealand and shows clear evidence for persistent above-average temperatures within the interval commonly assigned to the MWP [Medieval Warm Period]. Comparisons with selected temperature proxies from the Northern and Southern Hemispheres confirm that the MWP was highly variable in time and space. Regardless, the New Zealand temperature reconstruction supports the global occurrence of the MWP.”

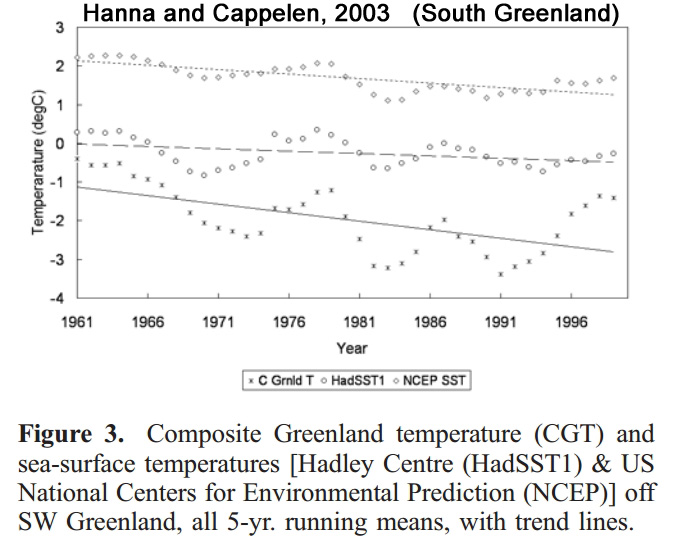
Hanna and Cappelen, 2003
“Analysis of new data for eight stations in coastal southern Greenland, 1958–2001, shows a significant cooling (trend-line change −1.29°C for the 44 years), as do sea-surface temperatures in the adjacent part of the Labrador Sea”
Chuine et al., 2004
“Figure 1 [below] shows two early warm decadal fluctuations: one in the 1380s (0.72 °C) and one in the 1420s (0.57 °C), both above the 95th percentile. The warm period of the 1420s was followed by a cold period that lasted from the mid-1430s to the end of the 1450s (0.45 °C, under the 10th percentile). Our series also reveals particularly warm events, above the 90th percentile, in the 1520s and between the 1630s and the 1680s. These decades were as warm as the end of the twentieth century. The high-temperature event of 1680 was followed by a cooling, which culminated in the 1750s (under the 5th percentile) — the start of a long cool period that lasted until the 1970s.”

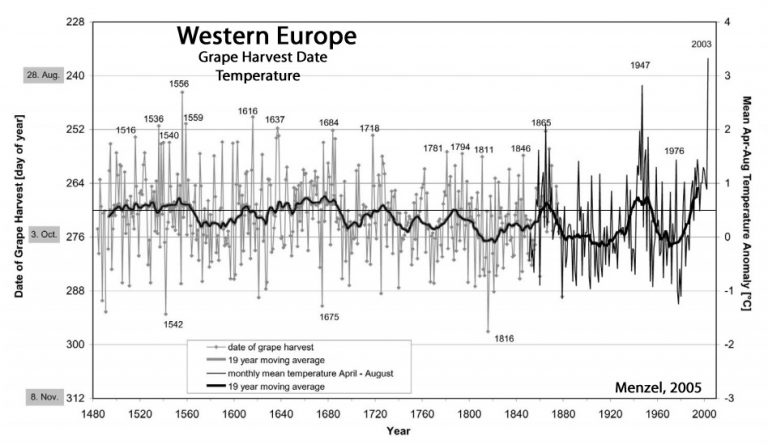
Menzel, 2005
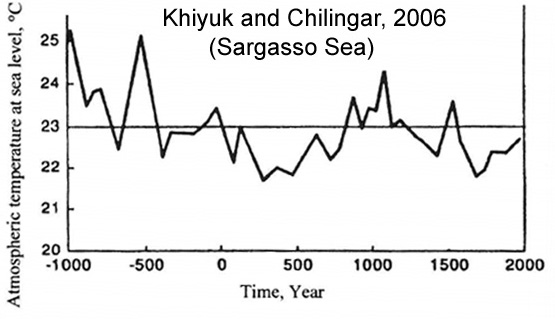
Khiyuk and Chilingar, 2006
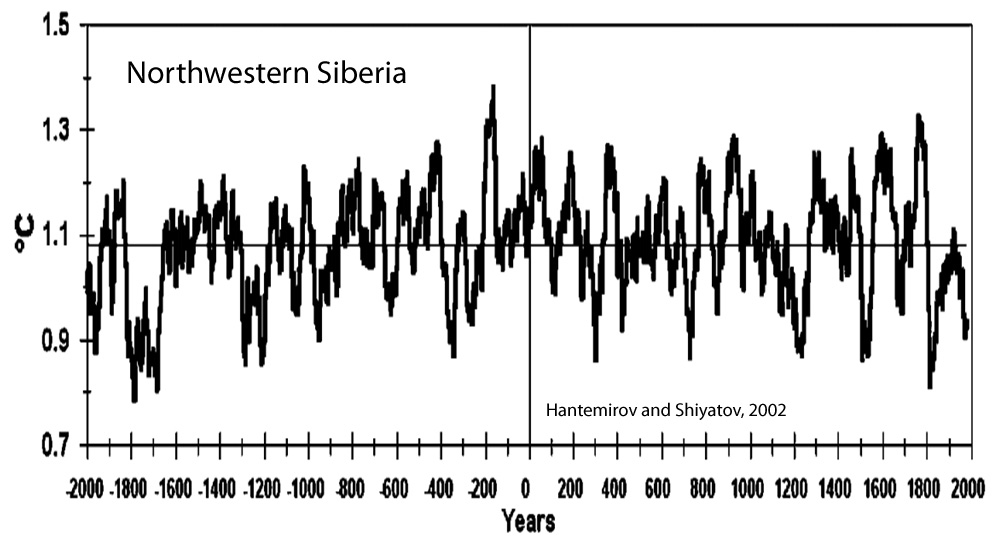
Hantemirov and Shiyatov, 2002
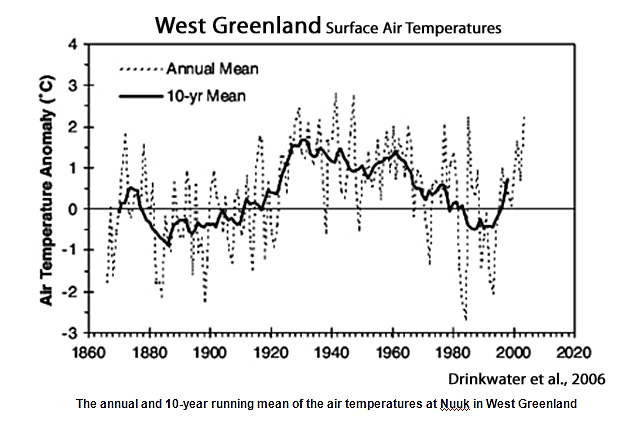
Drinkwater, 2006
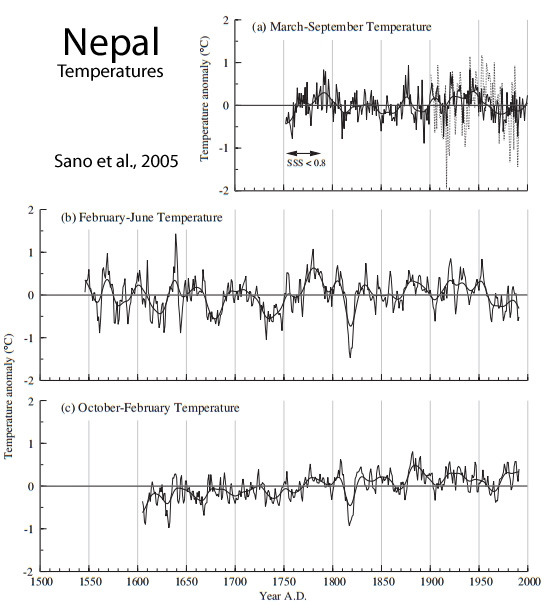
Sano et al., 2005
“March–September temperature was reconstructed for the past 249 years, which shows a warming trend from 1750s until approximately 1790, followed by cooling until 1810, then by a gradual warming trend extending to 1950, and a notable cold period continuing up to the present. No evidence of a consistent warming trend over the last century or two commonly appearing in higher latitudes was found in the present reconstruction”
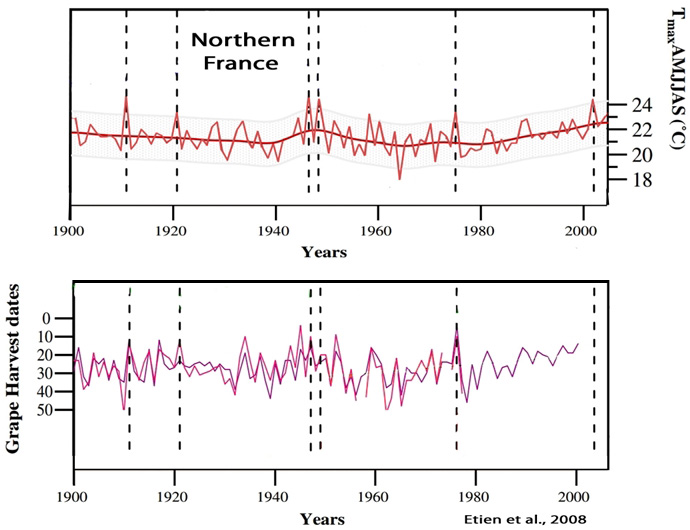
Etien et al., 2008
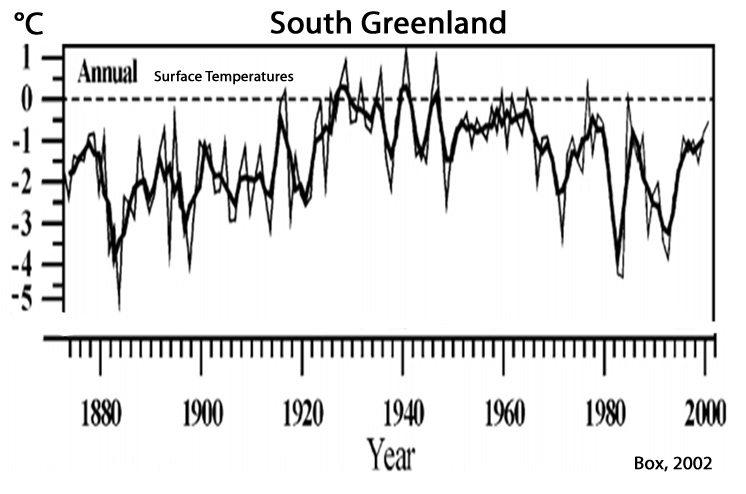
Box, 2002
“Temporal and spatial variability are analysed in Greenland instrumental temperature records from 24 coastal and three ice sheet locations. … The standard period 1961–90 was marked by 1–2°C statistically significant cooling.”
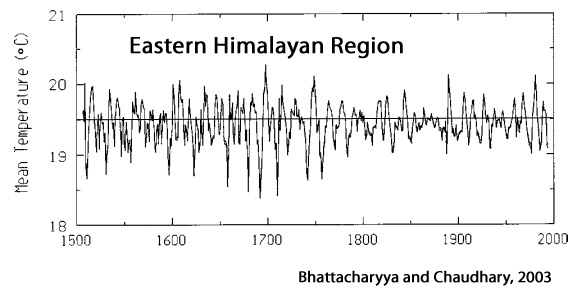
Bhattacharyya and Chaudhary, 2003
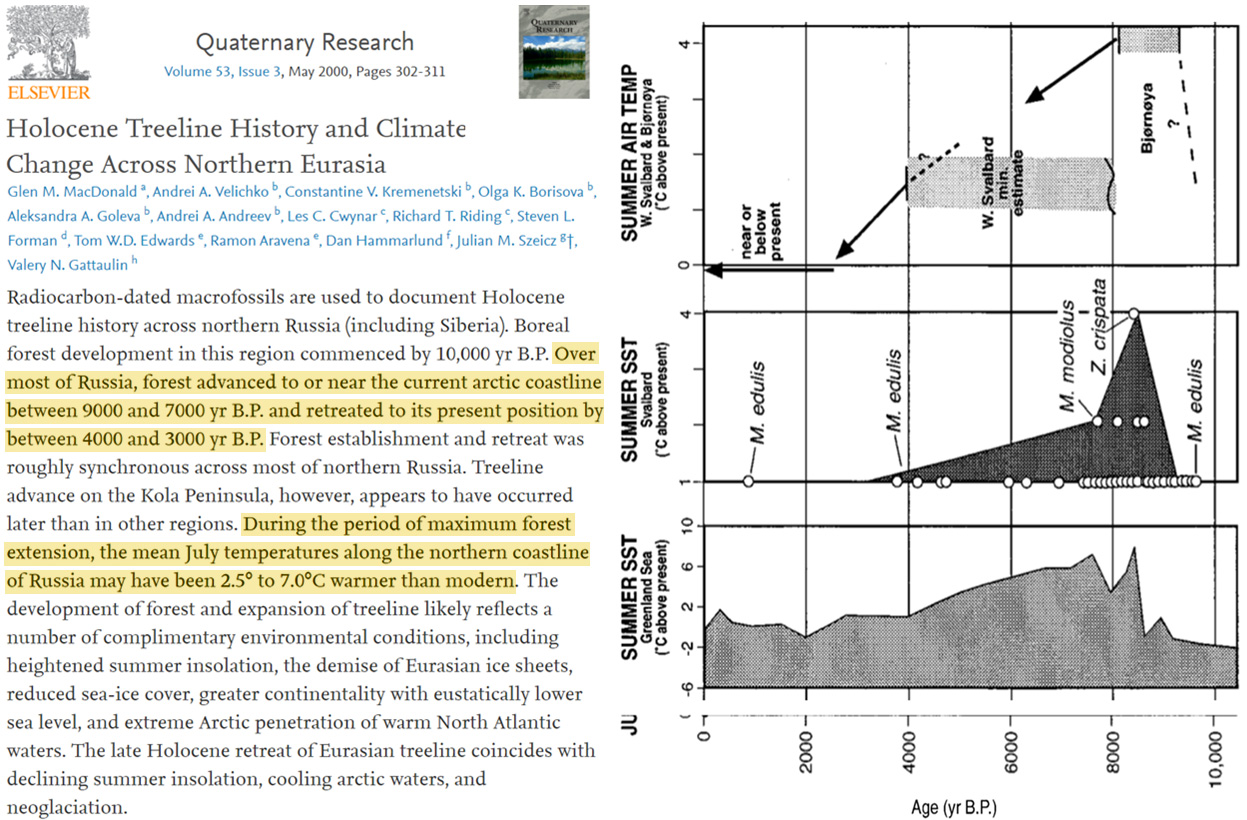
MacDonald et al., 2000
“Over most of Russia, forest advanced to or near the current arctic coastline between 9000 and 7000 yr B.P. and retreated to its present position by between 4000 and 3000 yr B.P. … During the period of maximum forest extension, the mean July temperatures along the northern coastline of Russia may have been 2.5° to 7.0°C warmer than modern.”
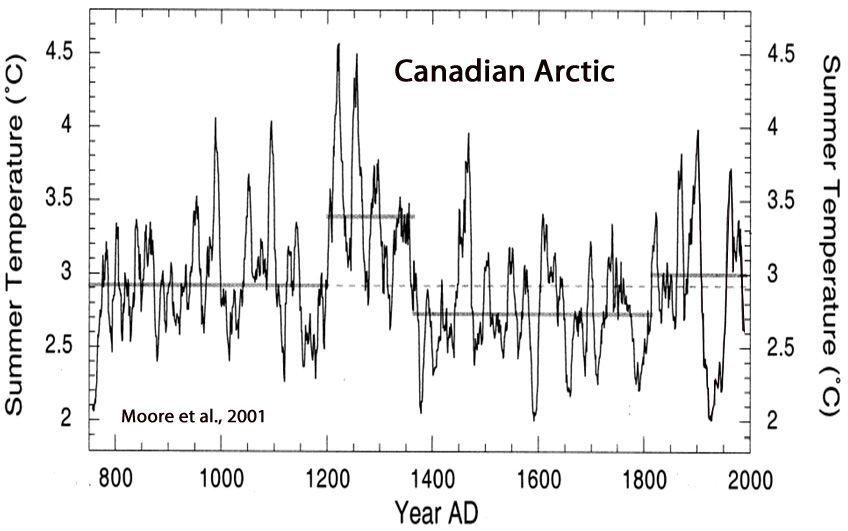
Moore et al., 2001
“Summer temperatures at Donard Lake [Canadian Arctic] over the past 1250 yrs averaged 2.9 °C. At the beginning of the 13th century, Donard Lake experienced one of the largest climatic transitions in over a millennium. Average summer temperatures rose rapidly by nearly 2 °C from 1195–1220 AD [+0.80 C per decade], ending in the warmest decade in the record (~4.3 °C).”
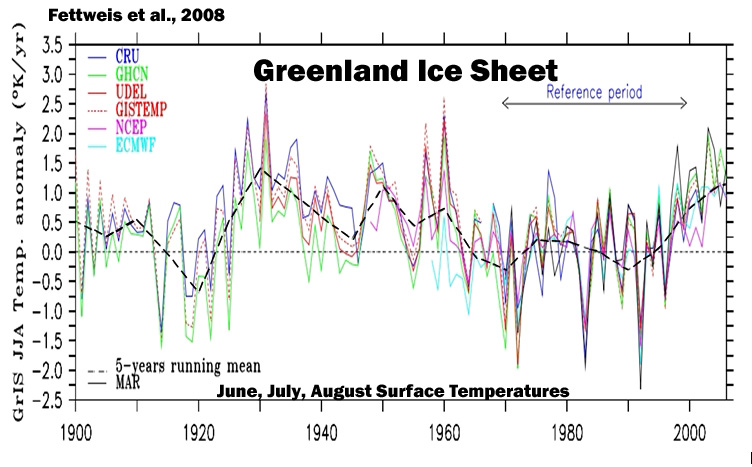
Fettweis et al., 2008
“The rate of warming in 1920– 1930 is the most spectacular as pointed out by Chylek et al. (2006). Finally, Greenland climate was colder around 1920 and, in the 1970s and 1980s. The temperature minimum (resp. maximum) seems to have occurred in 1992 after the Mont Pinatubo eruption (resp. in 1931). The warm summers of recent years (1998, 2003, 2005), associated with large melt extent areas (Fettweis et al., 2007), seem to be less warm than these of the 1930s, as also pointed out by Hanna et al. (2007). … The absolute minimum [surface mass balance] occurred around 1930 with a SMB anomaly near −300 km3 yr−1 . Secondary (minor) SMB minima appear to have occurred in 1950 and 1960, equalling the surface mass loss rates of the last few years (1998, 2003, 2006). … After the 1990s, the GrIS SMB decreases slowly to reach the negative anomalies of the last few years, although the summers of the 2000s were not exceptional compared to 70 yr ago“
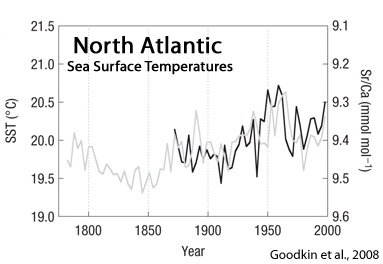
Goodkin et al., 2008
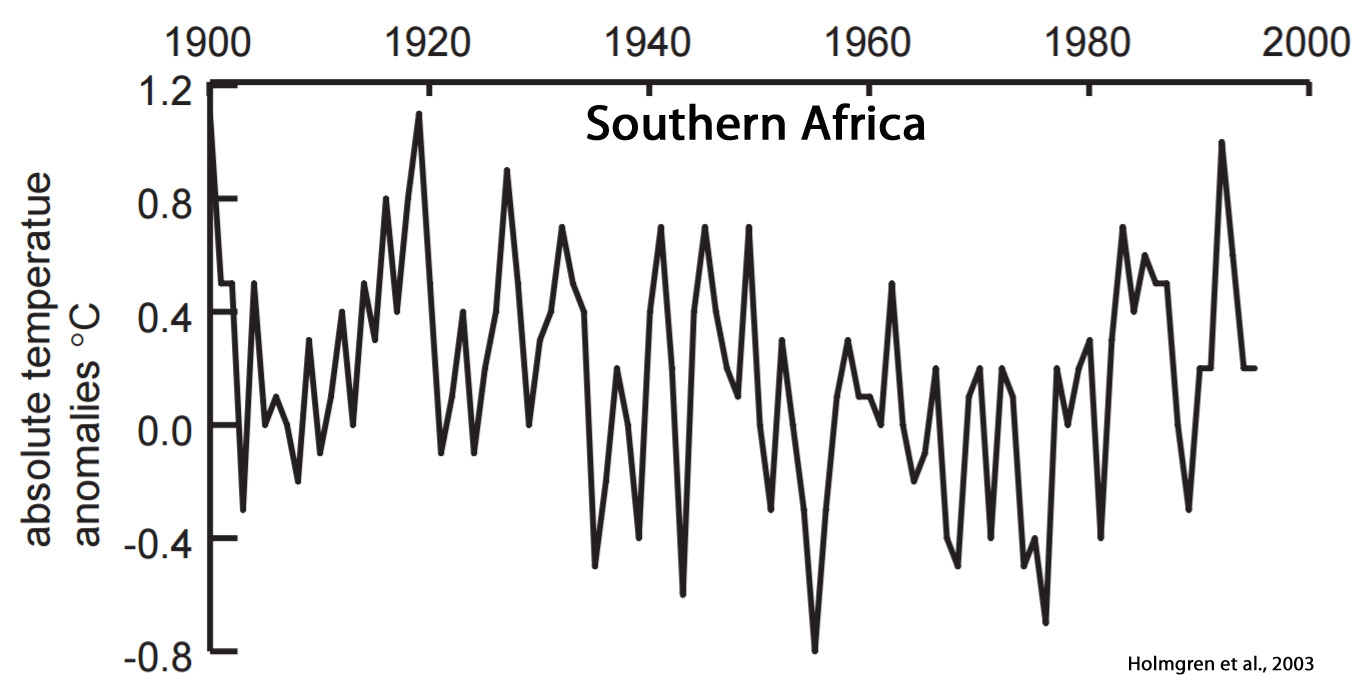
Holmgren et al., 2003
![]()
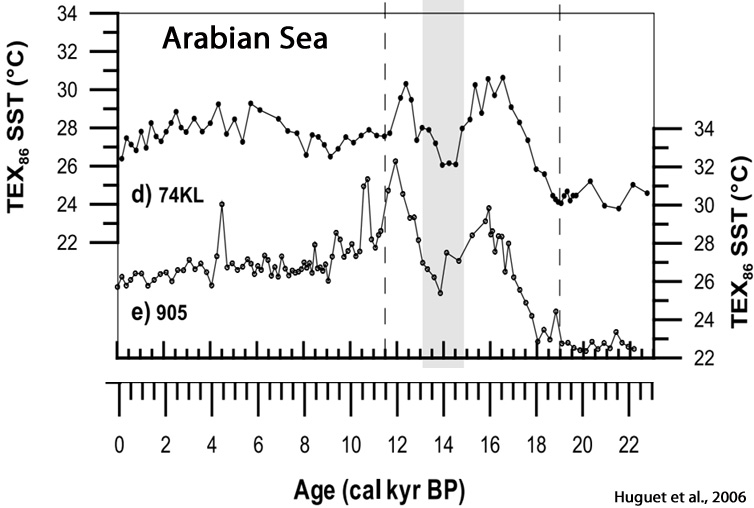
Huguet et al., 2006
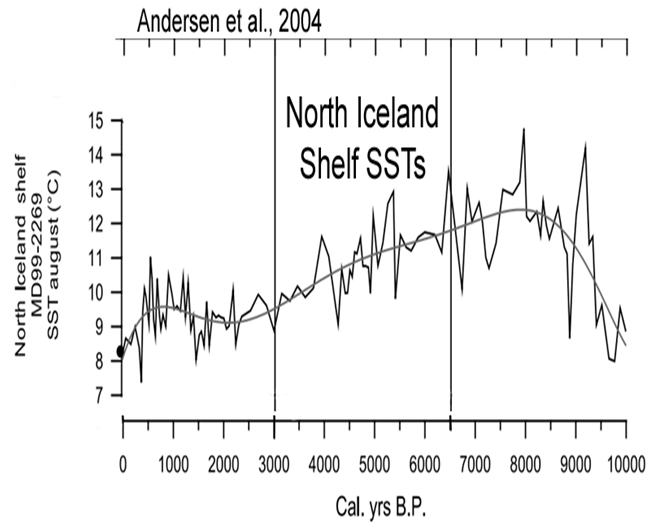
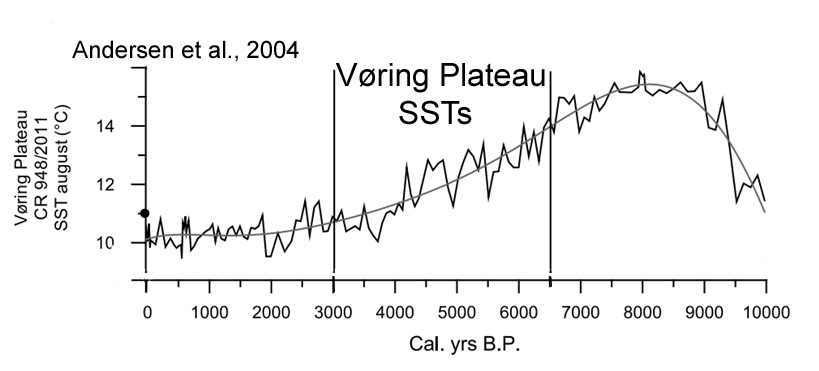
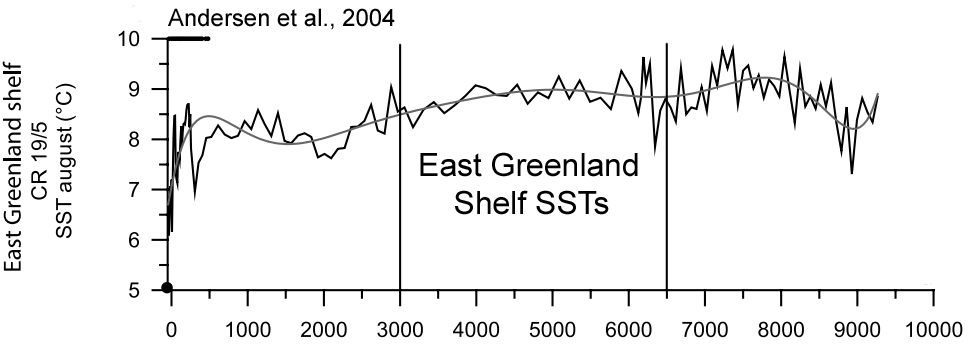
Andersen et al., 2004
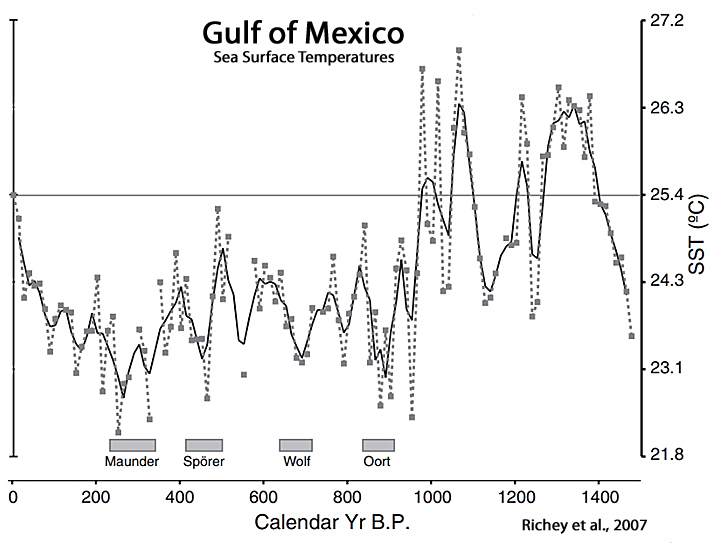
Richey et al, 2007
Jiang et al., 2005
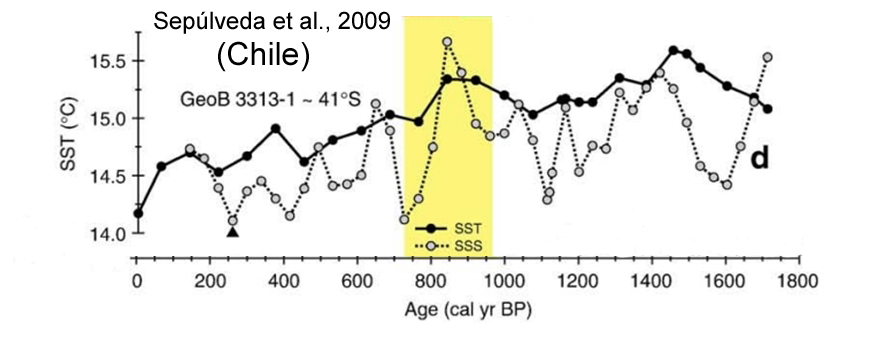
Sepúlveda et al., 2009
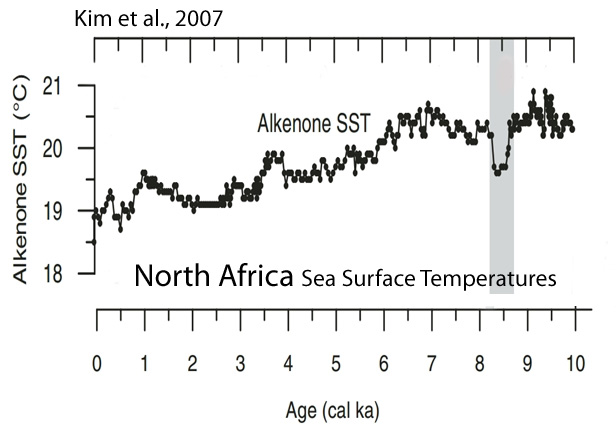
Kim et al., 2007
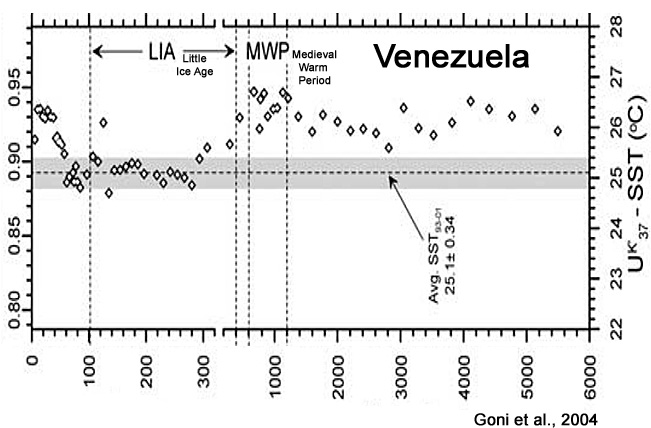
Goni et al., 2004
“The highest [proxy]-derived SST estimates (over 26.5°C) were measured during the Medieval Warm Period (MWP)”
Viau and Gajewski, 2009

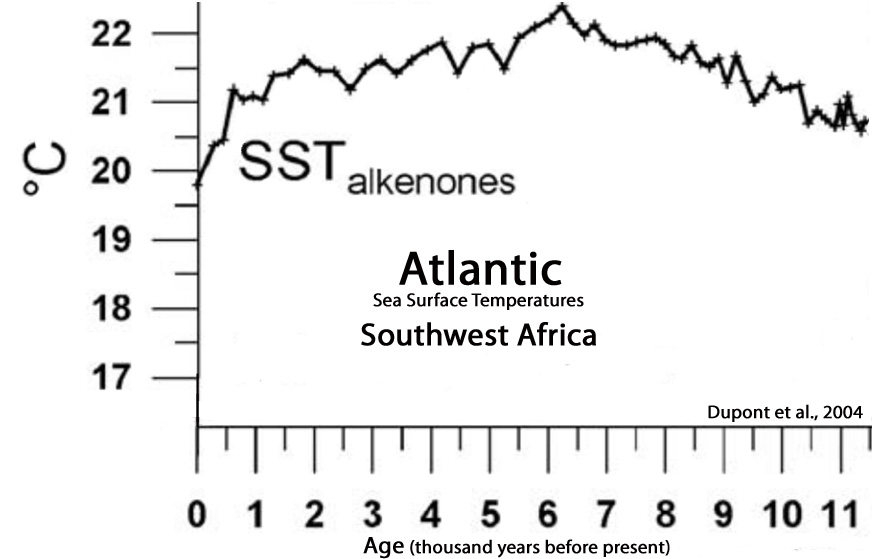
Dupont et al., 2004
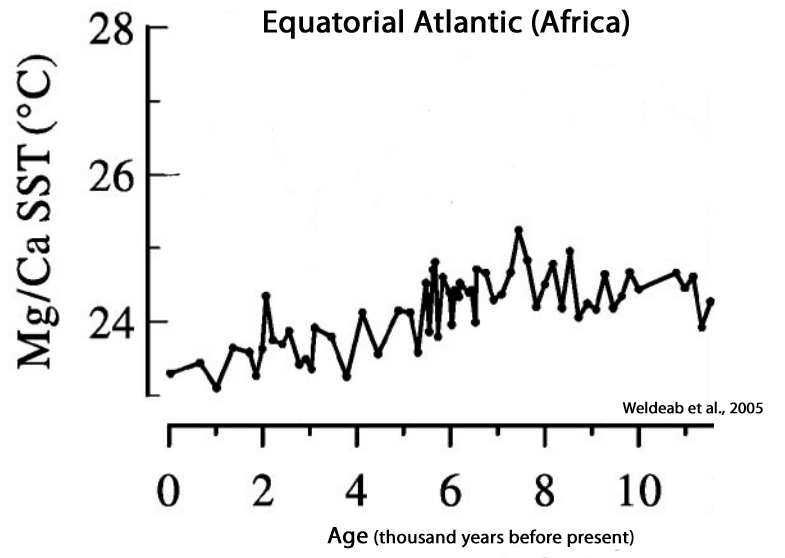
Weldeab et al, 2005
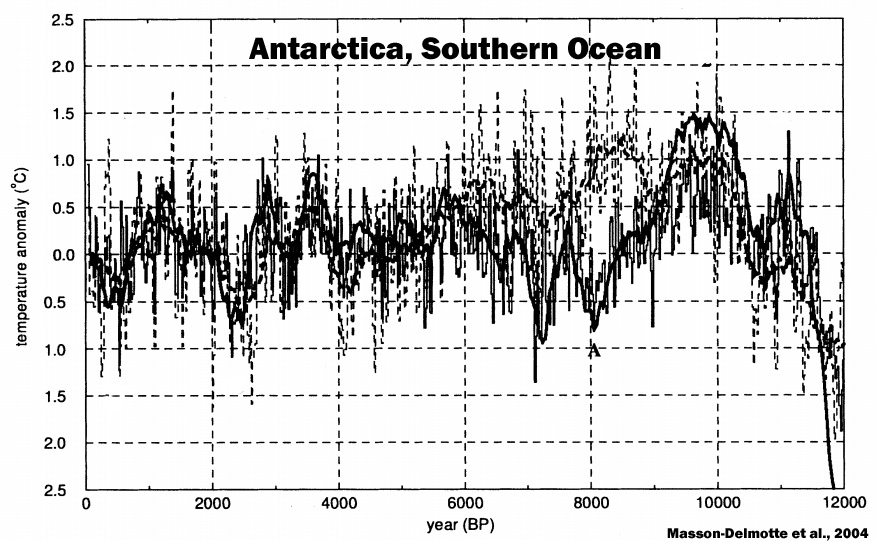
Masson-Delmotte et al., 2004
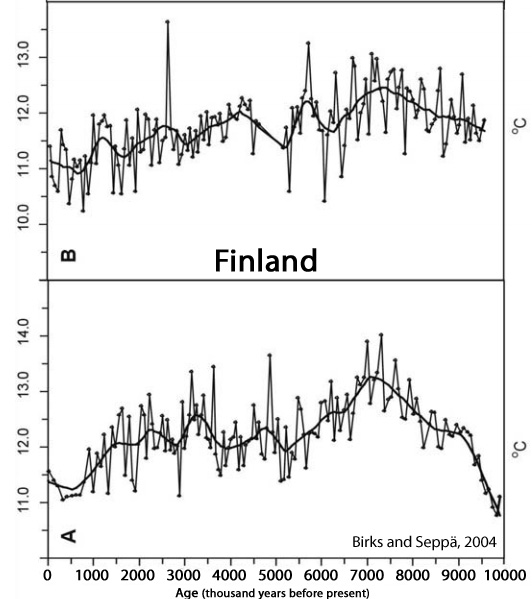
Birks and Seppä, 2004
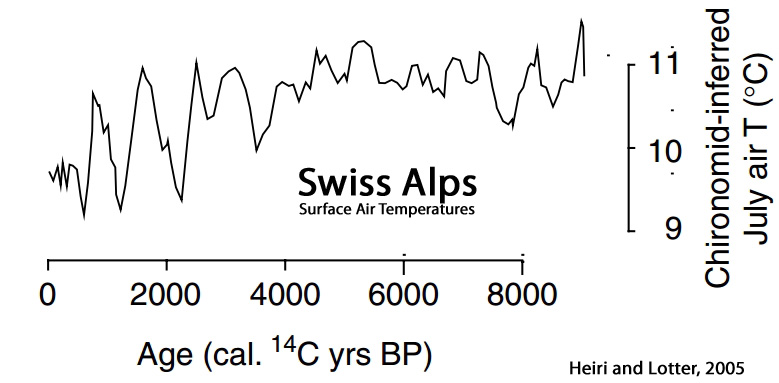
Heiri and Lotter, 2005
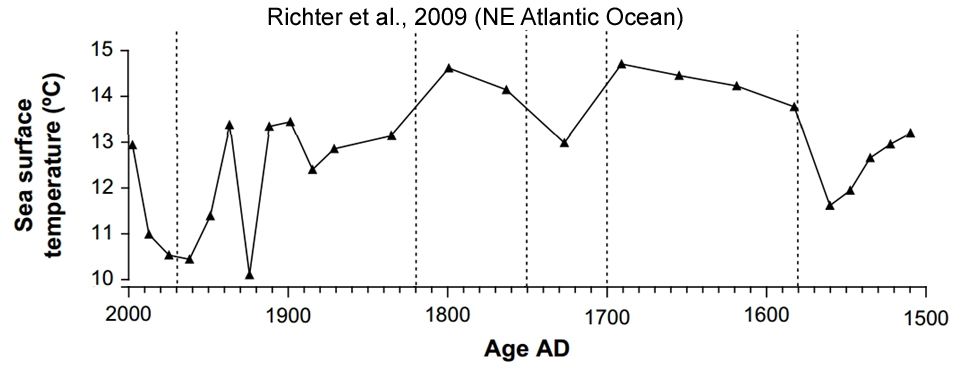
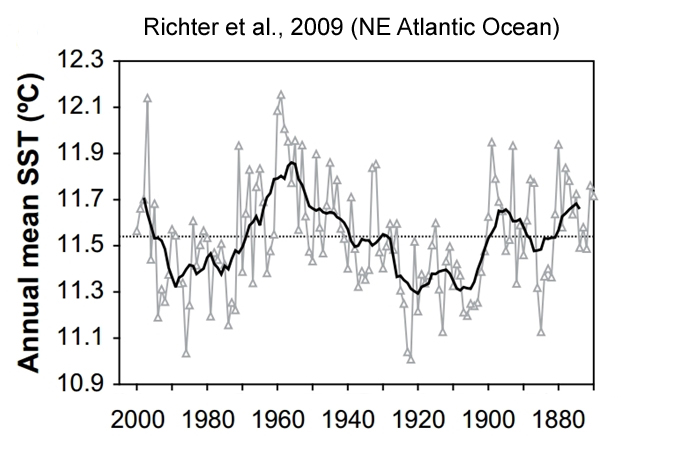
Richter et al., 2009
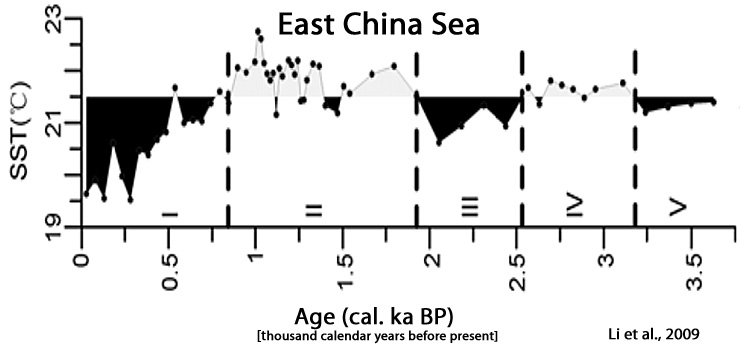
Li et al., 2009
“The highest temperature was 22.7°C which was recorded at 1.01 cal ka BP. … Cooling period from 0.85 cal. ka BP to present. SST declined obviously in this period, with the maximum decrease amplitude of 2℃. … No global climate warming due to the greenhouse effect since the Industrial Revolution occurs in the study area.”
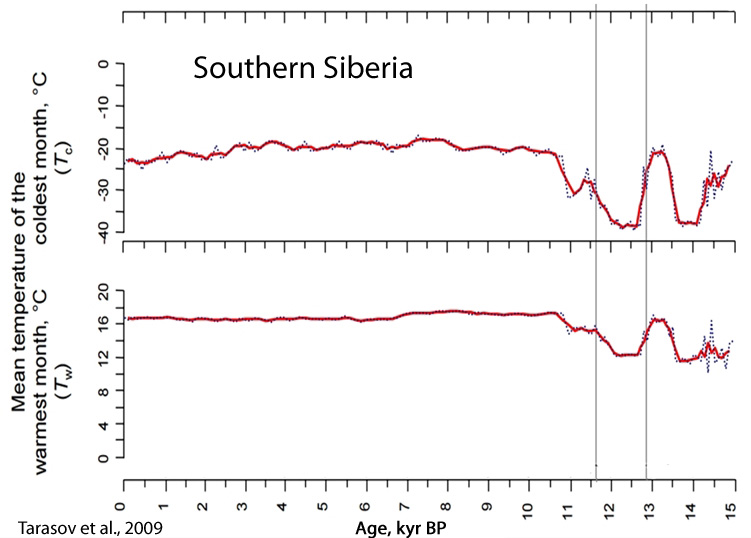
Tarasov et al., 2009
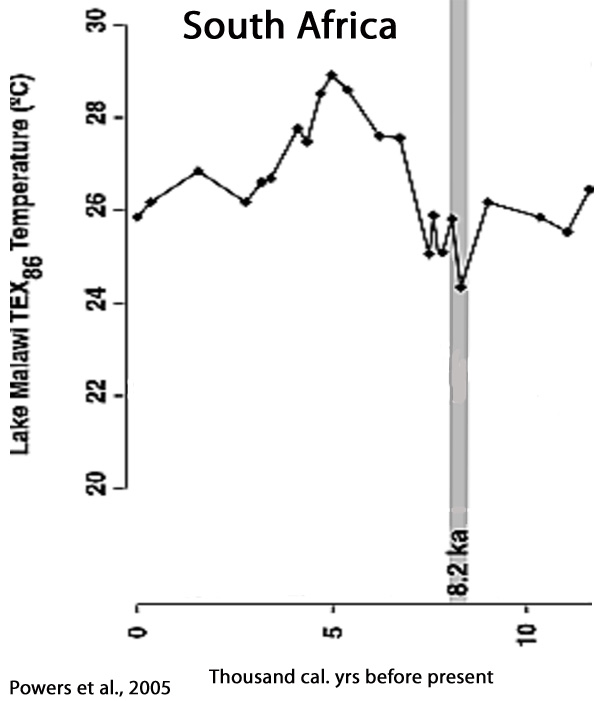
Powers et al., 2005
“… temperature reversals of ∼2°C during the Younger Dryas (12.5 ka BP) and at 8.2 ka BP.”
Millar et al., 2006
“The paleoclimate modeled for Whitewing [Sierra Nevada, CA] during the Medieval period was significantly warmer and slightly drier than present. Medieval mean annual minimum temperature was warmer than current by 3.2°C. with large differences in winter (+3.5°C, January) and summer (+4.0°C, July). Mean annual maximum temperature was also greater in the Medieval period (+2.3°C), with greater differences in winter (+3.2°C, January) than summer (+2.6°C, July). Annual precipitation was less by 24 mm.”

![]()
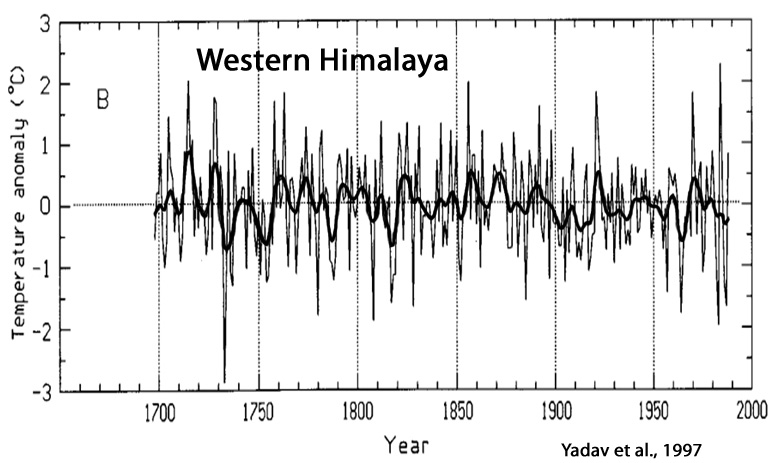
Yadav et al., 1997
“The most striking feature of the present reconstruction is the absence of any warming trend in the 20th century”
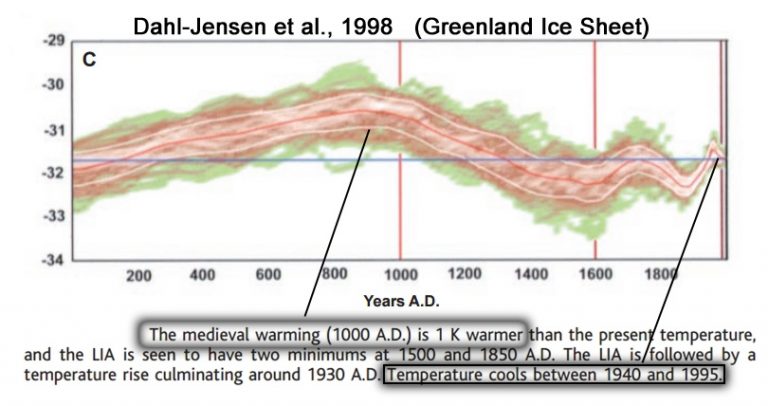
Dahl-Jensen et al., 1998
Scuderi, 1993
‘Long-term trends in the temperature reconstruction are indicative of a 125-year periodicity that may be linked to solar activity as reflected in radiocarbon and auroral records. The results indicate that both the warm intervals during the Medieval Warm Epoch (-A.D. 800 to 1200) and the cold intervals during the Little Ice Age (-A.D. 1200 to 1900) are closely associated with the 125-year [solar activity] period.”


Recent Comments