We are told the globe is rapidly and dangerously warming, and that this rapid and dangerous warming has been predominantly caused by the steep rise in anthropogenic CO2 emissions that began about the mid-1940s.
We even have a widely-recognized “hockey stick” graph of the Northern Hemisphere — created by Michael Mann in the late 1990s and popularized by the IPCC (2001) — to “prove” that modern warming has been synchronously global in scale, as well as rapid, dangerous, and perhaps even unprecedented (“the warmest on record”).
There is a problem with this paradigm, however. An enormous problem.
That is, when scientists reconstruct sea surface temperatures (SST) and land surface temperatures and deep ocean heat content from the paleoclimate record (hundreds to thousands of years ago) using existing physical proxy evidence, and when they use this same physical evidence to reconstruct the modern temperatures, the rapid and dangerous warming trend that mysteriously forms a hockey stick shape for recent decades seems to just . . . disappear. In its place is a modern record of temperatures from locations all over the world that does not even come close to resembling a rapidly warming, dangerous, and unprecedented hockey stick. Instead, the paleoclimate record reveals the opposite. Large regions of the Earth were significantly warmer than they are now for most of the last several thousand years.
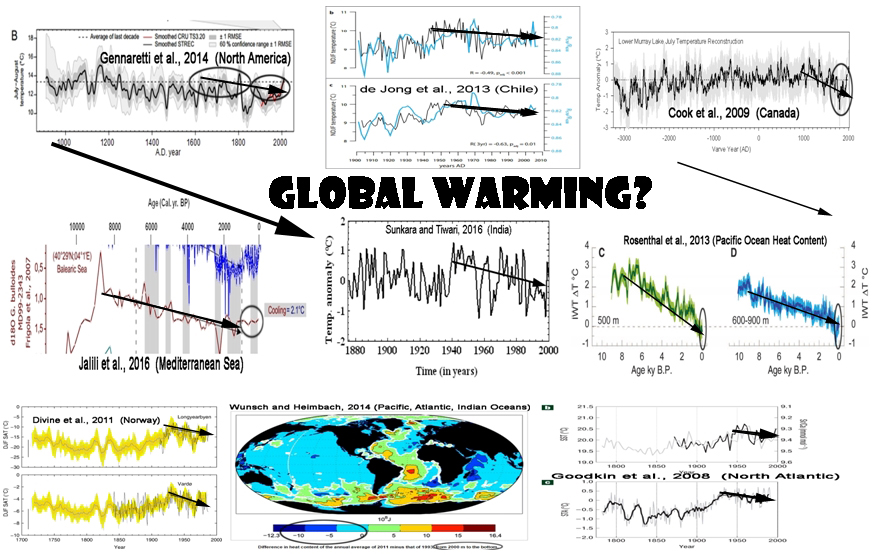
Below is a compilation of 50 temperature graphs from peer-reviewed scientific papers. Some graphs indicate that (a) post-1940s temperatures actually declined in many regions of the world rather than rose rapidly — the opposite of what climate models had predicted. All the graphs show that (b) modern (post-1940s) temperatures aren’t any warmer than the decades and centuries and millennia prior to the steep increase in anthropogenic CO2 emissions, and in some locations even the Little Ice Age temperatures (1400s to 1800s AD) were warmer than modern. Finally, these 50 graphs clearly show that (c) the conceptualization of global-scale warming, or a globally synchronous rise in temperatures for the vast majority of the Earth’s land and oceanic locations in modern times . . . is not scientifically supportable.
In many parts of the world, today’s temperatures are still among the coldest they’ve been in the last several thousand years. Sea levels, in turn, are at some of the lowest levels of the last 8,000 years; relative sea levels were 1 to 4 meters higher than they are now just a few thousand years ago. Where warming has occurred, it’s been modest and slight, not rapid and dangerous. Perhaps this is why the “hide the decline” phenomenon became so necessary for hockey stick-favoring reconstructionists.
————————————————————————————————————
Saenger et al, 2009 (Bahamas) (Northern Hemisphere)

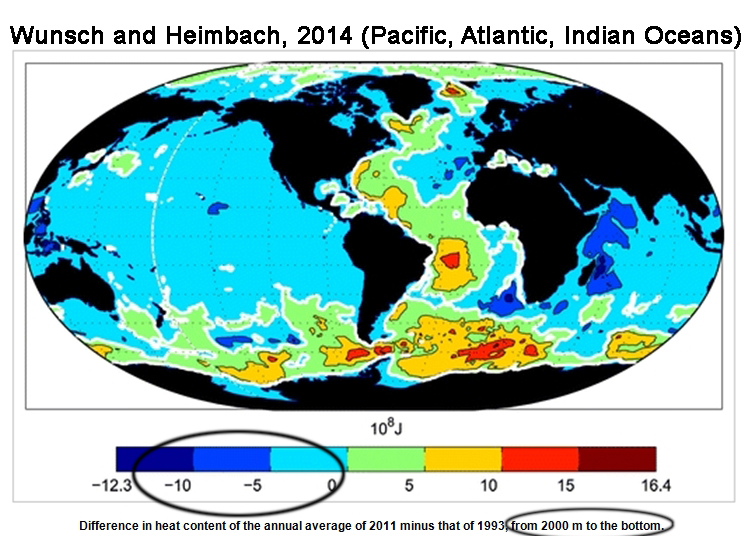
Wunsch and Heimbach, 2014 (Pacific, Atlantic, Indian Oceans)
Discussion: “A very weak long-term [1993-2011] cooling is seen over the bulk of the rest of the ocean below that depth [2000 m], including the entirety of the Pacific and Indian Oceans, along with the eastern Atlantic basin.”
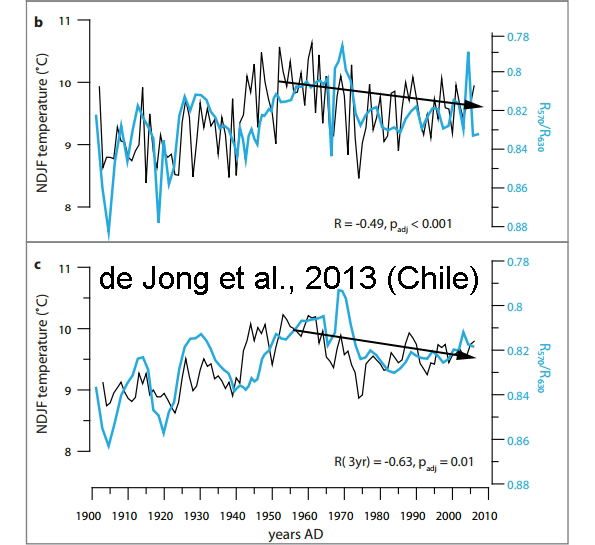
de Jong et al., 2013 (Chile)
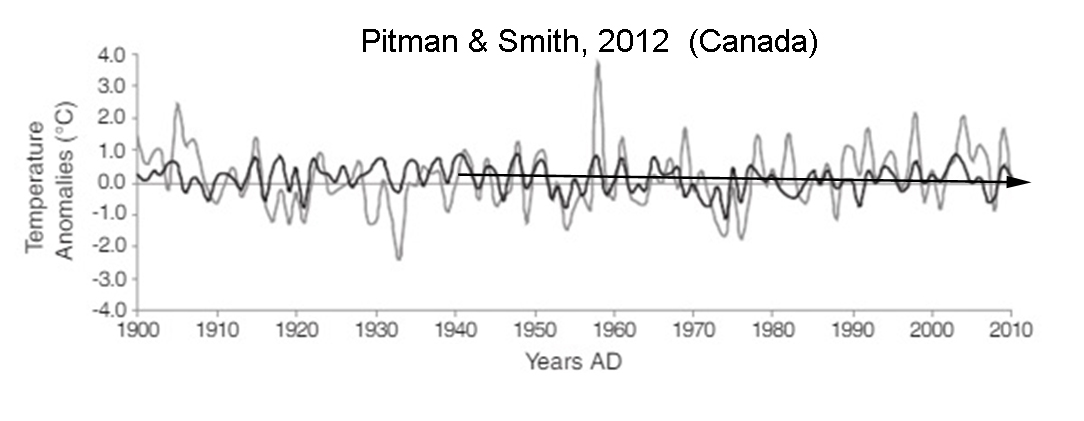
Pitman and Smith, 2012 (Canada)
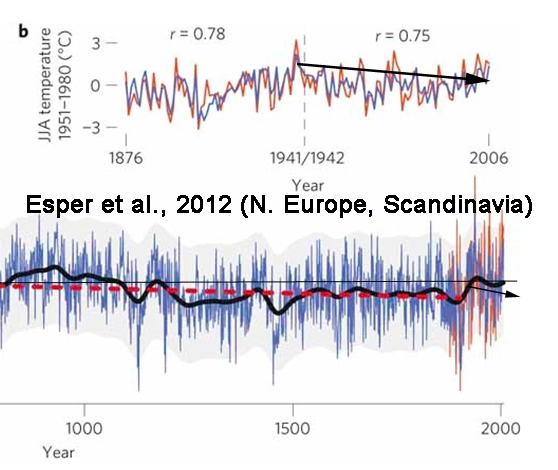
Esper et al., 2012 (Northern Europe, Scandinavia)
Divine et al, 2011 (Norway)

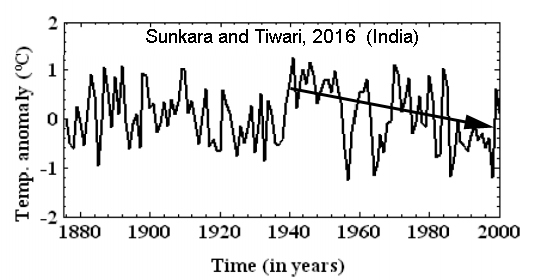
Sunkara and Tiwari, 2016 (India)
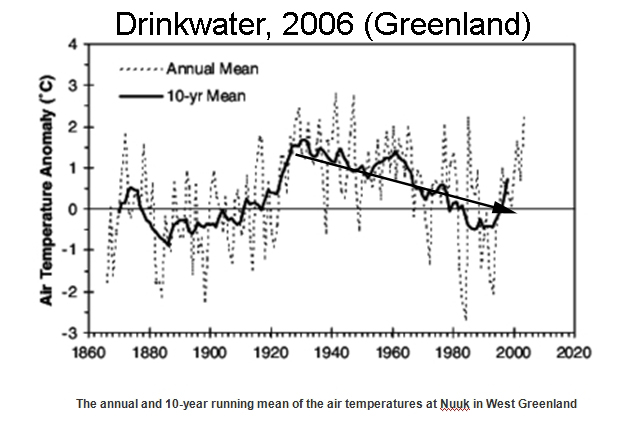
Drinkwater, 2006 (Greenland)
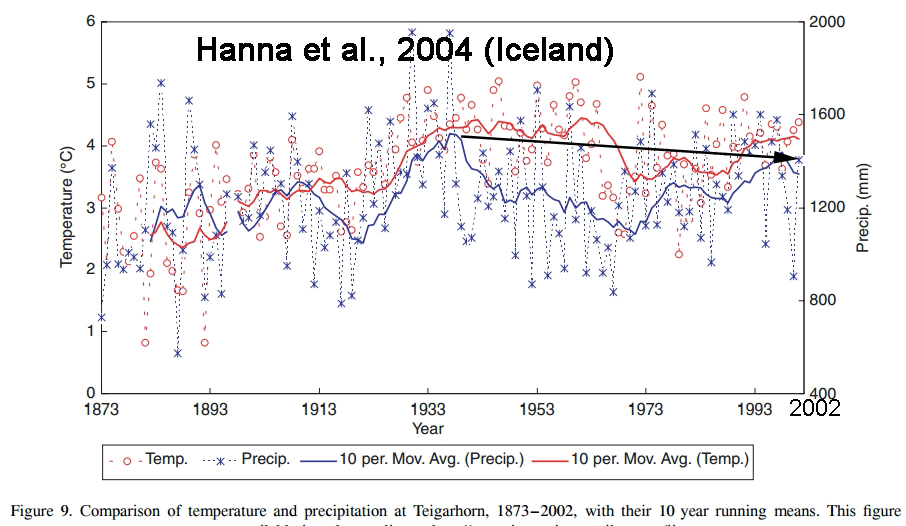
Hanna et al., 2004 (Iceland)
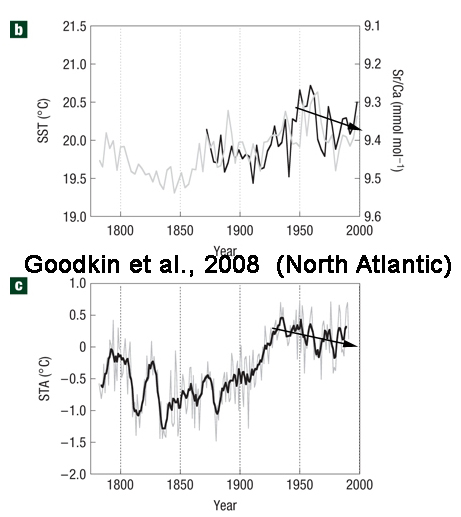
Goodkin et al., 2008 (North Atlantic)
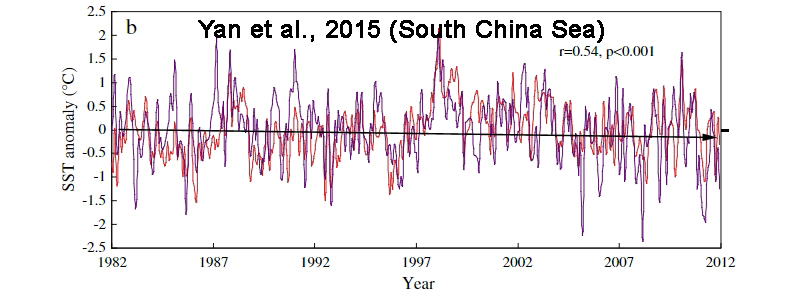
Yan et al., 2015 (South China Sea)
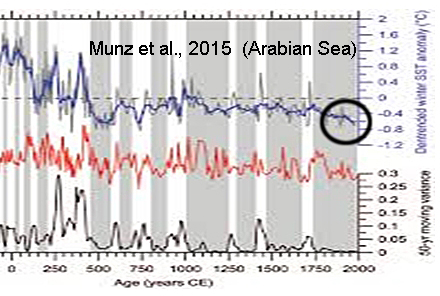
Munz et al., 2015 (Arabian Sea)
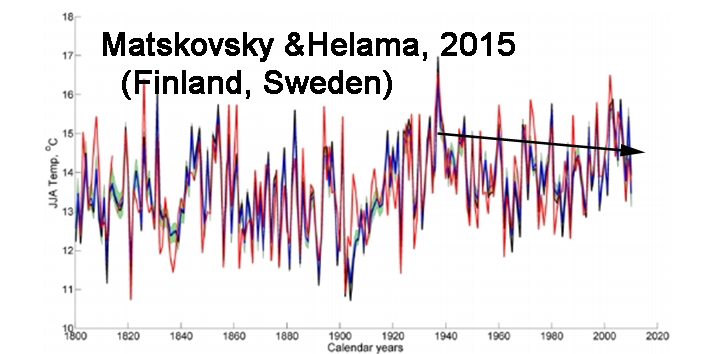
Matskovsky and Helama, 2015 (Finland, Sweden)
Cook et al., 2009 (Canada)

Gennaretti et al., 2014 (North America)

Incarbona et al., 2016 (Sicily, Aegean Sea)

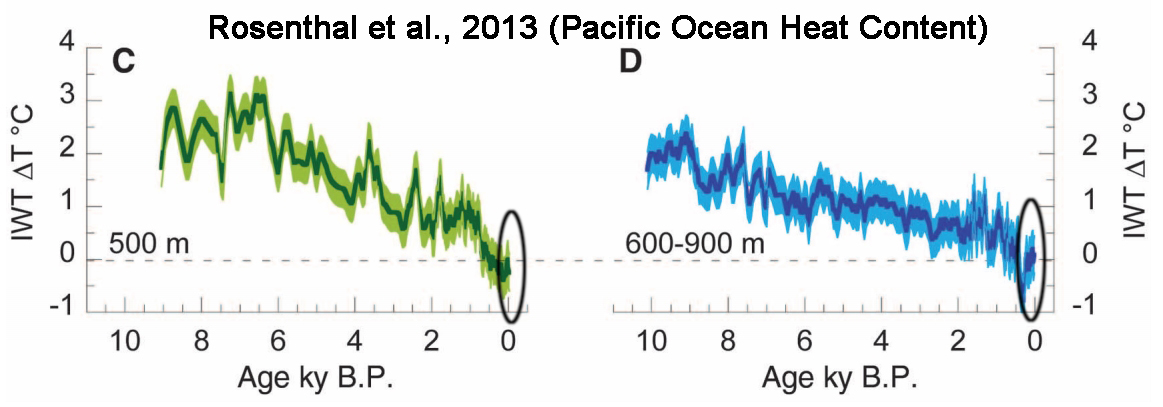
Rosenthal et al., 2013 (Pacific Ocean Heat Content)
“We show that water masses linked to North Pacific and Antarctic intermediate waters were warmer by 2.1°C and 1.5°C, respectively, during the middle Holocene Thermal Maximum than over the past century. Both water masses were ~0.9°C warmer during the Medieval Warm period than during the Little Ice Age and ~0.65° warmer than in recent decades.”
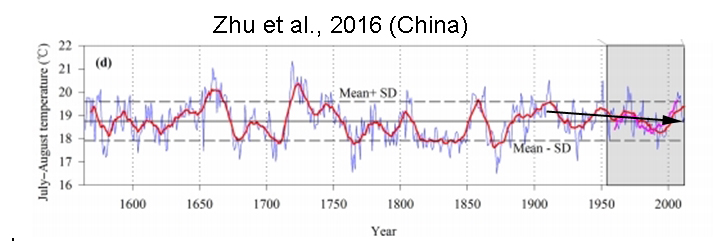
Zhu et al., 2016 (China)
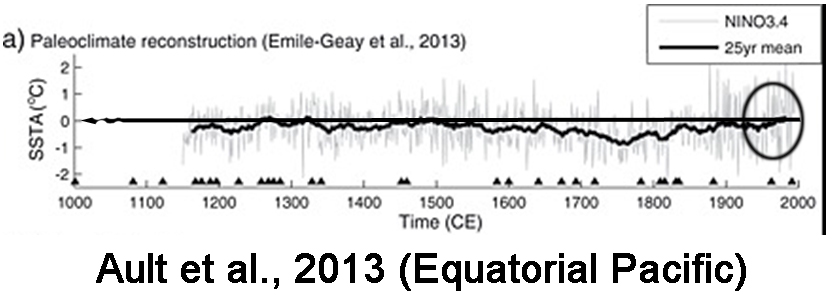
Ault et al., 2013 (Equatorial Pacific)
Hanhijärvi et al., 2013 (Arctic, North Atlantic)


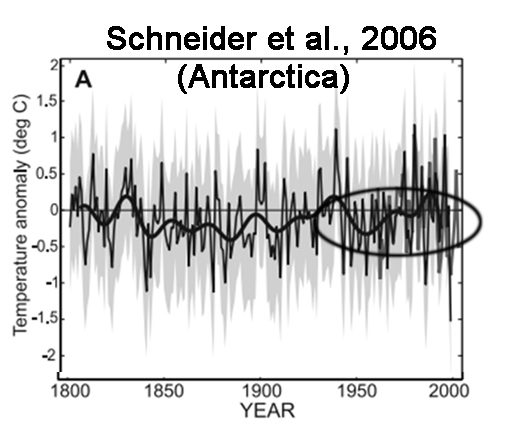
Schneider et al., 2006 (Antarctica)
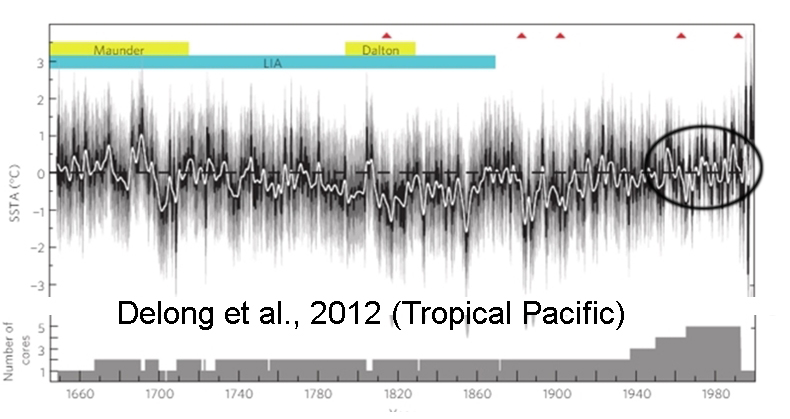
Delong et al., 2012 (Tropical Pacific)
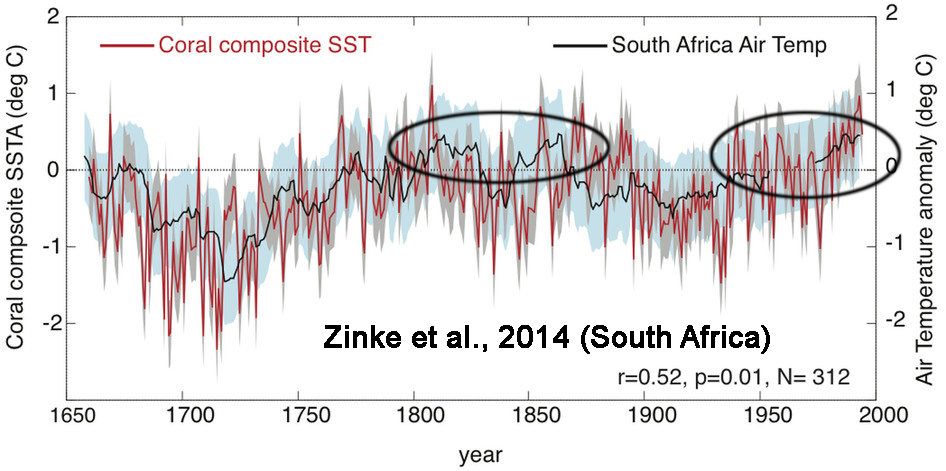
Zinke et al., 2014 (South Africa)
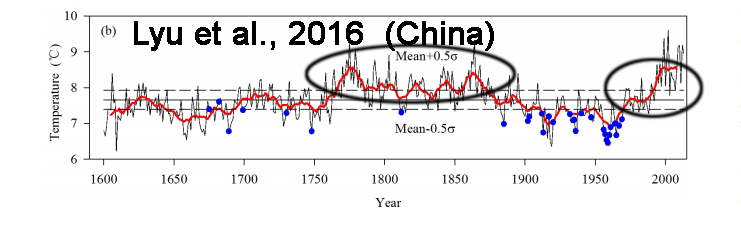
Lyu et al., 2016 (China)
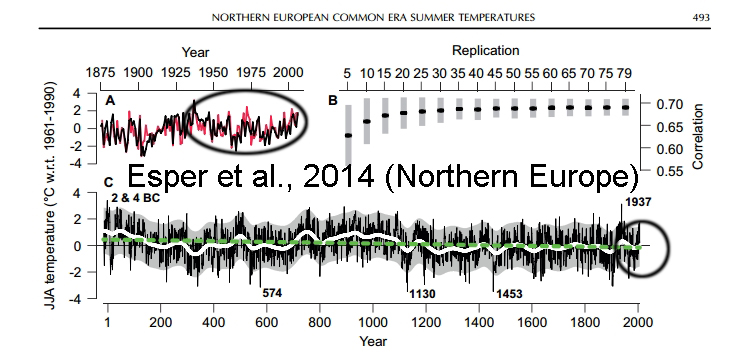
Esper et al., 2014 (Northern Europe)
Fudge et al., 2016 (Antarctica)

Grudd et al., 2002 (Sweden)

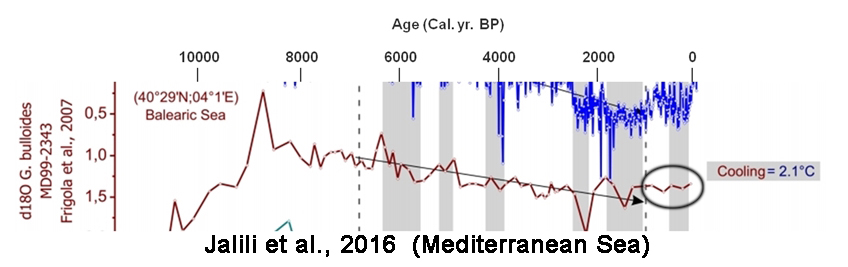
Jalili et al., 2016 (Mediterranean Sea)

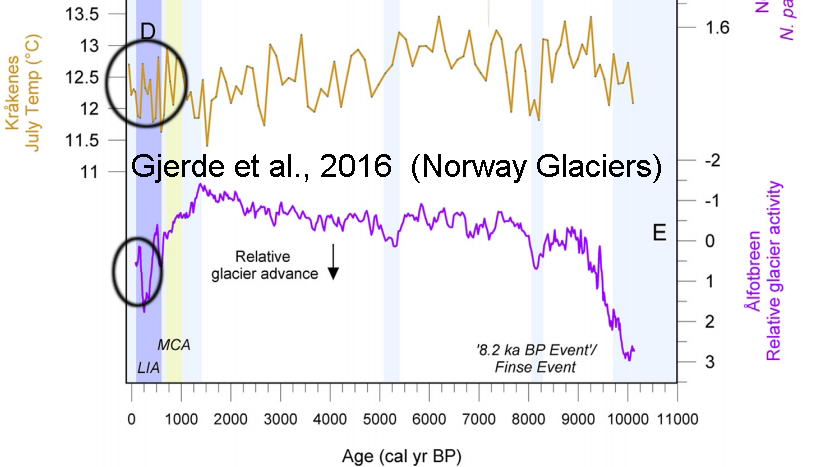
Gjerde et al., 2016 (Norway Glaciers)
Antinao and McDonald, 2013 (Tropical Pacific, California)

Rella and Uchida, 2014 (Antarctica)

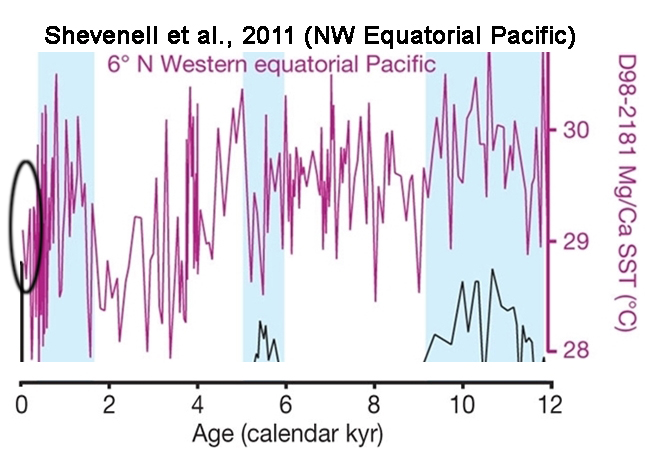
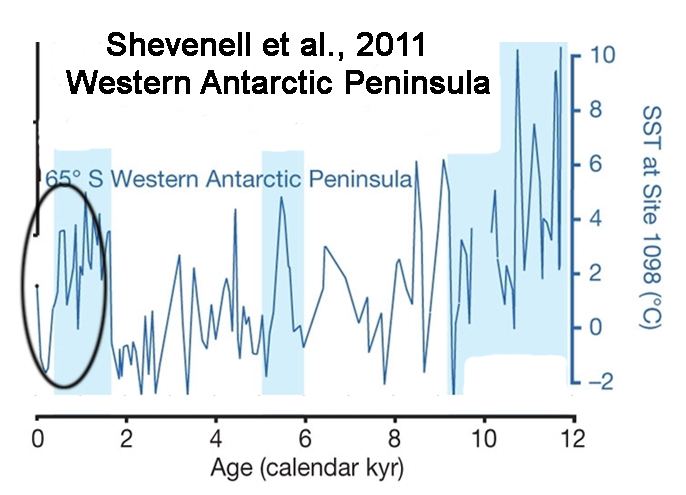
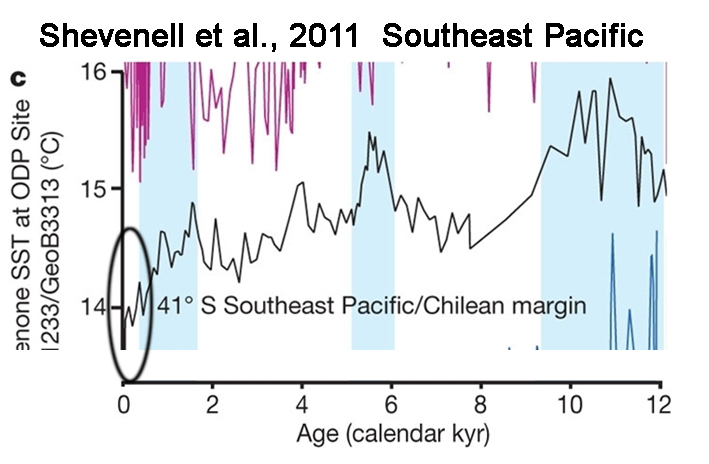
Shevenell et al., 2011 (NW Equatorial Pacific, W Antarctica, SE Pacific)
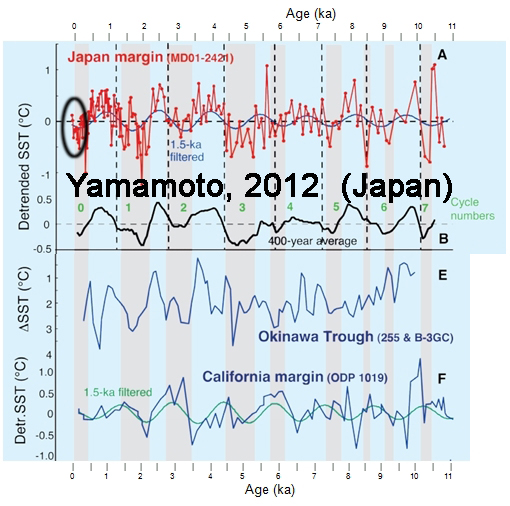
Yamamoto, 2012 (Japan)
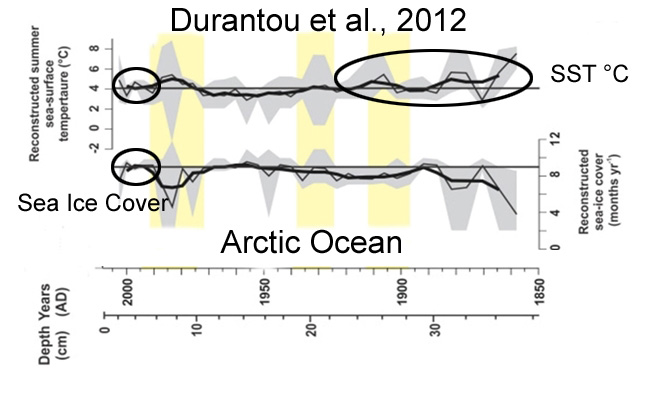
Durantou et al., 2012 (Arctic Ocean)
“Sea surface temperature [Arctic Ocean, Canada] between ∼ AD 1885–1935 are warmer by up to 3°C with respect to the average modern temperature at the coring site. For the period ∼ AD 1887–1945, reconstructed sea ice cover values are on average 8.3 months per year which is 1.1 months per year lower than the modern values.”
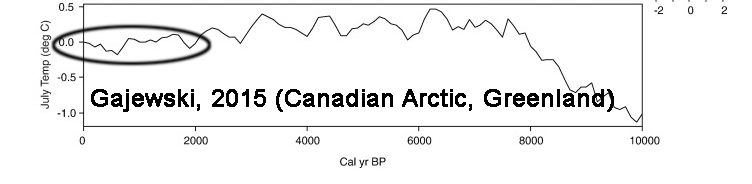
Gajewski, 2015 (Canadian Arctic, Greenland)
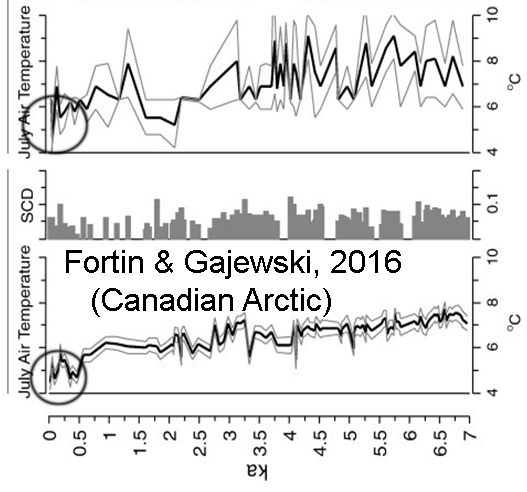
Fortin and Gajewski, 2016 (Canadian Arctic)
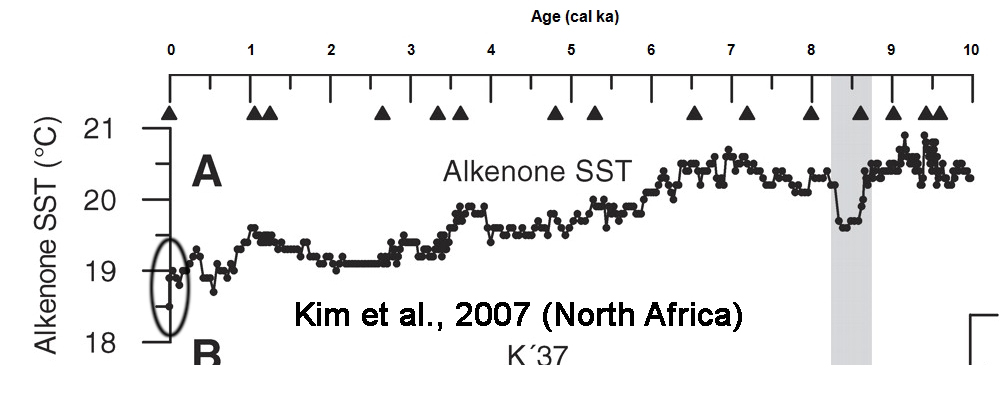
Kim et al., 2007 (North Africa)
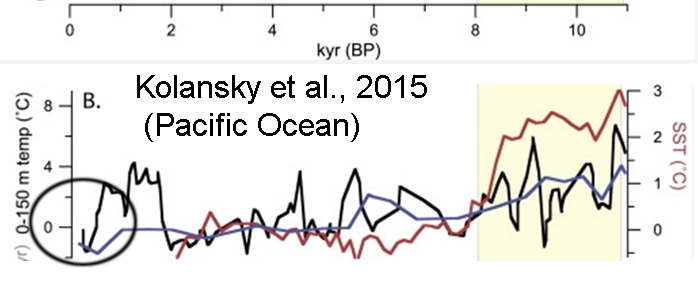
Kolansky et al., 2015 (Pacific Ocean)
Lamy et al., 2012 (Chile)

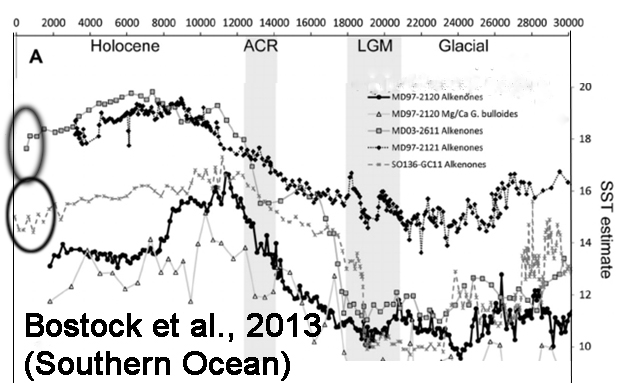
Bostock et al., 2013 (Southern Ocean)
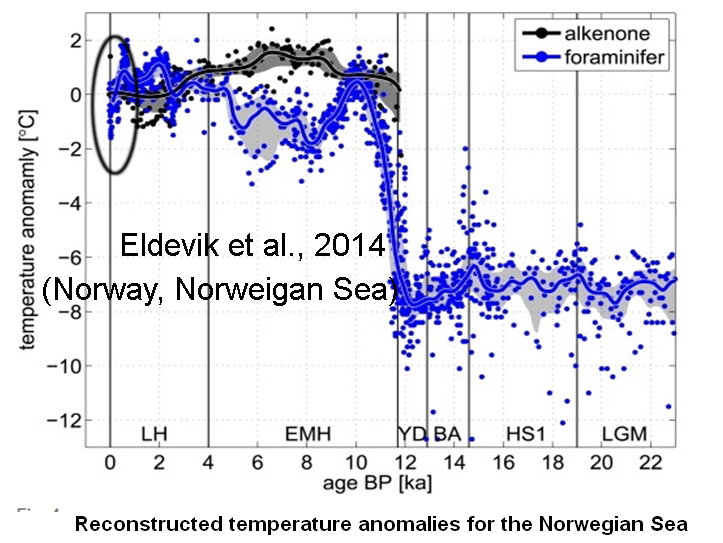
Eldevik et al., 2014 (Norway, Norweigan Sea)
“Through the LH [Late Holocene], ocean temperatures [North Atlantic, Nordic Seas] are comparable to the present, but up to 1 °C warmer”
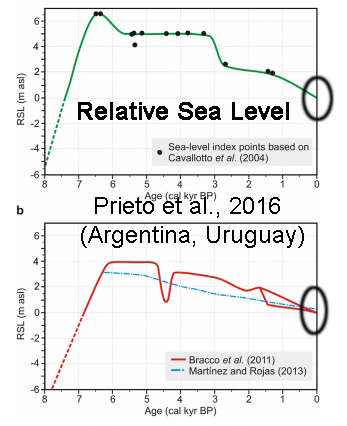
Prieto et al., 2016 (Argentina, Uruguay) Relative Sea Level
Dura et al., 2016 (Vancouver ) Relative Sea Level

Bracco et al., 2014 (Uruguay) Relative Sea Level

Kench et al., 2014 (central Pacific Ocean) Relative Sea Level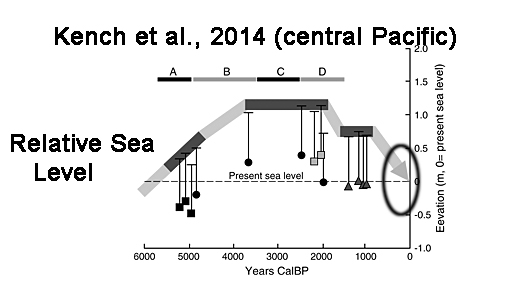


Excellent
Great job digging this up. These charts remind us just how much tampering has been taking place.
Pretty boring graphs. Quite benign really. Much like our climate for the last 30+ years I guess.
Here is my very own Climate “Hockey Stick” graph. I was inspired by the methodology used by MM.
https://eyesonbrowne.wordpress.com/2014/05/13/i-made-my-very-own-hockey-stick/
This is a forged Hockeystick. It is not from a real scientist! Real scientists always make the right end of the hockeystick point up!
But, you should call it “The Tasmanian Paradox” and write a very dry and boring paper presenting your findings. And apply for grants for further examination including computer simulations. Those are always great. Pocket the money, claim you worked for it, present some made up explanation that proves that the Tasmanian paradox is predicted by Warmunist Theory, say because of the shape of the mountain or something.
Thanks for the idea Dirk. I would if I was not so busy with my legitimate honest employment. Damn! Wish I was that creative!
I would like to tell you of my latest book, “Human Caused Global Warming”.
The Biggest Deception in History.
Available on ‘Amazon.ca’ and ‘Indigo/Chapters’.
Trial date for Dr Michael Mann vs Dr Tim Ball, February 20th, 2017.
http://www.drtimball.com
Global Warming so bad that glaciers are calving now, documents environmentalist and frequent flier Leo di Caprio in film with wind turbine subsidy tycoon Pope.
http://www.dailymail.co.uk/tvshowbiz/article-3810251/Leonardo-DiCaprio-s-environmental-documentary-Flood-features-President-Obama-Pope-Francis-new-trailer.html
Should be (Sicily and Aegean Sea), not (Sicily, Aegean Sea)
Sicily has nothing to do with Aegean Sea it is between Ionian/Tyrrhenian Sea.
Off Topic but not really
All of South Australia is WITHOUT POWER
http://www.9news.com.au/national/2016/09/28/05/40/south-australia-braces-for-one-of-the-most-extreme-weather-systems-in-decades
“The outage occurred when the network was disconnected from Victoria”
That’s what happens when you depend on long HV links for your power, rather than having your own generation capability.
“It’s a very significant event for South Australia. It’s very rare”
And likely to become LESS rare…
Well, not sure about the Victorian connector “disconnect”. That may just be conjecture. However, the mere fact that a single storm, albeit quite severe, could shut down the ENTIRE state(except K.I.)power grid, says something about the incompetence of our state governing body to ensure our safety and security. Energy policy built around the sell off of our state owned electricity utilities, and the ridiculous obsession with wind and sola has created, “the perfect storm” for this type of event. Way to go Pollies.
OOPS!
This must just be one of those “hiccups” in the new technology sod has assured us will pass, as soon as they have sufficient flywheel or something. OK, maybe less a “hiccup” than a seizure, but whatever…
In the meantime, maybe they can contract with El Heiro for the vast excess of power they always are producing now. Just need a little undersea power cable – not big deal. I’m sure the folks who installed the Bard1 offshore wind park can lend an assist.
[…] But we can AVERT the expected electro-volcanic glacial! https://notrickszone.com/2016/09/27/hide-the-decline-unveiled-50-non-hockey-stick-graphs-quash-modern…/ […]
[…] See more at: notrickszone.com […]
[…] a compilation of over 50 temperature graphs from peer-reviewed scientific papers revealed that large regions of the Earth have not been warming in recent decades, and that modern temperatures are still some of the coldest of the last 10,000 years. Apparently […]