According to scientists de Freitas, Dedekind, and Brill (2015), removing “contaminated data” from New Zealand’s nation-wide temperature record — and using updated measurement techniques rather than error-ridden outdated ones — reduces the long-term (1909 to 2009) New Zealand warming trend from today’s +0.91°C to +0.28°C, a 325% change.
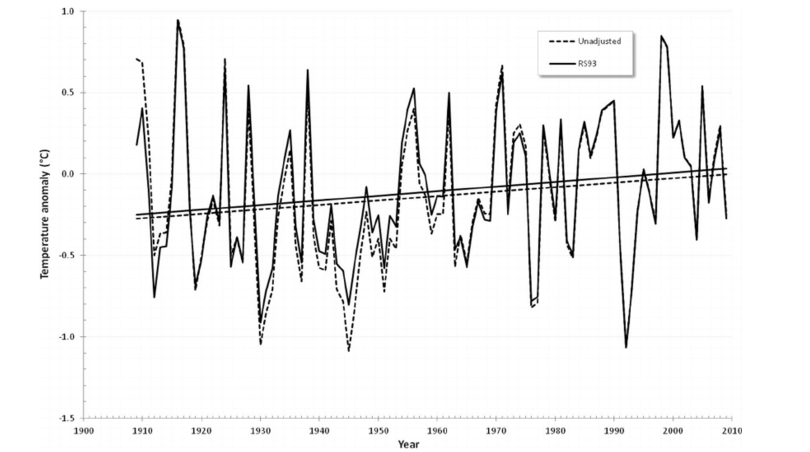
New Zealand’s national record for the period 1909 to 2009 is analysed and the data homogenized. Current New Zealand century-long climatology based on 1981 methods produces a trend of 0.91 °C per century. Our analysis, which uses updated measurement techniques and corrects for shelter-contaminated data, produces a trend of 0.28 °C per century.
Here is what 0.28°C of warming over the course of 100 years looks like:
From the internals of the paper, however, we find that the national average temperature for New Zealand was 13.1 °C in the late 1860s (10-year average), but by 2010, New Zealand’s average temperature had declined to 12.74 °C (30-year average). The overall temperature average for the 1860s to present (150 years) remained stable at 12.6°C. In other words, there has effectively been no change in New Zealand average surface temperatures in the last 150 years.
New Zealand was one of the first countries in the Southern Hemisphere to establish an official nationwide system of weather records. These records provide a rare long time series for temperatures in the Pacific Ocean, informing the data sparse interpolations required for early temperature series. Extant 1868 archives record the national normal mean surface temperature at 13.1 °C (when converted from degrees Fahrenheit) being the average of 10+ years read at six representative weather stations. Another major compilation, covering 35 years and based on nine stations, was published by the Dominion Meteorologist in 1920, which showed that the country’s average temperature has remained remarkably stable since records began. In 2010, the National Institute for Water and Atmospheric Research (NIWA) assessed the current national normal at 12.74 °C being the average of 30 years read at seven stations.
On the face of it, New Zealand’s long-term mean temperature has remained relatively stable at 12.6 °C over the past 150 years.
Here’s what the 1860s mean temperatures look like compared to the 1909-2009 period, with the latter trend line removed:

Getting back to the contamination that has artificially amplified temperatures by 325%, the authors continue their analysis by pointing out that the non-climatic +0.91°C per century trend in use today (and obviously preferred by those who wish to portray modern warming as dangerous and unprecedented) was obtained by using temperature-measuring techniques from a 1980 paper (Salinger, 1980, herein dubbed “S81”) that conducted no checks for sheltering (which has been found to artificially warm daily maximum temperatures by 1°C over a 6-year period) or the Urban Heat Island effect (which demonstrably and artificially warms up temperatures in cities and on airport sites relative to rural stations). The authors replace S81 with a superior statistical method for more accurate climatic temperature measurement gleaned from a 1993 paper authored by Rhoades and Salinger (hereafter, “RS93”). RS93 was concerned with “the detection and elimination of temperature data movements that are of non-meteorological origin,” advising that “for studies of climate change, it is best to choose stations that are unlikely to be affected by gradual changes in shading or urbanisation.” By utilizing these checks on artificial or non-climatic warming, de Freitas et al. (2015) conclude that “no ‘important’ change in mean temperature occurred over the period 1909–2009 once the known contamination is corrected.”
de Freitas et al., 2014, continued:
(a) We will hereafter use the term “S81” to refer to the published 1980 paper [Salinas, 1980] in conjunction with the unpublished thesis elaborations. Notably, S81 had conducted no tests for “creeping” inhomogeneities such as sheltering or UHI and consequently made no attempt to correct the 7SS [New Zealand temperature record “Seven Station Series”] for site effects*
(b) McAneney et al. [1990] found that sheltering by nearby trees can increase daily maximum temperatures by 1 °C per 10 m of shelter growth over a 6-year period. After examining a range of New Zealand stations, [Hessell, 1980] determined that two of the stations used in the 7SS were climatically unrepresentative and assessed them “to increased sheltering from trees … and/or significant urbanisation and/or screen changes”. The sites are Albert Park in Auckland and Kelburn in Wellington. These sites, within the central business districts of two of New Zealand’s largest form the major portion of the Auckland and Wellington temperature series.
(c) Hessell [1980] also finds a strong temperature trend bias in the data “unlikely to be due to a broad scale climatic effect”. A 12-year comparison suggested that Albert Park had warmed 0.6 °C more than a rural counterpart 10 km distant.
(d) The two rural stations (Hokitika and Lincoln) show average warming of 0.2 °C/century in contrast to the 0.32 °C/century of the five city stations. A concern … is that all seven datasets have not yet been thoroughly screened for possible UHI effects or other undocumented changes.
(e) From 1976, Auckland data are drawn from the Mangere treatment plant, sited amongst newly commissioned settling ponds (Fig. 2). In 1998, the site moved a short distance to Auckland Aero, the country’s principal international/domestic airport. Apparent warming trends in the dataset for Auckland Aero (southwest of Auckland) were de-trended by reference to two other less urban airports on the metropolitan fringes, namely, Whenuapai (27 km to the northwest) and Ardmore (17 km to the southeast). The station histories for these two stations reveal no significant site changes during1976–2009, and screening disclosed no abrupt shifts. For the period 1962–1993, Auckland Aero [urban, airport] warmed 0.96 °C/century faster than Whenuapai [rural], and over 1969–2011 it warmed 0.97 °C/century faster than [rural] Ardmore (Table 2). The Mangere station was compared with the same two airports and showed a similar relative warming, implying that the overall Mangere region was greatly affected by UHI, as the population grew by 1,200 % from 15,700 in 1957 to 190,000 in 1981.
(f) In 1993, in collaboration with a statistician D. A. Rhoades, Salinger published “Adjustment of Temperature and Rainfall Records for Site Changes” or RS93. This paper was accepted locally as a seminal authority for the statistical techniques to be used in measuring differences between the temperatures of compared stations. … [I]n every case the S81 station adjustments greatly increased the individual trends, while the RS93 method resulted in equal numbers of increases and decreases. As noted previously, S81 did not account for gradual effects such as sheltering or UHI.
(g) By making adjustments which are not statistically significant, S81 may have allowed too many “false positives” to occur. In addition, using long comparison time periods may have allowed creeping inhomogeneities and undocumented shifts at reference sites to skew the individual adjustments.
(h) Hessell [1980] examined apparent continuous warming over New Zealand since 1930 but concluded: “… no important change in annual mean temperature since 1930 has been found in stations where these factors [changes in shelter, screenage, and/or urbanization] are negligible.”
(i) Our study similarly concludes that no “important” change in mean temperature occurred over the period 1909–2009 once the known contamination is corrected.
A few days ago, a compilation of over 50 temperature graphs from peer-reviewed scientific papers revealed that large regions of the Earth have not been warming in recent decades, and that modern temperatures are still some of the coldest of the last 10,000 years. Apparently the nation of New Zealand can now be added to this list as a region where no significant changes in temperature have taken place within the last 150 years.


Good one
Planet-Saving Green Eco Warrior against Global Warming flies around world multiple times, films himself in the process, to raise awareness about CO2 emissions.
http://www.breitbart.com/big-hollywood/2016/09/28/watch-dicaprio-fights-climate-change-flood-trailer/
Doesn’t surprise me that temps have changed slowly. New Zealand is a long relatively narrow country so climate is heavily moderated by sea temperatures. Sea temps have risen only slowly, so coastal temps (most of NZ) should be similar.
German Greens demand abolition of internal combustion engine in 2030, claim that German industry missed the boat, while USA and China lead development of electric cars.
http://www.mmnews.de/index.php/wirtschaft/84462-gruene-autos-verbot
The German Greens obviously never saw this – just as one example:
https://en.wikipedia.org/wiki/BMW_i3
Just like with power generation, we see that they just do not know anything. They have never worked a job. And never will. They wouldn’t even know what to look for in Google.
[…] Richard has just posted an article on the de Freitas et al. paper at NoTricksZone – h/t Maggy Wassilieff. He describes the paper […]
I suspect that Australia gets most of its OMG-its-warming trend simply by refusing to deal with the measurements made prior to 1910, the excuse being that some places did not adopt Stevenson screens until then. True scientists would surely make an effort to deal with that problem, but the BoM simply refuse. I wonder why.