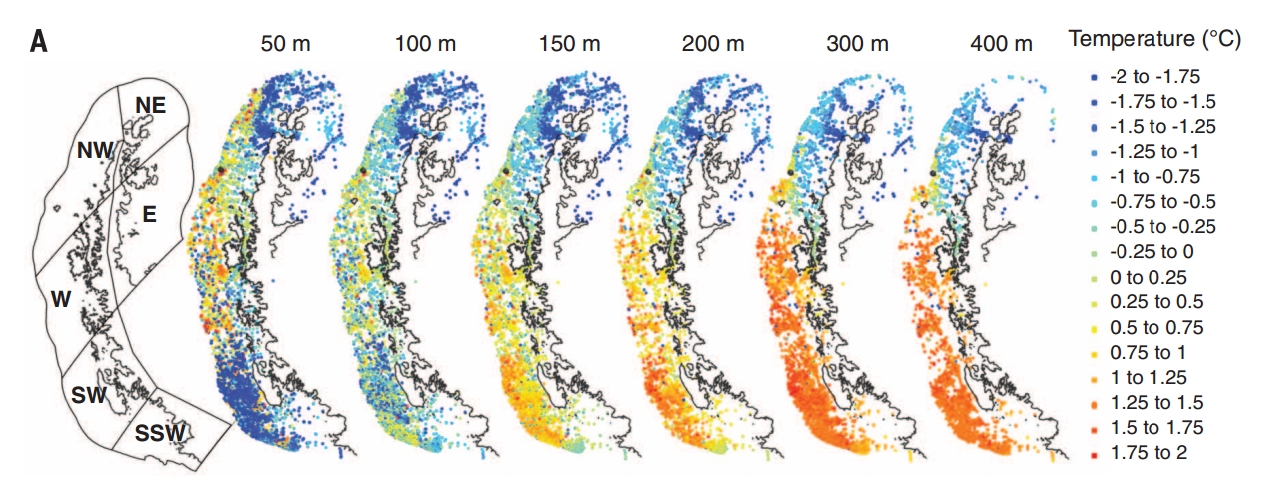
According to a recently published paper in the journal Science, (Cook et al., 2016, “Ocean forcing of glacier retreat in the western Antarctic Peninsula”), between 1945 and 2009 the mean ocean temperature warmed at depths of 150 to 400 meters for about 3/4ths of the waters surrounding the western Antarctic Peninsula (AP). The other 1/4th of the ocean waters at those depths (150 to 400 m) cooled (by -1°C ) during those 65 years.

As the authors point out, and as the graph above shows, in the areas where the waters warmed (light red shaded), glacier retreat was observed to be most pronounced (blood red points). In the regions (Bransfield Strait) where the ocean waters cooled (blue shaded), glaciers were in balance and even advanced (blue points). Citing this strong correlation between regional ocean warming/cooling and regional glacier retreat/advance, the authors concluded that the long-held assumption that atmospheric and surface warming (presumably driven by greenhouse gases) was what primarily caused Antarctic glaciers to recede is not supported by the evidence. Instead, it is the temperature of the ocean waters that “have been the predominant control on multidecadal glacier front behavior in the western AP.”
“Here, we identify a strong correspondence between mid-depth ocean temperatures and glacier-front changes along the ~1000-kilometer western coastline. In the south, glaciers that terminate in warm Circumpolar Deep Water have undergone considerable retreat, whereas those in the far northwest, which terminate in cooler waters, have not. Furthermore, a mid-ocean warming since the 1990s in the south is coincident with widespread acceleration of glacier retreat. We conclude that changes in ocean-induced melting are the primary cause of retreat for glaciers in this region. … [S]everal recent studies of Arctic glaciers have concluded that calving rates are strongly dependent on ocean temperatures. Until now, the role of the ocean (as opposed to the atmosphere) as the dominant driver of glacier frontal retreat on the western AP has not been considered…. We conclude that ocean temperatures below 100-m depth have been the predominant control on multidecadal glacier front behavior in the western AP.”
It should be pointed out that the decadal-scale changes in the heat content of the layers of abyssal vs. surface Southern Ocean are entirely consistent with what is expected with natural variability. As scientists Latif et al. (2013) explain:
“During phases of deep convection the surface Southern Ocean warms, the abyssal Southern Ocean cools, Antarctic sea ice extent retreats, and the low-level atmospheric circulation over the Southern Ocean weakens. After the halt of deep convection, the surface Southern Ocean cools, the abyssal Southern Ocean warms, Antarctic sea ice expands, and the low-level atmospheric circulation over the Southern Ocean intensifies, consistent with what has been observed during the recent decades.”
Referencing these natural heat changes and their climatic consequences, the ocean depth where there has been significant warming in the region of the AP in recent decades is primarily confined to the 150 to 400 m layer as identified by Cook et al. (2016). As the below graph from the paper shows, not only did the northern section of the 0-400 m layer not warm (as shown in the green/blue coloration areas), most of the 0-100 m layer for the AP region did not warm either. So the ocean warming for the AP has been primarily confined to the bottom half to three-quarters of the region, and only in the 150 to 400 m layer, not the 0-100 m layer, where it has been too cold to melt ice.
This lack of warming – and, in fact, cooling – in large sections of the oceanic and land-based Antarctic Peninsula region has been documented in other scientific studies. For example, Turner et al. (2016), in their paper entitled, “Absence of 21st century warming on Antarctic Peninsula consistent with natural variability,” have documented that the surface temperatures for the Antarctic Peninsula – which are often attributed to greenhouse gas forcing – have not warmed overall since the late 1970s, and in fact they’ve undergone a significant cooling trend for the last 1 1/2 decades.
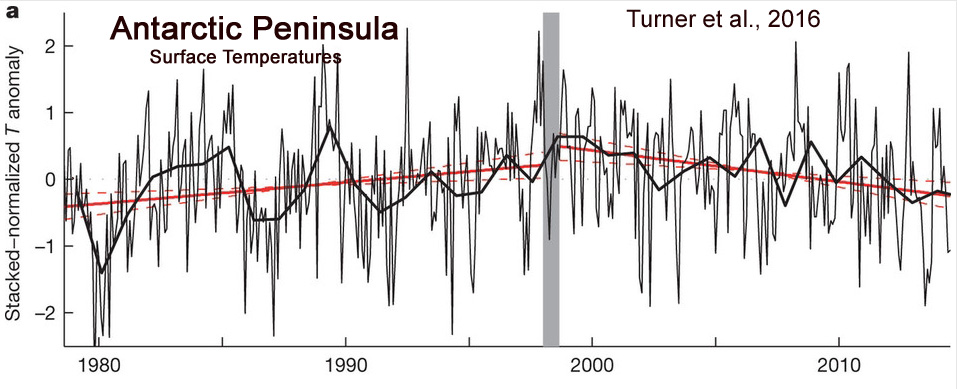
“Here we use a stacked temperature record to show an absence of regional [Antarctic Peninsula] warming since the late 1990s. The annual mean temperature has decreased at a statistically significant rate, with the most rapid cooling during the Austral summer.”
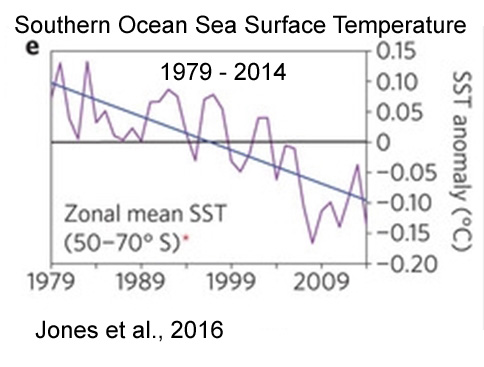
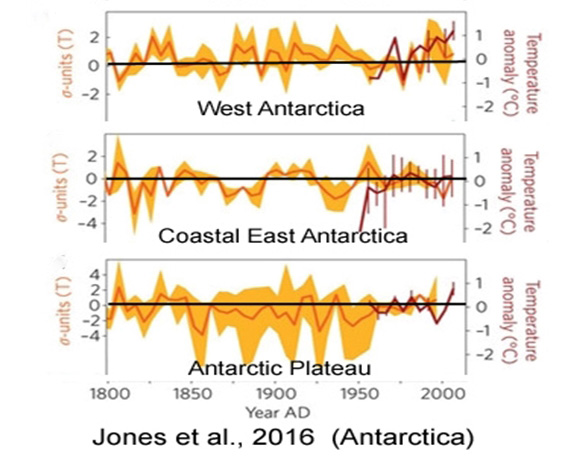
Furthermore, Jones et al. (2016) have found that surfaces temperatures for the Southern Ocean – which surrounds the entire Antarctic continent – have dropped significantly since the late 1970s, as they show in the graph from their paper.
Of course, as the ocean surface near Antarctica has continued to cool for going on 4 decades now, this has led to a significant net growth in the overall sea ice area surrounding Anarctica, as also documented by Jones et al. (2016).
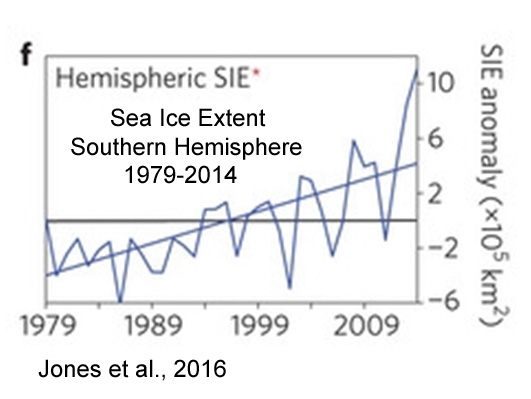
As further evidence that Antarctica as a whole has not been cooperating with climate models and the assumption that carbon dioxide is a significant determinant of glacier, sea ice, and temperature variability, Jones et al. (2016) conclude by saying that “climate model simulations that include anthropogenic forcing are not compatible with the observed trends” and that “natural variability overwhelms the forced response in the observations.”
“Over the 36-year satellite era, significant linear trends in annual mean sea-ice extent, surface temperature and sea-level pressure are superimposed on large interannual to decadal variability. Most observed trends, however, are not unusual when compared with Antarctic palaeoclimate records of the past two centuries.
“[C]limate model simulations that include anthropogenic forcing are not compatible with the observed trends. This suggests that natural variability overwhelms the forced response in the observations, but the models may not fully represent this natural variability or may overestimate the magnitude of the forced response.”
There are even graphs from the Jones et al. (2016) paper that show that West Antarctica, coastal East Antarctica, and the Antarctic Plateau have not undergone an obvious warming trend in the last 200+ years.
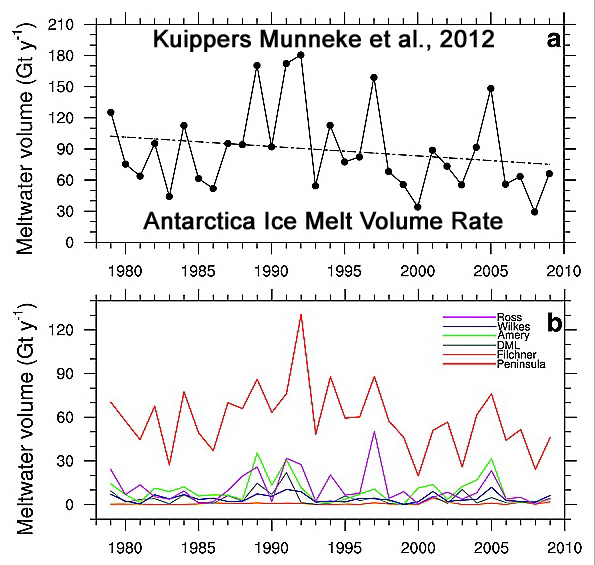
In fact, other recent studies also indicate that not only the AP, but the entire Antarctic continent’s temperatures have been stable to cooling slightly since the 1970s, and that, contrary to climate modeling, glaciers have been advancing more than they’ve been receding, or that ice melt volume has been declining (ice is melting less, not more) since the 1970s.
For example, like Cook et al. (2016) cited above, Kuippers Munneke et al. (2012) also conclude that atmospheric or surface warming (due to greenhouse gases, presumably) is not controlling glacier melt, but instead “a picture emerges in which the ultimate fate of ice shelves is governed by oceanic forcing from below“.
“None of the regions in Antarctica show a statistically significant trend in melt volume over the period 1979–2010. … Of the four Antarctic Peninsula stations that have an air temperature record for 1979–2010, only Faraday exhibits a statistically significant warming trend in summer temperature for that period. A reconstruction of [Antarctica] near-surface temperature….leaves DJF [December-February] temperature trends for 1979–2010 insignificant over nearly the entire continent, and mostly suggests statistically insignificant cooling along the coastal margins. This finding also seems consistent with RACMO2 DJF near surface temperatures, which show no statistically significant trends for 1979–2010 in any of the areas that experience melt. … A picture emerges in which the ultimate fate of ice shelves is governed by oceanic forcing from below.”
For East Antarctica, not only have surface temperatures been cooling since the early 1960s, a significant majority of glaciers have been advancing, not retreating, since about 1990.
“Here we present multidecadal trends in the terminus position of 175 ocean-terminating outlet glaciers along 5,400 kilometres of the margin of the East Antarctic ice sheet, and reveal widespread and synchronous changes. Despite large fluctuations between glaciers—linked to their size—three epochal patterns emerged: 63 per cent of glaciers retreated from 1974 to 1990, 72 per cent advanced from 1990 to 2000, and 58 per cent advanced from 2000 to 2010.”

Of course, none of these observed non-warming, glacier-advancing trends for Antarctica are compatible with assumptions about anthropogenic forcing, or the increase in CO2 emissions. In fact, scientists have even found that increasing CO2 concentrations has a net cooling effect, not a net warming effect, on central Antarctica.
“For this region [central Antarctica], the emission to space is higher than the surface emission; and the greenhouse effect of CO2 is around zero or even negative, which has not been discussed so far. We investigated this in detail and show that for central Antarctica an increase in CO2 concentration leads to an increased long-wave energy loss to space, which cools the Earth-atmosphere system. For most of the Antarctic Plateau, GHE-TES [greenhouse effect as measured by the Tropospheric Emission Spectrometer] is close to zero or even slightly negative; i.e., the presence of CO2 increases radiative cooling.”
So instead of an anthropogenic influence on trends in Antarctica, scientists are increasingly publishing papers documenting that the Antarctic climate is strongly dominated by natural factors (ENSO, SAM, planetary waves, etc.), not human activity. Even Eric Steig, avid defender of the CO2-dominated climate, recently acknowledged in a blog comment (#26) that “the evidence that the current retreat of Antarctic glaciers is owing to anthropogenic global warming is weak.”
Below are a tiny sample papers documenting a natural dominance over the Antarctic climate, and concluding that “detecting an anthropogenic signal … is challenging”. Unfortunately, these are the scientific papers that don’t get much attention, as they don’t endorse the humans-are-causing-dangerous-glacier-melting narrative that garners most of the headlines.
“[O]bservations indicate that there has been no significant change in Antarctic SMB [surface mass balance] in recent decades. We show that this apparent discrepancy between models and observations can be explained by the fact that the anthropogenic climate change signal during the second half of the twentieth century is small compared to the noise associated with natural climate variability. Using an ensemble of 35 global coupled climate models to separate signal and noise, we find that the forced SMB increase due to global warming in recent decades is unlikely to be detectable as a result of large natural SMB variability. However, our analysis reveals that the anthropogenic impact on Antarctic SMB is very likely to emerge from natural variability by the middle of the current century, thus mitigating future increases in global sea level.”
Predicting the Antarctic climate using climate models
“Climate models are the main tool for making quantitative estimates of how Antarctic climate may change over the 21st century. There is high agreement on some aspects of the predictions provided by models, but improvements in understanding are needed in key components of the Antarctic climate system, such as sea ice and coastal ocean-ice shelf processes. In the near term (on timescales of a few years) the climate change signal is small compared to natural cycles (associated with phenomena such as El Niño), the remote impacts of which on the Antarctic atmosphere are difficult to predict. In the longer term (on multi-decadal timescales) the reliability of climate model predictions is limited by uncertainty over human emissions pathways, the realism of climate models, and feedbacks between other elements of the Earth System (e.g. ice sheets).”
“Over the past 37 years, satellite records show an increase in Antarctic sea ice cover that is most pronounced in the period of sea ice growth. Detecting an anthropogenic signal in Antarctic sea ice is particularly challenging for a number of reasons: the expected response is small compared to the very high natural variability of the system; the observational record is relatively short; and the ability of global coupled climate models to faithfully represent the complex Antarctic climate system is in doubt.”
“ENSO is the most prominent coupled mode involving atmospheric and oceanic variability over the tropical Pacific and exerts strong impacts on the climate over the extra-tropics through the excitation of a large-scale atmospheric wave train. … The ENSO-induced atmospheric teleconnection, in turn, modulates Antarctic sea ice as well as sea surface temperature (SST) in the Southern Ocean through alteration of the surface energy fluxes. … SAM [southern annular mode] yields a clear local impact on the SH climate. For example, locally enhanced low-pressure anomaly to the west of the Antarctic Peninsula during a positive SAM [southern annular mode] phase results in advection of warm air and subsequent warming in the Antarctic Peninsula.”
“We demonstrate that a significant September trend towards increased convection (reduced OLR) in the poleward portion of the South Pacific Convergence Zone (SPCZ) is statistically related to Rossby wave-like circulation changes across the southern oceans. … OLR-related changes are linearly congruent with around half of the observed total changes in circulation during September and October, and are consistent with observed trends in South Pacific sea ice concentration and surface temperature over western West Antarctica and the western Antarctic Peninsula.”
“Large precipitation anomalies in regions of significant topography (e.g. New Zealand, Patagonia, coastal Antarctica) and anomalously warm temperatures over much of the Antarctic continent were also associated with strong planetary wave activity. The latter has potentially important implications for the interpretation of recent warming over West Antarctica and the Antarctic Peninsula.”
“Correct representation of the SSTs changes is important for the Northern Hemisphere, while correct representation of stratospheric ozone changes is important for the Southern Hemisphere. The ensemble-mean trend (which captures only the forced response) is nearly always much weaker than trends in reanalyses. This suggests that a large fraction of the recently observed changes [in sea surface temperatures, ozone] may, in fact, be a consequence of natural variability and not a response of the climate system to anthropogenic forcings.”


Umm, I had always assumed that oceans dominated sea ice and glacial ice (at the sea/glacier interface) melting/growth.
It just seems obvious to me that this would be the case. What I seem to be reading is that the scientists (as represented by models) believe that it is the atmosphere that drives the melting/growth. That is just nuts.
For example I have always assumed that the WAIS melting was being driven more by the geothermal energy than by CO2 emissions. It just seems logical.
Hansen idea that the North Pole would be the indicator of climate change was wrong, the better indicator is, and always has been, the South Pole.
As the Antarctic is a vast land mass it retains its evidence of climate effects and changes, unlike the Arctic’s floating ice cap which due to the vagaries of local wind, oceans currents and temperature, it moves and changes constantly. The Arctic changes are not just climate driven but also subjected to huge local variations from these other confounding factors.
IMHO in contrast the Antarctic’s changes are driven more by climate effects and less by local variables.
These “arguments” in and of themselves is/are useless !
Anybody with a “Brain” can see it !
“Warming” cycles and “Cooling” cycles come and go ruffly every 20-25 years or so !!
THAT IS “FACT” NOT FICTION, AND “ANYONE” WHO SAYS DIFFERENT IS A “LIAR” !!!
Cooling trend mid-50’s – late-70’s, Warming trend early 80’s to late 90’s (Around the year 2000 to be precise!)
And WE (PLANET EARTH THAT IS) have been “cooling” now since approximately “16” YEARS !
So… At the very least (Scientifically speaking) we (PLANET EARTH) are still stuck in a cooling trend !
“Okay, well why did we just see an excessive loss in Arctic Sea ice for more than a decade ?”
BECAUSE IT HAS “HAPPENED” BEFORE (The mid 1920’s – to the early 1940’s, ANYONE “REMEMBER” THE GREAT SAND STORMS OF THE “1930’s (The Great Dust Bowls) !
During those “years” there were “few” people (Human Beings) who monitored the ARCTIC, and virtually NONE who monitored ANTARCTICA, but those few who where at least “researching” the Arctic rote papers about the LACK of Arctic Sea Ice, you-can-find copies of those “articles” ONLINE !!!!!!!
So…
The only until recently growing of Arctic Sea Ice is because when one “Cycle” ends, it can take many “Years” for the “NEW” Cycle to begin to enforce its strength, that is a macro level (Climate) explanation compared to a very Micro level definition (Season’s ! Remember, once Summer ends it takes months for the Earth surface, and Atmosphere to cool down before the real cold moves in, it’s called “FALL”, and the same goes for the “Transition” from Winter to Summer, that’s call SPRING)
Again, [GLOBAL “WARMING”] is a farce, A LIE, all to inevitably CONTROL THE POPULATIONS, AND FINALLY TO CONTROL THE INDIVIDUALS AND TO “CREATE” A [[ “1” – WORLD GOVERNMENT ]] WHICH THEN LEADS TO A [[ “1” WORLD RELIGION ]] !!!!!!
Weren’t “We” told about this coming SEVERAL THOUSAND YEARS AGO ???
Man, People are really blind, or really ignorant, or REALLY, REALLY, “STUPID” ? ! ?
So let’s “end” this really stupid argument…
ONE MORE THING THAT WAS “INCONVENIENTLY” LEFT OUT (AND I DO MEAN “LEFT”!)
THE “1930’S” WERE THE [WARMEST] / [HOTTEST] “DECADE” [[ EVER ]] RECORDED IN “MODERN” TIMES !!!
PERIOD !!!!!!
NO OTHER DECADE HAS EVEN COME CLOSE !
AND ANYONE SAYS OTHERWISE IS-A-“LIAR” !!!
VIRTUALLY “ALL” HIGH TEMPERATURE “RECORDS” ACROSS THE ENTIRE [[ GLOBE ]] “INCLUDING” THE
UNITED STATES OF AMERICA WERE RECORDED IN THE “1930’s” !
Death Valley did set the Hottest Temperature ever recorded of 134° degrees in the year of our Lord [[ 1934 ]] !
Now to be fair, “WE” must include the NASA/NOAA “conveniently” altered but previously “CORRECTLY” recorded TEMPERATURE RECORDS, because NASA and NOAA noticed that it would be inconveniently impossible to state/prove that “Global Warming” is a fact because once a slightly educated individual looked at the KNOWN RECORDED TEMPERATURE RECORDS that in fact a GOVERNMENT RUN/TAX PAYER FINANCED “ENTITY” was in fact “LYING” to the “AMERICAN” Public/People about things like, “What was the WARMEST/HOTTEST DECADE MEASURED” by “ERASING” the known TEMPERATURE DATA SETS (RECORDS) to “kill” ANY ARGUMENT of just what “exactly” was/is the HOTTEST DECADE EVEN MEASURED ?
Which “conveniently” makes the 21st CENTURY the Hottest/Warmest (INSTEAD OF THE 1930’s) time ever MEASURED !
How inconveniently convenient…
The artistic committee has judged your comments as the most interesting use of capitalization yet seen.
They are however wondering if you will be moving to stronger EMPHASIS, or maybe the more subtle WTF, I’M NOT SHOUTING!!! or even NO I’M NOT , to make reading your message even more tiresome.
I agree with you on one point but for a different reason:
Imagine if a person talked like that in real life. I suspect that would be ‘tiresome’ in that he’d be out of breath by the time he finished (and probably a bit dizzy from hyperventilation).
No offense to Rick *g*
I entirely disagree. Capitalization is just emphasis. And it’s an interesting point. It’s about 60 years before the current Global Warming scare. One AMO cycle.
https://en.wikipedia.org/wiki/Atlantic_multidecadal_oscillation#/media/File:Amo_timeseries_1856-present.svg
Well said, it was all a bit much and considerably distracted from what he was trying to say
Nice work. It seems you nailed a key cause of natural climate change. Nothing to do with carbon dioxide.
Climate change is a false premise for regulating carbon dioxide emissions. Nature converts CO2 to limestone. Climate change may or may not be occurring, but is is for sure NOT caused by human fossil fuels use. There is no empirical evidence that fossil fuels use affects climate. Likely causes are well documented elsewhere.
Here’s why. Fossil fuels emit only 3% of total CO2 emissions. 95% comes from rotting vegetation. All the ambient CO2 in the atmosphere is promptly converted in the oceans to limestone and other carbonates, mostly through biological paths. CO2 + CaO => CaCO3. The conversion rate increases with increasing CO2 partial pressure. An equilibrium-seeking mechanism.
99.84% of all carbon on earth is already sequestered as sediments in the lithosphere. The lithosphere is a massive hungry carbon sink that converts ambient CO2 to carbonate almost as soon as it is emitted.
All living or dead organic matter (plants, animals, microbes etc. amount to only 0.00033% of the total carbon mass on earth. Ambient CO2 is only 0.00255%. Everything else is sophistry or mass hysteria.
A modern coal power plant emits few air emissions except water vapor and carbon dioxide. Coal remains the lowest cost and most reliable source of electric energy.
ONE MORE THING THAT WAS “INCONVENIENTLY” LEFT OUT (AND I DO MEAN “LEFT”!)
THE “1930’S” WERE THE [WARMEST] / [HOTTEST] “DECADE” [[ EVER ]] RECORDED IN “MODERN” TIMES !!!
PERIOD !!!!!!
NO OTHER DECADE HAS EVEN COME CLOSE !
VIRTUALLY “ALL” HIGH TEMPERATURE “RECORDS” ACROSS THE ENTIRE [[ GLOBE ]] “INCLUDING” THE
UNITED STATES OF AMERICA !
Death Valley did set the Hottest Temperature ever recorded of 134° degrees in the year of our Lord [[ 1934 ]] !
Now to be fair, “WE” must include the NASA/NOAA “conveniently” altered but previously “CORRECTLY” recorded TEMPERATURE RECORDS, because NASA and NOAA noticed that it would be inconveniently impossible to state/prove that “Global Warming” is a fact because once a slightly educated individual looked at the KNOWN RECORDED TEMPERATURE RECORDS that in fact a GOVERNMENT RUN/TAX PAYER FINANCED “ENTITY” was in fact “LYING” to the “AMERICAN” Public about things like, “What was the WARMEST/HOTTEST DECADE MEASURED” by “ERASING” the known TEMPERATURE DATA SETS (RECORDS) to “kill” ANY ARGUMENT of just what “exactly” was/is the HOTTEST DECADE EVER MEASURED (ie the 1930’s) ?
Which “conveniently” makes the 21st CENTURY the Hottest/Warmest dates ever MEASURED !
How conveniently inconvenient…
Yes the 1930s were the hottest, how was the North Pole ice doing then?
ONE MORE THING THAT WAS “INCONVENIENTLY” LEFT OUT (AND I DO MEAN “LEFT”!)
THE “1930’S” WERE THE [WARMEST] / [HOTTEST] “DECADE” [[ EVER ]] RECORDED IN “MODERN” TIMES !!!
PERIOD !!!!!!
NO OTHER DECADE HAS EVEN COME CLOSE !
VIRTUALLY “ALL” HIGH TEMPERATURE “RECORDS” ACROSS THE ENTIRE [[ GLOBE ]] “INCLUDING” THE
UNITED STATES OF AMERICA !
Death Valley did set the Hottest Temperature ever recorded of 134° degrees in the year of our Lord [[ 1934 ]] !
Now to be fair, “WE” must include the NASA/NOAA “conveniently” altered but previously “CORRECTLY” recorded TEMPERATURE RECORDS, because NASA and NOAA noticed that it would be inconveniently impossible to state/prove that “Global Warming” is a fact because once a slightly educated individual looked at the KNOWN RECORDED TEMPERATURE RECORDS that in fact a GOVERNMENT RUN/TAX PAYER FINANCED “ENTITY” was in fact “LYING” to the “AMERICAN” Public about things like, “What was the WARMEST/HOTTEST DECADE MEASURED” by “ERASING” the known TEMPERATURE DATA SETS (RECORDS) to “kill” ANY ARGUMENT of just what “exactly” was/is the HOTTEST DECADE EVER MEASURED (ie the 1930’s) ?
Which “conveniently” makes the 21st CENTURY the Hottest/Warmest dates ever MEASURED !
How conveniently inconvenient…
Maybe also the ice shelfs development depends on precipitation like snow.
Even in Antarctica it snows, and if the ice formed by the snow dosn’t glide out to the sea, it would be more than mile high by now.
“Okay, well why did we just see an excessive loss in Arctic Sea ice for more than a decade ?”
We didn’t.
It was coming down off an extremely high level, nearly as high as the EXTREMES of the LIA.
Maybe if you also look at the relationship between Arctic sea ice and the AMO, you might glean some basic understanding.
Well and if we look at the annual minima and maxima of Northern sea ice we see that they are exactly 90 degree phase shifted against the insolation minima/maxima, meaning that the ice mass integrates temperature. Integrators phase-shift by 90 degrees over ALL FREQUENCIES.
We would therefore expect a multi-annual minimum to occur long AFTER a maximum of multi annual average temperature: to be precise when that temperature is already dropping the fastest (assuming a sinusoid temperature curve).
There was a minimum of sea ice extent in 2007 and I think it was even beat a little in 2012. So that’s over. By this simple argument we can say that we are already cooling rapidly.
If any of you warmunists out there are of the opinion that ice mass is somehow PROPORTIONAL to temperature then you better find a way to explain why the Northern sea ice mass does not achieve its minimum in mid summer.
define “excessive”
Oh dear parts of the Southern Hemisphere are not playing the game, I wonder how Mann et al. can square the circle of the hottest year when its snows in New Zealand during spring…
http://www.newshub.co.nz/nznews/weather-severe-snow-watch-across-east-coast-2016101421
” I wonder how Mann et al. can square the circle of the hottest year when its snows in New Zealand during spring…” – tom0mason
I thought they had already done that by saying (without proof, of course) that global warming causes increased snowfall.
[…] Climate Model Simulations That Include Anthropogenic Forcing Are Not Compatible With Observed Trends on the Antarctic Peninsula [link] […]