Temperatures, Sea Levels ‘Naturally’ Rise
30 – 40 Times Faster Than Today’s Rates
Modern Temperatures Only Rising 0.05°C/Decade
Since 1850, CO2 concentrations have risen from 285 ppm to 400 ppm. During these ~165 years, the IPCC has concluded that surface temperatures have warmed by 0.78°C. This is a warming rate of only 0.05°C per decade for 1850-2012 — which happens to be the same rate of warming over the 1998-2012 period.
IPCC AR5 (2013): “The globally averaged combined land and ocean surface temperature data as calculated by a linear trend, show a warming of 0.85°C over the period 1880 to 2012, when multiple independently produced datasets exist. The total increase between the average of the 1850–1900 period and the 2003–2012 period is 0.78 °C, based on the single longest dataset available 4 (see Figure SPM.1). … [T]he rate of warming over the past 15 years (1998–2012; 0.05 °C per decade), which begins with a strong El Niño, is smaller than the rate calculated since 1951 (1951–2012; 0.12 °C per decade).”
Modern Sea Levels Only Rising 0.17 Of A Meter/Century
IPCC AR5 (2013): “[T]he rate of global averaged sea level rise was 1.7 mm yr between 1901 and 2010“
Historical Hemispheric Temperatures Rose 2.0°C/Decade
According to a new paper, the Bølling Warming event 14,700 years ago raised the surface temperature for the entire Northern Hemisphere by 4 to 5°C within a few decades. This is a hemispheric warming rate of approximately 2.0°C per decade, which is 40 times faster than the 0.05 °C per decade global warming rate since 1850 (and 1998).
Historical Sea Levels Rose 5.3 Meters/Century
Central Greenland’s surface temperatures rose by as much as 12°C during this time frame (14,700 years ago to 14,500 years ago). Consequently, glaciers and ice sheets disintegrated rapidly and sea levels rose by about 18 meters (“12-22 m”) in 340 years. An 18 m rise in 340 years is the equivalent of 5.3 meters per century, which is more than 30 times faster than the rate of sea level change (0.17 m per century) between 1901 and 2010.
Ivanovic et al., 2017 “During the Last Glacial Maximum 26–19 thousand years ago (ka), a vast ice sheet stretched over North America [Clark et al., 2009]. In subsequent millennia, as climate warmed and this ice sheet decayed, large volumes of meltwater flooded to the oceans [Tarasov and Peltier, 2006; Wickert, 2016]. This period, known as the “last deglaciation,” included episodes of abrupt climate change, such as the Bølling warming [~14.7–14.5 ka], when Northern Hemisphere temperatures increased by 4–5°C in just a few decades [Lea et al., 2003; Buizert et al., 2014], coinciding with a 12–22 m sea level rise in less than 340 years [5.3 meters per century] (Meltwater Pulse 1a (MWP1a)) [Deschamps et al., 2012].”

Bølling Warming/Sea Level Rise Occurred With Stable CO2
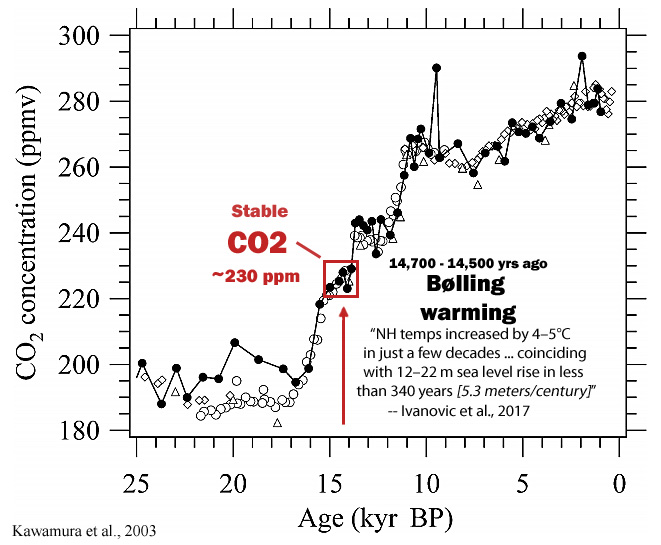
CO2 record for 25 kya-present courtesy of Kawamura et al., 2003
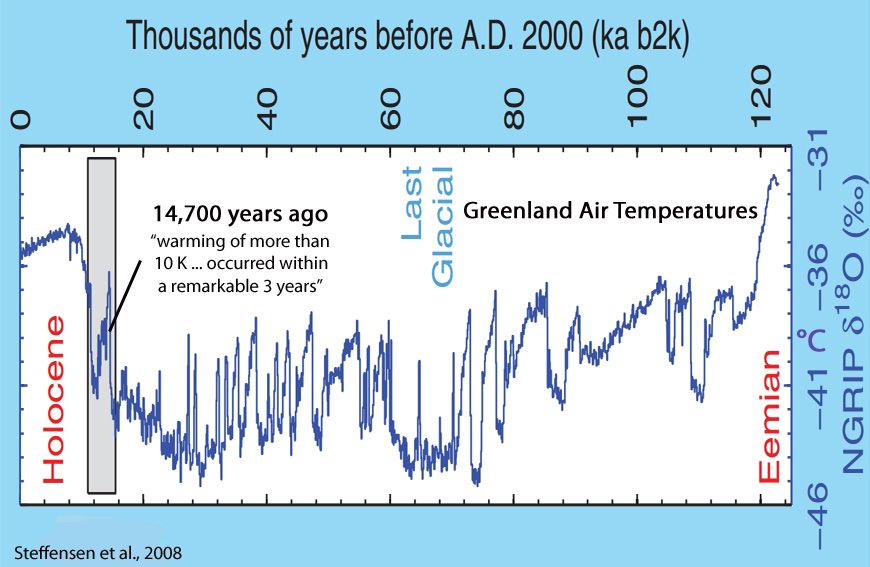
Greenland Warmed By 10°C Within 3 Years 14,700 Years Ago
Steffensen et al., 2008 High-Resolution Greenland Ice Core Data Show Abrupt Climate Change Happens in Few Years
“A northern shift of the Intertropical Convergence Zone could be the trigger of these abrupt shifts of Northern Hemisphere atmospheric circulation, resulting in changes of 2 to 4 kelvin in Greenland moisture source temperature from one year to the next.”
“The d18O warming transition at 14.7 ka [14,700 years ago] was the most rapid and occurred within a remarkable 3 years, whereas the warming transition at 11.7 ka [11,700 years ago] lasted 60 years; both correspond to a warming of more than 10 K.”
Greenland Warmed By 8-15°C Within Decades During Last Glacial
CO2 concentrations remained essentially stable and dangerously low (~180 parts per million) throughout the last glacial (roughly 80,000 to 15,000 years ago). And yet despite the lack of CO2 flux, Greenland’s surface temperatures often warmed by about 10.0°C within a matter of decades during this period. This indicates that CO2 variability is not a detectable factor in abrupt climate changes.
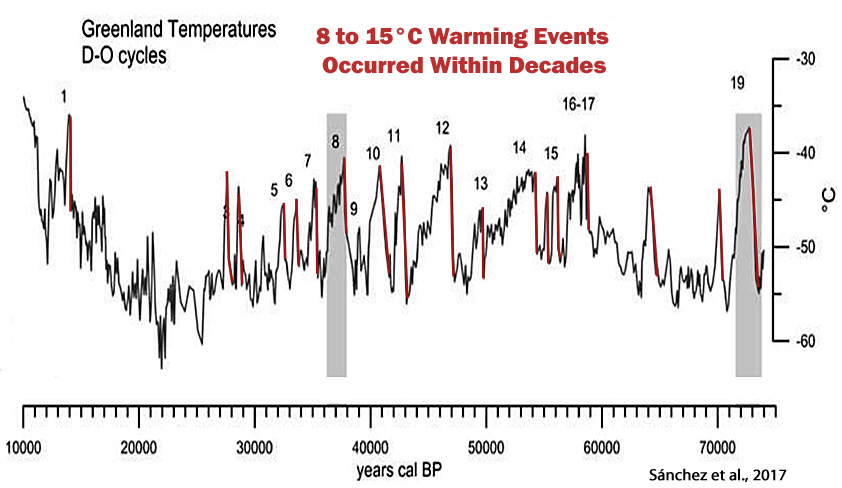
Schmidt and Hertzberg, 2011 “There are twenty-five of these distinct warming-cooling oscillations (Dansgaard 1984) which are now commonly referred to as Dansgaard-Oeschger cycles, or D-O cycles. One of the most surprising findings was that the shifts from cold stadials to the warm interstadial intervals occurred in a matter of decades, with air temperatures over Greenland rapidly warming 8 to 15°C (Huber et al. 2006).”
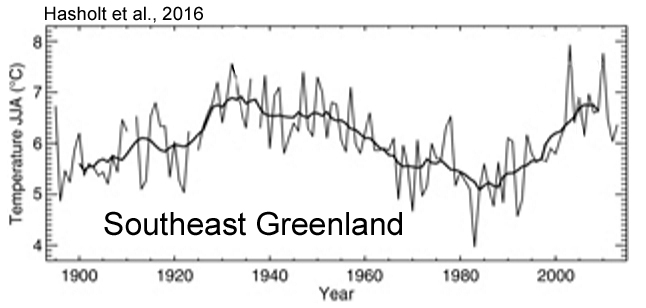
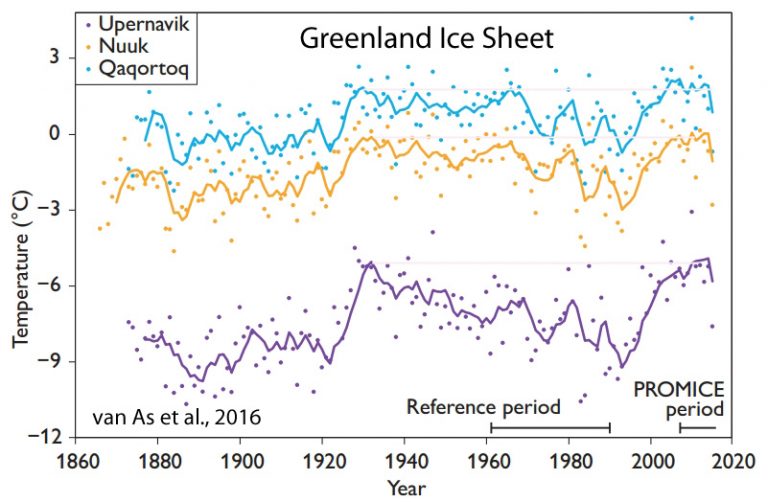
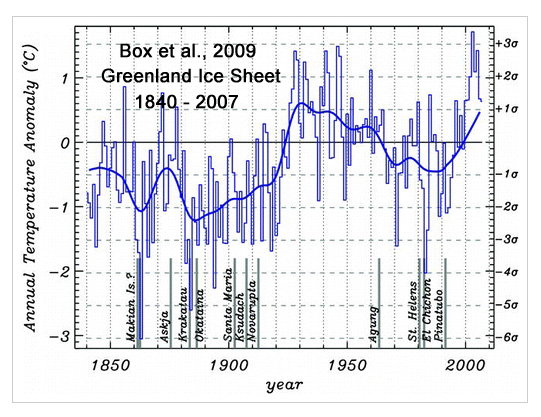
In Contrast, There Has Been No Net Warming In Greenland For 80 Years
Zhao et al., 2016
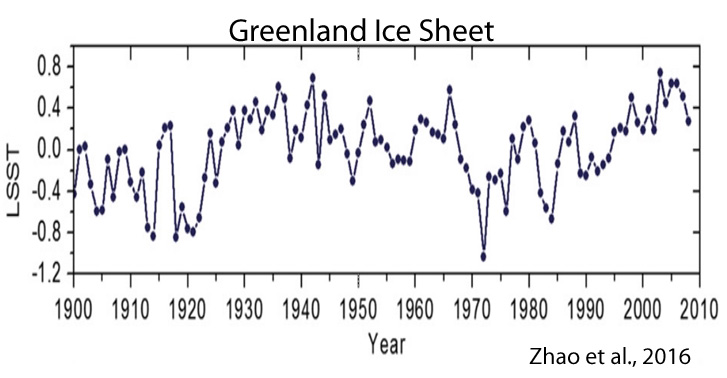
Hasholt et al., 2016 “We determined that temperatures for the ablation measurement periods in late July to early September were similar in both 1933 and the recent period [1990s – present], indicating that the temperature forcing of ablation within the early warm period and the present are similar.”
van As et al., 2016 “JJA [summer] temperatures were higher in 1928 and 1929 than in any other year of the Qaqortoq record, both attaining values of 9.2°C. This suggests that ablation in those years may have exceeded the largest net ablation measured on the Greenland ice sheet (2010).”
Box et al., 2009 “The annual whole [Greenland] ice sheet 1919–32 warming trend is 33% greater in magnitude than the 1994–2007 warming.”
Conclusion
Modern rates of temperature change and sea level rise are quite modest and unremarkable relative to the magnitude of the changes in the geological past (that are 30 to 40 times larger or faster). The abrupt and pronounced historical temperature and sea level rise events occurred without any significant changes in atmospheric CO2 levels.
In contrast, during the last 100 to 150 years there has been a dramatic rise in anthropogenic CO2 emissions and atmospheric CO2 concentrations…but no accompanying dramatic rise in temperatures or sea level.
Thus, the conceptualization that human activity or CO2 concentration changes are the primary drivers of temperature changes and sea level rise does not seem to be supported by the geological evidence.


Once again another false claim made by the alarmists gets debunked. The truth is that the 1979-1998 warming was nothing unusual at all. And since 1998 there’s been no statistically significant warming whatsoever.
Claiming that there is no connection between CO2 and temperature, and rapid rise in temperature without connection to a rise in CO2 will provoke a ‘pavlovian’ response in sod and SebastionH, which in turn will provoke a response from others.
Stand by for them denying either that the temperature rose, or claiming the CO2 level must have risen, and referring to recently drawn graphs to show the scam is continuing e.g. snow recently in the Sahara.
“Stand by for them denying either that the temperature rose,”
No. I just want to see a realistic error bar next to those claims. An error bar, which is comparable to modern surface station data (which you folks doubt is real!).
If there was an error bar shown in those graphs, what would that allow you to claim about temperatures and sea levels rising at 30-40 times the rate of today’s? How would an error bar help you support your position that hemispheric/global temperatures are modulated by CO2 concentration changes?
Do you also know, Sod, how to use an error bar in decision making, and why we don’t have bias bars? Don’t go now to Wonkipedia, but give us a fresh idea, telling what skeptics are doing so consistently wrong.
Ah-ha, yet more evidence of the very settle hubris that infect some in the unsettled world of climatography is built on faulty foundations.
No the science is not settled, the subjects main variables, constants, feedbacks and coupling are barely known, and certainly not well understood. That and the blinkered view that believes there are direct couplings of cause and effect, 1:1, in the way that climate operates. How and why would this planet’s chaotic climate system have such couplings.
While it is said by NOAA sea levels rise by 1.7-1.8mm per year, for coastal stations that is wrong, because NOAA adds 0.3mm to allow for ocean floor lowering due to post glacial rebound, while this might be correct, for coastal stations the effect is more like 1.5mm per year.
Since we are talking about Greenland ice.
Here is the Greenland ice area over the last 10,000 years.
https://s19.postimg.org/ceo16fi7n/Greenland-_Ice-_Sheet-_Briner.jpg
And here is the Greenland Total Ice Mass since 1900.
(If you think this graph is incorrect, provide one that is, and NO, not a losses graph, an actual “Total Ice Mass” graph)
https://s19.postimg.org/vubfmdf8z/Greenland_ice_mass2.png
” there has been a dramatic rise in anthropogenic CO2 emissions and atmospheric CO2 concentrations ”
For dramatic I would use “minor”:
Say I am malnourished and someone gives me half an apple.
Someone else says to throw that 1/2 away and I’ll give you 75% of an apple.
I’d see that as a minor contribution to my need.
Think like a plant. At about 700-800 ppm CO2, we are on the way to a nice rise, still not dramatic. 2,000 ppm would make us plants very happy.
Relative to the “accepted” CO2 concentration levels for the Holocene, the rise since 1950 (311 ppm to 405 ppm) is rather steep, as is the ~1.5 GtC/yr emissions rate (1950) to today’s (10 GtC/yr).
[…] principle can be found in recent research done on the Greenland ice sheet. It found that there were dramatic temperature changes during times of stable CO2 levels. This importance of this is that there must be factors not included in the T=f(CO2) model that are […]
Y=mX+b, how does Constant CO2 Cause a Change in Temperature?
https://co2islife.wordpress.com/2017/04/15/ymxb-b-is-constant/
[…] By Kenneth Richard , April 2017 […]
[…] principle can be found in recent research done on the Greenland ice sheet. It found that there were dramatic temperature changes during times of stable CO2 levels. The importance of this is that there must be factors not included in the T=f(CO2) model that are […]
Water vapor is far more prevalent in our atmosphere than CO2, and has 20X the heat-holding power. Why hasn’t this fact been forced into every “global warming” venue? Every narrative by the alarmists is faulty. For example:
“Water vapor is the most abundant heat-trapping gas, but rarely discussed when considering human-induced climate change. The principal reason is that water vapor has a short cycle in the atmosphere (a few days) before it is incorporated into weather events and falls to Earth, so it cannot build up in the atmosphere in the same way as carbon dioxide does.[1, 2]” at: http://www.ucsusa.org/global_warming/science_and_impacts/science/CO2-and-global-warming-faq.html The chart intentionally excludes water vapor. CO2 is taken up by plants and this is also excluded. Water vapor is constantly replenished, if only by vapor pressure, and this is excluded. Recall the seas of humidity days of summer? I know Cfact pushes back, but can there be a far broader awakening by using the new NOAA, NASA, and EPA to expunge their sites of bad science?
[…] No Sea Level Rise At Lower Manhattan For 20 Years. NASA Hiding The Decline In Sea Level And Temperature. Sea Level Rise: Just the Facts. Floating Islands. Does Global Warming Cause Coastal Reef Islands to Disappear? New Evidence That Reef Islands Can Repair Storm Wave Damage. How Are Earth's Islands Being Impacted by Rising Sea Levels? A New Refutation of Dangerous CO2-Induced Global Warming. Temperatures, Sea Levels ‘Naturally’ Rise 30 – 40 Times Faster Than Today’s Rates. […]