Already 58 New 2017 Papers Link
Solar Activity To Climate Changes
Earlier this month, the first installment in the accumulating list of hundreds of new peer-reviewed scientific papers supporting a skeptical position on climate change alarm was made available.
Included on the list were 38 papers linking climate changes to solar forcing: 38 Sun-Climate Scientific Papers, January-March 2017
Just in the last few weeks alone, another 20 scientific papers were identified which link solar variations to climate changes, which means 58 papers have already been published in 2017.
20 New Sun-Climate Papers
High Solar Activity (Warming), High Crop Yields – Low Solar Activity (Cooling), Low Crop Yields
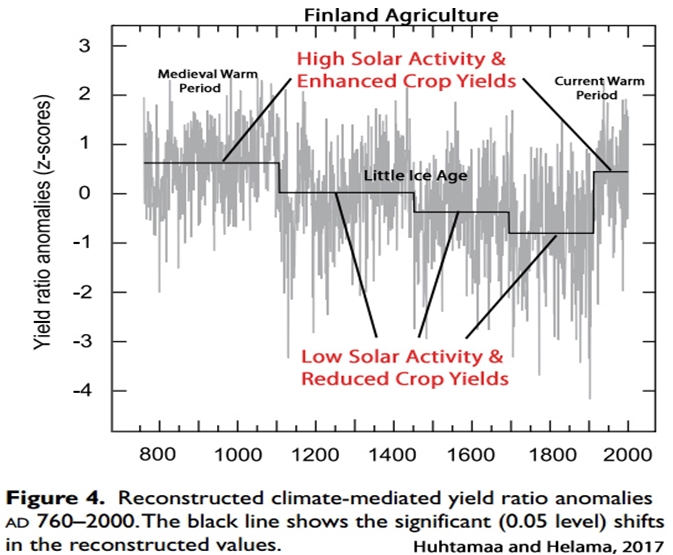
“Throughout the written history of Finland, delayed onset of summer and night frost have been named as the main reasons for crop failure and famine. … Our reconstruction suggests that in the 8th–10th centuries AD, when continuous crop cultivation was established in Finland, the risk of temperature-driven crop failure was notably lower and the crops were generally higher than during the historical period (c. 13th century ad onwards). The continuous period of high crop yields coincides with an episode of multi-centennial summer season warmth, associated with the MCA [Medieval Climate Anomaly] in the region and around north-west Europe (Goosse et al., 2012; Luoto and Helama, 2010; Ogilvie et al., 2000; Sundqvist et al., 2010). The warm climatic regime of the MCA was interrupted by a period of distinctly cold winter and summer temperatures c. ad 1110– 1150 (Helama et al., 2009b; Linderholm et al., 2015; Tiljander et al., 2003). Also on the eastern side of the study area, in North-West Russia, c. ad 950–1100 was marked by a warmer climate and intensive agricultural expansion to the north (Klimenko, 2016).”
“The rapid mid-15th century cooling, which followed a major atmospheric circulation change over the North Atlantic (Dawson et al., 2007; Meeker and Mayewski, 2002) and coincided with the culmination of the Spörer solar minimum (Miyahara et al., 2006), has been evidenced in various summer and winter season reconstructions of the region (Haltia-Hovi et al., 2007; Helama et al., 2009b; Klimenko and Solomina, 2010; Luoto and Helama, 2010; Zhang et al., 2015).”
“The culmination of the ‘LIA’ [Little Ice Age] in Finland has been commonly dated to the late 17th and early 18th centuries ad (Luoto, 2013; Luoto and Helama, 2010; Tiljander et al., 2003), which is synchronous with the onset of the phase of the lowest yield ratios in our reconstruction. The Maunder solar minima (c. 1645–1715) and several volcanic eruptions preceded the culmination (Shindell et al., 2003).”
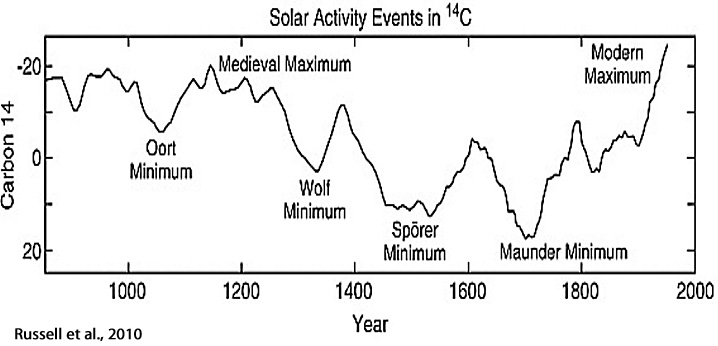
Russell et al., 2010 (Solar Activity Graph)
Decadal Variations In Ozone, ENSO, NAO, Mean Sea Level, And Climate ‘Excited By Solar Activity’
DECADAL CYCLES OF EARTH ROTATION, MEAN SEA LEVEL AND CLIMATE,
EXCITED BY SOLAR ACTIVITY
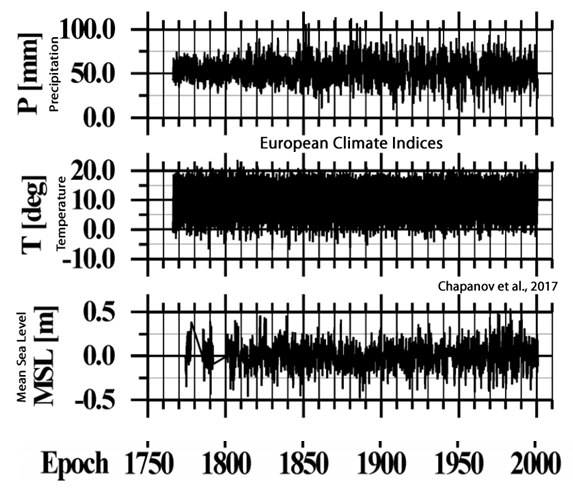
“But recently, another mechanism of climate variations, due to cosmic rays was proposed (Kilifarska and Haight, 2005; Kilifarska, 2008, 2011; Velinov et al., 2005). According to the new models, the cosmic rays produce a ionization of the atmosphere, changes of atmosphere conductivity, lightning, and an increase of ozone concentration. The ozone plays significant role in climate variations, so the new models of cosmic ray influences on Earth atmosphere may explain the observed correlation between cosmic rays and climate variations.”
“The shape of solar cycles is rather different from sinusoidal form, so they affect geosystems by many short-term harmonics. A possible solar origin of decadal variations of Earth rotation, mean sea level and climate indices is investigated by the harmonics of Jose, de Vries and Suess cycles with centennial periods of 178.7, 208 and 231 years. The common decadal cycles of solar-terrestrial influences are investigated by long time series of Length of Day (LOD), Mean Sea Level (MSL) variations at Stockholm, ElNiño/Southern Oscillation (ENSO), temperature and precipitation over Eastern Europe, Total Solar Irradiance (TSI), Wolf’s Numbers Wn and North-South solar asymmetry. A good agreement exists between the decadal cycles of LOD [length of day], MSL [mean sea level], climate and solar indices whose periods are between 12-13, 14-16, 16-18 and 28-33 years.”
“The Total Solar Irradiance (TSI), Wolf’s Numbers (Wn) and North-South (N-S) solar asymmetry expose different spectral peaks, amplitude modulation and phases from these bands. These solar time series represent thermal heating over the Earth, solar wind (space weather) and solar magnetic field variations. The decadal cycles of N-S [North-South] solar asymmetry strongly affect corresponding cycles of El Nino/Southern Oscillation (ENSO).”
3. Helama et al., 2017 (full)
“Solar proxy data (Steinhilber et al., 2009) consistently illustrate low activity between AD 400 and 700, with a notable seventh-century solar minimum, the millennial-scale solar changes culminating over these centuries and thus during the DACP [Dark Ages Cold Period] (Scafetta, 2012). Interestingly, there is multiple proxy evidence showing that reduced solar activity may modulate the North Atlantic Oscillation (NAO) towards its negative phase (Gray et al., 2010). Since the NAO is a leading pattern of climate variability in the global atmosphere, and the negative NAO phase is generally associated with cooler temperatures particularly over western Europe and eastern North-America for both the winter (Wanner et al., 2001; Hurrell and Deser, 2010) and summer seasons (Folland et al., 2009), a prolonged negative NAO phase could thus result in cold temperatures at least over some parts of the Northern Hemisphere continents. … Recently, a collection of multi-proxy evidence illustrated a cooling phase around the Northern Hemisphere which was tree-ring dated to AD 536-660 and termed the Late Antique Little Ice Age (LALIA) (Büntgen et al., 2016). This event was shown to follow a multitude of large unknown volcanic eruptions in AD 536, 540 and 547, for which evidence was derived from bipolar ice-core timescales and sulphur records (Sigl et al., 2015). The cooling, having once initiated from volcanic aerosol forcing (Larsen et al. 2008), may have been sustained over extended intervals possibly because of the coinciding solar minimum and through sea-ice/ocean feedback mechanisms (Büntgen et al., 2016; Matskovsky and Helama, 2016), analogous to findings from equivalent proxy data (Gennaretti et al., 2014) and transient climate model simulations(Miller et al., 2012) during the LIA.
“A delayed response of the winter North Atlantic oscillation (NAO) to the 11-year solar cycle has been observed and modeled in recent studies. The result of this study supports a previous hypothesis that suggests that the 11-year solar cycle signals on the Earth’s surface are produced through a downward penetration of the changes in the stratospheric circulation. … The importance of the North Atlantic oscillation (NAO) for the European weather and climate conditions has been known for a long time (Walker and Bliss 1932; van Loon and Rogers 1978; Hurrell et al. 2003). NAO is the dominant intrinsic mode of atmospheric variability over the Atlantic sector (Hurrell and Deser 2009). … The present result confirms the previous hypothesis reported by Kodera et al. (2016), which stated that the major solar influence on the Earth’s surface can be produced through changes in stratospheric circulation, and the spatial structure of the solar signal at the Earth’s surface is largely conditioned by atmosphere’s interaction with the ocean.”
“The identification of causal effects is a fundamental problem in climate change research. Here, a new perspective on climate change causality is presented using the central England temperature (CET) dataset, the longest instrumental temperature record, and a combination of slow feature analysis and wavelet analysis. The driving forces of climate change were investigated and the results showed two independent degrees of freedom —a 3.36-year cycle and a 22.6-year cycle, which seem to be connected to the El Niño–Southern Oscillation cycle and the Hale sunspot cycle, respectively.”
’11-Year Solar Cycle…Influences [Surface] Weather And Climate’
“There is growing evidence that variability associated with the 11-year solar cycle has an impact at the Earth’s surface and influences its weather and climate. Although the direct response to the Sun’s variability is extremely small, a number of different mechanisms have been suggested that could amplify the signal, resulting in regional signals that are much larger than expected. In this paper the observed solar cycle signal at the Earth’s surface is described, together with proposed mechanisms that involve modulation via the total incoming solar irradiance and via modulation of the ultra-violet part of the solarspectrum that influences ozone production in the stratosphere.”
7. Hood, 2017
QBO/Solar Modulation of the Boreal Winter Madden-Julian Oscillation … “The Madden-Julian Oscillation (MJO), also known as the 30-60 day oscillation, is the strongest of the intraseasonal climate oscillations in the tropics and has significant derivative effects on extratropical circulation and intraseasonal climate. It has recently been shown that the stratospheric quasi-biennial oscillation (QBO) modulates the amplitude of the boreal winter MJO such that MJO amplitudes are larger on average during the easterly phase (QBOE) than during the westerly phase (QBOW). A major possible mechanism is the decrease in static stability in the lowermost stratosphere under QBOE conditions resulting from relative upwelling associated with the QBO induced meridional circulation. Here, evidence is presented that tropical upwelling changes related to the 11-year solar cycle also modulate the boreal winter MJO. Based on 37.3 years of MJO amplitude data, the largest amplitudes and occurrence rates, and the weakest static stabilities in the tropical lower stratosphere, occur during the QBOE phase under solar minimum (SMIN) conditions while the smallest amplitudes and strongest static stabilities occur during the QBOW phase under solar maximum (SMAX) conditions. Conversely, when the QBO and solar forcings are opposed (QBOW/SMIN and QBOE/SMAX), the difference in occurrence rates becomes statistically insignificant.”
Temperature responses to the 11-year solar cycle in the mesosphere from the 31-year (1979-2010) … “Atmospheric response to the solar cycle (SC) here refers to atmospheric variability induced by the 11-year solar activity cycle. The SC [solar cycle] response originates mainly from large (4-8%) solar UV spectral irradiance change (in the range of 200-250 nm) from solar minimum to maximum condition, while the total solar flux stays nearly constant (0.1%) [Donnelly, 1991; Lean et al., 1997; Woods and Rottman, 1997; Beig et al., 2008; Gary et al., 2010]. The variability of the solar UV spectral irradiance affects the thermal structure of the atmosphere by directly changing the total energy deposited and indirectly modifying the photochemistry and dynamics of the atmosphere. In addition to the equatorial Quasi-Biennial Oscillation (QBO) [Baldwin et al., 2011] and the El Niño-Southern Oscillation (ENSO) [Li et al., 2013], the 11-year SC is also a significant source to the inter-annual variability in the mesosphere and lower (MLT) region.”
Periods Of Low Solar Activity Explain Little Ice Age Cooling Trends
“The Maunder minimum (1645-1715) refers to a period when very few sunspots were observed. During this period, the Earth climate was cooler than normal. This period mimics the solar cycle climate change connections. The particles and electromagnetic radiations flowing from solar activity outbursts are important for long-term climate variations. There is an abrupt and drastic cooling in the climate can be possible in near future due to large scale melting of global ice by global warming, and prolonged sunspot minima. There is a close correlation between variations in the 11-year sunspot cycle and Earth’s climate. Solar activity varies on shorter-time scales, including the 11- year sunspot cycle and longer-term as Milankovitch cycle.”
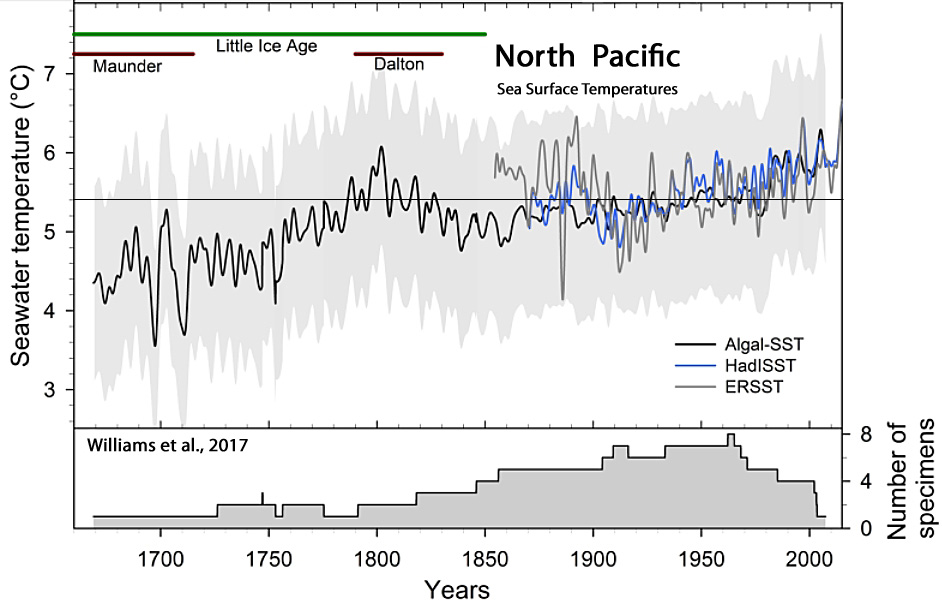
“Reconstructed SSTs significantly warmed 1.1 ± 0.30°C … from 1660s to 1800 (rate of change: 0.008 ± 0.002°C/year), followed by a significant cooling of 0.8 ± 0.04°C … until 1840 (rate of change: 0.02 ± 0.001°C/year), then a significant warming of 0.8 ± 0.16°C from 1860 until the end of reconstruction in 2007 (rate of change: 0.005 ± 0.001°C/year).” [Sea surface temperatures warmed faster from 1660s-1800 than they did from 1860-2007.]
“In fact, the SST reconstruction significantly co-varied with a reconstruction of solar irradiance [Lean, 2000] on the 11-year periodicity only from ~1745 to 1825. In addition, the reconstructed SSTs were cool during the period of lower than usual solar irradiance called the Maunder minimum (1645–1715) but then warmed and cooled during the Dalton minimum (1795–1830), a second period of reduced solar irradiance. … The Dalton solar minimum and increased volcanic activity in the early 1800s could explain the decreasing SSTs from 1800 to 1850 … [T]hese data suggest a complex combination of solar irradiance, volcanic activity, internal ocean dynamics and external anthropogenic forcing explain the variability in Aleutian SSTs for the past 342 years.”
“Radiative forcing of the Earth’s atmosphere plays a significant role in its thermal and chemical balance (Haigh, 1994; Haigh et al., 2010). Effects of heating and cooling are influenced by long-term solar-cycle changes. One example of such change compiled from sources that show sensitivity to the changes of solar activity (Hoyt and Schatten, 1998) is the Maunder Minimum of 1645 to about 1715 (Maunder, 1890). These observations demonstrate the effects of solar-activity changes during the Maunder Minimum for which low to near-zero sunspot numbers persisted for about six solar cycles (SC) with a SC-averaged period (for SC 1 to 22) of 11 years (Hathaway, 2010).”
12. Nan et al., 2017
“Furthermore, our temperature records, within age uncertainty, coincides with the changes of the solar irradiance changes, suggesting a possible link between solar forcing and climate variability. … The relationship between the solar irradiance and climate change has been demonstrated by lots of studies (He et al., 2013; Kroonenberg et al., 2007; Sagawa et al., 2014; Soon et al., 2014). It was suggested that the solar activity was a primary driving force of climatic variations in the Holocene (Bond et al., 2001; Wang et al., 2005). Small solar perturbations can be magnified by different feedback mechanisms and may ultimately lead to climatic oscillations on several time scales, such as annual to decadal and/or centennial scales, as well as millennial scales (Haigh, 1996; Bond et al., 2001).”
‘Marked Association Of Solar Activity With Weather And Climate Change’
“Solar wind and electric-microphysical process is the key mechanism that affects climate … We investigated the influencing mechanism of high-energetic particle precipitation modulated by solar wind on the Arctic Oscillation (AO) and North Atlantic Oscillation (NAO). On a day-to-day time scale, Zhou, Tinsley, and Huang (2014) and Huang et al. (2013) found that the minima in AO and NAO indices only lagged 0~2 days of the solar wind speed (SWS) minima during years of high stratospheric aerosol loading, which suggests a much faster mechanism of solar influence on the atmospheric system compared to the ozone destruction process. From the perspective of year-to-year variation, Xiao and Li (2016) and Zhou et al. (2016) showed a robust relationship between SWS [solar wind speed] and NAO in boreal winter. These aforementioned studies indicate that the wintertime Iceland Low in the North Atlantic was very sensitive to solar wind variations and played an important role in the process of solar wind and electric-microphysical effects on climate. Moreover, under the condition of a weak electric field, we have demonstrated the marked impact of cloud droplet electricity on the collision efficiency of cloud condensation nuclei. This, in turn, suggests that the collision in a cloud microphysics process constitutes the core link between atmospheric electricity and climate (Tinsley and Leddon 2013; Tinsley and Zhou 2013, 2014). Furthermore, Tinsley and Zhou (2015) improved the collision and parameterization scheme that varied with electric quantity in a cloud microphysics process and quantitatively evaluated the effects of high-energetic particle flux on cloud charge. This achievement not only supports the marked association of solar activity with weather and climate change on various time scales, but also but also avails the quantitative accession of solar impacts on climate. It is worth noting that the successful establishment development of a theoretical model regarding of the influencing process of solar energetic particles on the atmosphere improves the development of global climate models.”
Hurricane Frequency ‘Is Synchronous With The Solar Irradiance’
“Hurricane genesis modelling based on the relationship between solar activity and hurricanes … There are a number of works concerning the Sun–Earth connections and their influence on atmospheric motions. There are a number of observations which show that within a few days after energetic solar eruptions (flares, coronal mass ejections and eruptive prominences), there are diverse meteorological responses of considerable strength (Gomes et al. 2012). … Conclusion: [T]here are several indications which are in favor that the beginning of violent cyclonic motions in Earth’s atmosphere may be caused by charged particles from the solar wind.”
“Typhoon frequency in East Asia is synchronous with the solar irradiance. … Several studies documented typhoon pattern changes in response to the El Niño/Southern Oscillation (ENSO). … The fluctuation of the solar activity plays a key role in regulating the westerly jet movement. The multi-centennial scale of the typhoon frequency in mid-latitude East Asia is therefore caused by changes in the solar activity and ENSO conditions.”
‘Climate…Follows Solar Activity Fluctuations On Multidecadal To Centennial Time Scales’
“Understanding the Sun-Earth’s climate coupling system is both an essential and an urgent issue, with great progress achieved over the last decades (e.g., Haigh, 2007; Soon et al., 2014 for a review). Recently, Brugnara et al. (2013) referred that the Euro–Atlantic sector, in which Portugal is located, seems to be a region with a particularly strong solar influence on the troposphere, finding a significant change in the mean late winter circulation over Europe, which culminates in detectable impacts on the near-surface climate. Jiang et al. (2015) suggested that (i) climate in the northern North Atlantic regions follows SA [solar activity] fluctuations on multidecadal to centennial time scales, and (ii) it is more susceptible to the influence of those fluctuations throughout cool periods with, for instance, less vigorous ocean circulation. Similar results were found by Gómez-Navarro et al. (2012) in the context of climate simulations for the second millennium over the Iberian Peninsula, recognizing that temperature and precipitation variability is significantly affected at centennial time scales by variations in the SA [solar activity].”
“Grand Minima and Dalton-type Minimum scenarios are broadly characterized by (i) lower TSI (i.e., lower available PAR) (Lean, 1991, and references therein), (ii) development of cloudiness (e.g., Usoskin and Kovaltsov, 2008), and (iii) decreased global/regional air surface temperatures (e.g., Neukom et al., 2014) in tandem with greater regional precipitation variability.”
“The connections between solar phenomena and the lower atmosphere processes can be explained by two kind of mechanisms: (i) “top-to-down”, influencing the pole-to-equator temperature gradient and exerting an impact on the modulation of the atmospheric circulation cells, weakening or strengthening the zonal winds, and (ii) “bottom-to up” that directly impact on the radiation fluxes, energy balance and temperatures on the ground. Both finally impact the atmospheric circulation modes responsible for the global/regional precipitation and temperature patterns (e.g., Gray et al., 2010; Martin-Puertas et al., 2012; Thiéblemont et al., 2015).”
17. Lihua, 2017
“The modulation action from solar activity plays an important role in the temperature change, and there is a possible association existing in the global land-ocean temperature and solar activity on decade time scales. … About 11-year period, a remarkable oscillation of solar activity, continually exists in wavelet transform of solar variation. According to the cross wavelet transform, solar activity influences global land-ocean temperature change on ~11-year time scales during 1935-1995 with above the 5 % significance level.”
‘A Large Proportion Of [Recent] Climate Variations…Explained By TSI And Cosmic Rays’
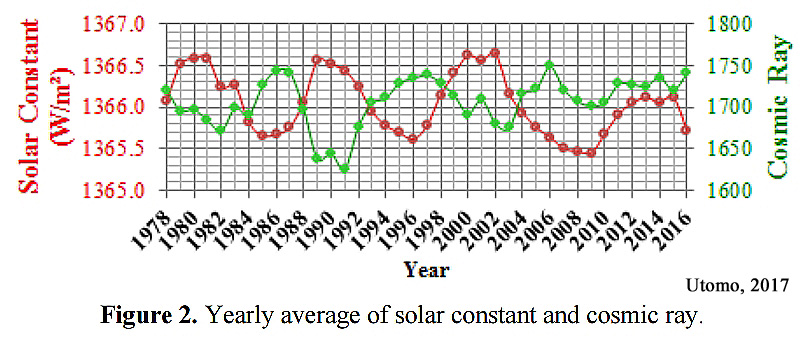
18. Utomo, 2017
“A similar result was also found for the relationship between solar activity and cosmic ray flux with a negative correlation, i.e. 0.69/year. When solar activities decrease, the clouds cover rate increase due-0.61/month and – to secondary ions produced by cosmic rays. The increase in the cloud cover rate causes the decrease in solar constant value and solar radiation on the earth’s surface [cooling]. … The increase in the formation rate of cloud would affect the decrease in the intensity of solar radiation reaching the Earth’s surface. The relationship between cosmic rays and solar constant is an “opposite” relationship because of the negative correlation type (r < 0). The phenomenon of “opposite” is in a good agreement with the result by Svensmark (1997) who found a correlation between temperature and global cloud coverage with the cosmic rays. … [T]he climate also depends on variations in the flux of solar energy received by the earth’s surface. Variation in the solar energy flux is caused by variations in solar activity cycle. Thus the climate is a manifestation of how solar radiation is absorbed, redistributed by the atmosphere, land and oceans, and ultimately radiated back into space. Every variation of solar energy received at the earth’s surface and reradiated by the earth into space will have a direct impact on climate change on Earth.”
19. Biktash, 2017
“The effects of total solar irradiance (TSI) and volcanic activity on long-term global temperature variations during solar cycles 19–23 [1954-2008] were studied. It was shown that a large proportion of climate variations can be explained by the mechanism of action of TSI [total solar irradiance] and cosmic rays (CRs) on the state of the lower atmosphere and other meteorological parameters. … Recent studies by Pudovkin and Raspopov, Tinsley, and Swensmark have shown that the Earth’s cloud coverage is strongly influenced by cosmic ray intensity. Conditions in interplanetary space, which can influence GCRs and climate change, have been studied in numerous works. As has been demonstrated by Biktash, the long-term CR count rate and global temperature variations in 20–23 solar cycles are modulated by solar activity and by the IMF (interplanetary magnetic field). A possible geophysical factor which is able to affect the influence of solar activity on the Earth’s climate is volcanism. The effects of volcanism can lead to serious consequences in the atmosphere and the climate.”
+2 W m-2 Per Decade Surface Solar Radiation Forcing From 1983-2013


Pulling it all together, this is what happens:
http://joannenova.com.au/2015/01/is-the-sun-driving-ozone-and-changing-the-climate/
DR. Lief Svalgaard, seems to think it is all nonsense, to the point of being irrationally obstinate. I wonder why he as a solar scientist be like this?
Because his entire career rides on the assumption that the models of solar activity and solar influence on the Earth system that he considers accurate are, indeed, accurate. When others find results that don’t match his (for example, Dr. Scafetta), he retreats to the argument-from-authority position: We’re right because there are more of us who know we’re right – and those other guys are wrong. I’ve had conversations with him a few times and essentially that’s what it comes down to (close-mindedness). He thinks everyone else who doesn’t agree with him is spewing nonsense.
Here at this Jo Nova post,where Dr. Svalgaard shot himself down over and over with his stupid arguments, in reply to David and Jo over the TSI numbers:
More strange adventures in TSI data: the miracle of 900 fabricated, fraudulent days
http://joannenova.com.au/2014/07/more-strange-adventures-in-tsi-data-the-miracle-of-900-fabricated-fraudulent-days/
ohh I see you have been there in the comments,notice that he dodged you a lot.
He is a miserable man.
In this from last September is more of Dr. Svaalgard’s baloney,with his irrational obsession of Dr. Evans TSI data choice:
New Science 26: The solar fall and the delay means David Evans’ predicted global cooling could be just around the corner
http://joannenova.com.au/2016/09/new-science-26-the-solar-fall-and-lag-means-david-evans-model-predicts-cooling-is-just-around-the-corner/
Example:
““We expect Leif Svalgaard to continue to deny there was a fall.”
And indeed, there was no fall. Here is the newest official NOAA Climate Data Record from Lean and Colleagues:
http://joannenova.com.au/2016/09/new-science-26-the-solar-fall-and-lag-means-david-evans-model-predicts-cooling-is-just-around-the-corner/#comment-1840322
===================================================
Then he goes to his OWN link to support his claim, funny!
I have been watch Leif for a long time.
He actually “flagged” that he was going to smooth out and make changes to the TSI data a couple of years before he started pushing and bullying his cohorts into accepting his “adjustments”
He is actually no better than Tom Wiggly and crew.
Note that it is absolutely essential for survival of the AGW gravy train, that solar effects are discounted.
That has been Leif’s job.
http://joannenova.com.au/2014/07/more-strange-adventures-in-tsi-data-the-miracle-of-900-fabricated-fraudulent-days/
Wow, I hadn’t remembered much of that. Got pretty dicey between Leif and I in #78.
878 comments!
Dr. Evans, sent me a big thank you e-mail, about my comment wrote to Dr. Svalgaard.
Eye opening discussion! I had believed that Dr Svalgaard probably had the best data until going through the thread. His ego is desperately fighting for validation through his contribution to data set “improvement”.
The thread exposes him as a true scoundrel who is primarily interested in his own self importance at the expense of science.
One last time,to show why I don’t think Svaalgard is a credible source on Solar to climate effects:
http://jo.nova.s3.amazonaws.com/guest/david-evans/26/fig2b.jpg
Figure 2: Various measures of sunspots or TSI, all 11 year-smoothed (averaged over a centered 11-year window, to eliminate the effect of an 11-year cycle). The TIM is the latest instrument for measuring TSI, but only started in Jan. 2003, too late to cast smoothed light on 2004. The SORCE/TIM reconstruction by Kirvova is preferred by the IPCC in AR5, and the reconstruction from Leif Svalgaard in mid 2014 is similar.
http://joannenova.com.au/2016/09/new-science-26-the-solar-fall-and-lag-means-david-evans-model-predicts-cooling-is-just-around-the-corner/
=====================================================
Yet he has been denying that TSI has had a big fall recently,even his OWN research shows it, but then denies it is happening.
What a confused man…..
I don’t think he’s confused as much as he is obstinate and close-minded. Willis E. from WUWT is similar with regard to his position on the solar influence on climate.
When it comes to solar science, few want to admit that this is still an evolving knowledge base, and that we still know very little.
The sun drives the climate and CO2’s entirely natural variation is an effect of it. How the sun’s variation causes all the natural variations on this planet has yet to be fully explained. As science is currently distracted away by uninformed politicians (and big business) with an unproven theory that human produced CO2 is somehow dangerous.
It would be laughable if not so much money was wasted on such an obviously flawed theory.
“uninformed politicians (and big business)”
I think the issue came from those we now call social justice warriors- SJW – (perhaps the East German communists-greens (I recall Pierre Gosselin documenting this a couple of years ago). Via the United Nations, the idea of using global warming as a stick to beat wealthy nations into redistributing wealth was written into the IPPC founding documents.
This has nothing to do with science, so even if Sun-Earth variations are fully explained, the SJW and those wanting a piece of the $100 Billion Slush Fund (aka Green Climate Fund) …
Slush Fund
… will pay no attention to the science.
Still, I hope the science does make some headway before I check out.
Alternatively there is a popular belief in an unproven theory that the human caused part of the increase in rare atmospheric gas CO2, will overwhelm all other climatic factors and cause the climate to change catastrophically.
It’s really laughable, if only it did not cost so much.
How can the sun not be linked to climate change? It and geothermal are the only major source of energy input? The sun’s output and its angle to the earth determine the seasons and temperature differentials between day and night. The sun is the only way to set an all-time high in temperatures, by definition that requires new energy input.
Climate “Science” on Trial; Cherry Picking Locations to Manufacture Warming
https://co2islife.wordpress.com/2017/02/18/a-tale-of-two-cities-cherry-picking-locations-to-manufacture-warming/
According to NASA’s Gavin Schmidt, the Sun has not played a role in climate change since 1950, as humans have caused 110% of the climate change since then.
And he’s a mathematician.
[…] – See more at: notrickszone.com […]
Politics may be pivoting away from the UN pray book at least in America
28 Apr: Reuters: Exclusive: Trump says U.S. wants fair treatment in climate pact
By Stephen J. Adler, Steve Holland and Jeff Mason
(Writing by David Brunnstrom; Editing by Howard Goller)
President Donald Trump complained on Thursday that the United States was being unfairly treated in the Paris Climate Agreement and told Reuters he would announce a decision in about two weeks on whether Washington would remain in the accord…
Trump, who will mark the 100th day of his presidency on Saturday, told Reuters in an interview he would announce his decision “in about two weeks,” but complained that China, India, Russia and other countries were paying too little to help poorer countries battle climate change under the agreement’s Green Climate Fund.
“It’s not a fair situation because they are paying virtually nothing and we are paying massive amounts of money,” he said.
Asked for a hint of what his decision might be, he said: “I can say this, we want to be treated fairly.”…
~~~~~~~~~~~~~~~~~~~~~
28 Apr: Fox News: Jade Scipioni: Congress Members Urge Trump to Re-Work Paris Agreement
“As you know, President Obama pledged a 26 to 28% reduction in U.S. greenhouse gas emission by 2025, compared to a 2005 baseline,” the Congress members wrote in a letter addressed to Trump.
“This target would cause irreparable harm to our economy, particularly our manufacturing and energy sectors, and should be rejected.”…
They say the U.S. should instead present a new pledge that doesn’t harm our economy but instead showcases plans to drive technological innovation to help ensure a future for fossil fuels within the context of the global climate agenda. Additionally, they advise Trump to not make any additional transfers to the Green Climate Fund…
Representatives Kevin Cramer (R-ND), Mike Kelly (R-PA), Virginia Foxx (R-NC), Larry Bucshon (R-IN), Markwayne Mullin (R-OK), Billy Long (R-MO), Chris Collins (R-NY), Gregg Harper (R-MS), and Earl L. “Buddy” Carter (R-GA) all signed the letter.
Next move to defund the UN? I live in hope…
[…] Kenneth Richard, April 27, […]