Scientists: It’s The Sun
“The emerging causal effects from SS [solar activity] to GT [global temperatures], especially for recent decades, are overwhelmingly proved” – Huang et al., 2017
“Climate … follows SA [solar activity] fluctuations on multidecadal to centennial time scales” – Moreno et al., 2017
“The solar ‘activity’ increase is the chief driver of the global temperature increase since the LIA [Little Ice Age]” – Page, 2017
“A large proportion of climate variations can be explained by the mechanism of action of TSI [total solar irradiance] and cosmic rays (CRs) on the state of the lower atmosphere and other meteorological parameters” – Biktash, 2017
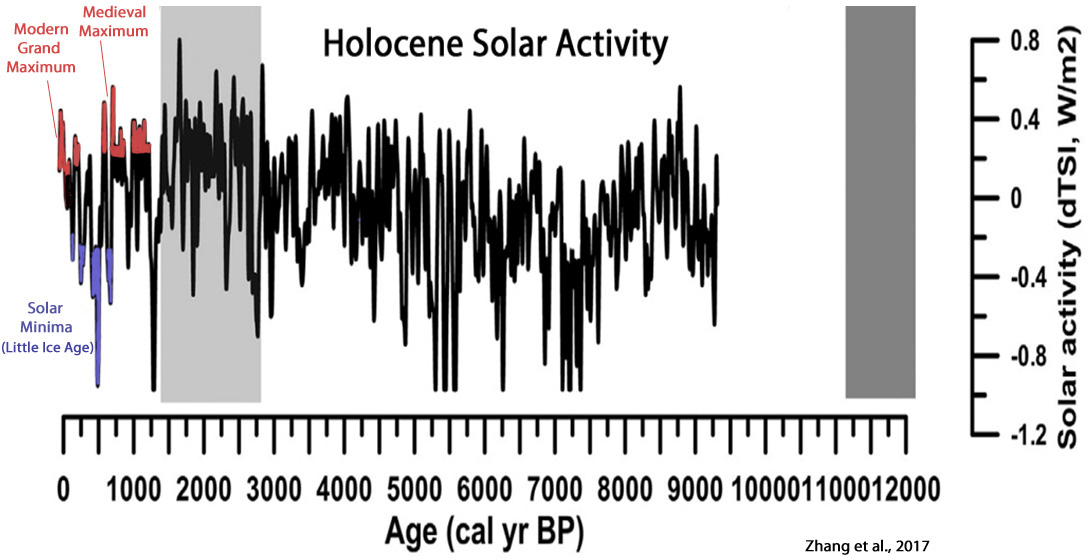
“The activity level of the Modern Maximum (1940–2000) is a relatively rare event, with the previous similarly high levels of solar activity observed 4 and 8 millennia ago” – Yndestad and Solheim, 2017
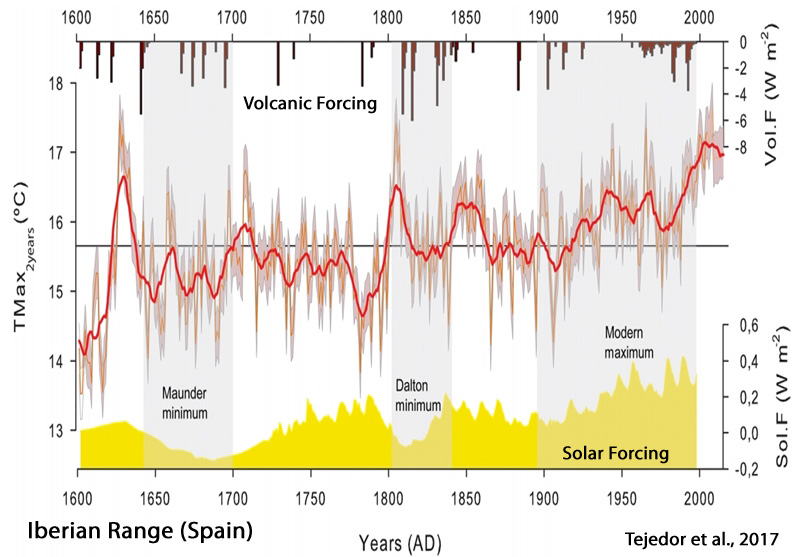
“The main driver of the large-scale character of the warm and cold episodes may be changes in the solar activity. Four warm periods – 1626–1637, 1800–1809, 1845– 1859, and 1986–2012 – have been identified to correspond to increased solar activity” – Tejedor et al., 2017
Solar Forcing As Significant Temperature/Climate Driver
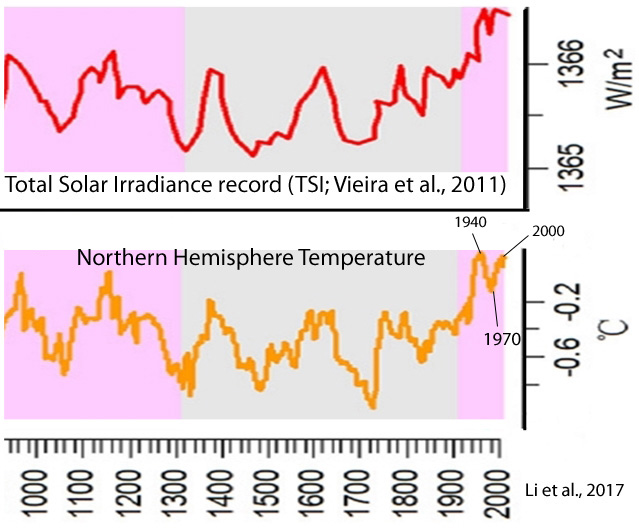
Li et al., 2017 It has been widely suggested from both climate modeling and observation data that solar activity plays a key role in driving late Holocene climatic fluctuations by triggering global temperature variability and atmospheric dynamical circulation … The strengthened solar activity could be significantly amplified by the variations in ultraviolet radiation as well as clouds, resulting in the marked variability in global surface temperature. … … [O]verall solar-dominated long-term control.
Huang et al., 2017 (full) Various scientific studies have investigated the causal link between solar activity (SS) and the earth’s temperature (GT). [T]he corresponding CCM [Convergent Cross Mapping] results indicate increasing significance of causal effect from SS [solar activity] to GT [global temperature] since 1880 to recent years, which provide solid evidences that may contribute on explaining the escalating global tendency of warming up recent decades. … The connection between solar activity and global warming has been well established in the scientific literature. For example, see references [1–10]. … Among which, the SSA [Singular Spectrum Analysis] trend extraction is identified as the most reliable method for data preprocessing, while CCM [Convergent Cross Mapping] shows outstanding performance among all causality tests adopted. The emerging causal effects from SS [solar activity] to GT [global temperatures], especially for recent decades, are overwhelmingly proved, which reflects the better understanding of the tendency of global warming.
Blaauw, 2017 This paper demonstrates that global warming can be explained without recourse to the greenhouse theory. This explanation is based on a simple model of the Earth’s climate system consisting of three layers: the surface, a lower and an upper atmospheric layer. The distinction between the atmospheric layers rests on the assumption that the latent heat from the surface is set free in the lower atmospheric layer only. The varying solar irradiation constitutes the sole input driving the changes in the system’s energy transfers.

Wen et al., 2017 A warmer and wetter climate prevailed since ∼4800 a BP and was interrupted by a sharp cold reversal at approximately 3300 a BP that was likely caused by solar irradiance forcing, which resulted in a global cold climatic change and glacier advance.
Xiao et al., 2017 Solar wind and electric-microphysical process is the key mechanism that affects climate … [T]he wintertime Iceland Low in the North Atlantic was very sensitive to solar wind variations and played an important role in the process of solar wind and electric-microphysical effects on climate. Tinsley and Zhou (2015) improved the collision and parameterization scheme that varied with electric quantity in a cloud microphysics process and quantitatively evaluated the effects of high-energetic particle flux on cloud charge. This achievement not only supports the marked association of solar activity with weather and climate change on various time scales, but also but also avails the quantitative accession of solar impacts on climate.
Allan et al., 2017 A deeper analysis reveals several periods of significant rapid climate change during the Holocene (at 10.7-9.2 ka, 8.2-7.9 ka, 7.2-6.2 ka, 4.8-4.5 ka, and 3-2.4 ka BP), which are similar to the cold events detected from different natural paleoclimate archivers. A comparison between the geochemical analysis of Père Noël speleothem and solar activity (sunspot number) reveals a significant correlation. Spectral analysis methods reveal common solar periodicities (Gleissberg cycle, de Vries cycle, unnamed 500 year, Eddy cycles, and Hallstatt cycle). The geochemical analyses have the potential to prove that PN speleothem is sensitive to changes in solar activity on centennial and millennial timescales during the Holocene.
Lihua, 2017 The modulation action from solar activity plays an important role in the temperature change, and there is a possible association existing in the global land-ocean temperature and solar activity on decade time scales. … About 11-year period, a remarkable oscillation of solar activity, continually exists in wavelet transform of solar variation. According to the cross wavelet transform, solar activity influences global land-ocean temperature change on ~11-year time scales during 1935-1995 with above the 5 % significance level.
Park, 2017 Late Holocene climate change in coastal East Asia was likely driven by ENSO variation. Our tree pollen index of warmness (TPIW) shows important late Holocene cold events associated with low sunspot periods such as Oort, Wolf, Spörer, and Maunder Minimum. Comparisons among standard Z-scores of filtered TPIW, ΔTSI, and other paleoclimate records from central and northeastern China, off the coast of northern Japan, southern Philippines, and Peru all demonstrate significant relationships [between solar activity and climate]. This suggests that solar activity drove Holocene variations in both East Asian Monsoon (EAM) and El Niño Southern Oscillation (ENSO). In particular, the latter seems to have predominantly controlled the coastal climate of East Asia to the extent that the influence of precession was nearly muted during the late Holocene.
Ogurtsov et al., 2017 Significant correlation was found between SST [sea surface temperatures] in NA [the North Atlantic] and solar activity (both instrumental data and proxies) during AD 1716–1986. … Thus, the connection between Northern Fennoscandian climate and solar activity, which has been previously established at century-scale (Ogurtsov et al., 2001, 2002, 2013) and millennial-scale (Helama et al., 2010), is confirmed for AD 1716–1986 over the entire frequency range using unfiltered records (with the exception for AMO reconstruction after Mann et al. (2009)). … Changes in solar ultra-violet (UV) radiation might provide a solar-climatic link over Northern Europe. Actually, modeling work by (Ineson et al., 2011) showed that that solar UV (200-320 nm) decadal variability drives appreciable temperature changes in mesosphere and upper stratosphere largely through absorption of UV by ozone. This variation results in a corresponding change in the pattern of stratospheric winds, which propagates downwards and appreciably influences atmospheric circulation over the North Atlantic basin. Studies using an atmosphere–ocean coupled climate model have shown that solar-induced changes in atmospheric circulation also influence changes of heat storage in North Atlantic Ocean that can integrate and amplify solar effect (Ineson et al., 2011; Scaife et al., 2013).
Moreno et al., 2017 Understanding the Sun-Earth’s climate coupling system is both an essential and an urgent issue, with great progress achieved over the last decades (e.g., Haigh, 2007; Soon et al., 2014 for a review). Recently, Brugnara et al. (2013) referred that the Euro–Atlantic sector, in which Portugal is located, seems to be a region with a particularly strong solar influence on the troposphere, finding a significant change in the mean late winter circulation over Europe, which culminates in detectable impacts on the near-surface climate. Jiang et al. (2015) suggested that (i) climate in the northern North Atlantic regions follows SA [solar activity] fluctuations on multidecadal to centennial time scales, and (ii) it is more susceptible to the influence of those fluctuations throughout cool periods with, for instance, less vigorous ocean circulation. Similar results were found by Gómez-Navarro et al. (2012) in the context of climate simulations for the second millennium over the Iberian Peninsula, recognizing that temperature and precipitation variability is significantly affected at centennial time scales by variations in the SA [solar activity]. … Grand Minima and Dalton-type Minimum scenarios are broadly characterized by (i) lower TSI (i.e., lower available PAR) (Lean, 1991, and references therein), (ii) development of cloudiness (e.g., Usoskin and Kovaltsov, 2008), and (iii) decreased global/regional air surface temperatures (e.g., Neukom et al., 2014) in tandem with greater regional precipitation variability.
Matveev et al., 2017 An increase in atmospheric moisture for the warm period of the year (May–September) since 1890s, and mean annual temperatures since the 1950s was identified. During the same time period, there was a marked increase in amplitude of the annual variations for temperature and precipitation. … These fluctuations are consistent with 10–12-years Schwabe–Wolf, 22-years Hale, and the 32–36-years Bruckner Solar Cycles. There was an additional relationship found between high-frequency (short-period) climate fluctuations, lasting for about three years, and 70–90-years fluctuations of the moisture regime in the study region corresponding to longer cycles.
Schwander et al., 2017 Influence of solar variability on the occurrence of Central European weather types from 1763 to 2009 … Weather types and reanalysis data show that the 11-year solar cycle influences the late winter atmospheric circulation over Central Europe with colder (warmer) conditions under low (high) solar activity. Model simulations used for a comparison do not reproduce the imprint of the 11-year solar cycle found in the reanalyses data. … Atmospheric circulation over Europe is strongly correlated to the NAO and hence solar activity is thought to have an influence on weather conditions in Europe in winter. Studies show a preference of cold winters in Europe to be associated with minima in the 11-year solar cycle (e.g., Lockwood et al., 2010; Sirocko et al., 2012). … The 247-year long analysis [1763-2009] of the 11-year solar cycle impact on late winter European weather patterns suggest a reduction in the occurrence of westerly flow types linked to a reduced mean zonal flow under low solar activity. Following these observation, we estimate the probability to have cold conditions in winter over Europe to be higher under low solar activity than under high activity. Also similar [cold] conditions can occur during periods of prolonged reduced total solar irradiance. … Solar activity can have effects on the atmospheric circulation through three different mechanisms. These effects may arise from direct changes in total solar irradiance (TSI), from changes in stratospheric ozone induced by changes in solar UV, or from changes in stratospheric ozone induced by energetic particles, whose flux is modulated by solar activity. The ~1 Wm-2 variation in TSI over an 11-yr sunspot cycle corresponds to a change in the radiation forcing of about ~0.17 Wm-2.
Wang et al., 2017 The identification of causal effects is a fundamental problem in climate change research. Here, a new perspective on climate change causality is presented using the central England temperature (CET) dataset, the longest instrumental temperature record, and a combination of slow feature analysis and wavelet analysis. The driving forces of climate change were investigated and the results showed two independent degrees of freedom —a 3.36-year cycle and a 22.6-year cycle, which seem to be connected to the El Niño–Southern Oscillation cycle and the Hale sunspot cycle, respectively.
Page, 2017 Earth’s climate is the result of resonances and beats between various quasi-cyclic processes of varying wavelengths. … Data related to the solar climate driver are discussed and the solar cycle 22 low in the neutron count (high solar activity) in 1991 is identified as a solar activity millennial peak and correlated with the millennial peak – inversion point – in the RSS temperature trend in about 2004. The cyclic trends are projected forward and predict a probable general temperature decline in the coming decades and centuries. … Unless the range and causes of natural variation, as seen in the natural temperature quasi-periodicities, are known within reasonably narrow limits, it is simply not possible to even begin to estimate the effect of anthropogenic CO2 on climate. Given the lack of any empirical CO2-climate connection reviewed earlier and the inverse relationship between CO2 and temperature [during the Holocene, when CO2 rose as temperatures declined] seen in Figure 2, and for the years 2003.6–2015.2 in Figure 4, during which CO2 rose 20 ppm, the simplest and most rational working hypothesis is that the solar ‘activity’ increase is the chief driver of the global temperature increase since the LIA.
Biktash, 2017 The effects of total solar irradiance (TSI) and volcanic activity on long-term global temperature variations during solar cycles 19–23 [1954-2008] were studied. It was shown that a large proportion of climate variations can be explained by the mechanism of action of TSI [total solar irradiance] and cosmic rays (CRs) on the state of the lower atmosphere and other meteorological parameters. … Recent studies by Pudovkin and Raspopov, Tinsley, and Swensmark have shown that the Earth’s cloud coverage is strongly influenced by cosmic ray intensity. Conditions in interplanetary space, which can influence GCRs and climate change, have been studied in numerous works. As has been demonstrated by Biktash, the long-term CR count rate and global temperature variations in 20–23 solar cycles [1960s-2000s] are modulated by solar activity and by the IMF (interplanetary magnetic field). A possible geophysical factor which is able to affect the influence of solar activity on the Earth’s climate is volcanism. The effects of volcanism can lead to serious consequences in the atmosphere and the climate.
Schmutz, 2017 For the first time, model calculations show a plausible way that fluctuations in solar activity could have a tangible impact on the climate. Studies funded by the Swiss National Science Foundation expect human-induced global warming to tail off slightly over the next few decades. A weaker sun could reduce temperatures by half a degree.
Kitaba et al., 2017 The weakening of the geomagnetic field causes an increase in galactic cosmic ray (GCR) flux. Some researchers argue that enhanced GCR flux might lead to a climatic cooling by increasing low cloud formation, which enhances albedo (umbrella effect). Recent studies have reported geological evidence for a link between weakened geomagnetic field and climatic cooling. … Greater terrestrial cooling indicates that a reduction of insolation [solar radiation reaching the surface] is playing a key role in the link between the weakening of the geomagnetic field and climatic cooling. The most likely candidate for the mechanism seems to be the increased albedo of the umbrella effect.
Lu et al., 2017 Ozone absorption of solar radiation in the ultraviolet (UV) band is known to affect upper atmospheric chemistry and temperature, and thus its circulation via photochemical, radiative and dynamical interactions (Brasseur and Solomon 2005). The enhanced UV forcing during high solar (HS) activity years leads to a 2-4% increase of annual mean stratospheric ozone and ~1 K increase of annual mean temperature in the equatorial upper stratosphere and lower mesosphere (e.g. Haigh 1994; Scaife et al. 2000; Hood 2004; Frame and Gray 2010; Chiodo et al. 2012; Hood and Soukharev 2012; Remsberg 2014; Mitchell et al. 2014, Hood et al. 2015). … Studies show that a regional circulation pattern in the Northern Hemispheric (NH) winter that resembles the positive phase of the North Atlantic Oscillation (NAO) occur during HS [high solar activity] winters (e.g. Ruzmaikin and Feynman 2002; Kodera 2002; Woollings et al. 2010a; Lockwood et al. 2010; Ineson et al. 2011; Gray et al. 2013; 2016). A number of different mechanisms have been proposed to explain the solar-NAO connection.
Du et al., 2017 Although the global warming has been successfully attributed to the elevated atmospheric greenhouses gases, the reasons for spatiotemporal patterns the warming rates are still under debate. In this paper, we report surface and air warming based on observations collected at 1,977 stations in China from 1960 to 2003. Our results show that the warming of daily maximum surface (Ts-max) and air (Ta-max) temperatures showed a significant spatial pattern, stronger in the northwest China and weaker in South China and the North China Plain. These warming spatial patterns are attributed to surface shortwave solar radiation (SSR) and precipitation, the key parameters of surface energy budget.
Ogurtsov et al., 2017 It is widely accepted also that this global warming is caused primarily by anthropogenic increase of greenhouse gases concentration . However debates on this question still continues. Some experts maintain that current warming does not exceed the natural fluctuations of climate. Evidence of appreciable contribution to global warming of non-greenhouse factors has been obtained by many authors. Soon et al., 2015 noted that if the urbanization effect is properly taken into account, one can conclude that solar variability is the dominant factor of Northern Hemisphere long-term temperature changes since at least 1881. Zhao and Feng, 2014 reported that variations in solar activity play an important role in changes of climate over global scale during the last more than 100 years. According to Harde (2014), the Sun is the main contributor to global warming of the last century. … [I]t is reasonable to regard the global warming as a phenomenon exceptional from the point of view of intrinsic climatic oscillations, which need an additional external forcing factor for explanation. On the other hand, the statistical experiments showed that an appreciable part of the global warming might be a result of natural fluctuations of climatic system. … [O]ur results show that the contribution of these external factors (including greenhouse effect) to the global warming could be less than is often believed. … Changes in the solar radiation at the Earth’s surface (global brightening) might be important source of the warming of the last decades (Ogurtsov et al., 2012).
Chen et al., 2017 The 11-year cycle suggests the influence of sunspot activity (Hale, 1924) on streamflow variations in the Tien Shan. The impact of variations in solar activity on streamflow series and other climate phenomena have been reported from North America and Europe, based on instrumental records (Zanchettin et al., 2008; Perry, 2006 ; Prokoph et al., 2012). A strong positive correlation was also found between solar activity and streamflow in South American rivers (Mauas et al., 2011). … To further investigate the links between the solar activity and streamflow of the Tien Shan, we examined the relationship between PC1 and the number of sunspots, using correlation and wavelet coherency analyses. A significant linkage was found at the quasi-11-year scale from the 1700–2000s.
Orme et al., 2017 The north-south index shows that storm tracks moved from a southern position to higher latitudes over the past 4000 yr, likely driven by a change from meridional to zonal atmospheric circulation, associated with a negative to positive North Atlantic Oscillation shift. We suggest that gradual polar cooling (caused by decreasing solar insolation in summer and amplified by sea-ice feedbacks) and mid-latitude warming (caused by increasing winter insolation) drove a steepening of the winter latitudinal temperature gradient through the late Holocene, resulting in the observed change to a more northern winter storm track.
Woodson et al., 2017 Variations in the East Asian Monsoon (EAM) and solar activity are considered as potential drivers of SST trends. However, hydrology changes related to the El Nino-Southern Oscillation (ENSO) variability, ~ shifts of the Western Pacific Warm Pool and migration of the Intertropical Convergence Zone are more likely to have impacted our SST temporal trend. … The SA [solar activity] trends (Steinhilber et al., 2012) are in general agreement with the regional cooling of SST (Linsley et al., 2010) and the SA [solar activity] oscillations are roughly coincident with the major excursions in our SST data.
Gray et al., 2017 There are several proposed mechanisms through which the 11-year solar cycle (SC) could influence the Earth’s climate, as summarised by Figure 1. These include: (a) the direct impact of solar irradiance variability on temperatures at the Earth’s surface, characterised by variation in the total incoming solar irradiance (TSI); (b) the indirect impact of variations through the absorption of Ultra-Violet (UV) radiation in the upper stratosphere associated with the presence of ozone, with accompanying dynamical responses that extend the impact to the Earth’s surface; (c) the indirect impact of variations in energetic particle fluxes into the thermosphere, mesosphere and upper stratosphere at high geomagnetic latitudes; and (d) the impact of variations in the generation of ions by galactic cosmic ray (GCR) penetration into the troposphere. Although different in their nature, these four pathways may not work in isolation but their influence could be synergetic.
Li et al., 2017 The main driving forces behind the Holocene climatic changes in the LYR [Lower Yangtze Region, East China] area are likely summer solar insolation associated with tropical or subtropical macro-scale climatic circulations such as the Intertropical Convergence Zone (ITCZ), Western Pacific Subtropical High (WPSH), and El Niño/Southern Oscillation (ENSO).
Li et al., 2017 Correlations between paleotemperature records from the North Atlantic and solar activity suggest that changes in solar output may cause significant shifts in the climate of the North Atlantic region. The model results show a strong positive correlation between SST and solar irradiance in the pathway of the IC, indicating that a reduced frequency of Atlantic blocking events during periods of high solar irradiance promotes warmer and saltier conditions in the pathway of the IC due to stronger circulation of the subpolar gyre. … Spectral analyses indicate that significant centennial-scale variations are superimposed on the long-term orbital trend. The dominant periodicities are 529, 410, and 191 years, which may be linked to the well-known 512- and 206-year solar cycles. Cross-correlation analyses between the summer SSTs and total solar irradiance through the last 5000 years indicate that the records are in phase, providing evidence that variations in solar activity impacted regional summer SST variability. Overall, the strong linkage between solar variability and summer SSTs is not only of regional significance, but is also consistent over the entire North Atlantic region.
Chang et al., 2017 The variability of solar activity is likely an important driver of summer temperatures, either directly or by modifying the strength and intensity of the Indian Ocean Summer Monsoon. … We observed a relatively long-lasting summer cooling episode (c. 0.8°C lower than the 5000-year average) between c. 270 cal. BP and AD c. 1956. … The record shows cooling episodes occurred at c. 3100, 2600, 2100 and 1600 cal. BP. This is likely related to the period defined as the Northern Hemisphere Little Ice Age (LIA; c. AD 1350–1850, equivalent to 600–100 cal. BP). These possibly relate to the 500-year quasi-periodic solar cycle. Cooling stages between c. 270 and 100 cal. BP were also recorded and these are possibly linked to the LIA suggesting a hemisphere-wide forcing mechanism for this event.
Harde, 2017 The IPCC denies any noticeable solar influence on the actual climate, although strong evidence of an increasing solar activity over the last century exists (see, e.g., Hoyt & Schatten [8]; Willson & Mordvinov [9]; Shapiro et al. [10]; Ziskin & Shaviv [11]; Scafetta & Willson [12]; Usoskin et al. [13]; Zhao & Feng [14]; Soon et al. [15]). … From these studies we conclude that the measured temperature increase of 0.74∘ C over the time 1880–2000 and the observed cloud changes of −4% over the period 1983– 2000 can best be explained by a cloud feedback mechanism, which is dominated by the solar influence.
Huo and Xiao, 2017 In Misios and Schmidt (2012), the ensemble simulations from an AOGCM showed that the tropical SST oscillates almost in-phase with the 11-year solar cycle. White and Liu (2008) also found the fluctuation of the upper ocean warming to be in-phase with TSI on the decadal scale during the twentieth century, governed by a resonant excitation of the tropical delay action oscillator and solar forcing, and the warming stage lagged the solar peak year by one to three years. … [P]atterns of OHC and potential temperature anomalies in the tropical Pacific are quite spatially symmetric in the ascending and declining phases, which seems phase-locked with the phases of the TSI cycle. The most significant regions of the OHC anomaly are locate just in the high correlation areas (beyond the 95% confidence level), which are ‘solar-sensitive’ regions with a clear quasi-11-year period.
Yukimoto et al., 2017 For the Pacific internal mode (Pacific Decadal Oscillation), the power is largest for the longer periods of the 15−25 year band (Minobe 1999). As the NAO has some power near the 11-year cycle, resonance may take place more easily. In fact, the numerical simulation of Thiéblemont et al. (2015) suggested a phase locking of the NAO with the 11-year solar cycle. The present result confirms the previous hypothesis reported by Kodera et al. (2016), which stated that the major solar influence on the Earth’s surface can be produced through changes in stratospheric circulation, and the spatial structure of the solar signal at the Earth’s surface is largely conditioned by atmosphere’s interaction with the ocean.
Fischel et al., 2017 On a Holocene timescale, we conclude that the northeastern Caribbean SST [sea surface temperatures] and circulation regime have been mainly dependent on the position of the ITCZ [inter-tropical convergence zone], which, in turn, is controlled by changes in hemispheric solar insolation. Caribbean climate is directly controlled by the position of the inter-tropical convergence zone (ITCZ), where converging NE and SE trade winds creates a lowpressure convection zone with high precipitation rates (Philader et al., 1996; Schmidt et al., 2006). In addition to the seasonal variations in the position of the ITCZ, the long-term N–S migration of the ITCZ is largely determined by decadal to millennial changes in solar forcing (Haug et al., 2001; Schneider et al., 2014).
Allan et al., 2017 The occurrence of significant solar periodicities (i.e., cycles of Gleissberg, de Vries, unnamed 500 years, Eddy and Hallstat) supports for an impact of solar forcing on PN speleothem trace elements contents. Moreover, several intervals of significant rapid climate change were detected during the Holocene at 10.3, 9.3-9.5, around 8.2, 6.4-6.2, 4.7-4.5, and around 2.7 ka BP. Those intervals are similar to the cold events evidenced in different natural paleoclimate archivers, suggesting common climate forcing mechanisms related to changes in solar irradiance.
Nan et al., 2017 Furthermore, our temperature records, within age uncertainty, coincides with the changes of the solar irradiance changes, suggesting a possible link between solar forcing and climate variability. … The relationship between the solar irradiance and climate change has been demonstrated by lots of studies (He et al., 2013; Kroonenberg et al., 2007; Sagawa et al., 2014; Soon et al., 2014). It was suggested that the solar activity was a primary driving force of climatic variations in the Holocene (Bond et al., 2001; Wang et al., 2005). Small solar perturbations can be magnified by different feedback mechanisms and may ultimately lead to climatic oscillations on several time scales, such as annual to decadal and/or centennial scales, as well as millennial scales (Haigh, 1996; Bond et al., 2001).
Zhang et al., 2017 The record suggests the summer temperature varies by ~2.5 °C across the entire period. A generally warmer period occurred between c.8500 and c.6000 cal yr BP and a cooling trend was initiated from c.5500 cal yr BP. The overall pattern broadly matches the summer insolation at 30N and the Asian Summer Monsoon records from the surrounding regions suggesting that summer temperatures from the southeast margin of the QTP respond to insolation forcing and monsoon driven variability on a multi-millennial time scale. Modifications of this overall trend are observed on the finer temporal resolution and we suggest that solar activity could be an important mechanism driving the centennial-scale variability.
Low Solar Activity –> Cold Periods, High Solar Activity –> Warm Periods
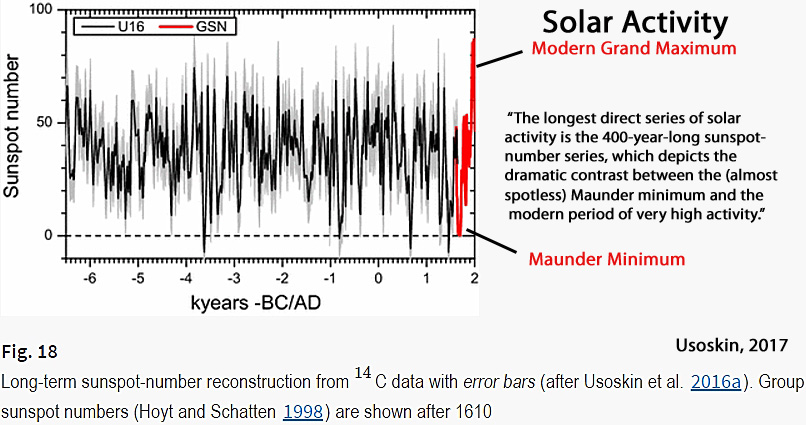
Usoskin, 2017 Another aspect is the link between solar-activity variations and the Earth’s climate … [I]t should be noted that the modern epoch was characterized, until the earlier 2000s by high solar activity dominated by an 11-year cyclicity … contrary to some predictions, a Grand minimum of activity has not started. Thus, we may experience, in the near future, the interplanetary conditions quite different with respect to those we got used to during the last decades. … The longest direct series of solar activity is the 400-year-long sunspot-number series, which depicts the dramatic contrast between the (almost spotless) Maunder minimum and the modern period of very high activity.
Yndestad and Solheim, 2017 Periods with few sunspots are associated with low solar activity and cold climate periods. Periods with many sunspots are associated with high solar activity and warm climate periods. … Deterministic models based on the stationary periods confirm the results through a close relation to known long solar minima since 1000 A.D. and suggest a modern maximum period from 1940 to 2015. The conclusion is that the activity level of the Modern Maximum (1940–2000) is a relatively rare event, with the previous similarly high levels of solar activity observed 4 and 8 millennia ago (Usoskin et al., 2003). Nineteen grand maxima have been identified by Usoskin et al. (2007) in an 11,000-yr series. The Maunder and the Dalton minima are associated with less solar activity and colder climate periods. The model computes a new Dalton-type sunspot minimum from approximately 2025 to 2050 and a new Dalton-type period TSI minimum from approximately 2040 to 2065.

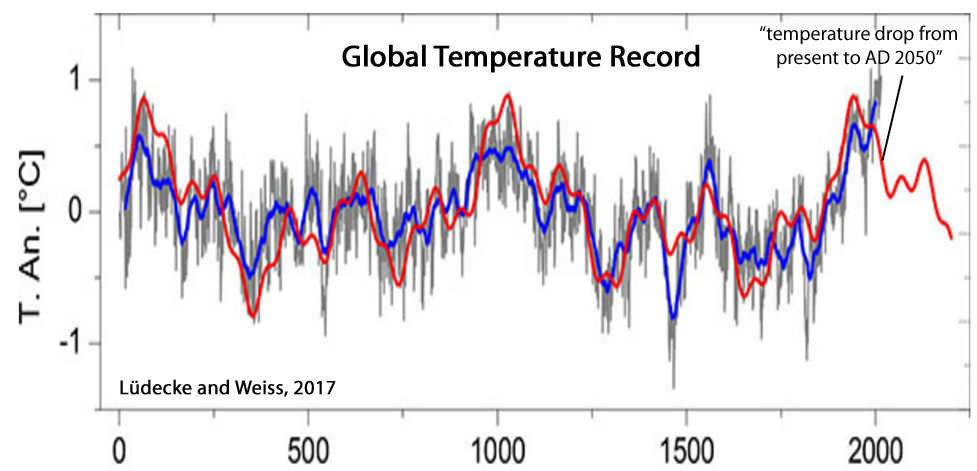
Lüdecke and Weiss, 2017 The Sun as climate driver is repeatedly discussed in the literature but proofs are often weak. In order to elucidate the solar influence, we have used a large number of temperature proxies worldwide to construct a global temperature mean G7 over the last 2000 years. The Fourier spectrum of G7 shows the strongest components as ~1000-, ~460-, and ~190 – year periods whereas other cycles of the individual proxies are considerably weaker. The G7 temperature extrema coincide with the Roman, medieval, and present optima as well as the well-known minimum of AD 1450 during the Little Ice Age. We have constructed by reverse Fourier transform a representation of G7 using only these three sine functions, which shows a remarkable Pearson correlation of 0.84 with the 31-year running average of G7 [global temperature over the last 2000 years]. The three cycles are also found dominant in the production rates of the solar-induced cosmogenic nuclides 14C and 10Be, most strongly in the ~190 – year period being known as the De Vries/Suess cycle. By wavelet analysis, a new proof has been provided that at least the ~190-year climate cycle has a solar origin. … G7 [global temperature over the last 2000 years], and likewise the sine representations have maxima of comparable size at AD 0, 1000, and 2000. We note that the temperature increase of the late 19th and 20th century is represented by the harmonic temperature representation, and thus is of pure multiperiodic nature [it is of natural solar origin]. It can be expected that the periodicity of G7, lasting 2000 years so far, will persist also for the foreseeable future. It predicts a temperature drop from present to AD 2050, a slight rise from 2050 to 2130, and a further drop from AD 2130 to 2200, upper panel, green and red curves).
Zharkova et al., 2017 Using a summary curve of two eigen vectors of solar magnetic field oscillations derived with Principal Components Analysis (PCA) from synoptic maps for solar cycles 21-24 as a proxy of solar activity, we extrapolate this curve backwards three millennia revealing 9 grand cycles lasting 350-400 years each. The summary curve shows a remarkable resemblance to the past sunspot and terrestrial activity: grand minima – Maunder Minimum (1645-1715 AD), Wolf minimum (1280-1350 AD), Oort minimum (1010-1050 AD) and Homer minimum (800 900 BC); grand maxima – modern warm period (1990-2015), medieval warm period (900-1200 AD), Roman warm period (400-10 BC) and others. … We confirm the occurrence of upcoming Modern grand minimum in 2020-2053, which will have a shorter duration (3 cycles) and, thus, higher solar activity compared to MM. … One of the examples of fitting incorrectly the oscillating function with a linear regression approach is shown by Akasofu (2010) (see her Fig. 9), when explaining the modern era recovery of the Earth from the little ice period and the incorrect use of a linear part of the temperature variations for the extremely incorrect prediction of the terrestrial temperature growth in the next century.
Tejedor et al., 2017 Reconstructed long-term temperature variations match reasonably well with solar irradiance changes since warm and cold phases correspond with high and low solar activity, respectively. … The main driver of the large-scale character of the warm and cold episodes may be changes in the solar activity. Four warm periods – 1626–1637, 1800–1809, 1845– 1859, and 1986–2012 – have been identified to correspond to increased solar activity.
Arppe et al., 2017 These negative shifts overlap with the latter part of a cooling known as the Dark Ages Cold Period (DACP, ca. 1500–1000 cal. yr BP; Bianchi and McCave, 1999; McDermott et al., 2001). The event is directly preceded by a minimum in total solar irradiation (Renssen et al., 2006; Steinhilber et al., 2009) … A wealth of proxy evidence testifies to the LIA [Little Ice Age] cooling, thought to have been triggered by reduced solar irradiance, extended volcanism, and internal characteristics of the ocean–atmosphere system (Miller et al., 2010, 2012; Wanner et al., 2011). … Factoring in respective age-model uncertainties, it appears that all major negative shifts, that is, ‘cold’ periods, in the δ18Olw record are roughly synchronous with periods of major negative anomalies in total solar irradiation and high modeled probabilities for extremely cold years in the Nordic Seas (Renssen et al., 2006), and widespread evidence of North Atlantic ‘cold spells’ (Bond et al., 2001; Sarnthein et al., 2003; Solomina et al., 2015; Wanner et al., 2008) linked to solar forcing.
Nan et al., 2017 The SST variation shows a millennial period of ~ 1500-yr and centennial periods of 131-yr and 113-yr. … Centennial periods dominated almost all of cold periods recorded in core BY14, implying the signature of solar irradiance cycles
Le Mouël et al., 2017 [S]olar activity contains an important component that has undergone clear oscillations of ≈90 years over the past three centuries, with some small but systematic longer-term evolution of “instantaneous” period and amplitude. Half of the variance of solar activity on these time scales can be satisfactorily reproduced as the sum of a monotonous multi-secular increase, a ≈90 -year Gleissberg cycle, and a double-peaked (≈10.0 and 11.0 years) Schwabe cycle (the sum amounts to 46% of the total variance of the signal). The Gleissberg-cycle component definitely needs to be addressed when attempting to build dynamo models of solar activity. The first SSA component offers evidence of an increasing long-term trend in sunspot numbers, which is compatible with the existence of the modern grand maximum.
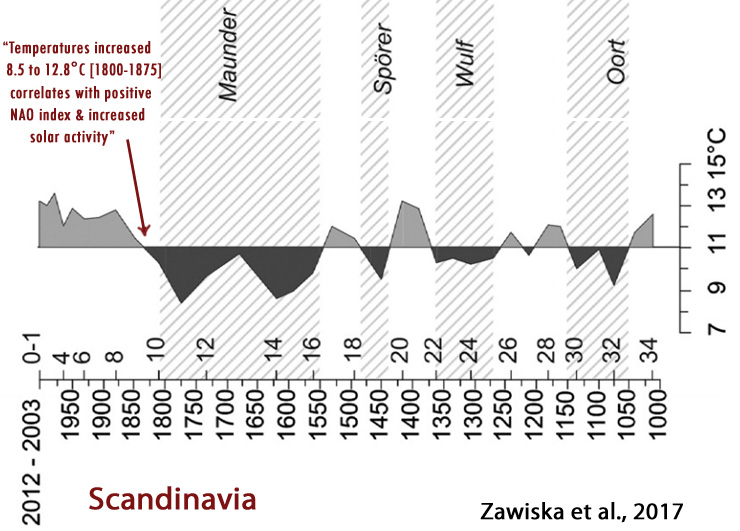
Zawiska et al., 2017 The three minor cooling periods were reconstructed in the first half of the Millennium: 1050–1150, 1270–1370, 1440–1470 CE, that coincide with solar activity minima: Oort, Wulf, and Spörer respectively. … At 1050–1150 CE the first of the short-term cooling periods of the last Millennium began and the mean July temperature in the Lake Atnsjøen region dropped to 9.2 °C. The beginning of this cooling coincided with the Oort solar activity minimum. The beginning of the 1270–1370 CE cooling coincide with Wulf solar activity minimum suggesting that the climate was responding to Sun activity. The climate cooling synchronous to this solar minimum had almost global range and it has been recorded from Europe, Arctic, North America and Antarctica (Osborn and Briffa, 2006; PAGES 2k Consortium, 2013) … The temperature reconstruction from Lake Atnsjøen indicates that recent and ongoing climate warming began already in 1800 CE following the LIA. Temperatures increased very fast, from 8.5 to 12.8 °C during the first 75 years [1800-1875], but in the 20th century the increase became less pronounced. … The warming at the beginning of 19th century […] correlates with the positive NAO index and increased solar activity.
Koutsodendris et al., 2017 The Little Ice Age (LIA) is marked by a multicentennial-long cooling (14th-19th centuries AD) that preceded the recent ‘global warming’ of the 20th century. The cooling has been predominantly attributed to reduced solar activity and was particularly pronounced during the 1645-1715 AD and 1790-1830 AD solar minima, which are known as Maunder and Dalton Minima, respectively.
Deng et al., 2017 The results indicate that the climate of the Medieval Climate Anomaly (MCA, AD 900–1300) was similar to that of the Current Warm Period (CWP, AD 1850-present), which contradicts previous studies. … The cold LIA period agrees with the timing of the Maunder sunspot minimum and is therefore associated with low solar activity.

Luoto and Nevalainen, 2017 Here, we use completely synchronized paleolimnological proxy-based records of air temperature and effective precipitation from two Scandinavian lakes with ∼2000-year sediment profiles. We show that the relationship between air temperature and precipitation (T/P ratio) is synchronous in both study sites throughout the records suggesting warm and dry conditions at ∼300–1100 CE and cold and wet conditions at ∼1200–1900 CE. Owing to the significantly increased air temperatures, the most recent T/P ratio has again turned positive. During the first millennium of the Common Era, the T/P mimics patterns in Southern Oscillation index, whereas the second millennium shows response to the NAO index but is also concurrent with solar irradiance shifts. [T]he causes for the LIA [Little Ice Age [1200-1900 CE], are not well defined owing to its highly variable nature (Wanner et al. 2011; Luoto and Nevalainen 2016; Zawiska et al. 2017). Yet, in addition to a persistent strongly negative NAO index phase during the LIA, it was most likely forced by decreased solar irradiance (including Spörer, Maunder and Dalton solar minima), increased volcanic activity (aerosols), and changes in Atlantic Ocean circulation patterns (Grove 2001; Goosse et al. 2005; Wanner et al. 2011).

Ge et al., 2017 This paper presents new high-resolution proxies and paleoclimatic reconstructions for studying climate changes in China for the past 2000 years. Multi-proxy synthesized reconstructions show that temperature variation in China has exhibited significant 50–70-yr, 100–120-yr, and 200–250-yr cycles. Results also show that the amplitudes of decadal and centennial temperature variation were 1.3◦C and 0.7◦C, respectively, with the latter significantly correlated with long-term changes in solar radiation, especially cold periods, which correspond approximately to sunspot minima. The most rapid warming in China occurred over AD 1870–2000, at a rate of 0.56◦ ± 0.42◦C (100 yr)−1; however, temperatures recorded in the 20th century may not be unprecedented for the last 2000 years, as data show records for the periods AD 981–1100 and AD 1201–70 are comparable to the present.
Helama et al., 2017 (full) Solar proxy data (Steinhilber et al., 2009) consistently illustrate low activity between AD 400 and 700, with a notable seventh-century solar minimum, the millennial-scale solar changes culminating over these centuries and thus during the DACP [Dark Ages Cold Period] (Scafetta, 2012). Interestingly, there is multiple proxy evidence showing that reduced solar activity may modulate the North Atlantic Oscillation (NAO) towards its negative phase (Gray et al., 2010). Since the NAO is a leading pattern of climate variability in the global atmosphere, and the negative NAO phase is generally associated with cooler temperatures particularly over western Europe and eastern North-America for both the winter (Wanner et al., 2001; Hurrell and Deser, 2010) and summer seasons (Folland et al., 2009), a prolonged negative NAO phase could thus result in cold temperatures at least over some parts of the Northern Hemisphere continents.
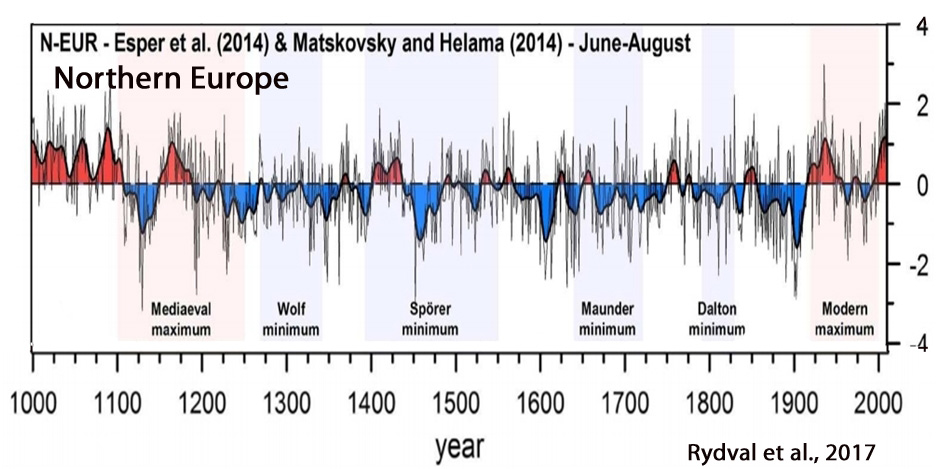
Rydval et al., 2017 [T]he recent summer-time warming in Scotland is likely not unique when compared to multi-decadal warm periods observed in the 1300s, 1500s, and 1730s … All six [Northern Hemisphere] records show a warmer interval in the period leading up to the 1950s, although it is less distinct in the CEU reconstruction. [E]xtreme cold (and warm) years observed in NCAIRN appear more related to internal forcing of the summer North Atlantic Oscillation. … There is reasonable agreement in general between the records regarding protracted cold periods which occur during the LIA and specifically around the Maunder solar minimum centred on the second half of the seventeenth century and to some extent also around the latter part of the fifteenth century coinciding with part of the Spörer minimum (Usoskin et al. 2007).
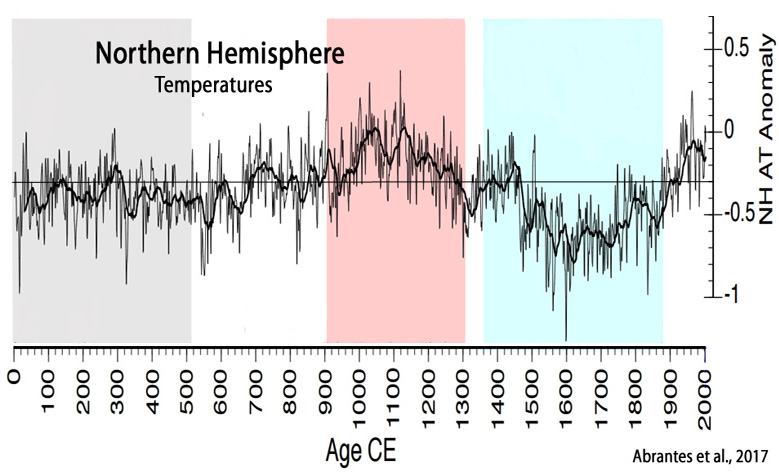
Abrantes et al., 2017 Reconstructed cold conditions in Iberia, with an average 0.5 ºC colder SST in the northern sites and 1.2ºC in the southern sites, characterize most of the 15th to 18th centuries. The transition from warm to colder climatic conditions occurs around 1300 CE associated with the Wolf solar minimum. The coldest SSTs are detected between 1350 and 1850 CE, on Iberia during the well-known Little Ice Age (LIA) (Bradley and Jones, 1993), with the most intense cooling episodes related with other solar minima events, and major volcanic forcing and separated by intervals of relative warmth (e.g. (Crowley and Unterman, 2013; Solanki et al., 2004; Steinhilber et al., 2012; Turner et al., 2016; Usoskin et al., 2011). During the 20th century, the southern records show unusually large decadal scale SST oscillations in the context of the last 2 millennia, in particular after the mid 1970’s, within the Great Solar Maximum (1940 – 2000 (Usoskin et al., 2011)) and the “greater salinity anomaly” event in the northern Atlantic (Dickson et al., 1988)
Williams et al., 2017 Reconstructed SSTs significantly warmed 1.1 ± 0.30°C … from 1660s to 1800 (rate of change: 0.008 ± 0.002°C/year), followed by a significant cooling of 0.8 ± 0.04°C … until 1840 (rate of change: 0.02 ± 0.001°C/year), then a significant warming of 0.8 ± 0.16°C from 1860 until the end of reconstruction in 2007 (rate of change: 0.005 ± 0.001°C/year). …, [T]he reconstructed SSTs were cool during the period of lower than usual solar irradiance called the Maunder minimum (1645–1715) but then warmed and cooled during the Dalton minimum (1795–1830), a second period of reduced solar irradiance. … The Dalton solar minimum and increased volcanic activity in the early 1800s could explain the decreasing SSTs from 1800 to 1850 … [T]hese data suggest a complex combination of solar irradiance, volcanic activity, internal ocean dynamics and external anthropogenic forcing explain the variability in Aleutian SSTs for the past 342 years.
Pandey and Dubey, 2017 The Maunder minimum (1645-1715) refers to a period when very few sunspots were observed. During this period, the Earth climate was cooler than normal. This period mimics the solar cycle climate change connections. The particles and electromagnetic radiations flowing from solar activity outbursts are important for long-term climate variations. There is an abrupt and drastic cooling in the climate can be possible in near future due to large scale melting of global ice by global warming, and prolonged sunspot minima. There is a close correlation between variations in the 11-year sunspot cycle and Earth’s climate. Solar activity varies on shorter-time scales, including the 11- year sunspot cycle and longer-term as Milankovitch cycle.
Cosentino et al., 2017 [T]he most recent cold phase was the Little Ice Age (LIA), which caused the expansion of glaciers in the alpine regions at lower latitudes. Several authors have linked this cooler climatic condition to a period of reduced solar activity (Mauquoy et al., 2002), which caused a decrease in summer insolation (Wanner et al., 2011). … [T]he cooling event known as Little Ice Age (LIA)… persisted more or less from the 13th to the 19th century (Perry and Hsu, 2000). … Furthermore, the fluctuations occurring in the frequency curve of H. balthica could be related to several brief cooling events which characterize the LIA, namely Wolf, Sporer, Maunder and Dalton [solar minimum periods] (Lamb, 1984; Mauquoy et al., 2002).
Luthardt and Rößler The 11 yr solar cycle, also known as Schwabe cycle, represents the smallest-scaled solar cyclicity and is traced back to sunspot activity (Douglass, 1928; Lean, 2000), which has a measurable effect on the Earth’s climate, as indicated by the Maunder minimum (Usoskin et al., 2015). Global climate feedback reactions to solar irradiance variations caused by sunspots are complex and hypothesized to be triggered by (1) variation in total energy input (Cubasch and Voss, 2000), (2) the influence of ultraviolet light intensity variation on composition of the stratosphere (Lean and Rind, 2001), (3) the effect of cosmic rays on cloud formation (Marsh and Svensmark, 2000; Sun and Bradley, 2002), and/or (4) the effect of high-energy particles on the strato- and mesosphere (Jackman et al., 2005). … [L]ike today, sunspot activity caused fluctuations of cosmic radiation input to the atmosphere, affecting cloud formation and annual rates of precipitation.
Serykh and Sonechkin, 2017 The global climate is a quasi-periodically forced dynamic system [1, 2]. In addition to the annual cycle of the heat transport from the Sun and the diurnal cycle of the Earth’s rotation, other external periodical forces exist, which are potentially able to cause climate fluctuations. [C]alculations indicate that an approximately 180-year cycle exists in the rotation of the Sun around the center of mass of the Solar system. The authors of [3] suggest that it is related to the sequence of significant decreases in the solar activity in the last millennium known as the Oort, Wolf, Spörer, Maunder, and Dalton periods. Paleoclimatic evidence of climate cooling during these periods exists.
Solar Activity Drives Precipitation Change
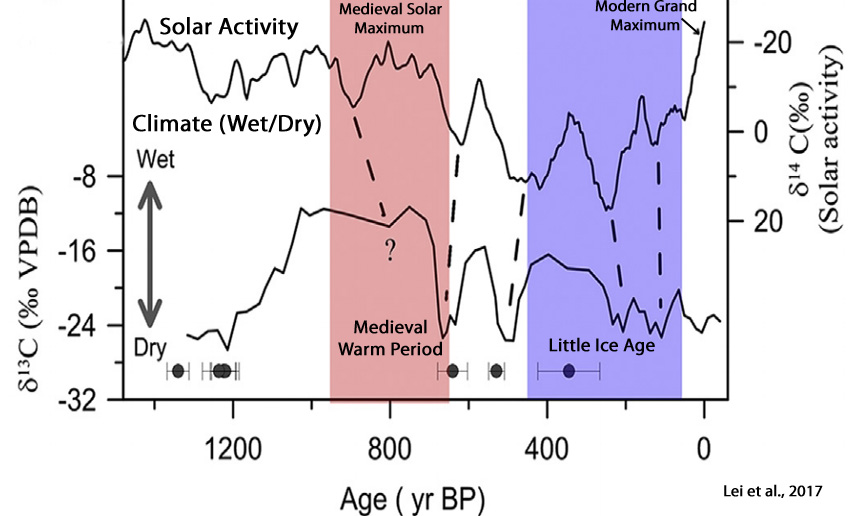
Lei et al., 2017 The precipitation variability on decadal to multi-centurial generally always reflects changes in solar activity and large-scale circulation, e.g., the ENSO and the EASM [East Asian Summer Monsoon] (Chen et al., 2011; Vleeschouwer et al., 2012; Feng et al., 2014). [D]uring the MWP [Medieval Warm Period], the wetter climate in this region was consistent with more frequent ENSO events, stronger EASM and higher solar activity, whereas the opposite was found for the LIA. In particular, d13Cac fluctuations on multi-decadal to centennial scales is consistent with the changes in solar activity, with fewer dry intervals corresponding to periods of minimum solar activity within dating errors, which are referred to as the Oort Minimum (AD 1010-1050), Wolf Minimum (AD 1280-1340), Sporer Minimum (AD 1420-1530), Maunder Minimum (AD 1645-1715) and Dalton Minimum (AD 1795-1820). These results suggest that climate change in southeastern China is sensitive to ENSO and the EASM, which may be driven by solar activity.
Yan et al., 2017 Morpho- and hydrodynamic variations seem to coincide with northern hemispheric solar forcing. Seasonal freezing periods in excess of the average time of frozen water bodies also occurred in periods of the well-known grand solar minima and indicate stronger seasonality, possibly independent from variations in summer monsoon strength but with links to global northern hemispheric climate.
Cui e thal, 2017 [G]enerally weak monsoons [occurred] from the 14th to the 19th centuries punctuated by four severe droughts during 1476-1502, 1509-1537, 1577-1590 and 1604-1653. These drought events are evident in all three time series, indicating that the climatic trends were regional rather than local. These dry periods are correlated with reduced summer insolation [solar minima] in the Northern Hemisphere, a southward displacement of the Intertropical Convergence Zone (ITCZ) and a weak EASM [East Asian Summer Monsoon].
Ramos-Román et al., 2017 In turn, this record shows centennial-scale climate oscillations in temperature that correlate with well-known climatic events during the Late Holocene in the western Mediterranean region, synchronous with variability in solar and atmospheric dynamics. … Enhanced arid conditions, co-occurring with overall positive NAO conditions and increasing solar activity, are observed between ~ 1550 to ~ 450 cal yr BP (~ 400 to ~ 1400 CE) and colder and warmer conditions happened during the Dark Ages and Medieval Climate Anomaly, respectively. Slightly wetter conditions took place during the end of the MCA and the first part of the Little Ice Age, which could be related to a change towards negative NAO conditions and minima in solar activity.
Munz et al., 2017 Decadal resolution record of Oman upwelling indicates solar forcing of the Indian summer monsoon (9–6 ka) … We use geochemical parameters, transfer functions of planktic foraminiferal assemblages and Mg / Ca palaeothermometry, and find evidence corroborating previous studies showing that upwelling intensity varies significantly in coherence with solar sunspot cycles. The dominant ∼ 80–90-year Gleissberg cycle apparently also affected bottom-water oxygen conditions.
Warrier et al., 2017 Climatic periodicities recorded in lake sediment magnetic susceptibility data: Further evidence for solar forcing on Indian summer monsoon … The results obtained from this study show that solar variations are the main controlling factor of the southwest monsoon and, like other archives from different regions in India, the TK [Thimmannanayakanakere –a small lake in southern India] sediments have also recorded these solar signatures.
Shi et al., 2017 Meanwhile, the stronger (weaker) EASM/ASM during the MCA (LIA) was associated with expansion (retreat) of the local Intertropical Convergence Zone and an enhanced (reduced) zonal temperature gradient over the equatorial Pacific. Our results imply that the synchronous change in the Asian–Australian monsoon may be caused by inherent solar variations, further strengthening previous findings.
Zielhofer et al., 2017 The Late Holocene climate variability in the Middle Atlas features a multi-centennial-scale NAO-type pattern, with Atlantic cooling and Western Mediterranean winter rain maxima generally associated with solar minima.
Sun et al., 2017 [A]t least six centennial droughts occurred at about 7300, 6300, 5500, 3400, 2500 and 500 cal yr BP. Our findings are generally consistent with other records from the ISM [Indian Summer Monsoon] region, and suggest that the monsoon intensity is primarily controlled by solar irradiance on a centennial time scale. This external forcing may have been amplified by cooling events in the North Atlantic and by ENSO activity in the eastern tropical Pacific, which shifted the ITCZ further southwards. The inconsistency between local rainfall amount in the southeastern margin of the QTP and ISM intensity may also have been the result of the effect of solar activity on the local hydrological cycle on the periphery of the plateau.
Zhang et al., 2017 The frequencies represent the influence of the Pacific Decadal Oscillation (PDO) and solar activity on the precipitation from the southwestern United States. In addition, solar activity has exerted a greater effect than PDO on the precipitation in the southwestern United States over the past 120 years. By comparing the trend of droughts with the two fundamental frequencies, we find that both the droughts in the 1900s and in the 21st century were affected by the PDO and solar activity, whereas the droughts from the 1950s to the 1970s were mainly affected by solar activity.
Malik et al., 2017 [W]e investigate the impact of internal climate variability and external climate forcings on ISMR on decadal to multi-decadal timescales over the past 400 years. The results show that AMO, PDO, and Total Solar Irradiance (TSI) play a considerable role in controlling the wet and dry decades of ISMR [Indian summer monsoon rainfall]. Resembling observational findings most of the dry decades of ISMR occur during a negative phase of AMO and a simultaneous positive phase of PDO.
Xiao et al., 2017 Spectral analysis of Tsuga and evergreen oak pollen percentages shows statistically significant periodicities of ~1500 and ~200 years at the ≥95% confidence level, which suggests that insolation and feedback interactions on millennial to centennial scales are the primary forcing mechanisms of the southwest monsoon and past climatic change during the Holocene in northwestern Yunnan Province, southwestern China.
Crop Yields, Sea Ice, Ozone, Cloud Cover, Hurricanes…Driven By Solar Activity
Crop Yields
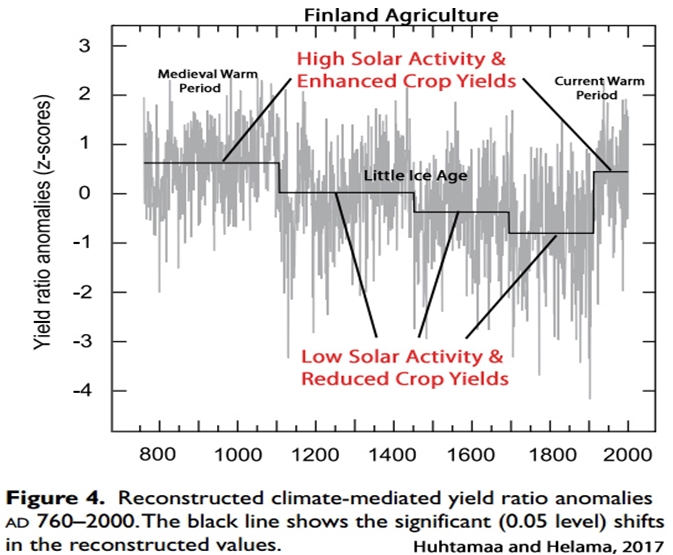
Huhtamaa and Helama, 2017 The rapid mid-15th century cooling, which followed a major atmospheric circulation change over the North Atlantic (Dawson et al., 2007; Meeker and Mayewski, 2002) and coincided with the culmination of the Spörer solar minimum (Miyahara et al., 2006), has been evidenced in various summer and winter season reconstructions of the region (Haltia-Hovi et al., 2007; Helama et al., 2009b; Klimenko and Solomina, 2010; Luoto and Helama, 2010; Zhang et al., 2015). … The culmination of the ‘LIA’ in Finland has been commonly dated to the late 17th and early 18th centuries ad (Luoto, 2013; Luoto and Helama, 2010; Tiljander et al., 2003), which is synchronous with the onset of the phase of the lowest yield ratios in our reconstruction. The Maunder solar minima (c. 1645–1715) and several volcanic eruptions preceded the culmination (Shindell et al., 2003).
Sea Ice
Stein et al., 2017 The increase in sea ice may have resulted from the continuing cooling trend due to decreased solar insolation and reduced heat flow from the Pacific. … The increase in sea ice extent during the late Holocene seems to be a circum-Arctic phenomenon as PIP25-based sea ice records from the Fram Strait, Laptev Sea, East Siberian Sea and Chukchi Sea display a generally quite similar evolution, all coinciding with the decrease in solar radiation … The main factors controlling the millennial variability in sea ice and surface-water productivity are probably changes in surface water and heat flow from the Pacific into the Arctic Ocean as well as the long-term decrease in summer insolation, whereas short-term centennial variability observed in the high-resolution middle Holocene record was possibly triggered by solar forcing.
Sha et al., 2017 The reconstruction indicates warm conditions with reduced sea-ice cover, associated with the Holocene Thermal Maximum, from ca. 6700 to 5000 cal. yr BP. … A distinct increase in sea-ice cover began at 1750 cal. yr BP, with absolute maximum values during the last millennium. … In order to assess the contribution of different potential forcing factors to sea-ice conditions off West Greenland, we evaluated the relationship between our sea-ice reconstruction and solar activity, as well as with the strength of ocean circulation. The observed agreement between the sea-ice record and solar activity suggests that solar forcing may have been an important trigger for sea-ice variability off West Greenland during the last 5000 yr.

Ozone
Pande et al., 2017 Angell and Korshover (1976) concluded that there is nearly in–phase relationship between sunspot number and total ozone. … Ozone is a highly reactive, naturally occurring ingredient of the stratosphere that is produced from oxygen by sunlight. It is one of the most important chemicals in both the stratosphere and troposphere. Apart from absorbing the harmful ultaviolet radiation from the sun, it [ozone] also plays an important role in determining earth’s climate. Solar variability affects ozone through radiative heating in atmosphere. Solar UV radiation is absorbed by atmospheric ozone. It is responsible for both the creation and destruction of ozone. … The total ozone was found to be enhanced during magnetically disturbed conditions which are associated with peak solar activity periods.
Clouds
Utomo, 2017 A similar result was also found for the relationship between solar activity and cosmic ray flux with a negative correlation, i.e. 0.69/year. When solar activities decrease, the clouds cover rate increase due-0.61/month and – to secondary ions produced by cosmic rays. The increase in the cloud cover rate causes the decrease in solar constant value and solar radiation on the earth’s surface. … The increase in the formation rate of cloud would affect the decrease in the intensity of solar radiation reaching the Earth’s surface. The relationship between cosmic rays and solar constant is an “opposite” relationship because of the negative correlation type (r < 0). The phenomenon of “opposite” is in a good agreement with the result by Svensmark (1997) who found a correlation between temperature and global cloud coverage with the cosmic rays… [T]he climate also depends on variations in the flux of solar energy received by the earth’s surface. Variation in the solar energy flux is caused by variations in solar activity cycle. Thus the climate is a manifestation of how solar radiation is absorbed, redistributed by the atmosphere, land and oceans, and ultimately radiated back into space. Every variation of solar energy received at the earth’s surface and reradiated by the earth into space will have a direct impact on climate change on Earth.
Hurricanes, Storms


Another outstanding compilation, Kenneth, which I’m sure Seb will much appreciate.
On why the Sun is not responsible for recent climate change:
https://www.carbonbrief.org/why-the-sun-is-not-responsible-for-recent-climate-change
SebH wants us to believe they’ve proven That Svensmark is wrong. But have they?
https://www.thegwpf.com/henrik-svensmark-cosmic-rays-and-clouds-anno-2016/
If you were honest, you would have written…
“On why the Sun MIGHT not be responsible for recent climate change, IF the models are right.”
But you didn’t.
1) You don’t seem to realize that nobody is saying cosmic rays do not influence cloud formation. But the CERN scientists are saying that the change isn’t big enough to influence climate that much. And more importantly, the cosmic ray count goes in the wrong direction. So it’s at best countering the greenhouse effect by slightly cooling the surface via increased cloud cover … it’s not responsible for the warming. Got it?
2) I have not written the title of that linked article. Have you even read the article?
“But the CERN scientists are saying that the change isn’t big enough to influence climate that much.” – SebH
I repeat, THAT’S BASED ON MODELS. Real world data indicate otherwise.
“And more importantly, the cosmic ray count goes in the wrong direction.” – SebH
As usual, you make an assertion without giving any reference to where you got it from
Fact is, they have NOT proven Svensmark wrong. He may be, but the garbage they are using against him just doesn’t cut it.
Perhaps when we have better information on clouds than we currently have,…(see bottom of page)…
https://calderup.wordpress.com/2011/10/05/further-attempt-to-falsify-the-svensmark-hypothesis/
…we can resolve the matter. But until then his theory is still in contention, and any assertion that he’s been proven wrong is wishful thinking, at best.
So, yes, I “get it.” You prefer propaganda over objectivity. But that’s been evident for a long time now.
It’s based on results from the CLOUD experiment. Real world data contradicts the skeptics fallback of claiming “it’s the cosmic rays that change the climate”.
The link is up there …
https://www.carbonbrief.org/why-the-sun-is-not-responsible-for-recent-climate-change
There is no correlation between cosmic rays and climate change. You probably don’t like links to these websites, but https://www.skepticalscience.com/cern-cloud-proves-cosmic-rays-causing-global-warming-intermediate.htm has a good list of papers showing the problems with that theory.
They? And isn’t he the one with that claim that skeptics fall back to as a last resort? Shouldn’t he prove that it is correct despite the available data saying otherwise?
Shouldn’t the theory at least be able to explain some of the observations then?
You grasp at everything that you think could somehow disprove AGW. Not being the least bit skeptical about those things 😉
It’s not that “cosmic rays change the climate”. It’s that changes in cloud cover change the radiation budget by affecting the amount of heat absorbed by the surface (oceans), and hence clouds have a significant impact on the climate. Cosmic rays are just the seeds to cloud cover variations.
–
http://cc.oulu.fi/~usoskin/personal/usoskin_CR_2008.pdf
Even a small change in the cloud cover modifies the transparency/absorption/reflectance of the atmosphere and affects the amount of absorbed solar radiation, even with no changes in the solar irradiance. Since the flux of CR is modulated by the solar magnetic activity, this provides a link between solar variability and climate
–
Utomo, 2017
http://iopscience.iop.org/article/10.1088/1742-6596/817/1/012045/pdf
A similar result was also found for the relationship between solar activity and cosmic ray flux with a negative correlation, i.e. 0.69/year. When solar activities decrease, the clouds cover rate increase due-0.61/month and – to secondary ions produced by cosmic rays. The increase in the cloud cover rate causes the decrease in solar constant value and solar radiation on the earth’s surface. … The increase in the formation rate of cloud would affect the decrease in the intensity of solar radiation reaching the Earth’s surface. The relationship between cosmic rays and solar constant is an “opposite” relationship because of the negative correlation type (r < 0). The phenomenon of “opposite” is in a good agreement with the result by Svensmark (1997) who found a correlation between temperature and global cloud coverage with the cosmic rays - Luthardt and Rößler, 2017 http://geology.gsapubs.org/content/early/2017/01/12/G38669.1.abstract
The 11 yr solar cycle, also known as Schwabe cycle, represents the smallest-scaled solar cyclicity and is traced back to sunspot activity (Douglass, 1928; Lean, 2000), which has a measurable effect on the Earth’s climate, as indicated by the Maunder minimum (Usoskin et al., 2015). Global climate feedback reactions to solar irradiance variations caused by sunspots are complex and hypothesized to be triggered by (1) variation in total energy input (Cubasch and Voss, 2000), (2) the influence of ultraviolet light intensity variation on composition of the stratosphere (Lean and Rind, 2001), (3) the effect of cosmic rays on cloud formation (Marsh and Svensmark, 2000; Sun and Bradley, 2002), and/or (4) the effect of high-energy particles on the strato- and mesosphere (Jackman et al., 2005). … [L]ike today, sunspot activity caused fluctuations of cosmic radiation input to the atmosphere, affecting cloud formation and annual rates of precipitation.
–
Biktash, 2017
http://www.sciencedirect.com/science/article/pii/S2090123217300334
The effects of total solar irradiance (TSI) and volcanic activity on long-term global temperature variations during solar cycles 19–23 [1954-2008] were studied. It was shown that a large proportion of climate variations can be explained by the mechanism of action of TSI [total solar irradiance] and cosmic rays (CRs) on the state of the lower atmosphere and other meteorological parameters. … Recent studies by Pudovkin and Raspopov, Tinsley, and Swensmark have shown that the Earth’s cloud coverage is strongly influenced by cosmic ray intensity. Conditions in interplanetary space, which can influence GCRs and climate change, have been studied in numerous works. As has been demonstrated by Biktash, the long-term CR count rate and global temperature variations in 20–23 solar cycles [1960s-2000s] are modulated by solar activity and by the IMF (interplanetary magnetic field).
“It’s based on results from the CLOUD experiment.” – SebH
No, it’s based on an interpretation of their results, informed by modeling.
“Real world data contradicts the skeptics fallback of claiming “it’s the cosmic rays that change the climate”.” – SebH
Again putting words in our mouths.
In answer to my saying SebH didn’t give a link, he responds with the article link, and writes…
“The link is up there …”
There are twelve links “up there,” and I’m not going to waste my time chasing after each and every one. If you don’t know which, don’t expect me to figure it out for you. I.e., stop wasting my time with your nonsense.
“And isn’t he the one with that claim that skeptics fall back to as a last resort? Shouldn’t he prove that it is correct despite the available data saying otherwise?” – SebH
In answer to the first, “No.”
In answer to the second, there is plenty of data that the naysayers ignore that strongly supports Svensmark.
https://calderup.wordpress.com/2010/05/03/do-clouds-disappear/
SebH writes…
“You probably don’t like links to these websites,…” followed by a link to “skepticalscience.”
No, I think getting information from dishonest people is not without risk.
https://noconsensus.wordpress.com/2015/07/23/john-cook-proprietor-of-sks-repeat-coauthor-of-dr-stephan-lewandowsky-caught-red-handed-impersonating-lubos-motl-for-purposes-of-a-university-of-australia-research-project/
Another link, which I’ve posted before, on why I don’t want anything to do with them.
http://www.populartechnology.net/2012/03/truth-about-skeptical-science.html
Doubling down on the accusation that Svensmark’s work doesn’t agree with data, SebH writes…
“Shouldn’t the theory at least be able to explain some of the observations then?”
But it does, SebH, as clearly shown in the Calderup link above. He shows data, and writes that…
“The blue lines are statistical fits to all of the plotted data points. In all four cases the the impact increases as the decrease in cosmic rays gets bigger, so for the Svensmark hypothesis, test passed.”
SebH has it wrong, yet again.
Kenneth,
Yeah, but cosmic ray counts are increasing and therefore should increase cloud cover and as a result cause cooling. The increase of the cloud cover was the explanation of the “hiatus” in a paper you linked, remember? The same process can’t be responsible for global warming, can it?
https://cosmicrays.oulu.fi/
yonason,
Stop wasting my time then. You replied to a comment with a link to a carbonbrief.org article and you asked me further down in the thread to provide a source to what I am saying … which was that very article. Read it or don’t, but don’t claim that you couldn’t find the source …
If you just need a pretty graph of the cosmic ray count over the past decades, go to the very first link in this comment. I’ll repeat it for you, so you don’t have to search: https://cosmicrays.oulu.fi/
Is there? The simple fact that the cosmic ray count is going in the opposite direction for this to be (via cloud cover changes) the cause of global warming isn’t enough to show you that it is at best a factor for compensating the increased greenhouse effect?
I see, I’ll remind you of that when you attack me next time when you call “ad hominem attack” when the credentials of an author are discussed 😉
I think you are missing the point. I am not saying that cosmic rays aren’t influencing cloud activity. I am saying it’s not that great of an influence and more importantly it can not have caused global warming, since cosmic ray counts did not decrease, did they?
As to cosmic rays influencing climate, there’s a lot more hard data on that than on CO2 influencing it, as the material I’ve provided shows. But, as I indicated elsewhere, you cannot prove CO2’s influence, the evidence for which is more circumstantial, by saying cosmic ray influence is circumstantial. Talk about logical fallacies.
RE – my comments about John Cook, you write…
“I see, I’ll remind you of that when you attack me next time when you call “ad hominem attack” when the credentials of an author are discussed” – SebH
As to their lack of scientific credentials, that’s an argument your side throws at us all the time, despite many of us being far more qualified than they; but all of a sudden you don’t like it when it doesn’t suit you.
As to the yet more serious charge, which you ignored. It’s not ad hom to accuse them of lying, if they really are liars.
Accusing someone of identity theft they have committed is not ad hom, because it is not a trivial “mistake” someone makes inadvertently. In most places it is a crime.
https://motls.blogspot.com/2015/07/identity-theft-thief-of-lubosmotl-turns.html
5 years earlier Motl had written this about Cook.
https://motls.blogspot.com/2010/03/john-cook-skeptical-science.html
Also, I did read that link you gave me, but didn’t find any more justification of what you claimed it “proved,” than anything you’ve written. If you want to direct me to a specific quote there, or one of the dozen links they provide, I might waste a bit of time on it. Otherwise, save your indignation.
HOW DARE I…
…question the integrity of John Cook!
Easy. He has none.
https://wattsupwiththat.com/2014/05/15/university-of-queensland-threatens-lawsuit-over-use-of-cooks-97-consensus-data-for-a-scientific-rebuttal/
https://noconsensus.wordpress.com/2015/07/23/john-cook-proprietor-of-sks-repeat-coauthor-of-dr-stephan-lewandowsky-caught-red-handed-impersonating-lubos-motl-for-purposes-of-a-university-of-australia-research-project/
“Expertise Matters in Agreement Over Human-Caused Climate Change”
https://wattsupwiththat.com/2016/04/12/john-cook-is-cooking-up-more-97-consensus-while-two-papers-refute-his-statistical-sleights-of-hand/
…except when it comes to Cook’s lack of expertise. SebH writes that I can’t criticize him for that, because it’s an ad hom attack, or some such nonsense.
Like Cook, SebH is an activist troll dedicated not to uncovering the truth, but to advancing a very corrupt agenda.
One loose end.
Re – the article SebH linked to that “proved” the sun didn’t even correlate with warming.
This graph from the article (Chart by Carbon Brief using Highcharts) is the first one down, here…
https://www.carbonbrief.org/why-the-sun-is-not-responsible-for-recent-climate-change
This one was generated by the warmists at Berkeley Earth…
http://c3headlines.typepad.com/.a/6a010536b58035970c017c31b4be9a970b-pi
From article found here…
http://www.c3headlines.com/2012/09/obamas-epa-jihad-against-co2-just-took-a-mortal-hit-new-research-indicates-global-warming-not-the-fa.html
Since SebH likes to draw our attention to differences in graphical representation, even when they aren’t there, I thought the above comparison might be worth making.
And a whole lot more related information can be found here…
http://www.c3headlines.com/sunsolarcosmicoscillationorbital-cycles/
Interesting, a skeptic posts another “fake” graph. Well it is not really fake, but the TSI values are most likely those from Hoyt/Schatten 1993 (see figure 10 in here: http://www.atmosp.physics.utoronto.ca/people/guido/PHY2502/articles/solar-activity/Hoyt-Schatten.pdf). The graph is wrong (has been discarded) …
Chatbot_SebH squacks…
Nevermind that the graph from BERKELEY EARTH goes to about 2015, 22 years after the hoyt/schatten paper was published.
STOP MAKING THINGS UP!!!
Stop ignoring the evidence!
http://imgur.com/a/VC0pi
It is pretty clear that the source is the 1993 graph and it just got continued by Soon/Briggs with an unknown method. Since the whole graph of theirs looks like it was hand drawn one could imagine them just adding the last part by hand (pure speculation).
Oh, and stop writing nonsense. This graph isn’t from 2015, it’s from a September 2012 publication (a commentary from those two in The Washington Times)
http://www.washingtontimes.com/news/2012/sep/6/global-warming-fanatics-take-note/
RE – The Hoyt-Schatten data.
“The graph is wrong (has been discarded) …” – Chatbot_SebH
By whom? Give a reference you useless lazy sack of troll waste!!!!
And, while I’m at it, the chatbot also corrects my approximation of “ABOUT 2015” to “it’s from a September 2012 publication”
Oh, yeah, he really put me in my place there. (rolls eyes)
It’s not Soon/Briggs. It’s from atmospheric physicists Scafetta and Willson, 2014.
Yndestad and Solheim, 2017
Periods with few sunspots are associated with low solar activity and cold climate periods. Periods with many sunspots are associated with high solar activity and warm climate periods. … Studies that employ cosmogenic isotope data and sunspot data indicate that we are currently leaving a grand activity maximum, which began in approximately 1940 and is now declining (Usoskin et al., 2003; Solanki et al., 2004; Abreu et al., 2008). Because grand maxima and minima occur on centennial or millennial timescales, they can only be investigated using proxy data, i.e., solar activity reconstructed from 10Be and 14C time-calibrated data. The conclusion is that the activity level of the Modern Maximum (1940–2000) is a relatively rare event, with the previous similarly high levels of solar activity observed 4 and 8 millennia ago (Usoskin et al., 2003).
The above graph that yonason referred to was first mentioned in September 2012 (by both authors) and can be found on many websites from back then.
But interesting find, the shape is pretty similar, but the y-axis is shifted. Nevertheless, there is no accepted TSI record that looks like this. Do you think that the currently accepted TSI record is also fake to “hide the decline”? 😉
@Kenneth Richard
Scafetta (2013) deals with the issue.
https://arxiv.org/pdf/1307.3706.pdf
It looks like section 9 and the appendix may be the most relevant here. There we learn that the only “proof” that the TSI values SebH doesn’t like are wrong comes, not from measurements, but from some rather questionable modifications (adjustments**) to the original data – (see esp section 9, and appendix).
**Sound familiar?
But wait, there’s more…
https://calderup.wordpress.com/2011/10/05/further-attempt-to-falsify-the-svensmark-hypothesis/
And it’s not good news for those attacking Svensmark.
What makes you think that Sebastian will read it, let alone comprehend?
I must admit to skipping over Sebastian’s comments so I must have missed his explanation for variations in climate in the last 6,000 years and how they were due to non-existent variations in CO2. And in particular why unadjusted actual temperatures in rural Australia show no warming in the last 100 years.
From what I have seen he will merely deny that the climate has changed, and try to change the subject.
P.S. Where is sod? (Not that he is missed, I just hope he hasn’t become suicidal because of a non-existant threat.
Why would the CO2 concentration have influenced the climate in any major way in the last 6000 years?
Actually, the UAH v6 temp series shows an increased upward trend for Australia 😉
http://www.drroyspencer.com/2015/04/version-6-0-of-the-uah-temperature-dataset-released-new-lt-trend-0-11-cdecade/ (Fig. 5)
Leave that to Kenneth … I am sure he will come up with some kind of assignment für those who doubt the skeptics on this blog (skeptic skeptics if you will) to distract us.
He did what I haven’t managed to do yet. He withstands when duty calls: https://xkcd.com/386/
Considering the CO2 molecules in the atmosphere are spaced together just 1/10,000ths (one-ten-thousandths) more closely today than they were in 1900, or just 1/20,000ths more closely today than in 1990, why do you believe this rather imperceptible change in atmospheric CO2 molecule density is sufficient to radiatively be the cause of the world oceans heating up by a blistering 0.09 C since 1955 (0-2000 m), but yet variations in the Sun’s direct shortwave absorption during the 20th century’s Grand Solar Maximum of solar activity — the highest solar activity in millennia — as well as the reduction in cloud cover since the 1980s (resulting in 3-7 W m-2 of SW forcing) has had little to no bearing on the net heat content changes in the global oceans?
https://notrickszone.com/wp-content/uploads/2016/11/Holocene-Cooling-Pacific-Heat-Content-Rosenthal13-copy.jpg
Kenneth,
he has no clue on how silly his CO2 arguments are.He keeps at it despite the dearth of evidence that it has more warm forcing change capability than the Sun does,when he has been shown the opposite a number of times already.
He is too beholden to the long destroyed AGW conjecture.
Learn what optical depth means and how the greenhouse effect works and you can answer that question for yourself, Kenneth.
Sebastian,
He already knows from reading his past replies,you have memory problems?
A month ago,I showed you how little warm forcing there is left from from future CO2 increases in the atmosphere,you never admitted that when given the breakdown.
Here you make clear you are just as dishonest as ever.
Sebastian,
You were shown this several times already,
https://wattsupwiththat.files.wordpress.com/2010/03/heating_effect_of_co2.png
MODTRANS results destroys your claim too,
https://wattsupwiththat.files.wordpress.com/2010/03/co2_modtrans_img1.png
The rest of the article is here:
https://wattsupwiththat.com/2010/03/08/the-logarithmic-effect-of-carbon-dioxide/
Most of the postulated CO2 warm forcing was already set in around 600 Million years ago. There is little left to wring from in the next 50 ppm more.
If he does, why is he asking that question over and over again? Is he just trolling?
I replied to you, but apparently, you ignored it or just didn’t understand. Of course the current increase won’t double the greenhouse effect or anything like that. But it is really beyond you to extrapolate what a 3 or 5 degrees Celsius change in temperature means. You skeptics frequently cite how bad the LIA was, then imagine that in the other direction. And if you think for yourself that a little higher temperatures couldn’t hurt in the northern hemisphere, then imagine how people living near the equator thought of Europeans feeling cold back then 😉
LOL – That’s SebH in a nutshell.
“Why would the CO2 concentration have influenced the climate in any major way in the last 6000 years?”
So, Seb, it’s had no effect in the last 6000 years, but now it’s going to destroy the world?
Oh…kay…
In the 6000 years previous to mankind starting to emit massive amounts of CO2 into the atmosphere. Should have made that clearer.
Ah, much better. Thank you.
I agree that there is a lot of good information to digest. Thanks for the compilation.
Whilst I have yet to see strong evidence going beyond coincidence, I consider that it is eminently more likely that changes in solar irradiance (not necessarily TSI but also spectral wavelength chnages since absorption of solar is wavelength dependent)and/or changes in the extent of cloud cover and/or cloud patterns is a morely driver of temperature change than is a modest increase in a radiative gas such as CO2 whose effect (if any at all) could be saturated at present levels of concentration (indeed, it may well have been saturated when it was 200 ppm, or even less).
What an epic and excellent compellation, well done Kenneth!
Now from all this information I wonder what the cooling sun might offer us in the way of climate change. Obviously CO2 offer nothing in comparison as evidenced by the long temperature hiatus that some scientists have been fretting about.
Yep Earth’s climate and it’s variation, controlled by the variable output from the sun and not some very, very, very rare gas. Of course in ‘climate science™’ the Sun Precludes Climate Catastrophe, only CO2 can do that. Poor Neglected Sun
We’ll see … let’s bookmark this comment of yours and revisit it in 5-10 years.
Feel free SebastianH, I have taken many copies of your nonsense (complete with context and times), so that I can await the day to throw it back at you.
Enjoy!
🙂
SebH has already been wrong so often that bookmarking isn’t necessary to see it.
ASIDE…(in the category of: more stuff you don’t have to bookmark to know it’s wrong)
The fascists at Google believe in global warming. They also believe in silencing anyone who they disagree with, or who they think they might disagree with.
http://www.zerohedge.com/news/2017-08-21/one-statistics-professor-was-just-banned-google-here-his-story
These are not the kind of people I trust to “save” me from anything, least of all from a catastrophe that isn’t happening and isn’t going to happen.
That fits with https://wattsupwiththat.com/2017/08/24/after-publishing-new-book-critical-of-al-gore-climate-scientist-has-website-shut-down-by-attacks/
Why would they want to debate when they have more control and deeper pockets to just stop individuals getting any message out, stop anyone being read, heard or seen. Propagandists and profiteers of the ‘climate change™’ industries of the world united by greed.
Yup!
https://calderup.wordpress.com/2011/07/17/%E2%80%9Cno-you-mustnt-say-what-it-means%E2%80%9D/
Funnily enough I was reading https://australianclimatemadness.com/2012/01/30/the-cold-sun/ earlier in the week, and then move on to that same Calder piece.
Great website, but I didn’t get it there. I used to frequent Calder’s blog, and have it bookmarked from back then. Another good one whose loss wasn’t easy to take. I was looking at it in connection with this thread, but didn’t see how to work it in until your comment. Thanks.
Seb asks:
Why would the CO2 concentration have influenced the climate in any major way in the last 6000 years?
John says:
Yes why!
The TSI problem: from 1850 only 0.6 W/m2. CO2 theory: 2x is 2.4 W/m2 for a 43% increase in CO2. Unless you can negate or disprove the CO2 forcing value in use, or show amplification effects of TSI, CO2 is the dominant driver. Correlation is trumped by causation
It’s highly likely that the 0.6 W m-2 is a gross underestimate, especially since the reconstructed temperature during the Holocene vary by multiple degrees C over centennial timescales (rates which far exceed the modern warming rates). For example, global temperatures rose and fell by 1 to 3 degrees C in both directions within decades (3 decades for the 1-3 C cooling, 7 decades for the 1-3 C warming) 8,200 years ago, and these changes were not accompanied by radiative forcing changes (not to mention any substantive change in CO2 values – 1 or 2 ppm).
TSI is about +3 W m-2 (1358-1361) according to several reconstructions:
https://notrickszone.com/wp-content/uploads/2017/02/Total-Solar-Irradiance-1700-2013-Yndestad-and-Solheim-17.jpg
–
http://www.groenerekenkamer.nl/wp-content/uploads/2013/01/SolarActivity-temperature.jpg
–
https://notrickszone.com/wp-content/uploads/2017/04/Soon-Connolly-2015-NH-Temps-and-TSI.jpg
http://arxiv.org/PS_cache/arxiv/pdf/1102/1102.4763v1.pdf
We obtained a large historical solar forcing between the Maunder minimum and the present, as well as a significant increase in solar irradiance in the first half of the twentieth-century. Our TSI reconstructions give a value of ∼1 W/m2 per decade[+5 W m-2] for the period 1900–1950.
Recently, TSI has fallen out of favor as an indicator of solar activity’s influence, and SSI has increasingly gained prominence (due to its correlation with sunspot number, which is robustly connected to past climate changes).
http://iopscience.iop.org/article/10.1088/0004-637X/802/1/67/meta
We have then examined solar spectral irradiance (SSI) to find a good phase correlation with a sunspot number in the wavelength range of 170-260 nm, which is close to the spectral range effective in heating the Earth’s atmosphere. Therefore, it appears that SSI rather than TSI is a good indicator of the chromospheric activity, and its cycle length dependent variation would be more relevant to the possible role of the Sun in the cyclic variation of the Earth’s atmosphere.
Furthermore, even small changes in cloud cover can easily override the alleged changes in CO2 forcing by altering the direct shortwave radiation (albedo changes). For example, since the 1980s, the trend in surface solar radiation due to the observed reduction in tropical cloud cover has been between 3 and 7 W m-2, which easily dwarfs the alleged CO2 forcing over the period.
It’s an alleged 1.68 W m-2 for straight CO2 forcing since 1750 according to the IPCC (2013). Doubling CO2 from 280 ppm to 560 ppm is modeled to yield a radiative forcing of 3.7 W m-2, and a temperature change of a little over 1 degree C.
I hope you understand that a variation of the TSI value by 3 W/m² up or down mapped on the surface of this planet means a change of incoming solar energy by 0.525 W/m².
You can find a graph of TSI vs. temperature on in this article: https://www.carbonbrief.org/why-the-sun-is-not-responsible-for-recent-climate-change
Indeed. You linked to a paper (https://www.nature.com/articles/srep33315.pdf) explaining that the greenhouse effect gets compensated for by cloud activity change in the recent past and therefore a “hiatus” happened. Are you now saying that temperature changes due to cloud cover changes are going in the same direction as greenhouse effect induced temperature changes?
That is impressive. How can the SSR change by so much if clouds as a whole are only responsible for 21 W/m² as you’ve written earlier? Did the cloud cover really change by 14-33% in that time? Or is it more likely that you are again comparing global 24/7 forcing of CO2 via the greenhouse effect to a local effect not considering all variables?
I’d like to remind you that the 1.x°C change is without feedbacks and occurs when the CO2 concentration settles on 560 ppm, not on the first day that concentration is reached. The greenhouse effect doesn’t work that way, but you know that of course, right?
I’m saying, and have said, that cloud cover changes affecting both SW and LW are significant/dominant determinants of changes in the radiation budget and hence the Earth’s temperature. This is consistent with the scientific determination that cloud cover changes are the central factor affecting changes in temperature.
http://www.sciencemag.org/content/295/5556/841
It is widely assumed that variations in Earth’s radiative energy budget at large time and space scales are small. We present new evidence from a compilation of over two decades of accurate satellite data that the top-of-atmosphere (TOA) tropical radiative energy budget is much more dynamic and variable than previously thought. Results indicate that the radiation budget changes are caused by changes in tropical mean cloudiness.
You’re referring to the net difference between SW and LW forcing. Again, read the entire quote (an average of 18 W m-2 here):
http://www-ramanathan.ucsd.edu/files/brt18.pdf
“Clouds reduce the absorbed solar radiation by -48 W m−2 (Cs = −48Wm−2) while enhancing the greenhouse effect by 30 W m−2 (Cl = 30Wm−2) [range of 78 W m-2], and therefore clouds cool the global surface–atmosphere system by 18 W m−2 (C = −18 W m−2) on average. The mean value of C [cloud radiative forcing] is several times the 4 W m−2 heating expected from doubling of CO2“
You don’t seem to understand the intent behind my questions … so again:
1a) What is the result of a cloud cover reduction? Warming or cooling?
1b) Has the cloud cover decreased over the “hiatus” or not?
2) Do you think that the 18 W/m² cooling from clouds in the atmosphere is – as a value – directly comparable to the 4 W/m² expected from a CO2 doubling? If so, why?
Problem is, Doug, that’s all we have is correlation, and with CO2 the correlation isn’t very good. There is no experimentally demonstrated causal effect, as you would seem to want us to conclude from your comment.
[…] Read more at notrickszone.com […]
@Kenneth Richard 27. August 2017
FYI
Looks like your bolding the last sentence there is carried over into all comments below it.