Uncoupled: CO2 And Sea Ice

Anthropogenic CO2 emissions have risen linearly since the mid-1940s.
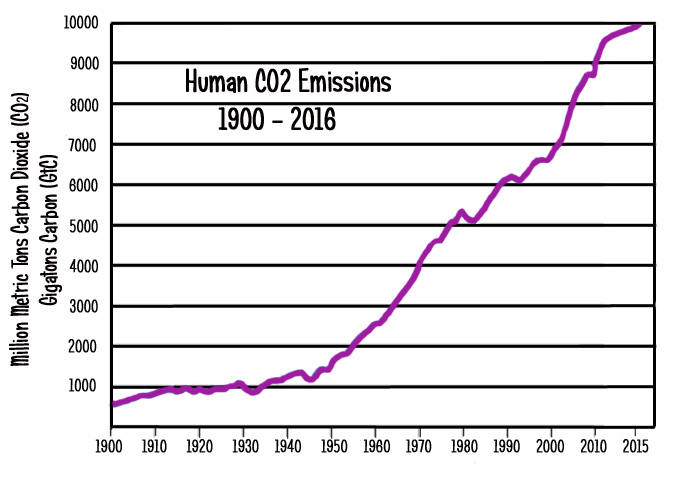
According to climate models, anthropogenic CO2 emissions drive trends in polar sea ice. The sea ice extent in both the Northern and Southern Hemispheres should therefore gradually decline (linearly) as human emissions rise.
However, neither the Arctic nor Antarctic sea ice trends appear to be cooperating with these modeled expectations.
In newly published papers, scientists have reported that Arctic sea ice extent grew during the decades from the 1940s to the 1980s before declining after the 1980s. The Arctic sea ice trend has thus undergone an oscillation rather than a linear recession, contradicting the models.
Furthermore, the instrumental record indicates that Arctic temperatures have stopped rising since about 2005.
On the other side of the planet, the sea ice surrounding Antarctica has been growing since the 1970s, or for nearly 40 years now. This sea ice expansion coincides with an overall Southern Ocean cooling trend of about -0.3°C per decade since 1979.
Again, the climate models that stipulate changes in CO2 concentrations are what drive polar sea ice trends have been contradicted by observational evidence. As Connolly et al. (2017) conclude:
“[C]urrent climate models are still quite poor at modelling past sea ice trends.”
Climate models may also be quite poor at modelling current sea ice trends.
According to this new dataset, the recent period of Arctic sea ice retreat since the 1970s followed a period of sea ice growth after the mid 1940s, which in turn followed a period of sea ice retreat after the 1910s. Our reconstructions agree with previous studies that have noted a general decrease in Arctic sea ice extent (for all four seasons) since the start of the satellite era (1979). However, the timing of the start of the satellite era is unfortunate in that it coincided with the end of several decades during which Arctic sea ice extent was generally increasing. This late-1970s reversal in sea ice trends was not captured by the hindcasts of the recent CMIP5 climate models used for the latest IPCC reports, which suggests that current climate models are still quite poor at modelling past sea ice trends. Nor is it described in previous Arctic sea ice reconstructions such as the Walsh dataset or the widely used HadISST sea ice dataset, although some recent studies have noted similar reversals, e.g. Pirón and Pasalodos (2016) and Alekseev et al. (2016).
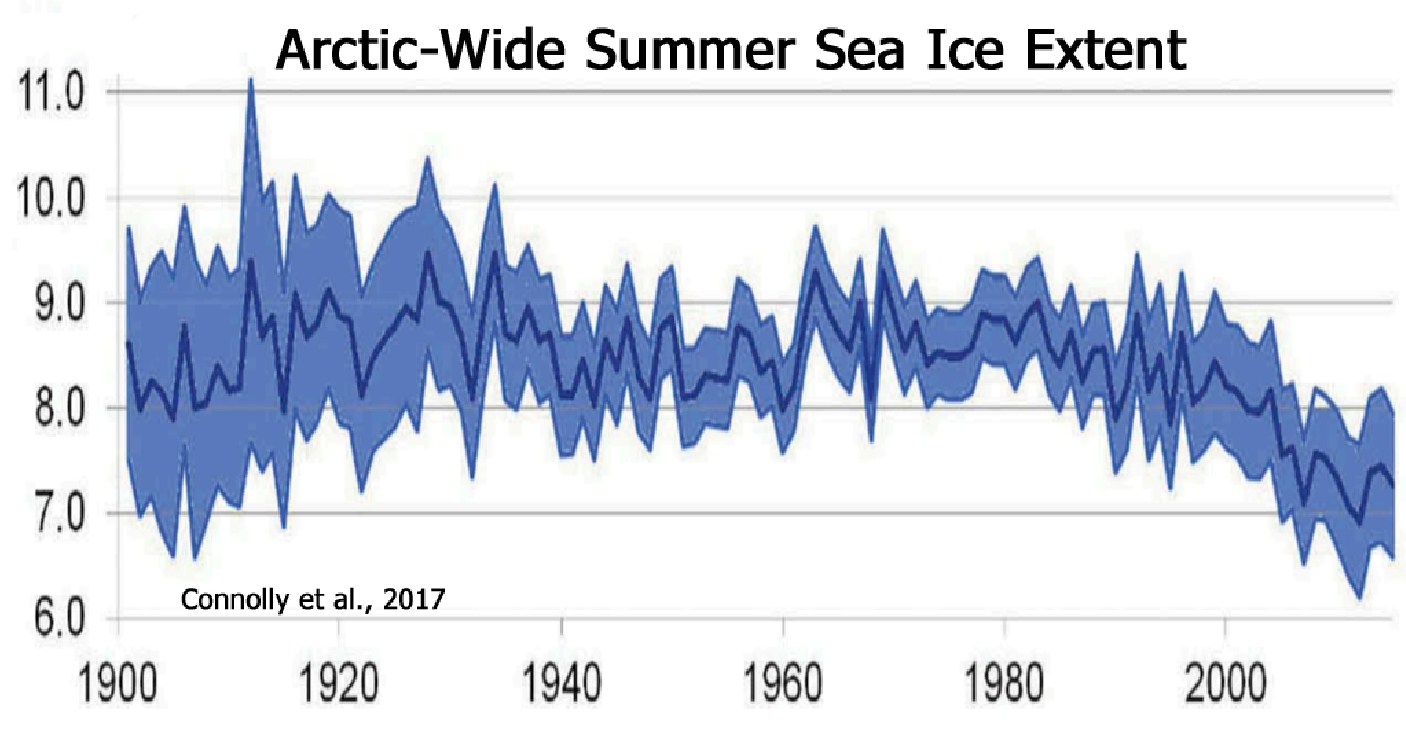
An Arctic Sea Ice Oscillation Since The 1940s
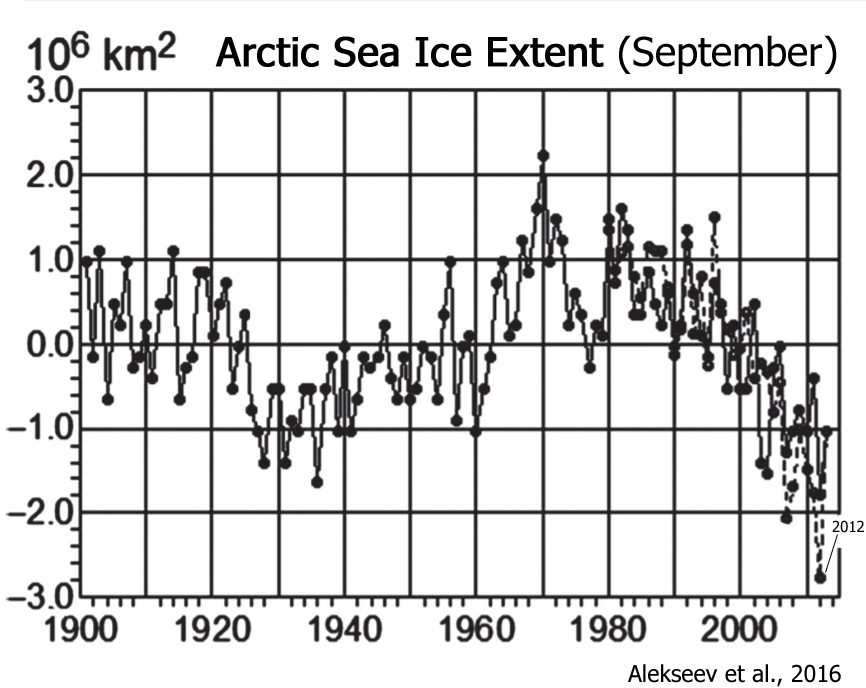
No Net Arctic Warming Trend Since The 1930s, 1940s
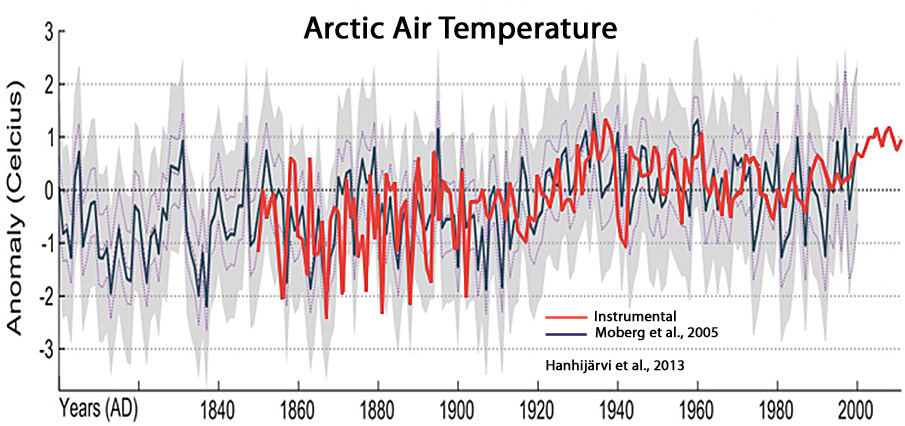
No Net Arctic Warming Trend Since 2005
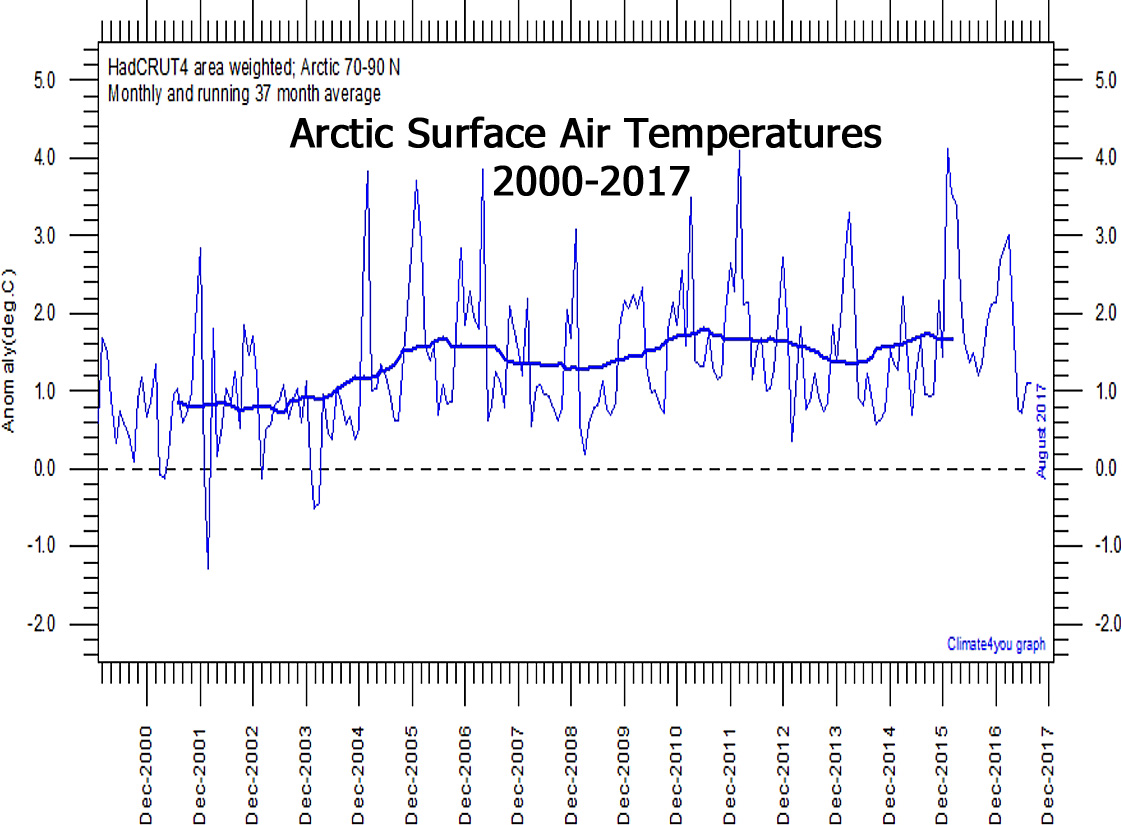
Graph Source: Climate4you
Also Defying Models, Antarctica Is Cooling, SH Sea Ice Is Growing
The Antarctic sea ice extent has been slowly increasing contrary to expected trends due to global warming and results from coupled climate models. After a record high extent in 2012 the extent was even higher in 2014 when the magnitude exceeded 20 × 106 km2 for the first time during the satellite era. … [T]he trend in sea ice cover is strongly influenced by the trend in surface temperature [cooling].
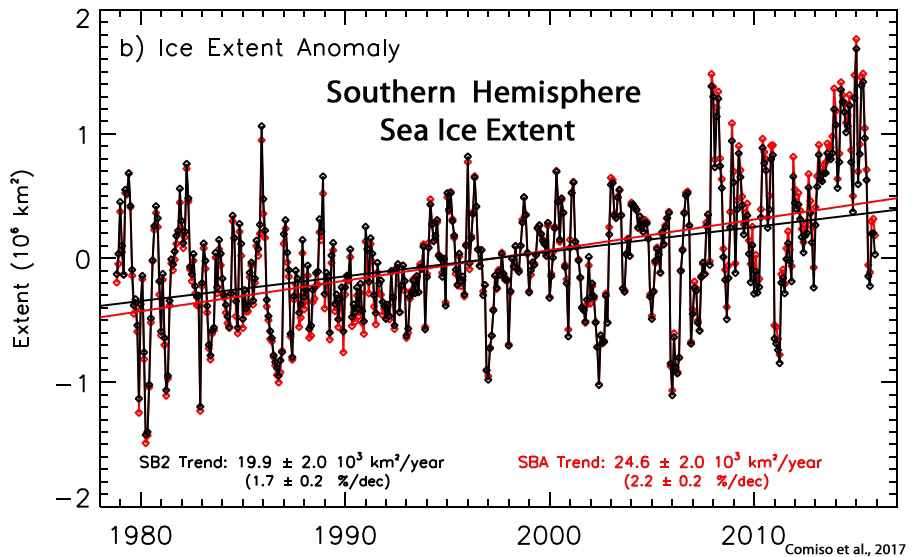
Compelling evidence indicates that the large increase in the SH [Southern Hemisphere] sea ice, recorded over recent years, arises from the impact of climate modes and their long–term trends. The examination of variability ranging from seasonal to interdecadal scales, and of trends within the climate patterns and total Antarctic sea ice concentration (SIC) for the 32–yr period (1982–2013) are the key focuses of this paper. Our results indicate that a progressive cooling affected the year–to–year climate of the sub–Antarctic since 1990s.
Antarctic sea ice extent has increased by approximately 1.5 % per decade since satellite observations began in 1979 (Parkinson and Cavalieri, 2012; Turner et al., 2015). The small overall increase masks higher-magnitude regional and seasonal trends around the continent, most notably an increase of 3.9 % per decade in the Ross Sea peaking during spring, and a decrease of −3.4 % per decade in the Amundsen and Bellingshausen seas peaking during autumn (Turner et al., 2015). By contrast, models in the Coupled Model Intercomparison Project Phase 5 (CMIP5) exhibit decreasing sea ice trends in all months (Turner et al., 2013a). The reasons for the disparity between observed and modelled trends are not yet well understood (Bindoff et al., 2013; Hobbs et al., 2016).
In stark contrast to the sharp decline in Arctic sea ice, there has been a steady increase in ice extent around Antarctica during the last three decades, especially in the Weddell and Ross seas. In general, climate models do not to capture this trend … This comparison shows that the summer sea ice edge was between 1.0 and 1.7° further north in the Weddell Sea during this period but that ice conditions were surprisingly comparable to the present day [during 1897-1917] in other sectors.
Over the past 37 years, satellite records show an increase in Antarctic sea ice cover that is most pronounced in the period of sea ice growth. … Detecting an anthropogenic signal in Antarctic sea ice is particularly challenging


If you graph the AMO upsidedown since 1900 it is an almost perfect match for the first graph.
The same cycle is apparent in global temperatures. (The graph is of detrended HadCRUT 3v to make the cycle easier to see.)
In short as the AMO reverses course Arctic sea ice extent will rise. Quite natural, and entirely predictable since the AMO is based on northern Atlantic sea surface temperatures. The Arctic ice cap is closely teleconnected to the Atlantic and isn’t much affected by goings on in the Pacific because of the narrowness of the Bering Strait.
The statement made in the opening paragraph is either a non-sequitor or a straw man:
“According to climate models, anthropogenic CO2 emissions drive trends in polar sea ice. The sea ice extent in both the Northern and Southern Hemispheres should therefore gradually decline (linearly) as human emissions rise.”
Specifically, the claim that sea ice extent should gradually (linearly) decline as a function of human emissions is what I would (respectfully) contest.
I would tend to agree with Bruce’s assessments, although there could be other factors than just the AMO as “causal”.
If I recall correctly, wasn’t Arctic Sea Ice actually rising in the mid-1970s?
“According to climate models, anthropogenic CO2 emissions drive trends in polar sea ice. The sea ice extent in both the Northern and Southern Hemispheres should therefore gradually decline (linearly) as human emissions rise.”
It’s neither a non-sequitur nor a straw man. It’s effectively quoting from RealClimate and SkepticalScience.
RealClimate: “The more important message from models is that all but a few outliers predict enourmous sea ice retreat this century. If humans can reduce the rise in emissions […], then sea ice retreat would be slower and rapid events would be rarer, according to the IPCC AR4 models.”
SkepticalScience: “Although natural factors have always influenced the state of Arctic sea ice, research strongly suggests that today’s decline is driven by the novel influence of anthropogenic CO2 we’ve added to the atmosphere and thus is unique in Earth’s history.”
Yes. That’s what these graphs and papers show.
To be clear, you do understand that it is not the position here that anthropogenic emissions drive sea ice trends, right? It’s the position taken by the IPCC and supporting blogs.
Kenneth, it is amazing how you are able to interpret things totally different than the rest of us.
This doesn’t say that sea ice extent is directly coupled with the CO2 concentration.
This doesn’t have your imagined claim in it either.
Kenneth, looking at sea ice extent it must be obvious that this largely depends on temperature and sea ice doesn’t melt when the temperature increases from -20 to -19 degrees. Do you agree or disagree?
I don’t have time to draw you a pretty graph, but even you should be able to realize how rising extent and then falling extent can come together with an increased greenhouse effect from CO2. Since, you know, CO2 isn’t the only thing influencing temperature on this planet. So let’s say the Sun was getting weaker and therefore the sea ice extent decreased until the 70s/80s. At the same time, the increasing CO2 effect worked against this negative forcing and reached a tipping point. And from then on the CO2 effect (regarding the artic) was bigger than the negative forcing from a weaker Sun (or the Sun stopped being weaker, whatever you want).
You think climate scientist actually mean that CO2 in the air drives sea ice extent and you don’t seem to understand the actual connection. Which is amazing. This is exactly what you are accusing scientists to have, confirmation bias. You seek out explanations (the weirder the better) that confirm you presuppositions. And post them without being the least bit skeptical 😉
“If humans can reduce the rise in emissions […], then sea ice retreat would be slower and rapid events would be rarer, according to the IPCC AR4 models.”
Of course it doesn’t. Because that’s not what I wrote. I wrote that, according to climate models, anthropogenic CO2 emissions drive trends in sea ice. As emissions rise, sea ice declines. That’s why it’s stated (RC) that reducing our CO2 emissions will lead to a reduction in the retreat of the sea ice, and that’s why it’s written (SkS) that “today’s decline is driven by the novel influence of anthropogenic CO2”. I used the same word – driven – that SkS uses.
The climate models (wrongly) projected Antarctic sea ice to decline, as detailed in the many papers in the article, precisely because they (the models) are predicated on the assumption that anthropogenic CO2 emissions are drivers of sea ice extent.
What “imagined claim” are you imagining (or concocting) that I’m making?
As I actually wrote (which is not what you wrote), I think the models projected that sea ice in both hemispheres would decline as a consequence of rising CO2 concentrations…because that’s what they actually do say. Why else would so many scientists/models have predicted an ice-free Arctic by 2013, or 2015, or 2020, or…sometime? Do these prognosticators think there is another main reason why the Arctic will be ice-free that is not related to rising CO2? What would that reason be?
6 out of 7 climate models projected a linear decline in Antarctic sea ice at a rate similar to that which has occurred in the Arctic. Why do you think they projected Antarctic sea ice will decline, SebastianH? What was the mechanism modeled to be causing that sea ice retreat (that didn’t happen)? If not anthropogenic CO2 emissions, what?
http://www.the-cryosphere.net/9/399/2015/tc-9-399-2015.pdf
“For the Antarctic, multi-model ensemble mean (MME) results can give good climatology of sea ice extent (SIE), but the linear trend is incorrect. The linear trend of satellite-observed Antarctic SIE is 1.29 (±0.57) × 105 km2 decade−1 ; only about 1/7 CMIP5 models show increasing trends, and the linear trend of CMIP5 MME is negative with the value of −3.36 (±0.15) × 105 km2 decade−1.”
Hi Kenneth,
Just to be clear:
1) personally, I doubt that either human CO2 emissions or atmospheric CO2 concentration are significant, let alone major drivers of arctic (or antarctic) sea ice extent. Obtaining evidence supporting or refuting that argument is difficult, as separating “natural” from “human” factors is a complex task.
2) I take exception to your use of the word “linear” describing the relation between [arctic] sea ice decline since 1979 as a necessary condition for the climate models value. Do you actually have a quote from someone claiming this? If not, this is indeed your own personal ‘non sequitur’ and straw man.
The overall trend (downwards) is linear according to climate models…there are no decadal-scale undulations. Climate models, which are rooted in CO2 emissions scenarios, consistently do not indicate that there will be 30-40 year periods of an increasing trend in sea ice expansion…ala an oscillation. Observations indicate that the latter (a sea ice decadal-scale oscillation) has characterized the pattern for both hemispheres.
The Antarctic, for example, experienced a warming trend and an overall sea ice decline during the 1950s to 1980s period (when Arctic sea ice was growing on the other side of the planet). In the last 3+ decades, the warming-cooling/declining-increasing oscillation switched hemispheres. Again, a gradually decreasing trend in both hemispheres was projected by models…due to assumptions about global CO2 emissions and their impacts on sea ice. Those models are wrong…because CO2 concentration does not drive sea ice.
http://www.cgd.ucar.edu/staff/cdeser/docs/fan.antarctic_seaice_trends.grl14.pdf
This study compares the distribution of surface climate trends over the Southern Ocean in austral summer between 1979–2011 and 1950–1978, using a wide variety of data sets including uninterpolated gridded marine archives, land station data, reanalysis, and satellite products. Apart from the Antarctic Peninsula and adjacent regions, sea surface temperatures and surface air temperatures decreased during 1979–2011, consistent with the expansion of Antarctic sea ice. In contrast, the Southern Ocean and coastal Antarctica warmed during 1950–1978.
http://onlinelibrary.wiley.com/doi/10.1002/2014GL059821/abstract
We present the first proxy record of sea-ice area (SIA) in the Ross Sea, Antarctica, from a 130 year coastal ice-core record. High-resolution deuterium excess data show prevailing stable SIA [sea ice area] from the 1880s until the 1950s, a 2–5% reduction from the mid-1950s to the early-1990s, and a 5% increase after 1993.
The warming-cooling/decline-increase oscillation for the Southern cryosphere is all quite consistent with natural variability…
http://journals.ametsoc.org/doi/abs/10.1175/JCLI-D-12-00281.1
During phases of deep convection the surface Southern Ocean warms, the abyssal Southern Ocean cools, Antarctic sea ice extent retreats, and the low-level atmospheric circulation over the Southern Ocean weakens. After the halt of deep convection, the surface Southern Ocean cools, the abyssal Southern Ocean warms, Antarctic sea ice expands, and the low-level atmospheric circulation over the Southern Ocean intensifies, consistent with what has been observed during the recent decades.
http://www.the-cryosphere.net/9/399/2015/tc-9-399-2015.pdf
“For the Antarctic, multi-model ensemble mean (MME) results can give good climatology of sea ice extent (SIE), but the linear trend [in models] is incorrect.
The [observed] linear trend of satellite-observed Antarctic SIE is +1.29 (±0.57) × 105 km2 decade−1 ; only about 1/7 CMIP5 models show increasing trends
“…the linear trend of CMIP5 MME [climate models] is negative with the value of −3.36 (±0.15) × 105 km2 decade−1.”
Why do you believe the models projected a negative linear trend in sea ice, Kurt? What other mechanism besides anthropogenic emissions did those modeled linear trends rest on?
Oh, please –
Kenneth, just because you take a linear average of a trend over a particular time period doesn’t mean that the relationship itself is linear (or that you or anyone else believe it should be linear).
I still didn’t see you cite a quote from a “mainstream climate scientist” claiming that the relationship between Arctic Sea Ice Extent and CO2 emissions should be linear.
If someone truly does believe this, e.g., as opposed to Arctic Sea Ice Extent over time being a cyclical phenomenon and/or could [also be] driven by factors other than CO2, then let’s see their claims.
I don’t exactly know who you believe should count or not count as “mainstream”, but here are some scientists (publishing in a mainstream science journal) who believe there is a direct, “straightforward”, easy-to-calculate, cause-effect relationship between human CO2 emissions increases and Arctic sea ice losses. In fact, they claim there is an identifiable emissions threshold (gigatons) that, once reached, will directly determine how much sea ice will be lost, allowing the range of years when the Arctic will be ice free to be calculated. Seems like a rather linear relationship to me.
http://www.climatecentral.org/news/heres-how-much-co2-will-make-the-arctic-ice-free-20844
Here’s How Much CO2 Will Make the Arctic Ice-Free
“The straightforward link between CO2 emissions and sea ice loss makes it easy to calculate just how much more CO2 can be emitted before the Arctic becomes ice-free, which researchers have defined as there being less than 1 million square kilometers (or about 390,000 square miles) of ice. By their reckoning, emitting another 1,000 gigatons of carbon dioxide would cause the ice to reach that threshold. At the current rate of annual emissions — about 35 gigatons per year — that point would be hit sometime mid-century.”
Thanks, Kenneth.
I stand corrected. Indeed, there are some who actually go out on a limb and claim a linear relationship. Astounding.
I see from looking further at your Climate Central link that Notz and Strove claim to see a ‘linear’ relationship between [cumulative] CO2 emissions and the [September] Arctic sea ice minima.
http://science.sciencemag.org/content/354/6313/747
From the cover article summary:
“Notz and Stroeve observed a linear relationship between the monthly-mean September sea-ice area and cumulative CO2 emissions. This allowed them to predict Arctic summer sea ice directly from the observational record. Interestingly, most models underestimate this loss.”
From the Abstract:
“… we used a robust linear relationship between monthly-mean September sea-ice area and cumulative carbon dioxide (CO2) emissions to infer the future evolution of Arctic summer sea ice directly from the observational record. The observed linear relationship implies a sustained loss of 3 ± 0.3 square meters of September sea-ice area per metric ton of CO2 emission.”
So these people are indeed setting themselves up for severe embarrassment when/if other factors begin outweighing whatever they are currently ascribing to cumulative CO2 emissions.
We’ll have to wait and see. If the Arctic Sea Ice September Minima display an increasing trend over the coming decade or two, that would appear to falsify the hypothesis of Notz and Stroeve.
Given the 20th C record of sea ice fluctuation, despite continually increasing CO2 emissions, the postulate that CO2 emissions drive Arctic Sea Ice looks rather weak. And the authors apparently cherry-picked the data (ignoring the evidence pre-1979).
Thank you, Kurt. Yes, I have read many of these direct, 1:1 linear relationship claims between emissions and sea ice. I figured you had too. That’s why, even a few posts in, I had still thought you might be just toying with me on this…like a very advanced sarcasm that only someone from Switzerland might employ. (o:
They really do believe that humans can control how much sea ice is in the Arctic by burning more or less fossil fuels. And these are scientists.
@ Kurt in Switzerland 27. October 2017 at 5:46 PM
The warmists say that the arctic ice loss is linear, and that it’s a consequence of CO2, so I’m not sure what you’re complaint is.
Previous comment should say “non-sequitur”
Tony Heller has some interesting observations about Arctic sea ice.
https://www.youtube.com/watch?v=nIEGo8E9s_8
Norwegians studied outflow of ice between Island and Greenland.
AMO is an index related to this flow (lows and highs).
Models are not.
https://www.aftenposten.no/viten/i/wVJvo/Mye-av-issmeltingen-i-Arktis-er-naturlig
[…] Read papers at No Tricks Zone […]