PART 3
206. Dyson, 1977
The magnitude of this negative feed-back effect of atmospheric CO2 upon itself depends on many ecological interactions which have yet to be disentangled. The effect could be negligibly small, or it could be as large as 3 x 10⁹ tons of carbon per yr. In summary, there is insufficient evidence to decide whether the carbon content of the biosphere has decreased, increased or remained stationary in response to the manifold human activities of recent decades. There exists a huge literature attempting to assess or to prognosticate the effects of the increasing atmospheric CO2 on the climate of the earth. Such attempts are useful and necessary, hut they run into formidable technical difficulties. Even the mean global temperature rise caused by a given quantity of CO2 is subject to great uncertainty: and the effects of CO2 on local and time-variable phenomena (which may be crucially important to agriculture and other human activities) are more uncertain still. It is possible that the rise in CO2 will be on balance beneficial to mankind, especially in reducing climatic extremes in very cold and very dry regions.
—–
207. Newell and Dopplick, 1979
Estimates of the atmospheric temperature changes due to a doubling of CO2 concentration have be with a standard radiative flux model. They yield temperature changes of >0.25 K. It appears that the much larger changes predicted by other models arise from additional water vapor evaporated into the atmosphere and not from the CO2 itself. … It is important to stress…that CO2 is not the main constituent involved in infrared transfer. Water vapor plays the major role and ozone is also of importance. With the infrared region divided into 22 spectral intervals, the infrared and solar fluxes have been computed at levels from the surface up to 5 mb using a procedure originally developed by Rodgers (1967) and modified by Dopplick (1972). The procedure has previously been applied to the computation of heating rates for increased CO2 concentrations (Newell and Dopplick, 1970; Newell et al., 1972). Table 1 gives the results of computations using standard climatological data for January. Twenty of the spectral intervals are dominated by water vapor and the other two contain CO2 (~15 µm) and O3 (~9.6 µm), although overlap with water vapor is also included. Calculations were performed for CO2 concentrations of 330 and 600 ppmv, taking care to include the changed CO2 concentrations also in the near-infrared solar absorption (cf. Newell et al., 1972). Both sets of computations were also repeated with cloud absent. The infrared flux dominated by CO2, as is well known, is only about 10% of that controlled by water vapor. The decrease in infrared flux from the surface to the atmosphere due to the increase in CO2 ranges from 1.0 – 1.6 W m-2. The increased CO2 yields additional absorption of solar infrared radiation and therefore a decrease of solar energy available at the surface which ranges up to ~0.3 W m-2. The net change at the surface is an increase of 0.8 – 1.5 W m-2 with the smallest values at low latitudes. … The fact that water vapor dominates CO2 in the radiation budget has been known and discussed for many years (see, e.g., Kondratiev and Niilisk, 1960; Möller, 1963; Zdunkowski et al., 1975) but it seems important to reemphasize when so much attention is being paid to CO2.
The conclusion is that at low latitudes the influence of doubling CO2 on surface temperatures is less than 0.25 K
—–
208. Singer, 1975
http://link.springer.com/chapter/10.1007/978-94-010-1729-9_3#page-1
We describe here the uses of various forms of energy, historical and future trends, and especially the various environmental effects. Chief among these are the increase in global carbon dioxide and the generation of waste heat. Their effects are judged to be noticeable but not serious at this time.
—–
209. Barrett, 1978
http://www.atmos.washington.edu/2008Q2/591A/Articles/barrett_IEEE_04071876.pdf
In particular, detection of an anthropogenic influence through statistical analysis alone requires a long run of data of good quality and careful attention to measures of significance. It is most important to avoid the post hoc ergo propter hoc fallacy that a trend of a few years’ duration or less, following some change in human activities, can be attributed to that change even when no sound physical causal relationship is evident. As an example of this error, the hemispherically cold winter of 1962-1963 was attributed by some to the resumption of nuclear weapons testing the year before; these people ignored the fact that the winter of 1941-1942 was approximately as cold. “Cycle-hunting” without a good physical hypothesis can also be misleading; the supposed periodicity may lie in a broad, flat maximum of the spectrum and thus be statistically insignificant. While one must presume that natural climatic fluctuations result from the operations of the laws of physics and chemistry, it is practically impossible to isolate simple cause-and-effect relationships in the internal workings of the earth-atmosphere-ocean system. This is because all the processes are interconnected by multiple nonlinear positive and negative feedbacks.
The CO2 increment since 1958 has been about 12 ppmv; the climatic effect of man-generated CO2 should therefore be a warming of about 0.07°C. Since the observed trend after 1940 has been a net cooling (see Fig. 1), it is clear that the effect of CO2 is buried in the noise level of other unexplained fluctuations. … Since the man-made contribution to the atmospheric aerosol with a long residence time is undetectable against the fluctuations in volcanic-dust loading, and since the thermal perturbations from even the largest eruptions are of the same order as other unexplained fluctuations, it can be concluded that man-generated aerosols are not exerting a measureable influence on global climate at present.
—–
210. Watt, 1971
http://ieeexplore.ieee.org/xpl/login.jsp?tp=&arnumber=5217849&url=http%3A%2F%2Fieeexplore.ieee.org%2Fxpls%2Fabs_all.jsp%3Farnumber%3D5217849
Atmospheric carbon dioxide, which amounts to 320 parts per million (ppm) by volume, rather than being a pollutant, is essentially a thread of life woven through the globe on which we live. In the past century alone, the amount of CO2 in the atmosphere has increased by 40 ppm, with levels increasing at a current rate of about 0.75 × 10¹⁰ tonnes per year. Fortunately, man can tolerate CO2 levels many times present concentrations, and plant life actually grows better at increased CO2 levels. What does cause concern is the effect that atmospheric CO2 has on the earth’s climate. It appears that the 40-ppm increase over the last century may have contributed to a global temperature increase of the order of 0.2 K. Since 1940, however, the global atmospheric temperature has been decreasing – an indication that other factors (such as atmospheric dust) are of much greater importance in determining the overall heat balance of the world.
—–
211. Callendar, 1961
http://onlinelibrary.wiley.com/doi/10.1002/qj.49708737102/abstract
It is thought that the regional and zonal distribution of recent climatic trends is incompatible with the hypothesis of increased solar heating as the cause. On the other hand, the major features of this distribution are not incompatible with the hypothesis of increased carbon dioxide radiation, if the rate of atmospheric mixing between the hemispheres is a matter of decades rather than years.
—–
212. Vardavas and Carter, 1985
http://www.sciencedirect.com/science/article/pii/0032063385900765
The response of the Earth’s global mean vertical atmospheric temperature structure to large increases in the atmospheric CO2 concentration was examined using a 1-D radiative-convective atmospheric model. It was found that the greenhouse warming of the terrestrial surface can be strongly inhibited by the development of a more isothermal, moister and higher troposphere than at present. The saturation of the strong CO2 infrared bands for high CO2 concentrations further inhibits the greenhouse warming to such an extent that a runaway greenhouse fuelled only by a rise in the atmospheric CO2 is not possible. However, a continuously rising solar-constant does eventually lead to a runaway.
—–
213. Braslau and Dave, 1973
http://journals.ametsoc.org/doi/pdf/10.1175/1520-0450%281973%29012%3C0601%3AEOAOTT%3E2.0.CO%3B2
In no way can the measured increase in CO2 account for the decrease in annual mean temperature of the surface observed since 1940 (Mitchell, 1961). … [W]e may conclude that evidence trying to support a continuous global build-up of atmospheric aerosol content due to increased human activities is, to a large extent, inconclusive (Mitchell, 1971). … Mitchell (1971) gives an approximate treatment for determining the effect of small changes in aerosol characteristics from an average reference atmosphere on the global climate. He concludes that the presence of stratospheric aerosols would lead to a cooling at the earth’s surface. … His analysis does not support the suggestion by other investigators that the apparent worldwide cooling of climate in recent decades is attributable to largescale increases of atmospheric aerosols by human activities.
—–
214. van Loon and Rogers, 1978
http://journals.ametsoc.org/doi/pdf/10.1175/1520-0493%281978%29106%3C0296%3ATSIWTB%3E2.0.CO%3B2
From the 1880’s till the 1930’s Oslo temperature was more often above the average than below, particularly during the second half of the period which created an upward trend over more than 50 years. During these years the type Greenland Below (that is, Europe above the mean) was the most frequent one most of the time, and to this was added a large increase of Both Above in the last two decades. Since the 1940’s the temperature at Oslo was more often below than above the long-term average, and during these three decades Greenland Above was the dominant type. It is thus plain that the long-term trends in these regions in winter are closely connected with changes in the frequency of circulation types. It is therefore unlikely that changes in atmospheric constituents [CO2] and aerosol content or in insolation directly caused the temperature trends [italics theirs], through regional trapping of longwave radiation or reflection of insolation. This conclusion is supported by the associate between temperature and pressure trends found among others by Lysgaard (1949), Petterssen (1949) and van Loon and Williams (1976).
Rising CO2 Leads to Cooling (7)
215. Bryson and Dittberner, 1976
http://journals.ametsoc.org/doi/abs/10.1175/1520-0469(1976)033%3C2094:ANEMOH%3E2.0.CO%3B2
A simple mean hemispheric temperature model has been constructed in the form of a differential equation which is a function of three independent variables: carbon dioxide content of the air, volcanic ejecta and anthropogenic particulate pollution. This model appears to simulate the behavior of Northern Hemisphere mean temperatures as well as they are known and gives a different pattern of behavior for the Southern Hemisphere. By more completely accounting for those anthropogenic processes which produce both lower tropospheric aerosols and carbon dioxide, such as fossil fuel burning and agricultural burning, we calculate an expected slight decrease in surface temperature with an increase in CO2 content. Though an invariant “solar constant” was assumed, an unmistakable 20–25 year periodicity was found in the difference between the calculated and observed direct solar flux reaching the earth’s surface, suggesting a definite but small periodic variation in the solar constant.
—–
216. Idso, 1983
https://dl.sciencesocieties.org/publications/jeq/abstracts/12/2/JEQ0120020159
Analyses of data from a number of sources indicate that (i) there was a gradual increase in global atmospheric CO2 concentration from about 1860 to 1945, (ii) there has been a much more rapid rate of increase in atmospheric CO2 concentration from 1945 to the present, (iii) the most recent trend of global surface air temperature during this period of rapid CO2 increase has been downwards, which is in contradiction to the predictions of the most sophisticated general circulational models of the atmosphere in use today, (iv) this downward trend in surface air temperature has been most pronounced in northern latitudes, which is also in contrast to the model predictions, and (v) the downward temperature trend has been greater in summer than in winter, which is again in contradiction to the models. It is thus concluded that the theoretical numerical models of the atmosphere are grossly in error in their predictions of future CO2 effects on world climate, as is also suggested by several recent empirical studies.
—–
217. Choudhury and Kukla, 1979
http://www.nature.com/nature/journal/v280/n5724/abs/280668a0.html
Impact of CO2 on cooling of snow and water surfaces
The levels of CO2 in the atmosphere are being increased by the burning of fossil fuels and reduction of biomass. It has been calculated that the increase in CO2 levels should lead to global warming because of increased absorption by the atmosphere of terrestrial longwave radiation in the far IR (>5 μm). From model computations, CO2 is expected to produce the largest climatic effect in high latitudes by reducing the size of ice and snow fields. We present here computations of spectral radiative transfer and scattering within a snow pack and water. The results suggest that CO2 significantly reduces the shortwave energy absorbed by the surface of snow and water. The energy deficit, when not compensated by downward atmospheric radiation, may delay the recrystallisation of snow and dissipation of pack-ice and result in a cooling rather than a warming effect.
—–
218. Dopplick, 1972
http://journals.ametsoc.org/doi/pdf/10.1175/1520-0469%281972%29029%3C1278%3ARHOTGA%3E2.0.CO%3B2
Computations of radiative heating for the global atmosphere
It is readily seen that water vapor acts to cool the atmosphere everywhere due to an increase of thermal flux with height. Maximum cooling occurs in the troposphere in low latitudes for both seasons associated with the large vertical gradients of water vapor and temperature. Relative minima of cooling are also found in the troposphere because of the influence of clouds with increased cooling above a cloud and decreased cooling below. … Figures 11 and 12 give the global thermal cooling by the 15 µm band of CO2 for December-February and June- August. Like ozone, overlap with water vapor has been taken into account and tropospheric cooling is predominantly due to water vapor although CO2 cooling is important near the surface.
—–
219. Idso, 1984
http://onlinelibrary.wiley.com/doi/10.1002/joc.3370040405/abstract
An analysis of northern, low and southern latitude temperature trends of the past century, along with available atmospheric CO2 concentration and industrial carbon production data, suggests that the true climatic effect of increasing the CO2 content of the atmosphere may be to cool the Earth and not warm it, contrary to most past analyses of this phenomenon. A physical mechanism is thus proposed to explain how CO2 may act as an inverse greenhouse gas in Earth’s atmosphere. However, a negative feedback mechanism related to a lowering of the planet’s mean surface albedo, due to the migration of more mesic-adapted vegetation onto arid and semi-arid lands as a result of the increased water use efficiency which most plants experience under high levels of atmospheric CO2, acts to counter this inverse greenhouse effect. Quantitative estimates of the magnitudes of both phenomena are made, and it is shown that they are probably compensatory. This finding suggests that we will not suffer any great climatic catastrophe but will instead reap great agricultural benefits from the rapid increase in atmospheric CO2 which we are currently experiencing and which is projected to continue for perhaps another century or two into the future.
—–
220. Ellsaesser, 1984
http://www.sciencedirect.com/science/article/pii/0004698184901185
https://www.researchgate.net/publication/222622330_The_climatic_effect_of_CO2_A_different_view
If additional greenhouse gases are added to the atmosphere, it is logical to expect that the greenhouse blanket will thicken; i.e., the average altitude from which the atmosphere emits energy to space will rise above its present level of 6 km. But, since the absorbed solar energy which has to be rejected remains essentially unchanged, the radiating temperature also must remain the same. That is, the average atmospheric temperature at the new higher level of the top of the greenhouse blanket must warm to the temperature existing now at the present top of the greenhouse blanket. And if the lapse rate remains the same, then the temperature of the Earth’s surface will also warm. This is a somewhat simplistic but physically valid picture of the mechanism by which increases in the greenhouse gas content of the atmosphere will lead to climatic warming. Unfortunately, this simple picture of how the greenhouse effect operates is of little help in quantifying the amount of warming to be expected. To see why this is so, examine Fig. 3 [p. 7]. This shows a terrestrial IR spectrum taken by Nimbus IV near Guam on 27 April 1970 on a background of temperature-labeled black body curves and with the wave length range of the principal atmospheric IR absorbers (emitters) indicated. It is obvious that water, including the dimer, (H2O)2 – believed to be responsible for the continuum absorption (and emission) of water vapor, is the principal emitter, without even considering the effect of clouds, which are also composed of water. And since this spectrum is taken at latitude 15.1°N, it appears quite credible that the global average temperature of this emitter is 255 K. On the other hand, the IR flux from the CO2 band centered near 15-microns, is both a small fraction of the total and is coming from an emitter with a temperature near 220 K (-50 to -55°C). Returning to Fig. 2, this temperature range is found in the altitude range 12 to 20 km. If the top of this CO2 greenhouse blanket were to be raised by the addition of CO2 and maintained at constant temperature, this would have little or no effect on the temperature at the surface and, if anything, might cause the surface to cool (i.e., if this radiating layer were pushed above 20 km without changing its temperature).
—–
221. Idso, 1984
http://www om/science/article/pii/0306261984900266
Current CO2-climate models are briefly reviewed in terms of their ability to simulate accurately real-world properties and processes. It is found that state-of-the-art models have many significant shortcomings which essentially preclude their being used as a basis for rational decision-making in the realm of energy policy and its relationship to climate.
Uncertainties, Lack of Climate Understanding, Climate Modeling Problems (30)
222. Essex, 1985
http://journals.ametsoc.org/doi/pdf/10.1175/1520-0469%281984%29041%3C1985%3ARATITO%3E2.0.CO%3B2
These results do not suggest that a thermodynamic approach to the understanding of climate is unsound. However, they do show, because of the importance of entropy radiation, that the climate engine is an anomalous nonequilibrium system to which the current theory of noneequilibrium thermodynamics cannot by correctly applied without modification. Thus, future studies of climate in this context have the potential to break new ground in the theory of nonequilibrium systems, let alone in climatology itself.
—–
223. Paltridge, 1975
http://onlinelibrary.wiley.com/doi/10.1002/qj.49710142906
http://www.climateaudit.info/pdf/models/paltridge.1975.pdf
Introduction: The motions of the atmosphere and ocean obey basic physical laws such as the conservation of mass, energy and momentum. However, these laws have not proved sufficient for closure of the problem of atmosphere-ocean dynamics. It is not yet possible to predict a priori either the global mean climate or the global distribution of climate. Further, it is not possible to calculate the change in climate which might occur as a result of a change in any of the external system parameters such as the energy output of the sun. Research on the problem is intense. The modern approach assumes that a solution will be possible when all significant processes affecting weather and climate can be described in sufficient detail. Vast numerical models have been developed which attempt to simulate global dynamics and climate at the maximum level of detail compatible with available computer (see for instance GARP Report 14 1973). The work is urgent and necessary, but it can be argued that the approach is at variance with a basic philosophy of physics which, when faced with a complex problem, searches for simple laws which may govern the overall situation. Ideally, such laws should be simple in both concept and application.
—–
224. Namias, 1980
http://onlinelibrary.wiley.com/doi/10.1029/JC085iC03p01585/full
Two scenarios for a moderate CO2-induced increase in temperature, a general hemispheric warming and a warming which is most intense in the Arctic, are examined by analysis of the warmest recent winters over the hemisphere and over the Arctic, respectively. Both cases are characterized by high-latitude blocking, relative cooling at lower latitudes, and strong regionalization of thickness anomaly patterns. A potential moderating influence by the oceans through increased CO2 absorption is discussed. Comparisons are made between latitudinal profiles of recent warm years and the results of the Manabe-Wetherald model studies. Overall, it appears that the climatic effects of CO2 variations may be much more complex than is often surmised, so it is not wise to draw inferences of regional anomalies from hemispheric means or latitudinal profiles.
—–
225. Idso, 1983
http://www.sciencedirect.com/science/article/pii/0004698183902561
Models and observations relative to the CO2-climate controversy are analyzed in a manner similar to Ellsaesser’s recent analysis of models and observations relative to the supersonic transport threat to the ozone layer. As in that earlier analysis, and as is explicit in all formulations of the scientific method, observations of surface air temperature prove to be much more reliable than atmospheric general circulation models in reconstructing recent climatic history. This finding leaves grave doubts about the ability of the models to predict our climatic future, specifically with respect to the effects of increasing atmospheric CO2 concentrations.
—–
226. Charlson, 1974
journals.co-action.net/index.php/tellusa/article/download/9840/
In the simplest case of direct radiative effect of aerosol without cloud involvement, disagreement exists on even the sign of temperature change to expect from secular changes on regional to global scales. Charlson & Pilat (1969) pointed out that the backscattering and absorption characteristics of atmospheric aerosol are not determined well enough to predict a heating or cooling trend due to future changes in aerosol loading in the atmosphere. Schneider (1971, 1972) and Rasool & Schneider (1971) reported that aerosols would uniquely cool the earth’s surface given one set of assumptions which were disputed by Charlson & Pilat (1971) and by Charlson et al. (1972). … There have been numerous attempts at estimated global aerosol budgets (Robinson & Robbins, 1971; Hidy & Brock, 1971; SMIC, 1971), all of which conclude that the human contribution is currently in the range between about 5 and 50% including all particle sizes
—–
227. Yamamoto and Tanaka, 1972
http://journals.ametsoc.org/doi/pdf/10.1175/1520-0469%281972%29029%3C1405%3AIOGADT%3E2.0.CO%3B2
[I]t is difficult to determine which of the two effects, CO2 and particles, is predominant since the rate of secular increase of the global average value of [atmospheric turbidity] is entirely unknown. However, it is noted that the local variability of [atmospheric turbidity] is evidently large compared to that of CO2, and that, as far as Japan is concerned, the recent increase of [atmospheric turbidity] is so rapid that the average [atmospheric turbidity] value will double in less than 20 years (Yamamoto et al., 1971). Global monitoring of particle concentration will be essential to the study of man’s impact on climate.
—–
228. Fletcher, 1968
https://www.rand.org/content/dam/rand/pubs/papers/2009/P3933.pdf
What Causes the Global Climate to Change? No one has been able to explain why such climatic variations occur. They seem to be associated with variations in the vigor of the whole global atmospheric circulation, but why the global system varies is still a mystery. It follows that the fundamental problem in the study of climatic change is the development of a quantitative understanding of the general circulation of the atmosphere; and, since three-fourths of the heat which forces the atmospheric motion comes by way of the ocean surface, a quantitative understanding of oceanic heat transport and ocean/atmosphere heat exchange is especially vital.
An adequate theoretical basis has not as yet been developed for explaining the interactions of the global heat engine and for accounting for observed changes in climate. Causal relationships have been obscured by the multitude of factors operating and problems for investigation have often been ill-defined.
From the foregoing considerations, we may conclude that man is probably inadvertently influencing global climate at the present time. Certainly several products of man’s activity are theoretically influential enough to do so within a few decades. However, there are so many variables and degrees of freedom in the global system that specific cause and effect estimates in this regard are very uncertain.
—–
229. Gilchrist, 1983
http://link.springer.com/chapter/10.1007/978-94-009-6998-8_7#page-1
Unlike some other pollutants introduced into the atmosphere by Man, carbon dioxide is naturally occurring and non-toxic. The direct effect of increased concentrations may be beneficial notably because it will tend to increase the rate of photosynthesis in plants. On the other hand, there may be deleterious effects through its influence on climate but this is still unproven and we cannot be certain whether, on a global scale, it will on the whole be harmful or beneficial. Taking an extreme view, it has been suggested that the induced climatic warming might be sufficient to cause surging and melting of glaciers and lead to the inundation of vast tracts of coastal land surface, with serious consequences for all mankind (see also Oerlemans this volume). A more general view seems to be that while some areas of the globe might experience a significant deterioration of the climate, in many parts the changes will be either beneficial or difficult to distinguish within the natural variability (see also Kellogg this volume). A third view is possible; that because of limitations in their formulations, models tend to exaggerate the effect on climate, and that consequently, no significant change will be observed. The strategy which should be adopted for research on carbon dioxide depends on which view is correct. … The problem of determining the effect of increased carbon dioxide on climate is difficult, the more so because there are some essential aspects of the physical basis of climate that are not well understood, and which it is the purpose of the World Climate Research Programme to elucidate during the next one or two decades.
—–
230. Roberts, 1975
http://ntrs.nasa.gov/archive/nasa/casi.ntrs.nasa.gov/19760007440.pdf#page=20
There are, of course, many different ideas about the origins of climate change. Many factors have been looked upon as potential causes: vulcanism, sea surface temperature changes, changes in CO2 content of the atmosphere, oscillations in Arctic ice and sea depth, and atmospheric turbidity changes due to manmade dust or wind-blown soil and sand. These theories, including the solar one, share the difficulty that they have not yet reached the stage where convincing experimental verification is possible. It may turn out that climate changes occur for a number of different reasons and that more than one theory will ultimately be verified. Meanwhile, it is important to follow forcefully all promising leads that have any chance of advancing our climate forecasting skills and to devise critical experiments and analyses to determine which leads are the most significant.
—–
231. Shutts and Green, 1972
http://www.nature.com/nature/journal/v276/n5686/abs/276339a0.html
Many theories about climate change are essentially untestable, but we can still develop a consistent model based on understandable physics—in fact the data cannot be interpreted without one. Shutts and Green believe there is some fundamental defect in all present models: it could be something physically improbable, like an unreasonable effect of tiny solar variations. More likely there is a fundamental lack in our appreciation of how very interactive systems behave.
—–
232. Harley, 1980
http://journals.ametsoc.org/doi/pdf/10.1175/1520-0493%281980%29108%3C0235%3ATSOCCI%3E2.0.CO%3B2
The Significance of Climatic Change in the Northern Hemisphere 1949-1978
Abstract: Evidence of a change to a cooler regime in the lower troposphere is found in East Asia in summer, and in eastern North America in winter. Thirty years of data are found of insufficient length to determine whether the cooling constitutes a climatic change under the given criteria. No evidence of climatic warming is found.
Introduction: In recent years there has been increasing recognition of the impact of climatic variation on mankind’s economic and social conditions. For example, episodes such as the severe drought in the Sahel region of North Africa in the early 1970’s have excited worldwide interest in the popular press and in scientific circles. At the same time, there is growing realization that man’s own activities may be having an effect on climate, though the extent of the effect is not yet fully understood (Lamb, 1973).
—–
233. Barnett, 1985
http://www.osti.gov/scitech/servlets/purl/6264945 (pgs. 91-108)
Introduction: To determine whether increasing amounts of CO2 are changing key ocean properties, it is necessary to know two things: (1) There must be a priori theoretical predictions of the oceanic changes expected from increased CO2 levels. Aside from obvious, qualitative statements about warming of the near-surface waters, such predictions have yet to be made. Thus, one is left with a discussion of the background noise levels in the ocean data set over which any signal must be detected. (2) With this latter point in mind one must know the past history of key ocean variables. Unfortunately, the oceans have been, and still are, imperfectly monitored. The average global distribution of surface temperature, salinity, and sea level are known, but in many areas nothing is known of the secular and shorter term temporal variations of these parameters. Yet, it is just such information that is needed to detect any CO2 -induced changes.
Conclusion: Climate changes in key ocean variables over the last 80-100 years are rather poorly documented. One of the best observed variables is sea level. However, the data coverage for this variable is poor in the central ocean regions and almost nonexistent in the Southern Hemisphere, making estimation of global sea level change impossible. Analyses of existing limited data suggest changes in relative sea level of 10-25 cm per century along many, but not all, of the continental margins. Another well-observed variable is sea surface temperature (SST). Global coverage is again a problem, but more serious is the apparent, but fictitious, increase in SST due to instrumental bias. Despite this problem , it appears that changes in SST and air temperature over the ocean may differ significantly from air temperature trends measured over land. Temperature at, or immediately over, the ocean surface must be included proportionately in any estimate of global temperature change. Information on changes in the oceans’ interior temperature, salinity, and density are meager at best. Local changes in some of these variables have apparently been found in the few high data density areas. However, these changes fit no apparent systematic pattern. Furthermore, small-scale features (eddies, internal waves) in the oceans introduce such high noise levels in attempts to study ocean-wide changes in temperature, salinity and density, that inferred trends over the last 50 years are generally a factor of 10 less than the uncertainty of their estimates. Use of different measurements of ocean property change might reduce these noise levels.
The bleak picture described above is not without hope. The following actions, if taken now, will make possible the detection of a CO2 signal in the ocean, if it exists, much more likely.
—–
234. Oerlemans, 1982
http://dspace.library.uu.nl/bitstream/handle/1874/22243/oerlemans_82_responseoftheantarticicesheet.pdf?sequence=1
Abstract: It is generally believed that the increasing CO2 content of the atmosphere will lead to a substantial climatic warming in the polar regions. In this study the effect of consequent changes in the ice accumulation rate over the Antarctic Ice Sheet is investigated by means of a numerical ice flow model. In the model runs, temperature increases linearly with time during 100 years, and is kept constant afterwards. The results indicate that a climatic warming will probably lead to a sea-level lowering of some tens of centimetres in the next centuries. This is because for Antarctic conditions the increase in snow accumulation exceeds the increase in melting. This estimate does not take into account .the effects of possible surging of parts of the Antarctic Ice Sheet and. the” response of the, Greenland Ice Sheet (which may be quite different).
Conclusion: This estimate is subject to a number of uncertainties. First of all, opinions about the effect of an increasing CO2 content of the atmosphere differ widely. It is generally accepted that a warming has to be expected, but its magnitude is subject to much debate. Even if we did know the effect of CO2 on climate, things would not be much clearer. The global carbon cycle is poorly understood and we are not yet able to predict (given the anthropogenic CO2 input) the content of the atmosphere for next centuries. … Finally, the steady-state problem remains. According to the present study the Antarctic Ice Sheet is not in equilibrium, but grows at a rate that is larger than the growth induced by the climatic warming. Present-day observations do not yet provide a reliable answer about the departure from equilibrium of the present Antarctic and Greenland Ice Sheets. It is obvious that more detailed modeling can help to solve this problem.
—–
235. Damon and Kunen, 1976
http://science.sciencemag.org/content/193/4252/447
The world’s inhabitants, including Scientists, live primarily in the Northern Hemisphere. It is quite natural to be concerned about events that occur close to home and neglect faraway events. Hence, it is not surprising that so little attention has been given to the Southern Hemisphere. Evidence for global cooling has been based, in large part, on a severe cooling trend at high northern latitudes. This article points out that the Northern Hemisphere cooling trend appears to be out of phase with a warming trend at high latitudes in the Southern Hemisphere. The data are scanty. We cannot be sure that these temperature fluctuations are not the result of natural causes.
—–
236. Peterson, 1969
http://pubs.acs.org/doi/abs/10.1021/es60034a011
The atmosphere today contains about 21% O2 and 0.032% CO2 by volume. However, man’s activities – mainly land-clearing, the burning of fossil fuels, and making cement from limestone – are artificially reducing the O2 content and increasing the CO2 content of the air. The burning of fossil fuels is primarily responsible, but the other two factors should not be ignored. The long-term effects of these changes in atmospheric gases [CO2, O2] upon world weather and upon man’s environment are of vital interest to everyone, since worldwide temperatures may rise or fall in response to the amount of CO2. Changes that occurred within the past century are barely discernible. They have attracted little attention. One reason is that the study of such phenomena involves several sciences, whereas our scientific efforts are focused primarily by individual disciplines. Perhaps changes in the atmosphere and world weather will be obvious to all by the year 2000.
—–
237. Watts, 1980
http://link.springer.com/article/10.1007/BF00137207#page-1
Introduction: It is difficult at this time to draw definitive conclusions regarding the effects on climate of a doubling of atmospheric CO2. Mark Twain once wrote: “There is something fascinating about science. One gets such wholesale returns of conjecture from such trifling investment of fact.” The investment in time and energy by the many scientists involved in climate modeling has been far from trifling. The problem of climate modeling is, however, an extraordinarily difficult one. Although few hard facts are known about the response of the environment to a CO2 doubling, it would seem irresponsible not to speculate on the possibilities (Baes et al., 1976).
—–
238. Woillard, 1979
http://www.nature.com/nature/journal/v281/n5732/abs/281558a0.html
Close study of past interglacials might indicate how and when the present interglacial will end and whether we are heading towards a warming or a cooling. No certain prediction has been possible because of man’s interference with the environment.
—–
239. Catchpole, 1973
http://onlinelibrary.wiley.com/doi/10.1002/j.1477-8696.1973.tb00827.x/abstract
Sellers (1965, p. 198) regretted that while ‘the literature has been saturated with theories of climatic change . . . uncertainty is the only thing that is certain’. Crowe (1971, p. 471) conceded that although palaeoclimatology asks straightforward questions about the nature and causes of climatic changes, ‘the answers still largely elude us’. In the same year Flint (1971, p. 789) appealed that we should ‘admit at once that we do not know what are the basic causes of climatic change’.
—–
240. Ellsaesser et al., 1976
http://twister.ou.edu/QJ/CD1-1971-1980/1976/v102n433/s10.pdf
Introduction: Consideration of man’s impact on his habitat has led to renewed speculation that man has altered or may soon alter our climate. The despairing destruction of human societies accompanying the Sahelian drought has rekindled the arguments that expanding deserts are the product of man. Several scenarios have been proposed as to how such disasters are created. These agree in ascribing to man the initiating role of denudation through overgrazing or excessive cultivation of marginal land.
Conclusion: It would be unwarranted to conclude from the similar experimental results of Charney et al. and ourselves that the Sahara is man-made, or that man has changed or is on the verge of changing our climate. … It should be noted that while the albedo feedback mechanism was positive for tropical desert precipitation (i.e. increased albedo → reduced rainfall → less plant growth → further increased albedo → enhanced desertification) it was negative both locally and globally in its effect on temperature, at least if deserts are associated with high temperature (i.e. increased albedo → greater rejection of solar energy → lower temperature → reduced evapotranspiration → desert moderating itsefl). The negative feedback in temperature was enhanced through the global reduction in precipitable water reducing the ‘greenhouse’ effect of water vapour, an effect amplified locally by increased subsidence.
—–
241. Mac Cracken, 1982
http://www.osti.gov/scitech/biblio/6726347
Several recent studies have contended that the increase in CO2 concentrations since the start of the Industrial Revolution has led to identifiable climatic warming. Significant approximations and simplifications have had to be made, however, in order to isolate this supposed CO2 effect from the comparably large latitudinal and temporal temperature variations that may have been due to changes in volcanism, solar variability, other potentially identifiable causal factors, or natural fluctuations. To overcome the resulting uncertainties, data bases must be improved, diagnostic analyses and numerical models must more completely treat the spatial and temporal patterns and phase relations of the expected changes, and a careful search for a set of CO2-specific climate modifications must be undertaken.
—–
242. MacDonald, 1968
https://coto2.files.wordpress.com/2013/11/1968-macdonald-how-to-wreck-the-planet.pdf
There has been much controversy in recent years about conjectured overall effects on the world’s climate of emissions of carbon dioxide to the atmosphere from furnaces and engines burning fossil fuels, and some about possible influences of the exhaust from large rockets on the transparency of the upper atmosphere. Carbon dioxide placed in the atmosphere since the start of the industrial revolution has produced an increase in the average temperature of the lower atmosphere of a few tenths of a degree Fahrenheit. The water vapour that may be introduced into the stratosphere by the supersonic transport may also result in a similar temperature rise. In principle it would be feasible to introduce material into the upper atmosphere that would absorb either incoming light (thereby cooling the surface) or outgoing heat (thereby warming the surface). … If a nation’s meteorologists calculated that a general warming or cooling of the Earth was in their national interest, improving their climate while worsening others, the temptation to release materials from high-altitude rockets might exist. At present we know too little about the paradoxical effects of warming and cooling, however, to tell what the outcome might be.
—–
243. Dansgaard et al., 1972
http://www.sciencedirect.com/science/article/pii/0033589472900634
A spectacular 10‰ drop in the 18O16O ratio (δ) in precipitation indicative of rapid cooling occurred at Camp Century, Greenland, 89,500 y.a. The timing is based upon an assumption of δ periodicity being constant in time. Onset of the Wisconsin pleniglacial is reflected by 6‰ δ drop at 73,000 BP. Similar event might have occurred 109,000 y.a., but the core at corresponding depth is missing. Could it also happen today?
—–
244. Gates, 1985
http://www.osti.gov/scitech/servlets/purl/5885458/#page=86
A second major problem of climate modeling, and the one most directly concerned with the model’s physics, is improvement of the representation of important climatic processes. Better treatments of clouds, convection, the surface boundary layer, and dissipative processes are required. In general, present models simulate the observed cloudiness rather poorly, especially the occurrence of non precipitating stratiform and cirrus clouds and the diurnal variation of low-level clouds, and, at present, take no account of the advection of cloud or of cloud microphysics. The parameterization of clouds and convection is also closely related to the behavior of the planetary boundary layer, the treatment of which also needs to be improved in nearly all climate models.
A third critical problem in climate modeling is the need to use models that actively couple the world’s oceans with the atmosphere. Although a number of oceanic GCMs have been provisionally coupled with atmospheric models, none of these models has taken into proper account the oceanic surface mixed layer that controls the all-important variations of sea surface temperature. Compared with the atmosphere, the oceans are relatively resistant to large decreases of surface temperature because of the downward vertical mixing that occurs as a result of unstable stratification.
—–
245. Meier, 1983
http://www.tandfonline.com/doi/pdf/10.1080/02626668309491140
Should we expect a “threat of disaster” (Mercer, 1978) with sea level and climate in the next 50 years? The obvious answer is no; the complex ice/ocean/atmosphere system is not sufficiently understood. The West Antarctic Ice Sheet may be robust to rapid oceanographic or atmospheric forcing (Whillans, 1978). Unfortunately, we are not even sure whether its grounding lines are currently advancing or retreating, and we certainly do not understand how surges are triggered. Until such understanding is at hand, and atmospheric-oceanographic circulation models are developed that perform well at high latitudes, we can only watch what is happening.
—–
246. Sachs, 1976
http://onlinelibrary.wiley.com/doi/10.1029/JC081i018p03141/abstract
However, the data indicate that Weyl’s model for the inception or the termination of a Glacial Epoch is inadequate. This test shows that patterns of climatic change can be resolved with increasingly greater detail but that ‘first causes’ of climatic change remain elusive.
—–
247. Enting et al., 1984
http://link.springer.com/article/10.1007/BF00212633#page-1
The various limitations of a recent analysis of climatic variations in terms of solar volcanic and carbon dioxide forcing have been examined in more detail. In particular, the possibility of additional CO2 release from forest clearing greatly increases the very large statistical uncertainties in the original analysis. While the inclusion of the various forcing terms is a highly desirable approach, the uncertainties in the data used mean that it is not appropriate to suggest that ‘the surface warming due to the greenhouse effect has now been roughly determined’.
—–
248. Van der Veen, 1985
http://www.sciencedirect.com/science/article/pii/0033589485900493
A numerical model was designed to study the stability of a marine ice sheet, and used to do some basic experiments. The ice-shelf/ice-sheet interaction enters through the flow law in which the longitudinal stress is also taken into account. Instead of applying the model to some (measured) profile and showing that this is unstable (as is common practice in other studies), an attempt is made to simulate a whole cycle of growth and retreat of a marine ice sheet, although none of the model sheets is particularly sensitive to changes in environmental conditions. The question as to what might happen to the West Antarctic Ice Sheet in the near future when a climatic warming can be expected as a result of the CO2 effect, seems to be open for discussion again. From the results presented in this paper one can infer that a collapse, caused by increased melting on the ice shelves, is not very likely.
—–
249. Ellsaesser et al., 1986
http://onlinelibrary.wiley.com/doi/10.1029/RG024i004p00745/abstract
Recent results from climate models have led to the prediction that a global warming due to increasing atmospheric CO2 is now imminent, if it has not already occurred. In an effort to develop more definitive information on this question, a detailed review has been conducted of prior efforts to unravel climatic change from the various types of recorded observational data available. Most of the more definitive of the prior analyses—along with evaluative comments by the various authors—have been assembled herein. There appears little doubt that the average surface air temperature of at least northern hemisphere has been increasing since the beginning of recorded data with most of the warming occurring in a brief period circa 1920. The fragmentary early data suggest significant cooling prior to 1883 such that 25–50% of the subsequent warming may represent a return to earlier levels. Whether the overall warming constitutes a climate change remains an unresolved problem, as does the cause of the warming.
—–
250. Lorenz, 1968
http://web.mit.edu/lorenzcenter/about/LorenzPubs/Climatic_Determinism_1968.pdf
Conclusions: Despite our meager knowledge of almost-intrasitivity, we can draw a few conclusions. For one thing, the mere existence of long-term climatic changes cannot by itself be taken as proof of environmental changes; alternative explanations are now available. Finally, what about the not unlikely possibility that the atmosphere would be almost-intransitive if the environmental influences were constant, while at the same time external environmental changes actually are taking place? The effect of these changes will then be more difficult to establish. For example, an environmental change which ought to bring about a 2C temperature rise might occur just at the time when the temperature was in the process of falling 2C as a result of almost-intransitivity. The environmental change might then go unnoticed simply because no one would see any reason to look for it.
—–
251. Barnett, 1984
http://onlinelibrary.wiley.com/doi/10.1029/JC089iC05p07980/full
An objective method of estimating regional averages of coherent sea level (SL) change is developed. The technique is applied to a large set of SL data representative of most of the world’s continental margins. The results show highly coherent SL changes over many of the regions studied. The method is then applied to the regional averages themselves to develop an overall estimate of the coherent pattern of SL variations existing in the historical SL data set. The pattern is characterized by a coherent rise of SL in all regions except Alaska, Scandinavia (both areas of notorious crustal uplift), and Southeast Asia, where SL appears to be falling. The analysis suggests little or no change in SL prior to the early 1900’s. The period since that time has seen an increase in SL that is optimally fit by a linear trend of 23 cm/century. The study results suggest that it is not possible to uniquely determine either a global rate of change of SL or even the average rate of change associated with the existing (inadequate) data set. Indeed, different analysis methods, by themselves, can cause 50% variations in the estimates of SL trend in the existing data set. A signal/noise analysis suggests it should be easy to detect small, future changes in the SL trends estimated for the period 1930–1980. However, detection of theoretically predicted low-frequency signals (e.g., caused by CO2 warming) will be difficult in view of the huge, low-frequency, natural variability associated with glacial/tectonic processes.
Miscellaneous Questionable Human, CO2 Influence on Climate (12)
252. Boer and Higuchi, 1980
http://journals.ametsoc.org/doi/pdf/10.1175/1520-0493%281980%29108%3C1326%3AASOCV%3E2.0.CO%3B2
In recent years there has been increasing concern about climatic change and variability and its influence on man and his activities. This concern has been formally expressed in a WMO statement on climate change and variability (WMO, 1976). Many studies concerning climate change have been undertaken. Most studies have concentrated on long-term trends in temperature. … There appears to be a general belief that the climate has become more “variable” in recent times. For instance, there is the suggestion that “since the 1940’s and 1950’s . . . the atmospheric circulation in the Northern Hemisphere appears to have shifted in a manner suggestive of an increasing amplitude of the planetary waves and of greater extremes of weather conditions in many areas of the world” (GARP, 1975, p. 16).
The results of this study do not support the contention that the climate has become significantly more variable, nor do they support a connection between variability and either mean temperature or north-south variation of temperature.
—–
253. Polozova and Rubinshteyn, 1964
http://www.tandfonline.com/doi/abs/10.1080/00385417.1964.10770073
Using the method of moving averages to smooth out short-term fluctuations, the authors have analyzed long-term temperature trends at 187 stations. They find that, contrary to previous studies, one cannot speak in general of a warming or cooling trend for the earth as a whole and that trends vary from place to place and from month to month. The greatest systematic temperature fluctuations are observed in the Northern Hemisphere north of Lat. 40° N.).
—–
254. Mason, 1976
http://onlinelibrary.wiley.com/doi/10.1002/qj.49710243302/abstract
One of the most marked and important developments in meteorology in the last few years has been the sudden upsurge of interest in the subject of climate and climatic change. … Although I think that the likelihood of major and potentially catastrophic changes in climate has been grossly exaggerated, the subject is of sufficient potential importance and concern to merit a sustained research programme aimed at determining past and current trends more reliably and at improving our understanding of the underlying mechanisms.
—–
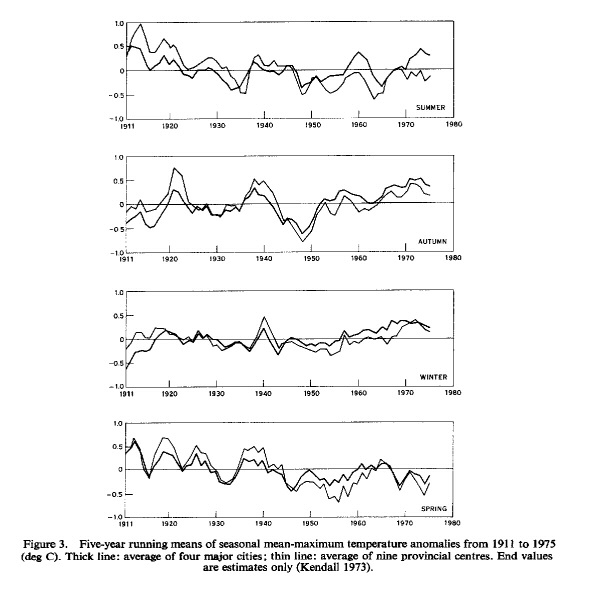 Recent Variations in Annual Mean Temperatures Over Australia
[Graph shows no warming, and slight cooling over all of Australia from 1911-1975.]
—–
255. Lorenz, 1976
https://www.researchgate.net/publication/248574108_Nondeterministic_Theories_of_Climatic_Change
A basic assumption in some climatic theories is that, given the physical properties of the atmosphere and the underlying ocean and land, specified environmental parameters (amount of solar heating, etc.) would determine a unique climate and that climatic changes therefore result from changes in the environment. The possibility that no such unique climate exists and that nondeterministic factors are wholly or partly responsible for long-period fluctuations of the atmosphere-ocean-earth system, is considered.
—–
256. Bryson, 1975
http://journals.cambridge.org/action/displayAbstract?fromPage=online&aid=5947812&fileId=S0376892900001296#
Studies of past climates show unequivocally what can happen to our atmospheric environment. From climatic history we can learn several very specific lessons. The climate can change rapidly. Major climatic changes, such as the change from glacial to non-glacial conditions, can occur in a few centuries, even though the adjustment of biota and the wasting of continental ice-sheets may take longer. Smaller changes may take only decades. Changed climatic states may persist for centuries or millennia. While the climatic excursion of this century appears to have lasted half-a-century or so, the ‘little ice-age’ was at least three centuries long (roughly 1550–1850 A.D.), a North American drought period lasted two centuries, and there was a monsoon failure of seven centuries. These have all been recorded in the evidence of Nature. Climatic changes may occur in different senses in different parts of the world. This paper has outlined several cases where cooling in the sub-Arctic was associated with reduced rainfall or increased frequency of failure of the monsoon, and a case in which drought in North America was concomitant with wet weather in western Europe. The climate we think of as normal is quite abnormal by the standards of the past few centuries, and the magnitude of the change since 1945 is significant by comparison with similar changes in the past.
—–
257. Flohn, 1983
https://www2.meteo.uni-bonn.de/bibliothek/Flohn_Publikationen/K287-K320_1981-1985/K305.pdf
The search for an appropriate mechanism leads to a well-known short-term climatic fluctuation with a time scale of only a few months or years: the switch from oceanic upwelling to downwelling in the equatorial Pacific and Atlantic, usual called ‘El Nino’ after its local occurrence along the Peruvian coast. A remarkable positive correlation between the equatorial Pacific sea surface temperature (SST) and the interannual rate of increase of atmospheric content at Mauna Loa has been found (Keeling & Bacastow 1977, Angell 1981). Newell et aL. (1978) and Baes (1981) suggested that organisms in the nutrient-rich cold upwelling water consume more atmosphecic CO 2 than those in barren warm water, and thus reduce the expected CO2 increase in the atmosphere. The average CO2 increase during a composite of five years (between 1958 and 1974) with prevailing upwelling was only 0.57 ppm yr– 1; during a different composite of five years with dominantly warm water, CO2 rose by 1.11 ppm yr-1. This difference is equivalent to ~ 1 GT carbon yr- 1 (1 GT = 1012 kg), i.e., about 40% of the annual input of CO2 into the atmosphere arising from fossil fuel. Thus, under purely natural conditions (i.e., with a stationary CO2 budget), atmospheric CO2 should decrease during upwelling and increase during downwelling episodes. Such observed variations need to be taken into account when the geophysical mechanisms of climatic change at a time scale of 103 yr are discussed.
Advanced climate models capable of investigating the effects of a CO2 level (Ramanathan 1981) have shown that atmospheric water vapour contributes greatly to the CO2 ‘greenhouse effect’ in these models. Two related processes are responsible: causes an increase of evaporation and thus of the H2O content of the atmosphere thereby leading to a substantial greenhouse effect; condensation and precipitation of additional liberate more latent heat. Other models (Newell & Gates et al. 1981), which isolate the CO2 effect by excluding any in H2O content, yielded no significant warming.
—–
258. Flohn, 1982
https://www2.meteo.uni-bonn.de/bibliothek/Flohn_Publikationen/K287-K320_1981-1985/K299.pdf
The role of the carbon budget has aroused general interest among paleoclimatologists, after Delmas et al., (1980), Berner et al., (1980) and Oeschger (in et al. 1980) found evidence in Antarctic and Greenland ice cores, that the CO2-content of the atmosphere has varied between about 180 ppm during the last glacial (18 ka ago, ka = 103 years) and about 350 ppm (perhaps 400 ppm) during the Holocene warm epoch 6-8 ka ago. Due to the recent wide-spread concern about the climatic consequences of the continuous increase of atmospheric CO2 (Bach, 1980), from about 295 ppm at the end of the 19th century to nearly 340 ppm (1981), the problem of the carbon budget in atmosphere, ocean and biosphere is now thoroughly investigated. … The recent increase of the CO2-content of air varies distinctly from year to year, rather independent from the irregular annual increase of global CO2-production from fossil fuel and cement, which has since 1973 decreased from about 4.5 percent to 2.25 percent per year (Rotty 1981). Comparative investigations (Keeling and Bacastow 1977, Newll et al. 1978, Angell 1981) found a positive correlation between the rate of increase of atmospheric CO2 and the fluctuations of sea surface temperature (SST) in the equatorial Pacific, which are caused by rather abrupt changes between upwelling cool water and downwelling warm water (“El Niño”) in the eastern equatorial Pacific.
—–
259. Warren, 1982
http://www.atmos.washington.edu/~sgw/PAPERS/1982_ice_essay.pdf
Carbon Dioxide: Other feedbacks are now appearing which are likely to affect the magnitude of glacial-interglacial climatic changes, however these changes are initially forced. The lowered CO2 content of the atmosphere toward the end of the Wisconsin (Neftel et al., 1982) very likely helped cool the climate, and it may well have been the result of the glaciation itself. Broecker (1982) showed how this might happen. Deposition of phosphate-rich biological sediments on shelves when sea level rises, and erosion of these shelves when sea level drops, causes the phosphate content of ocean surface water to be higher during glacial times when sea level is low. The biological productivity of surface water, limited by phosphate, would thus be higher in glacial times and would fix more CO2, reducing the CO2 concentration in surface waters and thus also in the atmosphere. Another mechanism for increasing atmospheric CO2 as sea level rose is that of Berger (1982): coral reef growth precipitates CaCO3, from bicarbonate, thus acidifying the ocean surface water and releasing CO2. … Other forcings which can cause climatic change in a ‘transitive’ climatic system are sustained changes in solar output and changes in atmospheric content (e.g. CO2, volcanic ash). [However, the atmospheric CO2 content, as mentioned above, may not be an ‘external’ cause but may actually be affected by ice sheet sizes. The same may true for the level of volcanic activity, as suggested by Rampino et al. (1979). Gow and Williamson (1971) found much more volcanic ash in the Byrd Station core in ice corresponding to the last glacial maximum. A nearby source was indicated, suggesting that the Antarctic volcanoes were more active at that time, possibly responding to the increase in ice load (Kyle et al., 1981)].
—–
260. Ramanathan et al., 1985
http://onlinelibrary.wiley.com/doi/10.1029/JD090iD03p05547/full
For the projected trace gas increase, we compute the stratospheric O3 change by employing a photochemical model coupled to the radiative-convective model. The O3 change cools the stratosphere and the magnitude of the cooling is as large as that due to the projected CO2 increase. Because of the O3-induced stratospheric cooling and the surface warming due to the greenhouse effect, the trace gas effects on climate are virtually indistinguishable from those of CO2.
—–
261. Lamb, 1982
https://www.jstor.org/stable/40570561
It is true that urban development has by now artificially warmed the climate in most big cities, which are now on over-all average, up to 1.5 to 2°C warmer than the surrounding countryside, but since Valentia at the south-west tip of Ireland, and the Arctic stations, were also strongly affected by the twentieth century warming, there has been at least some general warming earlier in the present century. The same applies to the briefer warming episode in the 1970s, between about 1973 and 1976, though the decade on over-all average was colder at these places than the previous four to five decades. The mid-1970s warm episode seems also to have been of more limited extent than that in the 1920s and ’30s and more clearly associated with particular patterns of the wind circulation.
—–
262. Cobb, 1973
http://journals.ametsoc.org/doi/pdf/10.1175/1520-0469%281973%29030%3C0101%3AOALDFM%3E2.0.CO%3B2
It has been estimated (Squires, 1966; Selezneva, 1966; Hidy and Brock, 1970; Robinson and Robbins, 1970) that the anthropogenic component of the global particulate burden of the atmosphere amounts to 5-12%; not, it would seem a very alarming figure. … Ellis and Pueschel (1971), in a report based on solar radiation data at Mauna Loa for the period 1958-70, conclude that human activities have not affected the atmospheric turbidity on a global scale. They also conclude that the 1963 eruption of Mount Agung, a natural phenomena, produced stratospheric aerosols which persisted for 7 years.
Non-CO2 Climate Change Mechanisms (26)
263. Eddy, 1977
http://citeseerx.ist.psu.edu/viewdoc/download?doi=10.1.1.641.2981&rep=rep1&type=pdf
Abstract. Long-term changes in the level of solar activity are found in historical records and in fossil radiocarbon in tree-rings. Typical of these changes are the Maunder Minimum (A.D. 1645-1715), the Sporer Minimum (A.D. 1400-1510), and a Medieval Maximum (c. A.D. 1120-1280). Eighteen such features are identified in the tree-ring radiocarbon record of the past 7500 years and compared with a record of world climate. In every case when long-term solar activity falls, mid-latitude glaciers advance and climate cools; at times of high solar activity glaciers recede and climate warms. We propose that changes in the level of solar activity and in climate may have a common cause: slow changes in the solar constant, of about 1% amplitude.
The frequency and persistence of periods of prolonged solar inactivity like the Maunder Minimum now warn us to be cautious in labelling the present, modern era of solar behavior as ‘normal’. Indeed, in the longer view it now seems likely that the entire period of intensive physical study of the sun, since perhaps the middle 18th Century, has been a time of uncommonly high levels of solar activity. And it may be significant that the same period describes as well a time of unusually benign climate – the gradual recovery from the Little Ice Age.
Several lines of evidence now suggest that the varying envelope of solar activity may directly record long-term excursions in the solar radiative flux, for the coincidence of peaks and valleys in the solar activity envelope with mid-latitude temperature excursions points to a possible direct thermal connection. The persistent rise in the level of solar activity in the first half of the present century (Figure 1) matches very well the established increase in world temperature averages during the same time. And the Maunder Minimum coincides in time and extent with the coldest extreme of the Little Ice Age in Western Europe and America.
—–
264. Willett, 1980
http://www.tandfonline.com/doi/abs/10.1080/02723646.1980.10642193
A significant relationship between zonal climatic patterns and shorter term (22 years) double sunspot cycles is noted. Distinctive synoptic features of the primary meridional patterns of climate and climatic change are then described. They are of short duration and relate significantly only to double sunspot (DSS) and shorter cycles, notably at higher latitudes and during the winter season. They are apparently responsive to solar corpuscular (solar wind) impulses in contrast to the apparent response of the zonal long-term trend patterns of change to solar electromagnetic (radiational) changes. The research approach best suited to investigate the physical mechanism of solar-climatic linkage is discussed as a necessary basis for the development of effective models for the solar prediction of climatic change.
—–
265. Bray, 1971
https://www.ncbi.nlm.nih.gov/pubmed/17742573
The most conspicuous climatic aberration of the past two millennia was the temperature decline and glacial advance of the A.D. 1550 to 1900 period. This temperature decline has been correlated with an interval of lower solar activity and there is evidence from both the post-Pleistocene glacial record and from oxygen-18 analysis that such an interval has recurred at cyclic periods of around 2400 to 2600 years.
—–
266. Dzerdzeyevskiy, 1961
http://www.tandfonline.com/doi/abs/10.1080/00385417.1964.10770074
The author reviews the work done by himself and by Bezrukova-and Rubashev at the Pulkovo Observatory in relating fluctuations in the characteristics of the general circulation of the earth’s atmosphere over the Northern Hemisphere to fluctuations in solar activity, on the one hand, and to climatic fluctuations, on the other. The general circulation of the atmosphere is thus found to meet the requirements of an intermediate link in the research system: sun—climatic change. This paper was read at the New York conference on solar variations, climatic change and related geophysical problems in January 1961.
—–
267. Kennett and Huddlestun, 1972
http://www.sciencedirect.com/science/article/pii/0033589472900622
The faunal event in the Gulf of Mexico correlates with an even more spectacular event recorded in the Greenland ice sheet by a drop in 18O [temperature] values within a time interval of only about 100 yr (Dansgaard et al., 1971, 1972). A possibly correlative climatic event of similarly rapid nature has also been reported for speleothems from southern France (Duplessy et al., 1970). The paleoclimatic event is closely associated stratigraphically with a widespread volcanic ash layer, although it is possibly significant that the increased volcanism occurred 1000 yr after the paleoclimatic event. A rapid lowering of the lysocline occurs simultaneously with the paleoclimatic event although faunal diversity is low in the succeeding fauna despite decreased calcium carbonate solution. Both the association with volcanism and changes in the position of the lysocline may be significant in consideration of mechanisms of such rapid climatic changes. In turn, such rapid paleoclimatic-paleooceanographic changes as observed in tropical Gulf of Mexico cores, in the Greenland ice sheet and in caves of southern France must be considered in the evaluation of causal mechanisms of glacial and interglacial oscillations.
—–
268. Hollin, 1970
http://hydrologie.org/redbooks/a086/086040.pdf
This last major retreat of the margin was probably caused by: (1) The rise of sea-level between 18,000 and 6000 BP as the northern ice sheets disappeared; the rise probably cut back the edge of the Antarctic ice sheet for both budgetary and mechanical reasons (Hollin, 1962a). (2) An increased advection of sensible and latent heat from the north, as the ice sheets disappeared. (3) Summer [solar] radiation greater than today’s, according to Milankovitch’s calculations for 75°S (Zeuner, 1959).
Suppose the world-wide warming by about 1°C between say 1875 and 1940 A.D. (for evidence supporting this in Antarctica see Hollin, 1962a, p. 180) and the associated circulation changes caused a roughly 20 per cent increase in accumulation in these areas (for evidence for such an increase in parts of Antarctica but against it for the continent as a whole see Hollin, 1962a, p. 184, and Giovinetto and Schwerdtfeger, 1966). The accumulation in these areas is of the order of 20 g cm”2 yr”1 , so that an increase of 20 per cent sustained over the 65 yr above would have caused a build-up by 2-6 m, perhaps increased by drifting in some parts of the mountains. … In summary, the references and arguments above suggest a possible overall sea level fall of say 4 +/- 2 m (the author prefers the lower values) during the past 4000 yr, probably with minor oscillations. However, the possibility has now to be examined that such a fall might have been the result, not of a specifically Antarctic build-up, but of a world-wide glacial build-up, especially in Greenland, by a decrease of ablation following the Post-glacial “Hypsithermal” warm peak.
—–
269. Bray, 1965
http://www.readcube.com/articles/10.1038%2F205440a0
Forest Growth and Glacier Chronology in North-West North America in Relation to Solar Activity
For the period A.D. 1750-1960, a correlation of +0.47 (P < 0.05) was found between the bole growth per decade of forest-grown Engelmann spruce (Picea engelmannii Parry) in the Yoho Valley, B.C., Canada, and mean yearly sunspot number per decade. … [D]ata on bole growth from the two adjacent valleys were combined for all trees 300 or more years of age (total 49 trees). The correlation coefficient for these data between tree bole growth per sunspot cycle and mean yearly sunspot number per cycle is +0.63 (P < 0.001), demonstrating a more signifiant correlation than in the original investigation.
—–
270. Shaw, 1981
http://www.sciencedirect.com/science/article/pii/0004698181903565
The modeling has tentatively identified Arctic cloudiness amount as the controlling factor which gives rise to the tenfold seasonal changes of Arctic air pollution; it also has provided, within a factor of 2, the correct magnitude of the aerosol mass loading in the arctic regions and has allowed a rough estimate to be made of the possible impact on Arctic air quality as industrialization moves northward.
Future development of mining, petroleum extraction, smelting, refining, and manufacturing is expected to double every 15–20 years, and in another 50 years arctic haze may be serious enough to cause significant heating of the atmosphere of the northern polar regions.
—–
271. Koerper et al., 1985
http://eprints.cdlib.org/uc/item/98w335dh#page-1
Lowered mean temperatures, glacial advances, expansion of polar pack-ice, and tree-line retreats characterize a period of predominantly cool climate known as the Little Ice Age, ca. A.D. 1400-1850 (Calder 1975; Gribbin and Lamb 1978). This interval of climatic deterioration coincided with widespread disruption of human subsistence economies. Especially affected were huntergatherers inhabiting northern latitudes (e.g., Thule Eskimo), but the climatic change also impacted sedentary populations practicing relatively intensive agriculture in more temperate regions (Lamb 1977; Kington 1980; Lindgren and Neumann 1981). Decreased sunspot activity (Bray 1965, 1971; Eddy 1977; Stuvier and Quay 1980) and increased volcanism on earth (Bray 1974; Schneider and Mass 1975), both of which may reflect a reduction in the amount of solar energy reaching the planet, also occurred during the Little Ice Age. Mounting evidence supports the hypothesis that climatic fluctuations during the Holocene have been the result of varying levels of solar activity (Denton and Karlen 1973; Druffel 1982). Lamb (1977) estimated that a decrease in solar radiation of less than one percent from the preceding Little Climatic Optimum would have been sufficient to cause the worsened conditions.
—–
272. Hamilton and Seliga, 1972
http://www.nature.com/nature/journal/v235/n5337/abs/235320a0.html
Data relevant to the causation of climatic change, particularly changes in mean annual temperature at the surface over intervals of from 10 to 105 yr, have been accumulating gradually in various laboratories engaged in studying the two long ice cores from Camp Century, Greenland, and “New” Byrd Station, Antarctica. This note consolidates these and other data and interprets them in the framework of existing theory. It appears that millennial and longer variations in cloud-level temperature on the polar ice sheets have been caused by changing atmospheric turbidity over the past 105 yr.
—–
273. Riehl and Meitin, 1979
http://science.sciencemag.org/content/206/4423/1178
Eight events of climate variation with durations of the order of 100 years have been found in the history of annual Nile River discharge dating from the year 622. They cease during the “little climatic optimum” [Medieval Warm Period] in the North Atlantic and then reappear and intensify; this behavior suggests that control is from the belt of the polar westerlies.
—–
274. Shultz and Stout, 1977
http://digitalcommons.unl.edu/cgi/viewcontent.cgi?article=1435&context=tnas
Although the causes of drought remain as elusive as ever, facts are accumulating, and there seems to be increasing evidence suggesting that severe droughts are recurrent, that they are but aspects of more general climatic fluctuations, and that they, like glaciation, may be linked to the sunspot cycles. However, some lag effects are to be expected so prediction requires scientific data from both the near past and the distant past.
—–
275. Crowley, 1982
http://ntrs.nasa.gov/archive/nasa/casi.ntrs.nasa.gov/19820026070.pdf
The climate of the past 1000 years (Fig. 47) has been marked by a Medieval warming, followed by a cool interval (the Little Ice Age) from about 1430-1850 (Gribbin and Lamb, 1978; Bernabo, 1981). The subsequent warming that peaked in the 1940’s (Mitchell, 1961) completes the picture. Evidence from North American tree rings indicates that a circulation type characterized by warmth and aridity in the west, and cold in the east, was much more common during the Little Ice Age than during the 20th century (Fritts et al, 1979). In fact, the [Little Ice Age-like] circulation pattern appears to have been similar to the pattern for the severe winter of 1976-77 in the eastern U.S. (Namias, 1978).
Causes of the centennial-and millennial-scale climatic fluctuations of the Holocene are not well understood. Explanations have run the gamut from stochastic and volcanic effects to variations in solar activity (e.g., Lamb, 1970; Damon et al, 1978; Robock, 1978). The parallel between climate and 14C production (Fig. 47) is particularly intriguing, because 14C apparently reflects changes in solar activity (Stuiver and Quay, 1980). An active sun is associated with an increased deflection of galactic cosmic rays, with resultant decreased production of atmospheric 14C. Denton and Karlen (1973) claim to have found similar correlations between 14C and ice extent in records extending back to about 5,000 YBP. The coincidence of an apparent 2500-yr. cycle in 14C production rates (Suess, 1980) and in paleoclimatic records is a further indication of a possible solar influence on climate. … Some of the best evidence for a climatic response to solar variability is derived from tree ring records (see, e.g., Fritts, 1979). Mitchell et al (1979) have succeeded in documenting a 22-yr. drought rhythm in the tree-ring record of the western U.S. (Fig. 49). Epstein and Yapp (1976) have also identified the same cycle (i.e., the double sunspot cycle) in temperature-dependent deuterium-hydrogen ratios in wood cellulose. Hameel and Wyant (1982) have shown that the 22-yr. cycle can even be detected in records from the Maunder Sunspot Minimum (1660-1710); in fact, the cycle seems slightly stronger at that time than during later periods of increased solar activity.
—–
276. Reck, 1976
http://science.sciencemag.org/content/188/4189/728
Aerosols and Polar Temperature Changes
Calculations indicate that aerosols are not directly responsible for the present increase in ice abundance in the Northern Hemisphere. Indeed it appears that aerosols cause heating of the atmosphere near the poles. The present background aerosol density at 85°S latitude causes a temperature increase of ∼ 0.2°K, while that at 85°N causes an increase of ∼ 0.05°K.
—–
277. Willett, 1974
http://journals.ametsoc.org/doi/abs/10.1175/1520-0493(1974)102%3C0679:RSEISO%3E2.0.CO%3B2
Following a brief discussion of the pertinent sunspot cycles, four extended samples of climatic data are presented in support of the contention that solar-climatic cyclical relationships are of sufficient significance and amplitude to be of practical value in climatic trend forecasting. In this connection it is noted that recent climatic changes have followed earlier expectations based on this assumption. In conclusion, some recommendations are offered for further development of this predictive potential.
—–
278. Berger, 1979
http://link.springer.com/article/10.1007/BF02507714
From these data, some specific features, called insolation [surface solar radiation] signatures, of the insolation pattern are found to be significantly related to well-established climatic changes, like the 125 000 YBP integlacial, the 70000 YBP persistent-cooling trend and the 20000 YBP glacial maximum.
—–
279. Schneider, 1972
http://journals.ametsoc.org/doi/pdf/10.1175/1520-0469%281972%29029%3C1413%3ACAAGCF%3E2.0.CO%3B2
Global-average radiation balance calculations show that an increase in the amount of low and middle level cloud cover (with cloud top height and cloud albedo fixed) decreases the surface temperature. But, this result for the global-average case does not hold near polar regions, where the albedo of the cloudy areas can he comparable to (or even smaller than) the albedo of the snow-covered cloudless areas, and where, especially in the winter season, the amount of incoming solar radiation at high latitudes is much less than the global-average value of insolation. The exact latitude at which surface cooling changes to surface warming from a given increase in cloud cover amount depends critically upon the local values of the cloud albedo and the albedo of the cloudless areas that are used in the calculation. However, an increase in effective cloud top height (with cloud cover and cloud albedo fixed) increases the surface temperature at all latitudes. … [T]here are two competing opposite effects on the global radiation balance from an increase in the amount of global cloud cover: 1) an increase in the the planetary albedo causing a decrease in available solar energy, and 2) a decrease in the IR radiative loss to space. … The numerous , nonlinear and coupled interrelationships between the factors that in order to understand the possible role of cloudiness as a global climate feedback mechanism, it is necessary to have a realistic, large-scale, radiative and dynamical model of the land-ocean-atmosphere system, that includes some microphysical aspects of cloud formation. Such a detailed model is clearly not presently at hand
—–
280. Davitaya, 1968
http://www.tandfonline.com/doi/abs/10.1111/j.1467-8306.1969.tb00690.x
Solar radiation records and firn layers in glaciers indicate increasing atmospheric dust content which might significantly alter climate. In some mountain ranges, glaciers have degraded even during periods of temperature decreases. This indicates decreasing albedos with increasing dustiness of glacial surfaces.
—–
281. Wilson, 1969
http://www.nrcresearchpress.com/doi/abs/10.1139/e69-095#.Vxj18pVhnIU
The effect of a surge of the Antarctic Ice Sheet on world climate is considered, with particular reference to the origin of ice ages. The requirements of an ice-age mechanism are discussed and it is concluded that a periodic surge of the Antarctic Ice Sheet, perhaps induced by a decrease in insolation to the south polar region, has all the requirements of an ice-age inducing mechanism. In particular, any oscillating system must have capacitance (storage) and impedance (resistance). It is not easy to find a system in nature with a sufficiently long period of oscillation. However, the build up of ice on Antarctica would provide a sufficiently slow charging of storage, and the ice sheet itself would provide the storage to yield a system of long enough period. It is proposed that when the Antarctic Ice Sheet surges, a large ice shelf is produced which increases the albedo of the Earth. The resulting cooling leads to the formation of secondary ice sheets in the Northern Hemisphere, which in turn leads to a further increase in albedo and further cooling.
—–
282. Gow and Williamson, 1971
http://www.sciencedirect.com/science/article/pii/0012821X71901269
Approximately 2000 individual ash falls are preserved in deep cores from Antarctica. The bulk of the debris is composed of dust-sized particles of glass that can probably be attributed to volcanic sources in Antarctica, though sources outside Antarctica cannot be entirely discounted. A period of sustained infall of ash occurred during the interval 30 000 to 16 000 years ago, and isotopic (paleotemperature) data from the same cores indicate that a significant cooling of the atmosphere over Antarctica occurred at the same time. This cooling trend did not terminate until deposition of ash had virtually ceased, suggesting possibly a cause and effect relationship involving the solar-depleting effect of volcanic dust in the Antarctic stratosphere. It is conceivable that widespread eruption of volcanic ash in Antarctica during the latter part of the Wisconsin may also have triggered world-wide cooling during this period — effectively intensifying the existing glacial regime.
—–
283. Hughs, 1975
http://onlinelibrary.wiley.com/doi/10.1029/RG013i004p00502/full
The dynamics of the Ross Sea ice drainage system of Antarctica is examined to determine what controls disintegration and recovery of the West Antarctic ice sheet. It is concluded that disintegration is controlled by ice streams which drain the inherently unstable West Antarctic ice sheet and recovery is controlled by outlet glaciers which drain the inherently stable East Antarctic ice sheet. Glacial stability in both cases is determined by the degree of coupling between the ice sheet and its bed. … Rapid glacial recovery following a surge can truncate the advancing ice sheet-ice shelf boundary. Today at least one West Antarctic ice stream is terraced and at least one East Antarctic outlet glacier is truncated in the Ross Sea ice drainage system. If this condition is general, the West Antarctic ice sheet is disintegrating along the Siple Coast as a result of surging ice streams and is recovering along the Transantarctic Mountains as a result of thickening outlet glaciers. The competition between these processes will provide a critical test of the ice age model, which predicts that progressive disintegration of the West Antarctic ice sheet results in progressive growth of adjacent parts of the East Antarctic ice sheet.
—–
284. Brazel and Idso, 1979
http://www.tandfonline.com/doi/abs/10.1111/j.1467-8306.1979.tb01266.x
Atmospheric aerosol pollution has a significant effect on global climate. Research on dust particle interactions with solar and thermal radiation reveals the net climatological consequences of altering the dust concentration of the atmosphere. The vertical distribution of aerosols is just as important as their concentration in determining the magnitude and direction of their effects on surface temperature changes. The injection of dust high into the stratosphere by volcanic explosions favors the reduction of surface temperatures. The increase in lower tropospheric aerosol concentrations by either natural or human agents usually initiates a surface warming.
—–
285. Semptner, 1975
http://journals.ametsoc.org/doi/pdf/10.1175/1520-0485%281976%29006%3C0379%3AAMFTTG%3E2.0.CO%3B2
Abstract: A model is presented whereby the thickness and extent of sea ice may be predicted in climate simulations. A basic one-dimensional diffusion process is taken to act in the ice, with modifications [of sea ice] due to penetration of solar radiation, melting of internal brine pockets, and accumulation of an insulating snow cover.
Increasing attention is being paid to the problem of predicting variations in climate due to natural or man-made causes. Of the many components of the climatic system, sea ice is probably a very important one. It has the potential of amplifying climatic variations on account of tow positive feedback mechanisms. First, the formation of ice reduces heat transfer between the ocean and atmosphere, inhibiting the ocean’s normal ability to moderate climate through local seasonal heat storage and lateral heat transport. Second, the formation of ice causes a much larger portion of the incoming solar energy to be reflected back to space. In both cases, a colder atmosphere and further ice growth may result. In view of these effects, the proper prediction of the sea ice would seem to be an important requirement in modeling climate.
[Carbon dioxide is not mentioned as a factor affecting sea ice changes anywhere in the paper.]
—–
286. Crane, 1978
http://pubs.aina.ucalgary.ca/arctic/Arctic31-4-434.pdf
Using published data sources for south-eastern Baffin Island, Ungava Bay and the northern Labrador Sea area, a study of the general patterns of sea ice growth and decay has been made for the years 1964 to 1974. From a comparison of individual years an “early” and a “late” pattern of both ice advance and ice retreat are recognised. Mean daily sea-level pressure patterns for June-July and for October-mid-November are examined and a relationship is established between the type of ice advance or retreat pattern and the synoptic circulation over the area. In the years of early ice retreat there is an increased frequency of southerly airflow over the region. Strong winds and the advection of warm air leads to the more rapid removal of the ice compared to years of late ice retreat. Similarly for the years of early ice advance there is an increased frequency of northerly and westerly flow, bringing lower temperatures and an influx of second-year and multi-year ice into the area.
[Relative mean sea ice retreat and advance are described as having natural causes; CO2 is not mentioned as a factor affecting sea ice retreat, or anywhere in the paper.]
—–
287. Manabe et al., 1974
https://www.researchgate.net/profile/Syukuro_Manabe/publication/240687365_A_Global_Ocean-Atmosphere_Climate_Model._Part_II._The_Oceanic_Circulation/links/53fdfabd0cf2dca800043b10.pdf
A Global Ocean-Atmosphere Climate Model
Radiative transfer (pg. 8): The mixing ratio of carbon dioxide is assumed to have a constant value of 0.0456% by weight everywhere.
HEAT EXCHANGE (pg. 12) The heat balance components that affect the heat balance of the ocean surface are solar radiation, terrestrial radiation, and fluxes of sensible and latent heat due to turbulence, which are computed in the atmospheric part of the joint model using the sea surface temperatures obtained from the oceanic part of the model. The rate of energy received by the ocean surface is the net contribution of the fluxes mentioned above.
[CO2 is not used as a variable, remaining constant, in radiative transfer modeling, nor is it mentioned as a component affecting the heat balance of the ocean surface.]
—–
288. Donn and Shaw, 1965
http://www.sciencedirect.com/science/article/pii/0079661165900443
A comparison of the heat budget of the present ice-covered portion of the Arctic Ocean (1017 cm2) with that of a hypothetical ice-free ocean is made on the basis of relatively new data from the Arctic region. The chief effect of ice removal would be a consequence of the decrease in albedo from 61 to 10%. Another important factor would be the increased “greenhouse” effect resulting from an increased atmospheric moisture content and greater cloud cover. Evaluation of the factors involved indicates that the present surface is in essential radiation balance, with a small positive gain of 0.01 × 10²¹ cal/year 1017 cm2
[The abstract from this paper only mentions water vapor and cloud as factors contributing to the greenhouse effect.]
Warmer past despite lower CO2 (10)
289. Frye and Willman, 1971
http://memoirs.gsapubs.org/content/136/135.short
The climatic history of the Illinois region during Wisconsinan time [85,000 to 11,000 years ago] is interpreted from the character and extent of the glacial deposits and buried soils of the Lake Michigan Lobe. The Illinoian-Sangamonian history of the lobe is briefly discussed. The history is complex; it includes three major glacial episodes during the Illinoian, and a succession of glacial advances and retreats during the Wisconsinan. The major interglacial stages were times of near climatic equilibrium, and the soil profiles indicate temperatures were higher than those of the present. The glacial stages, on the other hand, were characterized by sharply fluctuating climates, with episodes of glaciation alternating with minor intervals of stability, soil formation, and temperatures approaching those of the major interglacial stages.
—–
299. Schell, 1961
https://www.jstor.org/stable/520132?seq=1#page_scan_tab_contents
The results in Table 1 indicate a general correspondence between the long-term ice severity off Iceland and other climatic features in that area and in southern Greenland during the more than 1,000 years which this record covers, indicating the record to be representative of the broad features of the climate in that general area, and suggesting that Iceland and western and southern Greenland experienced a relatively mild climate during the first three centuries of the record (900 to 1,200 A.D. [Medieval Warm Period]). This was followed by a deterioration around the beginning of the 13th century and by a further deterioration around the beginning of the 17th century [Little Ice Age] which persisted through most of the 19th. A marked amelioration, approaching the mildness of some of the earlier periods [Medieval Warm Period] set in before the end of this century.
—–
300. McGlone and Bathgate, 1983
http://www.tandfonline.com/doi/pdf/10.1080/0028825X.1983.10428560
At about 9400 yr B.P. Podocarpus spicatus-Dacrycarpus dacrydioides forest replaced the shrubland, and remained dominant until 7000 yr B.P. Climate during this interval was warmer than at present, but also slightly drier. Dacrydium cupressinum and Nothofagus menziesii began to spread from about 7000 yr B.P., a process that accelerated after 4000 yr B.P. and slowed or stopped by 2500 yr B.P. Changes since 7000 yr B.P. are largely attributed to a shift towards a wetter, cooler, and perhaps more stormy climate which was the consequence of an increased south-westerly airflow.
—–
301. McKenzie and Goldthwait, 1971
http://gsabulletin.gsapubs.org/content/82/7/1767.short
Glacier ice of Neoglacial time then advanced into the lake. Retreat of this ice from the tributary valleys to the central part of the inlet was followed by deposition of a local sandy outwash into the valleys. The time of this retreat and the stabilization of Adams Inlet Glacier possibly coincides with the Little Optimum [Medieval Warm Period] (A.D. 1150 – 1300). Adams Inlet Glacier then expanded to its maximum Neoglacial extent about A.D. 1700 [Little Ice Age], and it may have remained there as late as 1835.
—–
302. Lamb, 1964
http://onlinelibrary.wiley.com/doi/10.1002/qj.49709038603/abstract
Scotland constitutes a gap in our information about the Early Middle Ages warm epoch (circa 1000–1300 A.D.). Evidence has been sought from vegetational history as well as documentary records. … A sample tree found lying in a peat bog at an exposed part of the north-west coast where trees no longer grow was discussed in the Quarterly Journal, 1945, when it was thought to have grown there in the Middle Ages or later. The result of a radiocarbon dating test on this tree contradicts all the opinions then expressed about its age. The tree and other remains from the same bog are now shown to have belonged to the latter part of the post-glacial climatic optimum before 2000 B.C., and there is no tangible evidence that trees have grown at the point in question at any time since 1000 B.C. … …in the period of warm climate around 1000-1300 AD (Professor RA Bryson (Aspen Conference 1962) has called it the ‘ Little optimum ‘) with average summer temperatures in Europe 1°C or so higher than today’s.
—–
303. Mercer, 1968
http://gsabulletin.gsapubs.org/content/79/4/471.short
The temperate ice cap must have antedated the Antarctic Ice Sheet and probably existed during the Pliocene. The variations in thickness of the Reedy Glacier after it had become an outlet of the East Antarctic Ice Sheet are thought to have been determined mainly by the position of the grounding line of the Ross Ice Shelf, which was controlled by eustatic changes in sea level, so that the glacier thickened during northern hemisphere glaciations. The lake sediments and solifluction flows indicate “interglacial” conditions 6° to 10° C warmer than at present.
—–
304. Flohn, 1983
http://link.springer.com/chapter/10.1007/978-94-009-7236-0_5#page-2
Little Ice Age (1570-1860)
During this period (Lamb 1977, 1982, Pfister 1983) several old episodes lasting not more than a few decades led to a hemispheric advance of mountain glaciers to a level identical with the highest ever reached during the last 9000 yers, i.e. during the Holocene (Gampber et al. (1982)). During its coldest episodes (e.g. 1683-1700, 1812-1850) individual seasons, years or clusters of years occurred which would now provoke journalists to announce the immediate onset of an ice-age. However, other seasons and years were warmer than the hottest years of the last decades [1960s -1970s] – all kinds of weather extremes were more intense and more frequent than now. Longer warm periods (e.g. 1902-30) interrupted this cold period, which also had its forerunners – notably between 1310 and 1340, as well as 1428-65. The extension of Arctic drift-ice [sea ice probably has varied about 2 x 10⁶ km2 between a minimum during the Viking colonisation of Greenland, when the East Greenland Current was ice-free (10th-13th century), and its maximum around 1695. … The most striking event of the 1690’s was the advance of the polar water masses with seasonal ice blocking Iceland and reaching the Faeroes and perhaps even western Norway, with sea surface temperatures (SST) 3-5°C lower than now at the entrance of the North Sea (Lamb 1979). This caused prolonged winters and a strong cooling of spring and early summer in northern and central Europe (Fig. 1).
—–
305. Stewart and England, 1983
https://www.jstor.org/stable/1550979
More than 70 samples of Holocene driftwood between present sea level and the marine limit are plotted on an emergence curve from Clements Markham Inlet (82°40′N). Three periods of driftwood abundance and sparsity are recognized. These are interpreted as indications of climatically induced changes in summer sea ice conditions. Period 1 extends from initial driftwood entry ca. 8900 BP until ca. 4200 BP. During this period driftwood penetration increases with greatest abundance (= reduced summer sea ice) ca. 6000 to 4200 BP. During Period 2 (ca. 4200 to 500 BP) driftwood penetration is sparse whereas in Period 3 (<500 BP) driftwood bordering the present shoreline exceeds all the samples in the previous periods. Driftwood dates from elsewhere in the Canadian and Greenland High Arctic show similar periods. In Clements Markham Inlet the initiation of abundant driftwood penetration corresponds with the deposition in marine sediments of fossil bryophytes (25 species) dated 6400 BP. This increased plant productivity is also interpreted as indicating summer warmth/higher precipitation associated with the greater open water. Accompanying these bryophytes is the disjunct marine pelecypod Limatula (Lima) subauriculata which presently has a subarctic-boreal distribution. This paleoenvironmental information is discussed in relation to Holocene ice core records and the history of Arctic Ocean sea ice stability. … Dunbar (1972) has shown an increase in the persistence of late summer sea ice in Baffin Bay between 1963 and 1971 that coincides with an overall deterioration of the summer climate in the arctic islands (Bradley and England, 1978). The lengthy settlement of Iceland has provided a general index of sea-ice conditions extending back through the severity of the Little Ice Age (ca. A.D. 1450 to 1880) to a more equable period when both the Thule and Norse peoples were able to expand into the Canadian and Greenland arctic (ca. A.D. 1000 to 1200; Barry et al., 1977) [Medieval Warm Period]
.—–
306. Lamb, 1967
https://www.jstor.org/stable/1794473
There is no reasonable doubt that the Arctic was a bit warmer, and that there was less ice on the northern seas, when the Old Norse voyages to Iceland and Greenland were made, especially between 1000 and 1200, than has been the case since. Ice was increasingly encountered on the old sailing route, which crossed to east Greenland near the Arctic Circle, from 1203 onwards; and by 1350-1400 this route had to be abandoned for one farther south … The tale of climatic deterioration — that is to say, cooling — from the Middle Ages to some time about 1700 is equally clear from Iceland, where grain cultivation had to be given up; from Norway, where farms in many upland districts stood empty for some hundreds of years; to some extent from Denmark, where English visitors to a Royal wedding in 1406 reported much uncultivated, sodden land and that wheat was grown nowhere, although it had been grown as far north as central Norway (Trondelag) around 1280; and from the plains of eastern Europe, where increasing frequency of floods and famines and harshness of the winters led to many more deaths and incidents of cannibalism than in the west. All the evidence points to a considerable recovery of the climate — i.e., net warming — between 1700 and 1950. … [D]uring the last 150 years of warming up, from 1800 to 1950, the prevailing temperatures of the surface waters of the Atlantic in in these latitudes rose by about 2°C.
—–
307. Dorf, 1959
https://deepblue.lib.umich.edu/bitstream/handle/2027.42/48308/ID148.pdf?sequence=2
It has been observed, however, that the greatest temperature increases during the last hundred years have been in the Arctic regions. In Spitsbergen, only about 10 to 12 degrees from the North Pole, the mean winter temperatures have risen about 14° F. since 1910 (Willett, 1950). Ice-free ports there are now open to navigation about 7 months of the year as compared with only 3 months fifty years ago (Ahlmann, 1953, p. 32). If the warming trend of the north polar region should continue at its present rate, it has been estimated that the entire Arctic Ocean would be navigable all year long within about a hundred years. At the opposite end of the world, according to recent reports from the Weather Bureau (Wexler, 1958), the Antarctic region has undergone a rise of about 5°F. in average temperature in the last fifty years. There has been no appreciable rise, however, in the mean annual temperatures in the tropical regions of the world.
What have been some of the notable results of this warming trend during the last hundred years? Glaciers throughout the world have been melting away at a rapidly increasing rate. Brooks (1949, p. 24). the eminent British paleoclimatologist, stated that “Since the beginning of the 20th Century glaciers have been wasting away rapidly, or even catastrophically.” In the Juneau region of Alaska, all but one of the numerous glaciers began melting away as far back as 1765. Muir Glacier, for example, has retreated as much as two miles in 10 years. Baird and Sharp (1954, p. 143) have referred to the “alarming retreat of glaciers” in the Alaskan region; along the Pacific Coast of North America and in Europe they believe the glacial melting “appears to be progressing violently.” In the north polar region, measurements of melting of the ice islands in the Arctic Sea indicate an approach toward an open polar sea (Crary, Kulp, and Blarshall, 1955). In only a few regions of the world, such as the Pacific Northwest, are there any records of glaciers advancing during the past century, and these have been mostly since 1950 (Hubley, 1956). The warmer temperatures have also caused a general rise of the snow line throughout the mountainous regions of the world, even in the tropics: in northern Peru it has risen about 2700 feet during the 60 years.
Believed in large part to be the result of the melting of the world’s glaciers, sea level has been rising at a rapidly increasing rate, amounting to as much as a 6-inch rise from 1930 to 1948 (Marmar, 1948). This is about four times the average rate of sea level rise during the past 9000 years, as recorded by Shepard and Suess (1956). It should be noted that more than a six-fold increase in the rate of sea level rise occurred in the mid-1920’s at the same time there was a striking change in the rate of glacial melting in the north (Ahlmann, 1953, Fig. 11).
Changes in vegetation brought about by the warmer temperatures include the encroachment of trees into the subpolar tundra as recorded in Alaska, Quebec, Laborador, and Siberia. In the Canadian prairies the agricultural crop line has shifted from 50 to 100 miles northward as a result of the lengthening of the growing season by as much as ten days. In parts of northern New England and eastern Canada the birch trees have been dying off over large areas, and the spruces and balsams have begun to suffer as a result of the rise in summer temperatures. In Sweden the timberline has moved up the mountain slopes as much as 65 feet since 1930 (Ahlmann, 1953, p. 35).
In the animal world many southern types of both birds and mammals have been extending their habitat ranges northward as a result of the warming trend. The cardinal, the turkey vulture, the tufted titmouse, and the blue-winged warbler, as well as the warmth-loving opossum, have slowly moved their ranges into the northern United States. A good many central European species of animals have been shifting their ranges northward into Scandinavia, Greenland, Iceland, and the Faero Islands. Twenty-five species of birds alone are reported to have invaded Greenland from the south since 1918 (Jensen and Fristrup, 1950). Codfish from the Atlantic have replaced the seals in the waters along the coast of Greenland. It is reported that compared to a shipment of 5 tons of codfish from Greenland in 1913, the 1946 shipment had risen to over 13,000 tons; the Greenland Eskimos have become cod fishermen instead of seal fishermen (Kimble, 1950). Farther south tunafish have moved northward into the waters off New England, and tropical flying fishes have become increasingly common off the coast of New Jersey.
GO BACK TO:
PART 1 HERE
PART 2 HERE


Recent Comments