
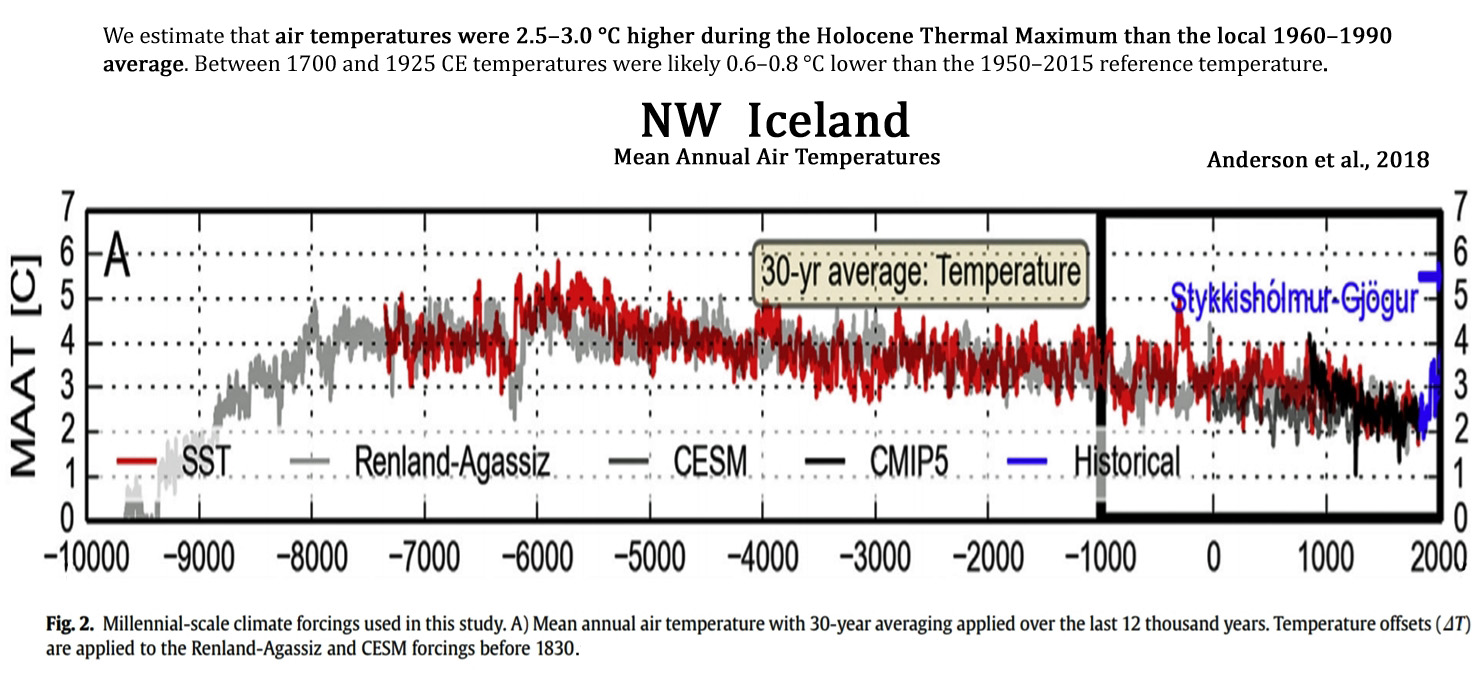
Anderson et al., 2018
“We estimate that air temperatures were 2.5–3.0 °C higher during the Holocene Thermal Maximum than the local 1960–1990 average. … Between 1700 and 1925 CE temperatures were likely 0.6–0.8 °C lower than the 1950–2015 reference temperature.“
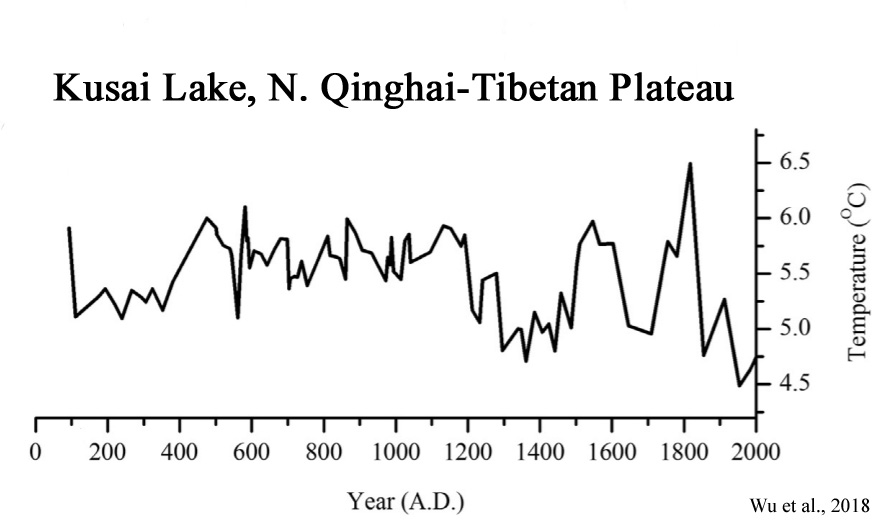
Wu et al., 2018
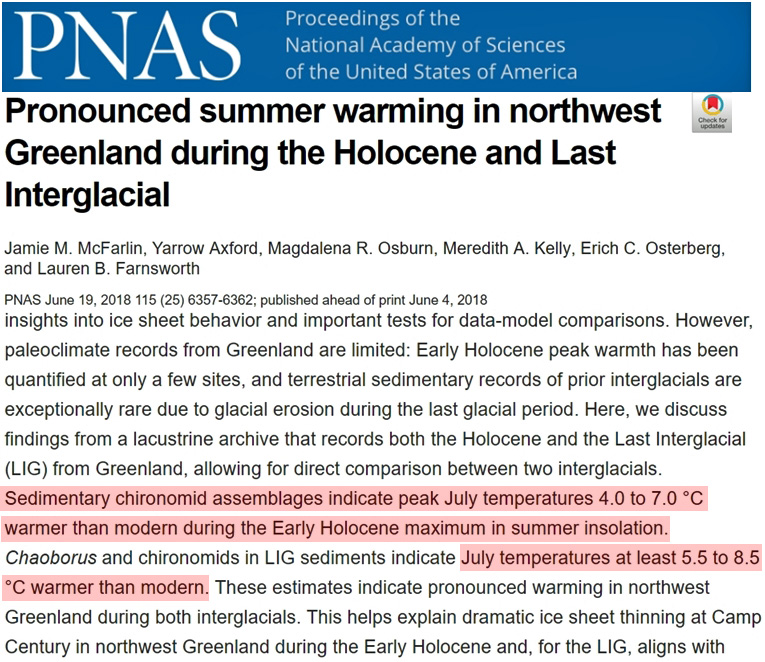
McFarlin et al., 2018 (Greenland/Baffin Bay)
“(Greenland) Early Holocene peak warmth has been quantified at only a few sites, and terrestrial sedimentary records of prior interglacials are exceptionally rare due to glacial erosion during the last glacial period. Here, we discuss findings from a lacustrine archive that records both the Holocene and the Last Interglacial (LIG) from Greenland, allowing for direct comparison between two interglacials. Sedimentary chironomid assemblages indicate peak July temperatures [Greenland] 4.0 to 7.0 °C warmer than modern during the Early Holocene maximum [10,000 to 8,000 years ago] in summer insolation. Chaoborus and chironomids in LIG sediments indicate July temperatures at least 5.5 to 8.5 °C warmer than modern.”
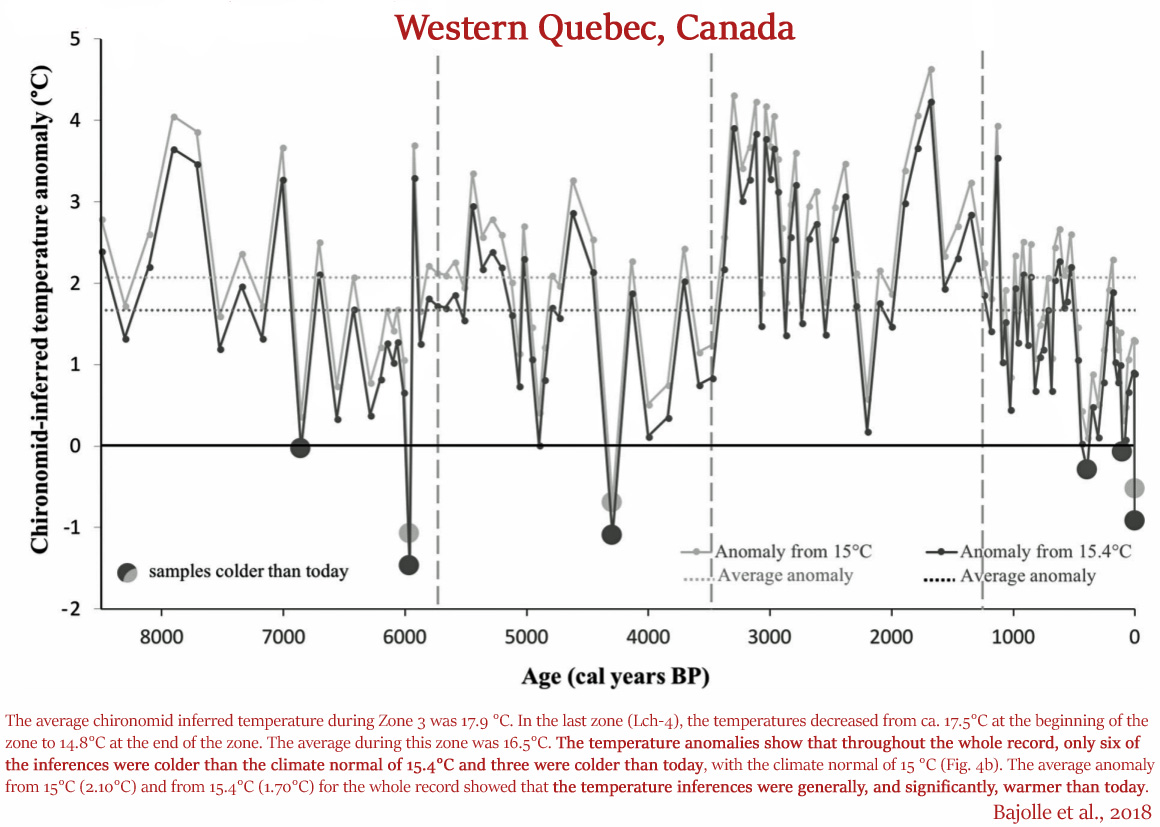
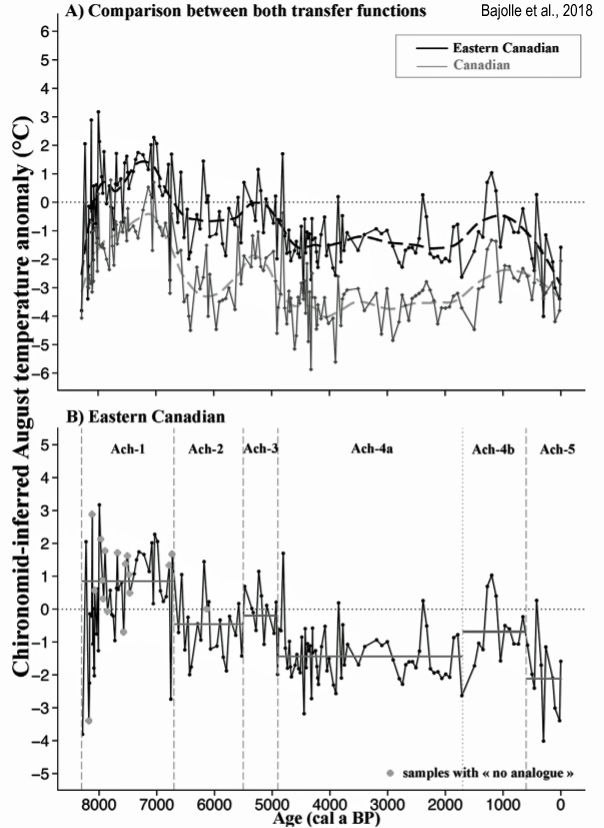
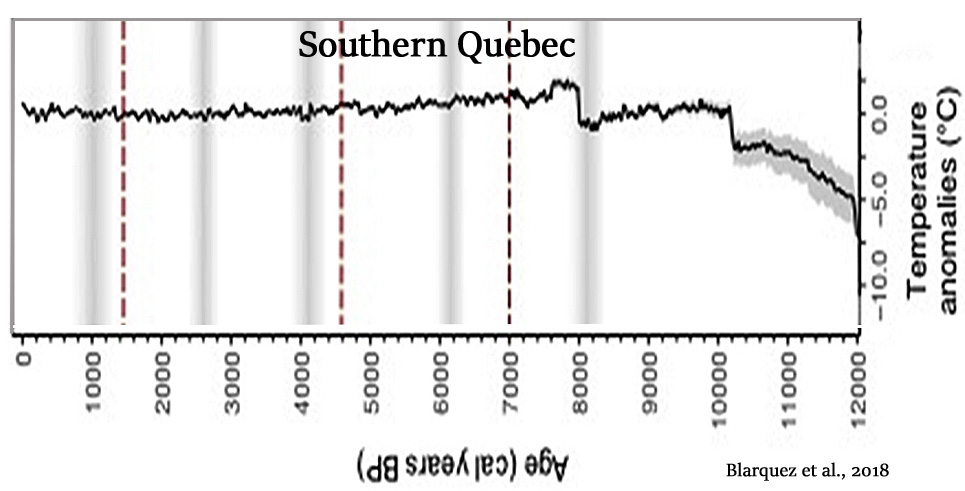
Bajolle et al., 2018
“The mean annual temperature recorded at the closest meteorological station [La Sarre: 1961–1990] is 0.8 °C, with August temperature averages of 15.0 °C (1961–1990) and 15.4 °C (1981–2010). … During zone Lch1 (8500–5800 cal year BP), the average reconstructed temperature was 16.9 °C, with a decrease from 19 °C (maximum) to 17 °C at the end of the zone. In zone Lch-2 (ca. 5700–3500 cal year BP), temperatures had an average of 16.8 °C, with a decrease from 17.8 °C around 5200 cal year BP to 16.2 °C at 3400 cal year BP. Zone Lch-3 (ca. 3500–1200 cal year BP) started with inferences for high temperatures (19.3–18.5 °C), followed by a decrease to 16.8 °C between ca. 3000 and 2500 cal year BP. An increase (18.3 and 19.6 °C) was inferred for the period between 1800 and 1500 cal year BP. The average chironomid inferred temperature during Zone 3 was 17.9 °C. In the last zone (Lch-4), the temperatures decreased from ca. 17.5 °C at the beginning of the zone to 14.8 °C at the end of the zone. The average during this zone was 16.5 °C. The temperature anomalies show that throughout the whole record, only six of the inferences were colder than the climate normal of 15.4 °C and three were colder than today, with the climate normal of 15 °C (Fig. 4b). The average anomaly from 15 °C (2.10 °C) and from 15.4 °C (1.70 °C) for the whole record showed that the temperature inferences were generally, and significantly, warmer than today.”
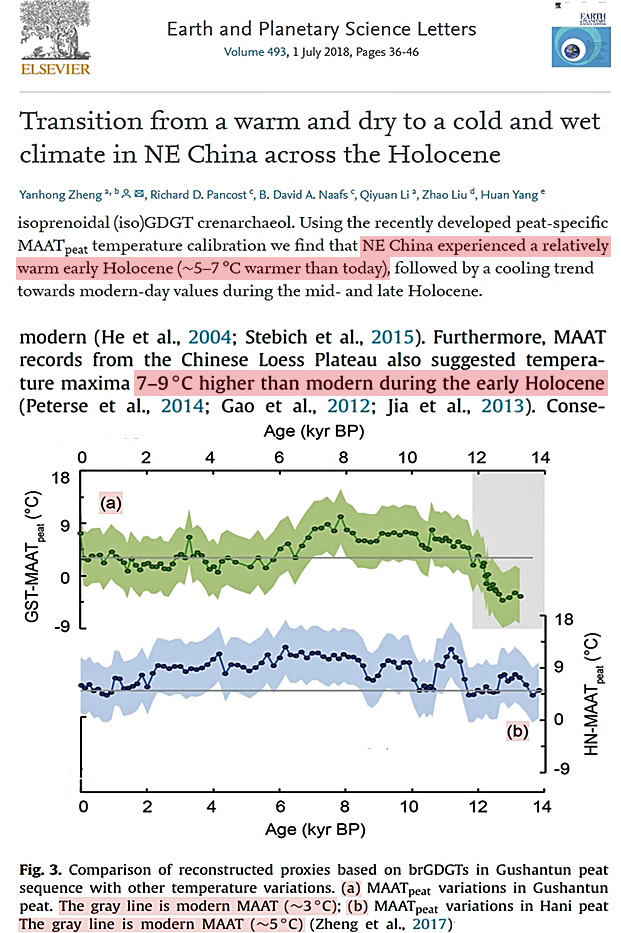
Zheng et al., 2018
“In this study we present a detailed GDGT data set covering the last 13,000 years from a peat sequence in the Changbai Mountain in NE China. The brGDGT-based temperature reconstruction from Gushantun peat indicates that mean annual air temperatures in NE China during the early Holocene were 5–7°C higher than today. Furthermore, MAAT records from the Chinese Loess Plateau also suggested temperature maxima 7–9°C higher than modern during the early Holocene (Peterse et al., 2014; Gao et al., 2012; Jia et al., 2013). Consequently, we consider the temperatures obtained using the global peat calibration to be representative of climate in (NE) China. … The highest temperatures occurred between ca. 8 and 6.8 kyr BP, with occasional annual mean temperatures >8.0 ± 4.7°C, compared to the modern-day MAAT of ∼3°C.”
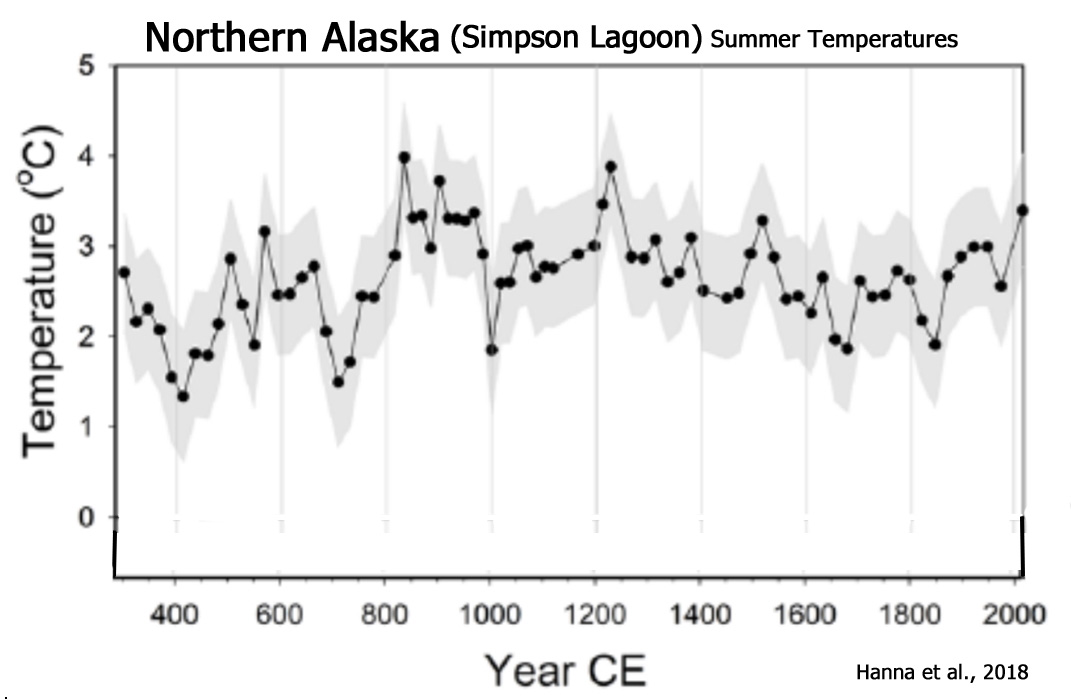
Hanna et al., 2018
“Reconstructed temperatures are generally coolest between 300 and 800 CE (Tavg = 2.24 ± 0.98°C), displaying three temperature minima centered at 410 CE (1.34 ± 0.72°C), 545 CE (1.91 ± 0.69°C), and 705 CE (1.49 ± 0.69°C). Temperatures then rapidly increased, reaching the warmest interval (800–1000 CE) in the approximately 1700-year record. During this interval, average temperatures were 3.31 ± 0.65°C, with a maximum temperature of 3.98°C.”
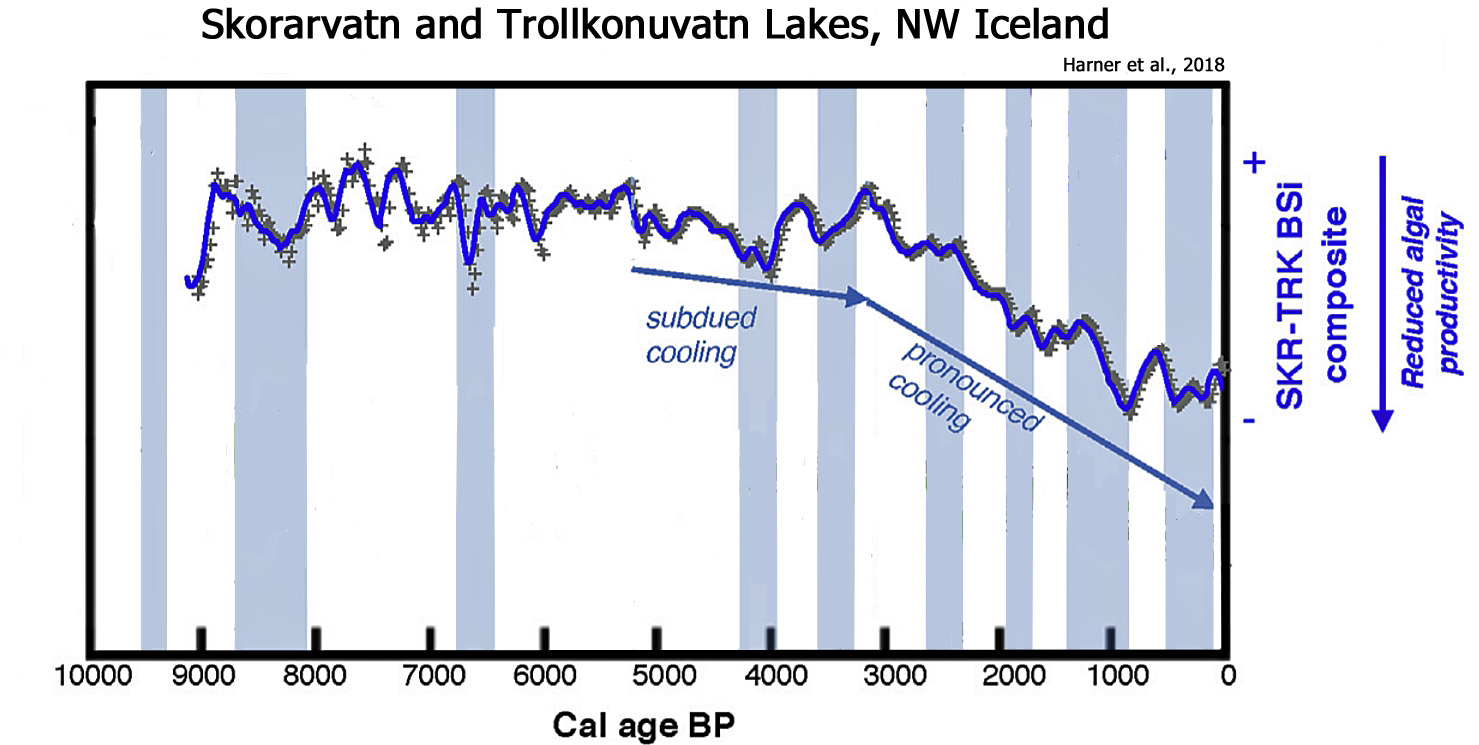
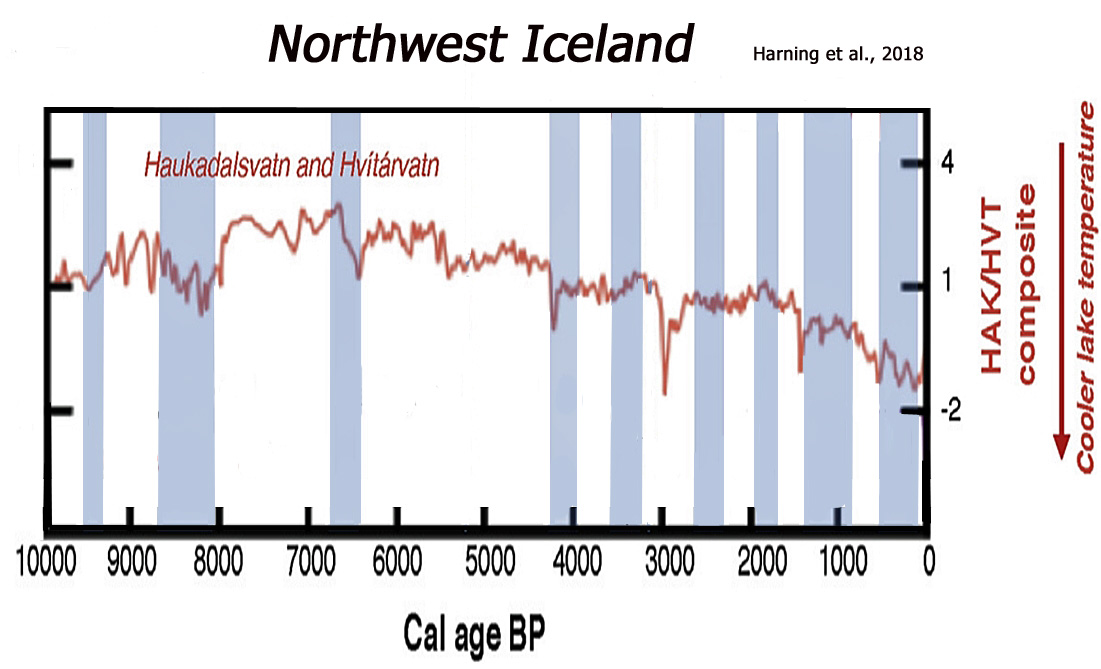
Harning et al., 2018
“Iceland’s terrestrial HTM [Holocene Thermal Maximum] has previously been constrained to ~7.9 to 5.5 ka based on qualitative lake sediment proxies (Larsen et al., 2012; Geirsdottir et al., 2013), likely in association with progressive strengthening and warming of the Irminger Current (Castaneda et al., 2004; Smith et al., 2005; Olafsdottir et al., 2010). Numerical modeling experiments for Drangajokull suggest that peak air temperatures were 2.5 – 3°C warmer at this time relative to the 1961-1990 CE average (Anderson et al., 2018). … During the Little Ice Age (LIA, 1250-1850 CE), the Vestfirðir region entered the lowest multi centennial spring/summer temperature anomalies of the last 9 ka. Based on recent numerical modeling simulations, this anomaly is estimated to be 0.6-0.8°C below the 1950-2015 average on Vestfirðir (Anderson et al., 2018).”
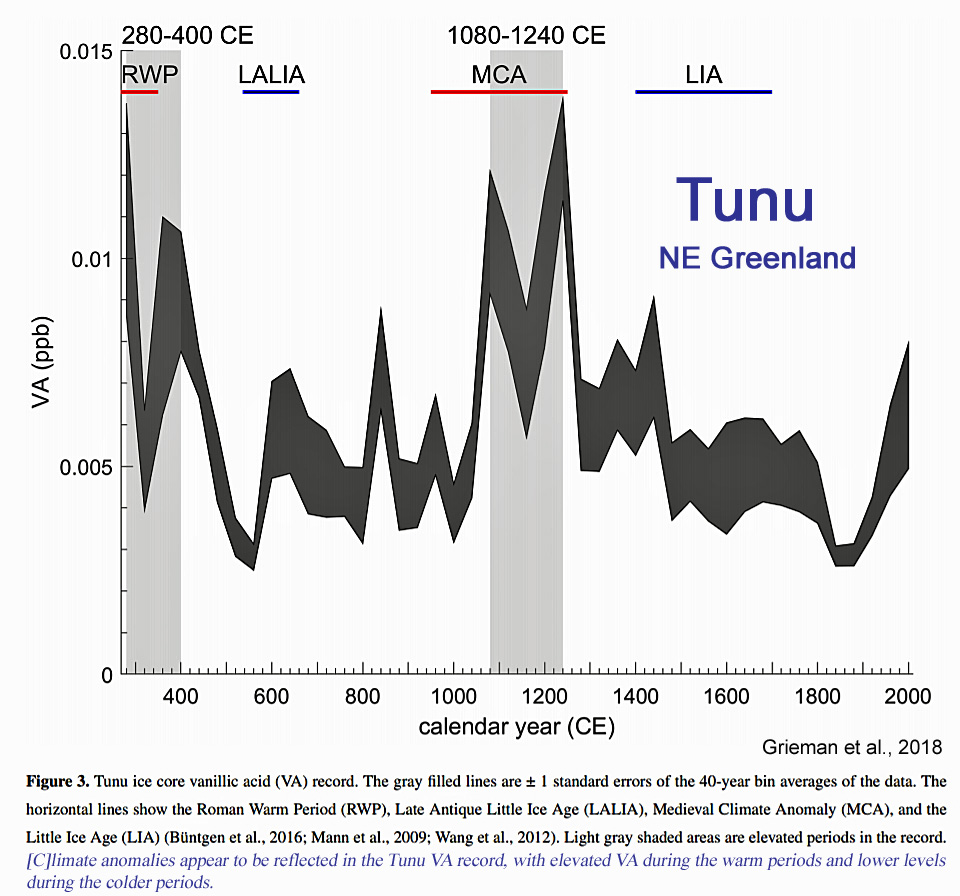
Grieman et al., 2018
“[C]limate anomalies appear to be reflected in the Tunu VA [vanillic acid] record, with elevated VA [vanillic acid] during the warm periods and lower levels during the colder periods. The data suggest a positive correlation between North American fire and hemispheric mean temperature. This relationship could be due to climate-driven changes in temperature or precipitation on burning extent, frequency, or location, as well as to changes in atmospheric transport patterns. … … [E]levated VA [vanillic acid] early in the record [Roman Warm Period] and around the MCA [Medieval Climate Anomaly]. It also emphasizes the decreasing trend from 1200-1900 CE [Little Ice Age] and the increase during the 20th century [Current Warm Period].”
Maley et al., 2018
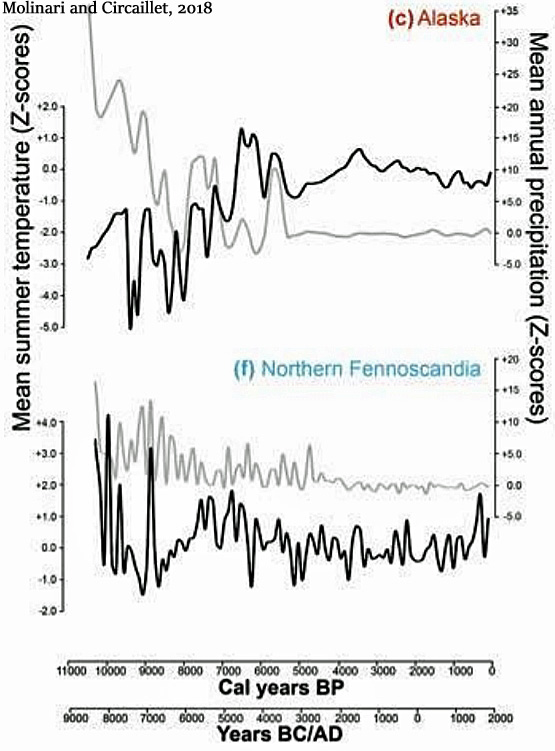
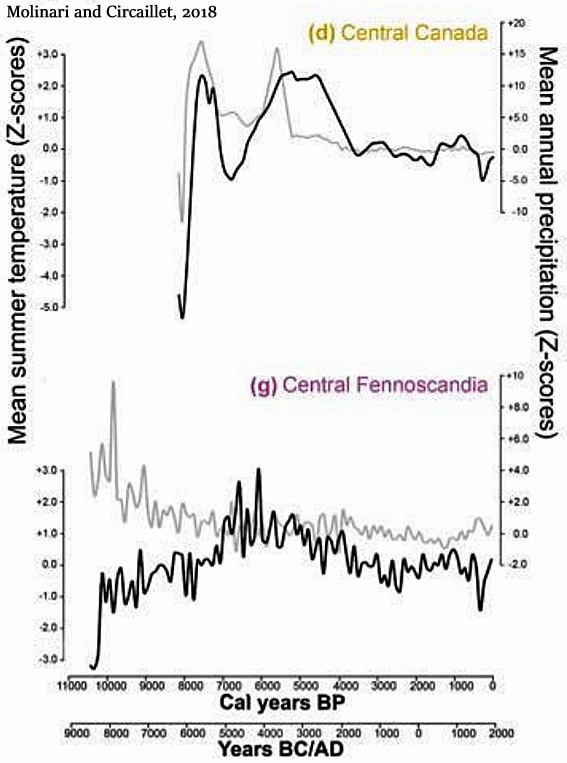
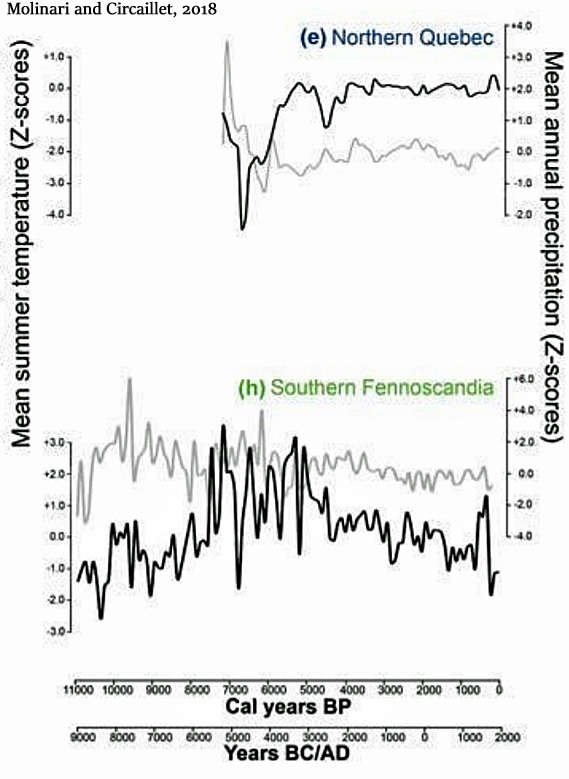
Molinari and Circaillet, 2018
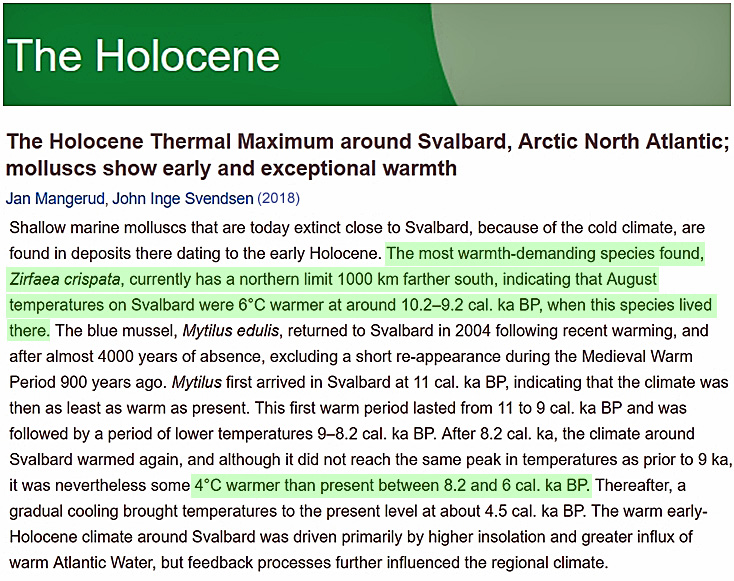
Mangerud and Svendsen, 2018
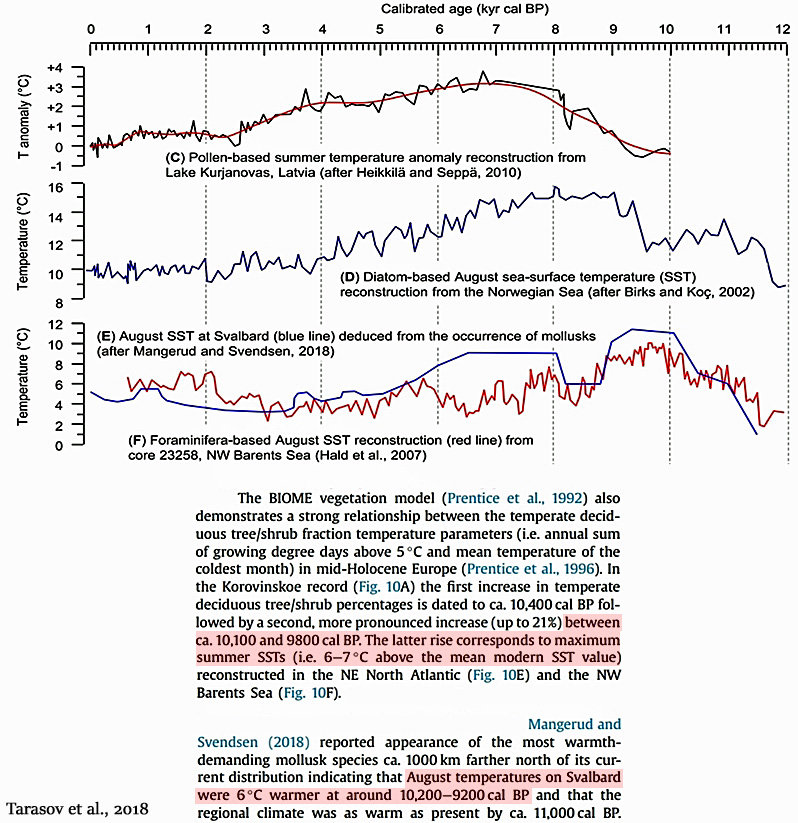
“Shallow marine molluscs that are today extinct close to Svalbard, because of the cold climate, are found in deposits there dating to the early Holocene. The most warmth-demanding species found, Zirfaea crispata, currently has a northern limit 1000 km farther south, indicating that August temperatures on Svalbard were 6°C warmer at around 10.2–9.2 cal. ka BP, when this species lived there. … After 8.2 cal. ka, the climate around Svalbard warmed again, and although it did not reach the same peak in temperatures as prior to 9 ka, it was nevertheless some 4°C warmer than present between 8.2 and 6 cal. ka BP. Thereafter, a gradual cooling brought temperatures to the present level at about 4.5 cal. ka BP. The warm early-Holocene climate around Svalbard was driven primarily by higher insolation and greater influx of warm Atlantic Water, but feedback processes further influenced the regional climate.”
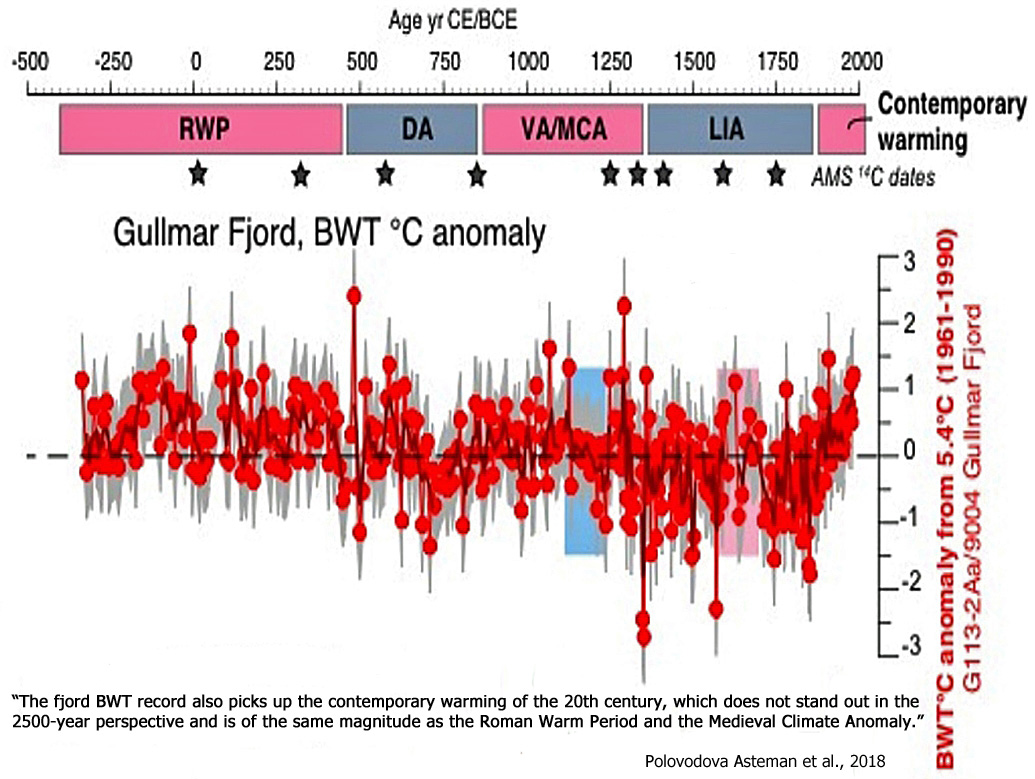
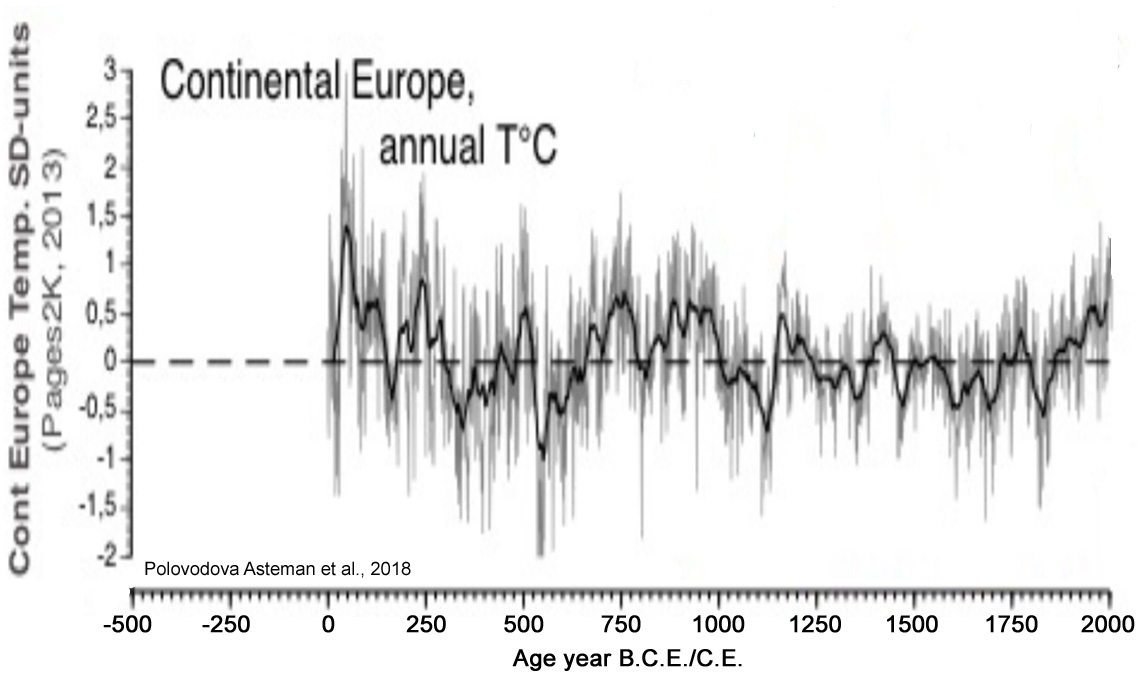
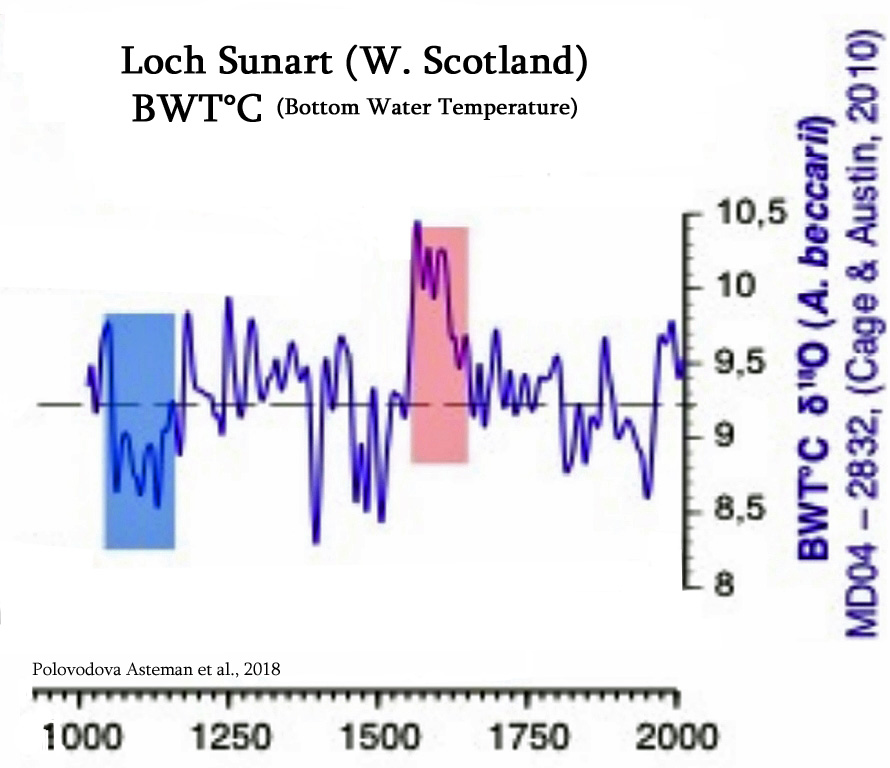
Polovodova Asteman et al., 2018
“The record demonstrates a warming during the Roman Warm Period (~350 BCE – 450 CE), variable bottom water temperatures during the Dark Ages (~450 – 850 CE), positive bottom water temperature anomalies during the Viking Age/Medieval Climate Anomaly (~850 – 1350 CE) and a long-term cooling with distinct multidecadal variability during the Little Ice Age (~1350 – 1850 CE). The fjord BWT [bottom water temperatures] record also picks up the contemporary warming of the 20th century, which does not stand out in the 2500-year perspective and is of the same magnitude as the Roman Warm Period and the Medieval Climate Anomaly.”
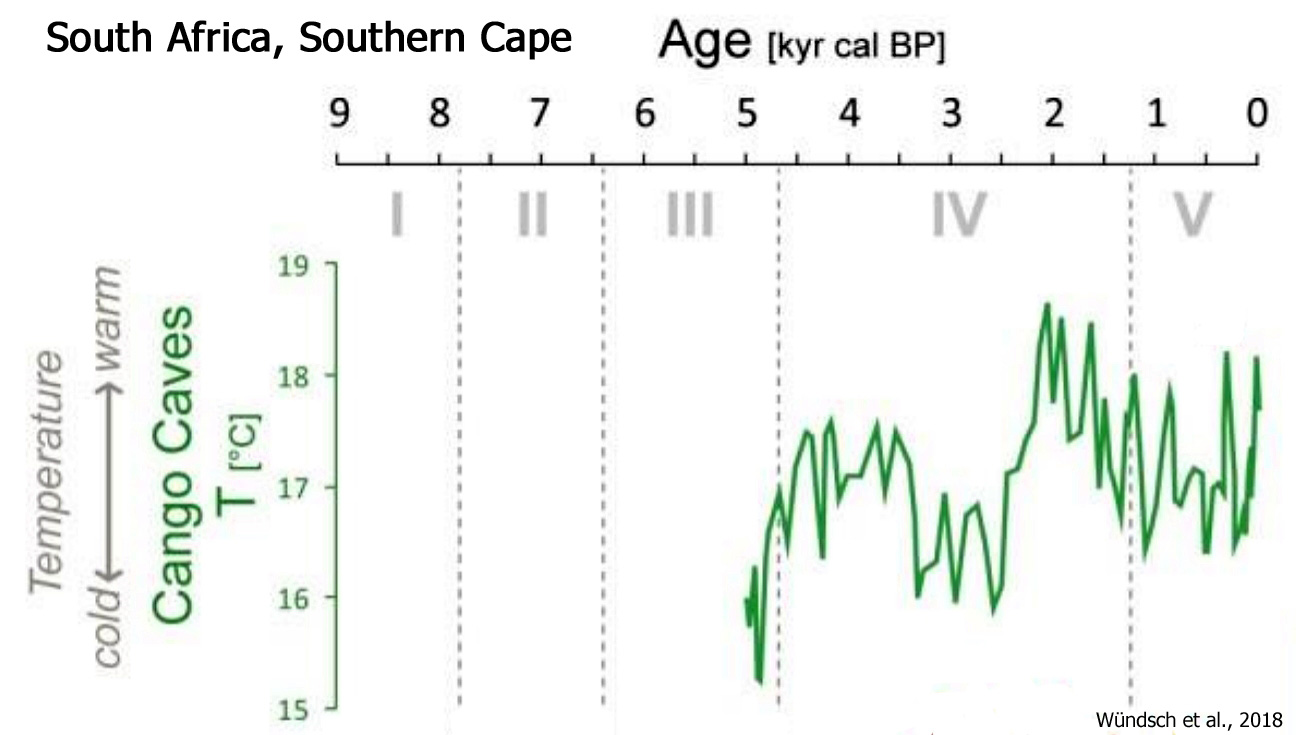
Wündsch et al., 2018
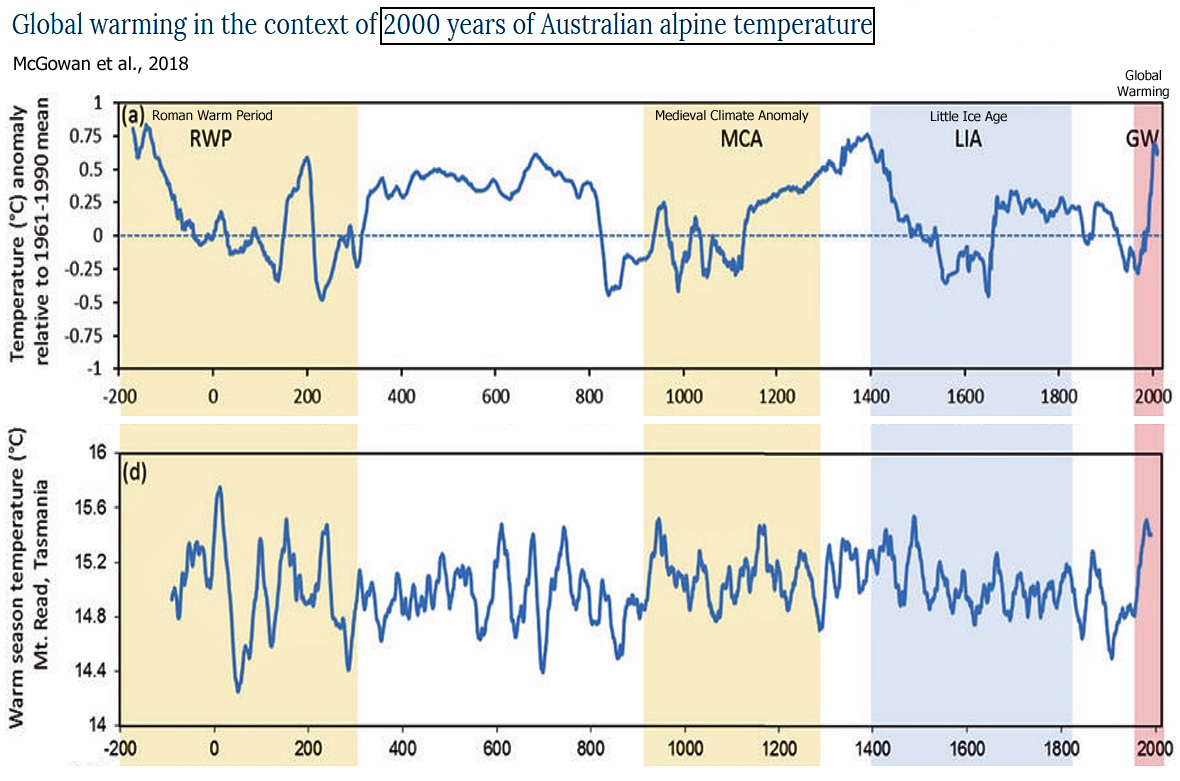
McGowan et al., 2018
“Our reconstructed Tmax [temperature maximum] for these warmer conditions peaks around 1390 CE at + 0.8 °C above the 1961–90 mean, similar to the peak Tmax during the RWP [Roman Warm Period]. These results are aligned with the findings that show the period from 1150 to 1350 CE to be the warmest pre-industrial chronzone of the past 1000 yrs for southeast Australia.”
Bernabei et al., 2018
Nielsen et al., 2018
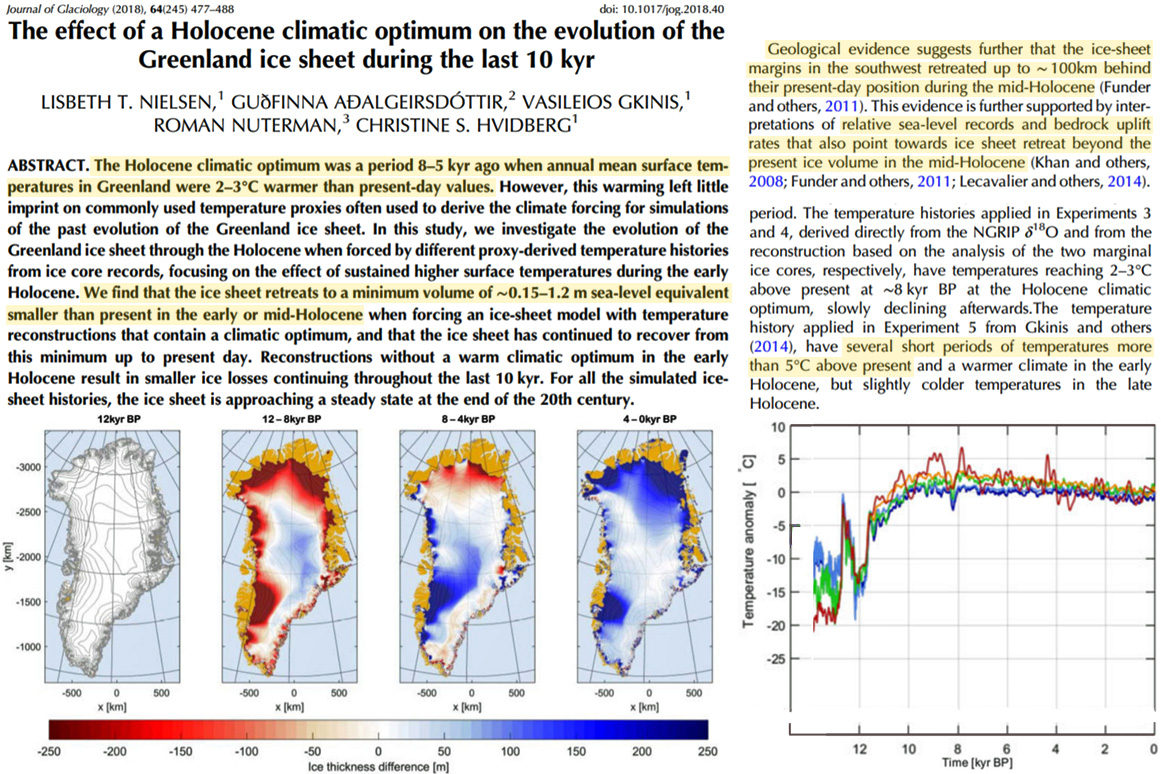
“The Holocene climatic optimum was a period 8–5 kyr ago when annual mean surface temperatures in Greenland were 2–3°C warmer than present-day values. … We find that the ice sheet retreats to a minimum volume of ∼0.15–1.2 m sea-level equivalent smaller than present in the early or mid-Holocene when forcing an ice-sheet model with temperature reconstructions that contain a climatic optimum, and that the ice sheet has continued to recover from this minimum up to present day. … The largest and most rapid retreat of the ice sheet was found for Experiment 5, which was forced by the temperature and accumulation reconstructions of Gkinis and others (2014). In this temperature reconstruction, temperature increases rapidly at the onset of the interglacial and has several shorter periods with temperatures more than 5°C above present in the early Holocene. … Geological evidence suggests further that the ice-sheet margins in the southwest retreated up to ∼ 100km behind their present-day position during the mid-Holocene (Funder and others, 2011). This evidence is further supported by interpretations of relative sea-level records and bedrock uplift rates that also point towards ice sheet retreat beyond the present ice volume in the mid-Holocene (Khan and others, 2008; Funder and others, 2011; Lecavalier and others, 2014).”
Ganyushkin et al., 2018 (full paper)
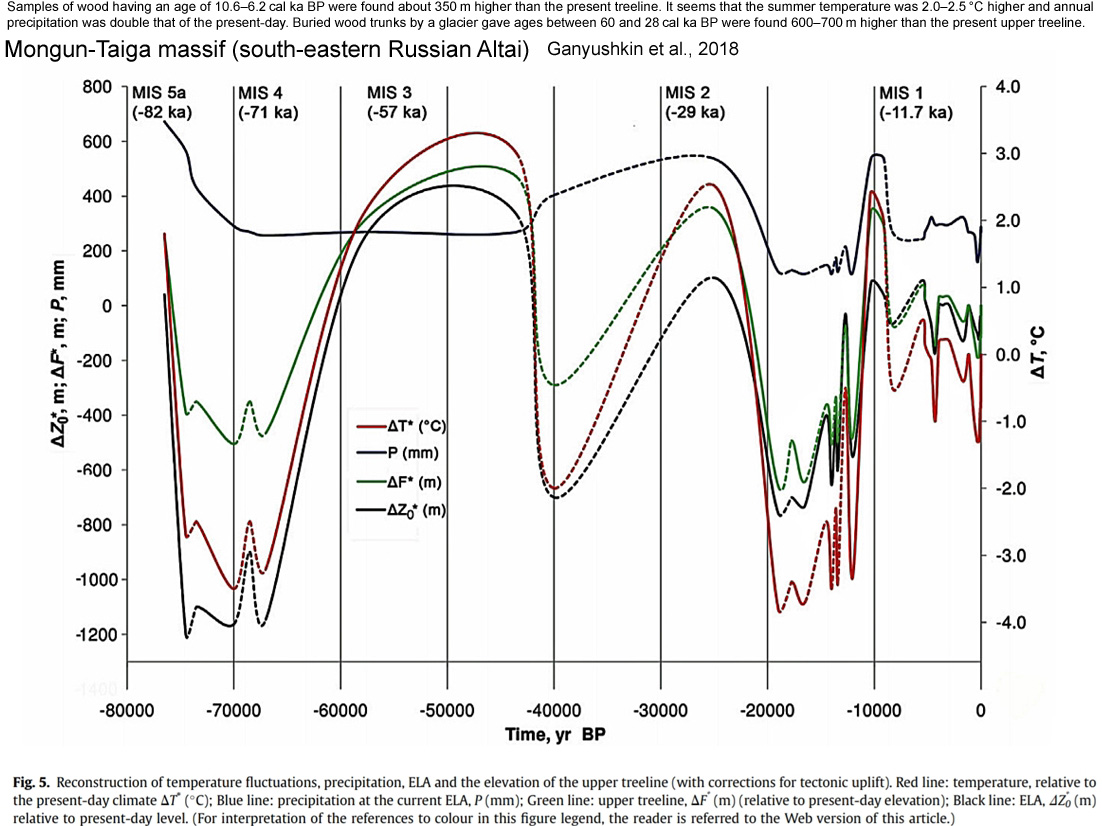
“Samples of wood having an age of 10.6–6.2 cal ka BP were found about 350 m higher than the present treeline. It seems that the summer temperature was 2.0–2.5 °C higher and annual precipitation was double that of the present-day. … Buried wood trunks by a glacier gave ages between 60 and 28 cal ka BP and were found 600–700 m higher than the present upper treeline. This evidences a distinctly elevated treeline during MIS 3a and c. With a correction for tectonics we reconstructed the summer warming to have been between 2.1 and 3.0 °C [higher than today].”
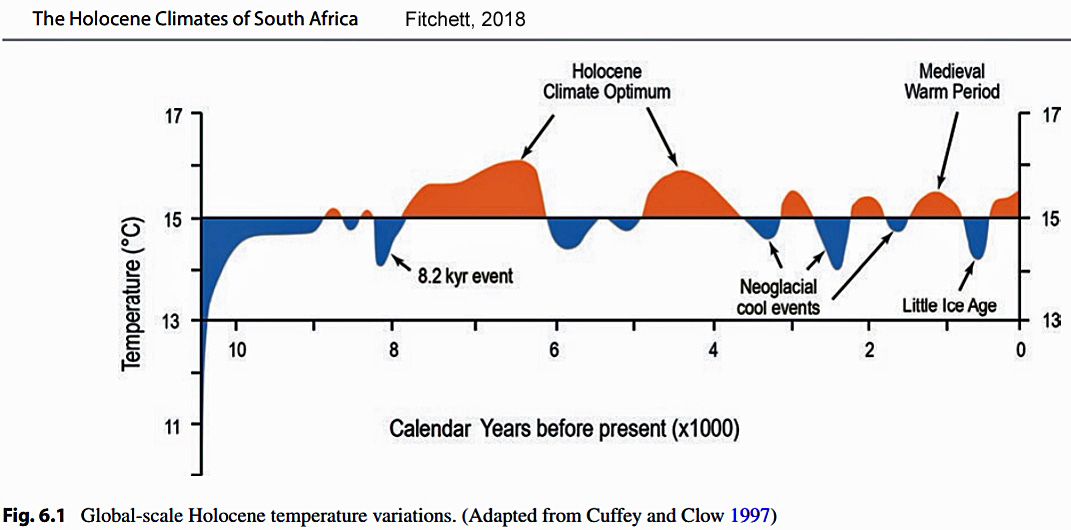
Fitchett, 2018
“While the existence of a Little Ice Age cold event has been confirmed across much of the region, the local temperature decrease for this period remains to be quantitatively constrained. Suggestions of temperatures 1 °C colder than present during the Little Ice Age and 3 °C warmer than present in the earlier Medieval Warm Period (Tyson et al. 2000), remain unconfirmed against inferences of more severe cooling, as this event [Little Ice Age]reflects the most pronounced δ18O deviation within the 25,000 years.”
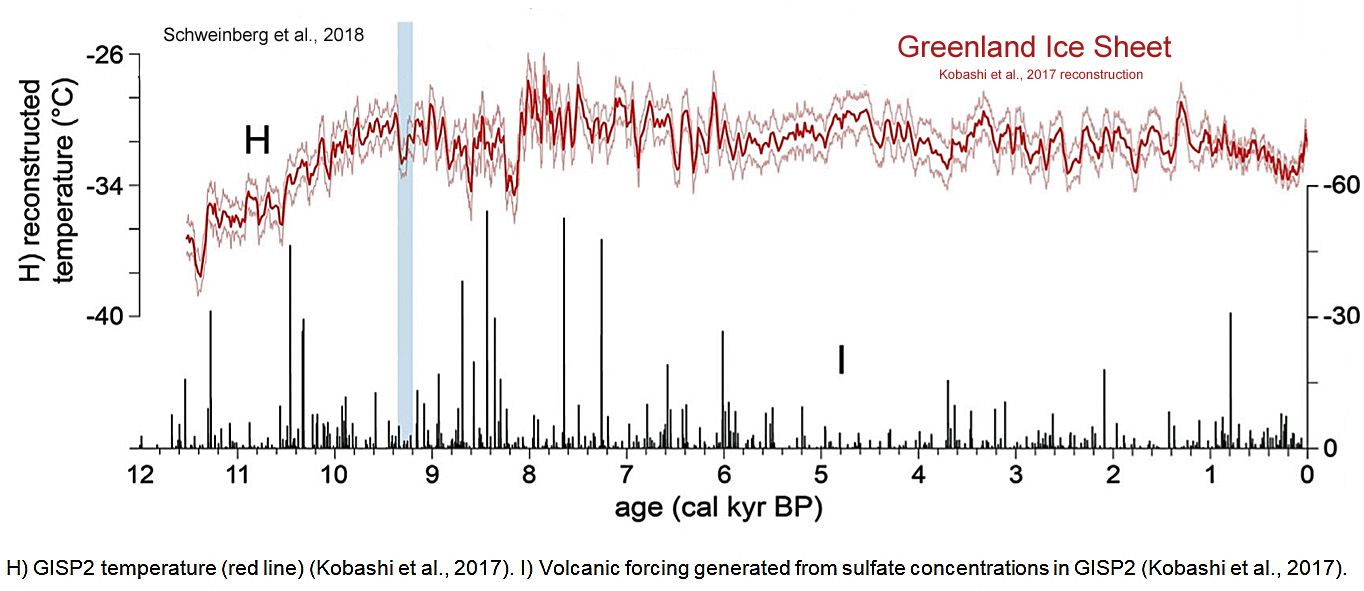
“[C]old periods of centennial to millennial duration can be produced by a series of consecutive large volcanic eruptions, and that lower temperatures can persist at high northern latitudes for a century or more long after volcanic aerosols are removed from the atmosphere (Schneider et al., 2009; Miller et al., 2012; Sigl et al., 2015; Kobashi et al., 2017).”
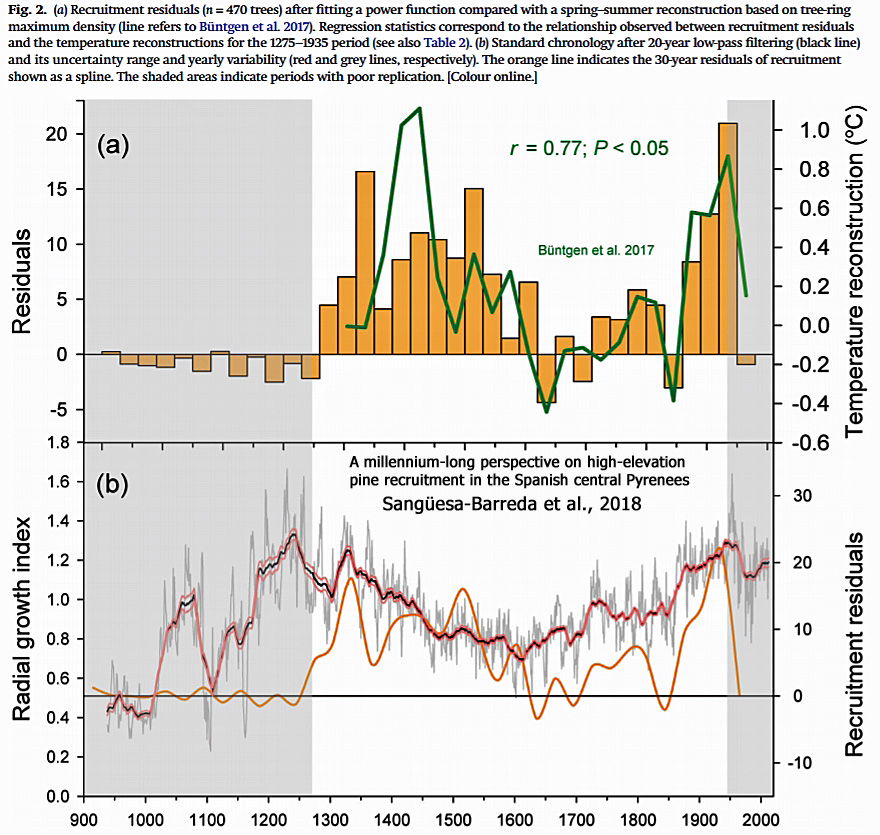
“In summary, we found that tree recruitment in a tree-line ecotone in the Spanish central Pyrenees was enhanced during warm periods, whereas cold periods were associated with relatively low recruitment rates. Tree-ring records reveal that temperature is the major driver of long-term tree population dynamics in cold-limited environments.”
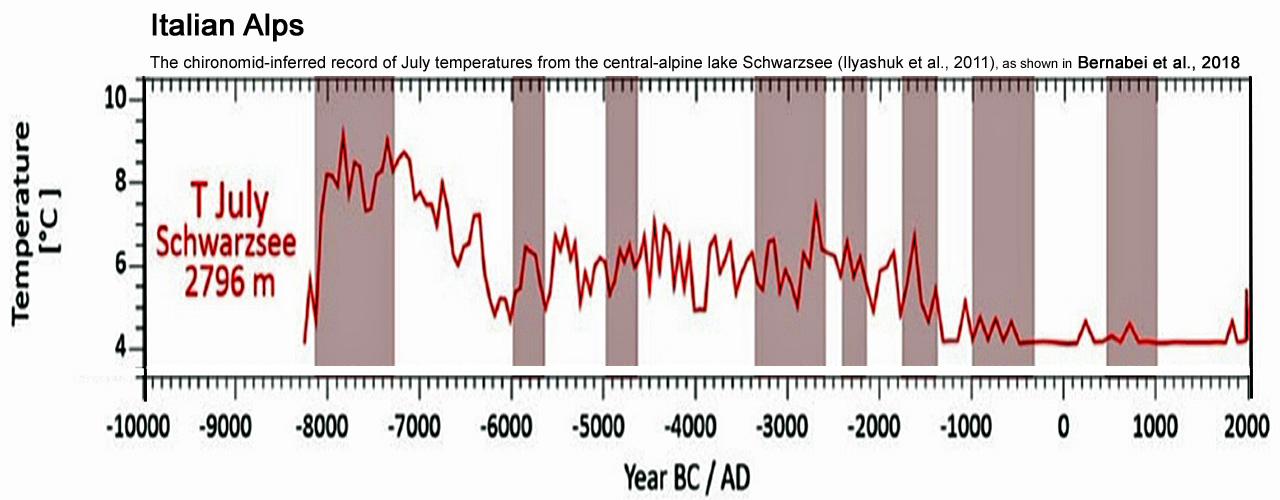
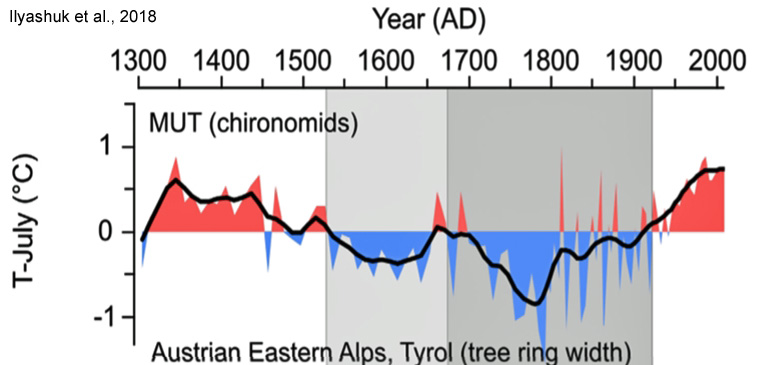
Ilyashuk et al., 2018
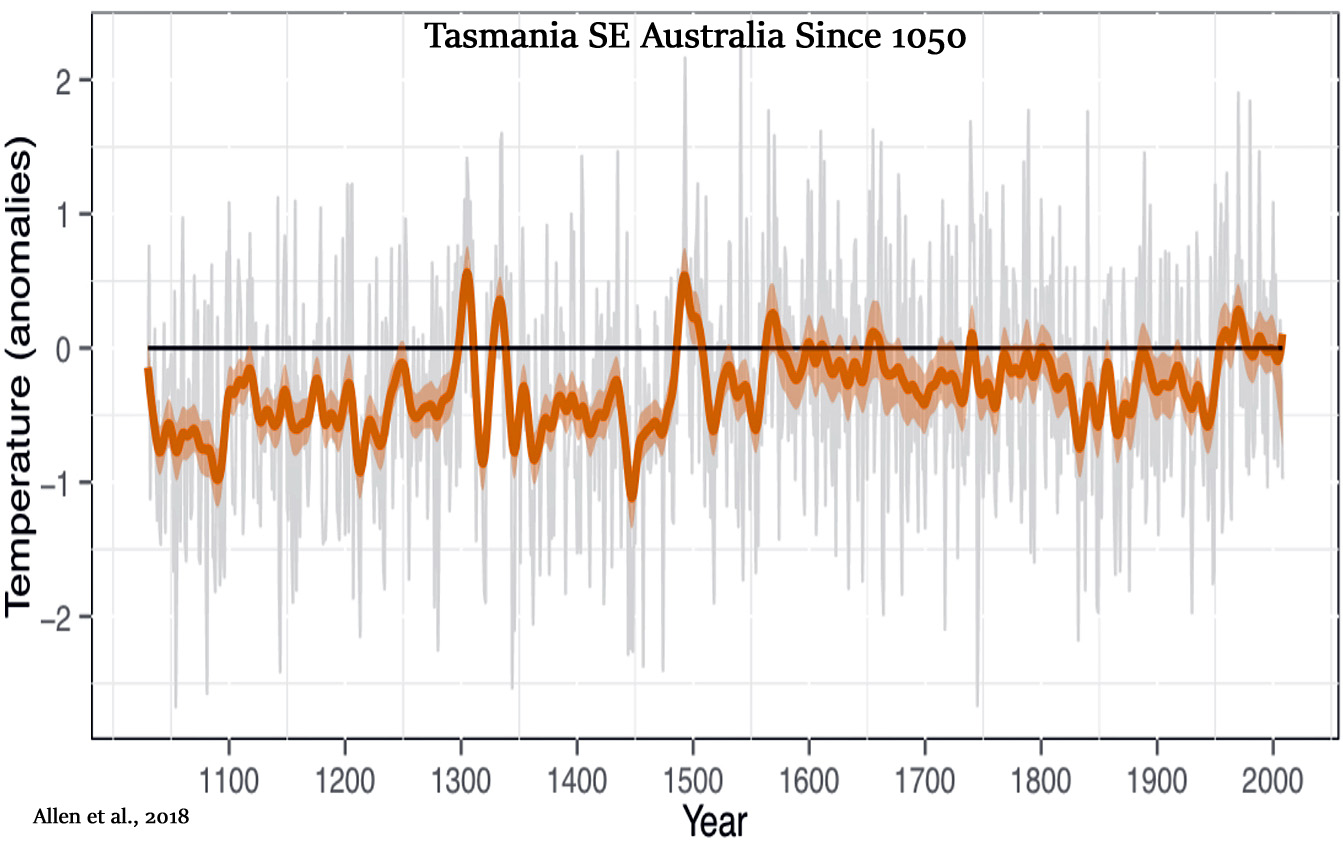
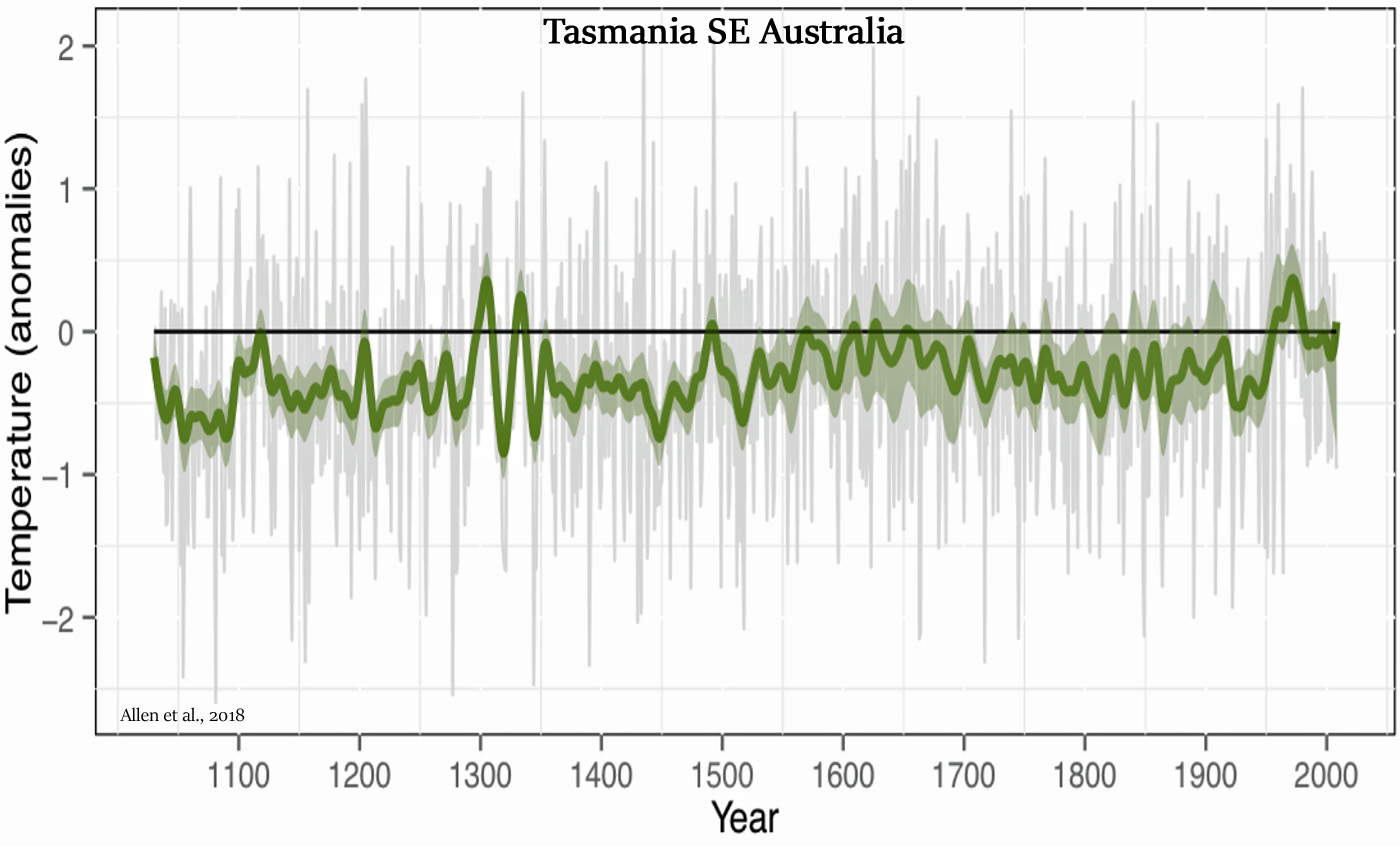
Allen et al., 2018
“The longest sustained period of relatively high temperatures in the reconstructions is the post 1950 CE period although there are clearly individual years much earlier that were warmer than any in the post-1950 period.”
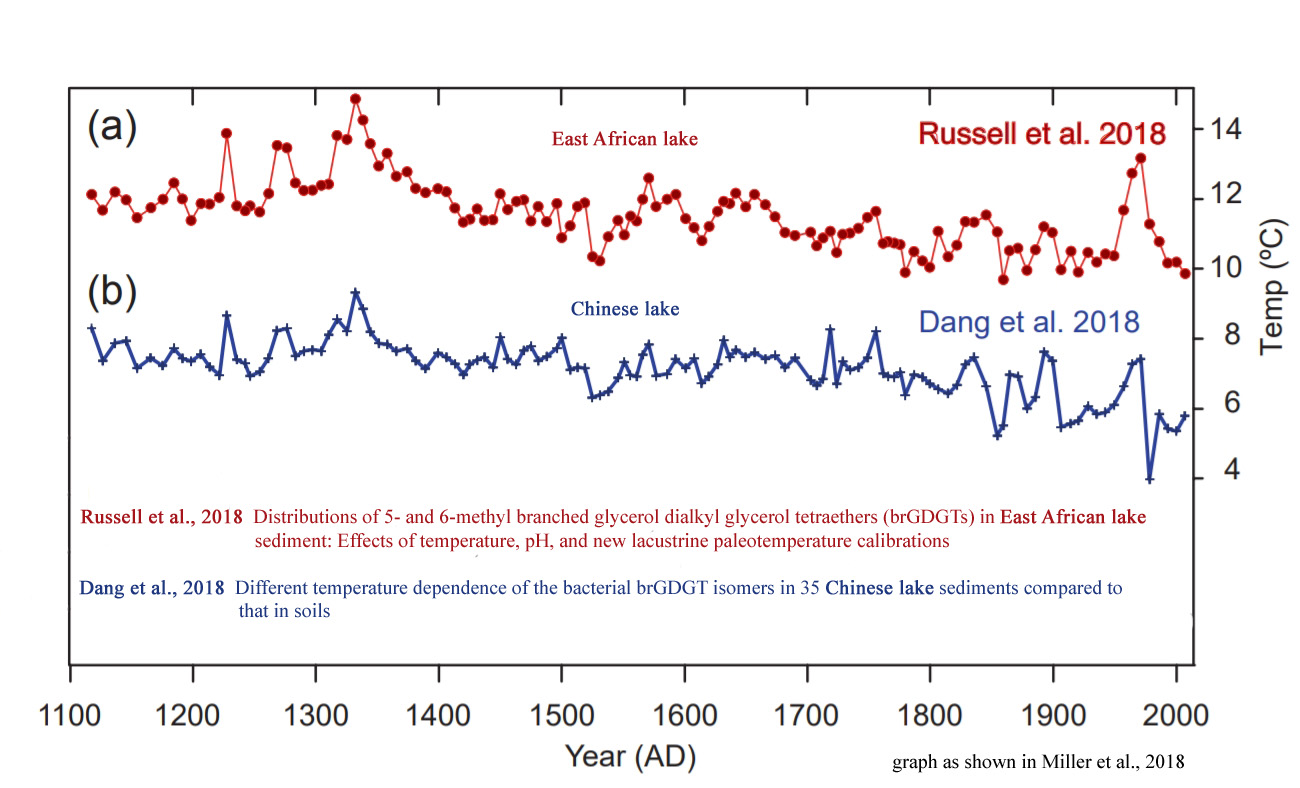
Miller et al., 2018
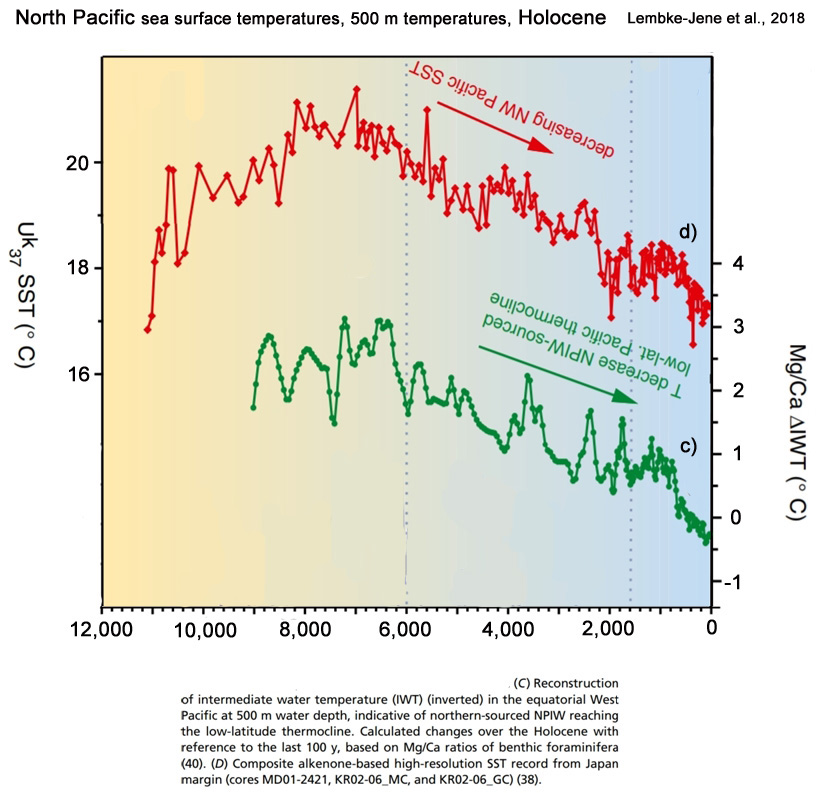
Lembke-Jene et al., 2018
“Importantly, recent low-latitude mid-depth thermocline temperature changes (at around 500 m water depth) in the equatorial West Pacific show concomitant higher temperatures in the EMH [Early to Mid Holocene, 11 to 6 thousand years ago] of similar magnitude, with northern NPIW-sourced thermocline or intermediate water temperatures (Fig. 3C) being warmer by 2.1 ± 0.4 °C than during the last century [Rosenthal et al., 2013], in strong accord with our assumed decrease in ventilation in OSIW and NPIW.”
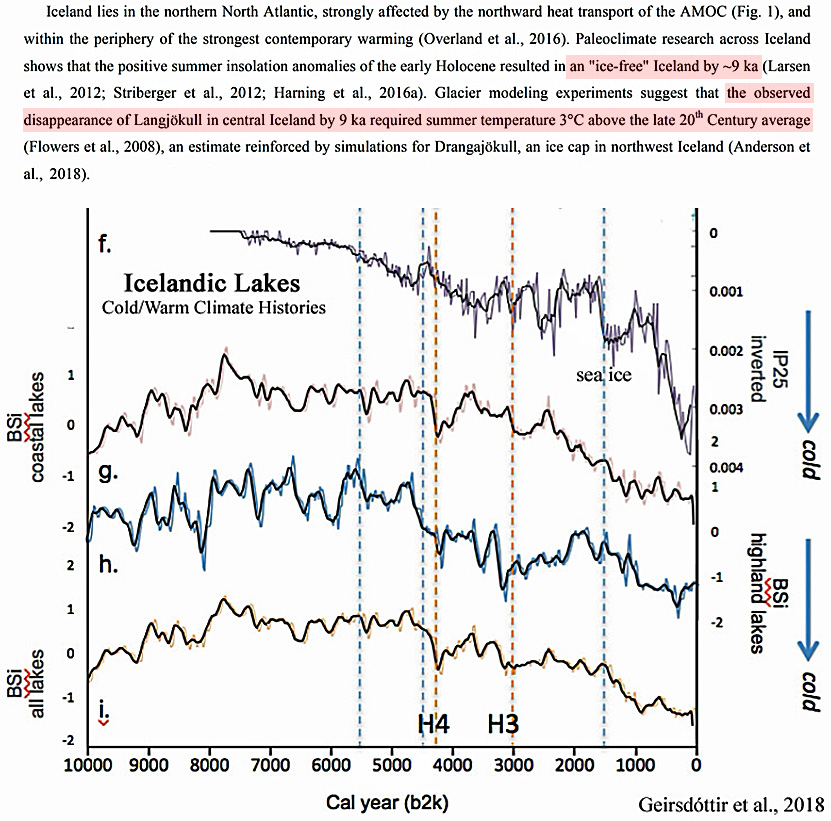
Geirsdóttir et al., 2018
“Paleoclimate research across Iceland shows that the positive summer insolation anomalies of the early Holocene resulted in an “ice-free” Iceland by ~9 ka (Larsen et al., 2012; Striberger et al., 2012; Harning et al., 2016a). Glacier modeling experiments suggest that the observed disappearance of Langjökull in central Iceland by 9 ka required summer temperature 3°C above the late 20th Century average (Flowers et al., 2008), an estimate reinforced by simulations for Drangajökull, an ice cap in northwest Iceland (Anderson et al., 2018).”
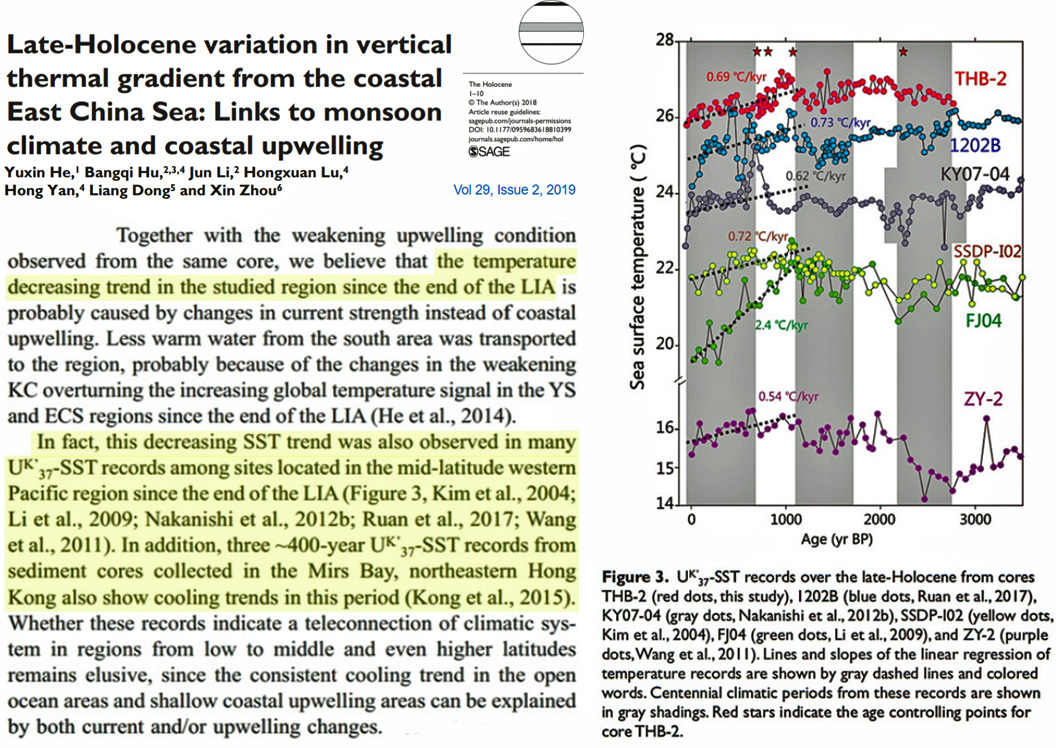
He et al., 2018
“Together with the weakening upwelling condition observed from the same core, we believe that the temperature decreasing trend in the studied region since the end of the LIA [(the recent ~100 years)] is probably caused by changes in current strength instead of coastal upwelling. Less warm water from the south area was transported to the region, probably because of the changes in the weakening KC overturning the increasing global temperature signal in the YS and ECS regions since the end of the LIA (He et al., 2014). In fact, this decreasing SST trend was also observed in many UK’37-SST records among sites located in the mid-latitude western Pacific region since the end of the LIA (Figure 3, Kim et al., 2004; Li et al., 2009; Nakanishi et al., 2012b; Ruan et al., 2017; Wang et al., 2011). In addition, three ~400-year UK’37-SST records from sediment cores collected in the Mirs Bay, northeastern Hong Kong also show cooling trends in this period (Kong et al., 2015).”
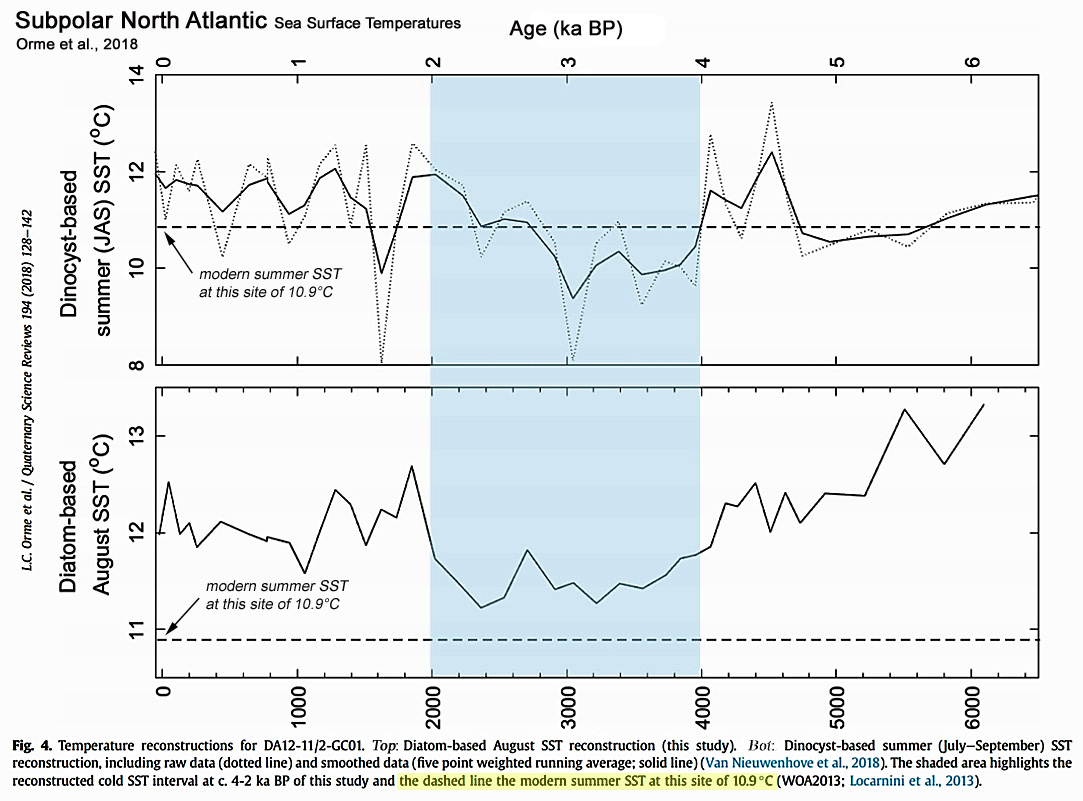
Orme et al., 2018
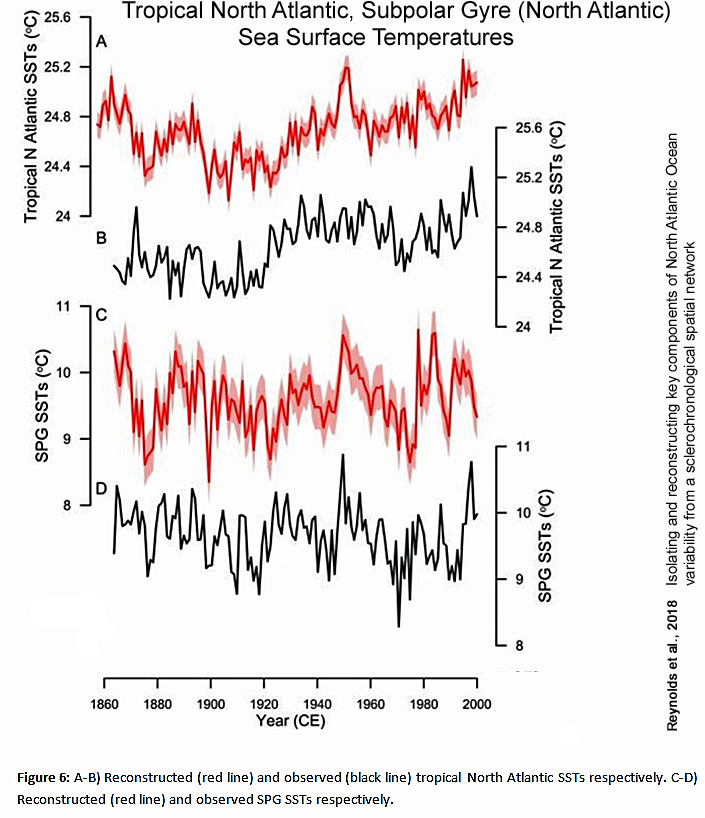
“The diatom-based reconstruction shows warmer reconstructed temperatures than the dinocyst-based reconstruction and the modern measured summer SST (June-August) of 10.9°C. … The overall long-term cooling trend in the diatom-based SST reconstruction for the last 6.1 ka fits with the widely established cooling in the subpolar North Atlantic since the Holocene Thermal Maximum, resulting from decreasing Northern Hemisphere summer insolation (e.g. Calvo et al., 2002; Marchal et al., 2002; Andersen et al., 2004a, 2004b; Andersson et al., 2010; Jiang et al., 2015; Sejrup et al., 2016). … The earliest warm period at ~6.1-4 ka BP had average reconstructed SSTs of 12-13.3°C, with the warmest temperatures in the record occurring at ~6.1-5.5 ka BP (c. 13°C). The cooler period ~4-2 ka BP had reconstructed SST that varied around 11.5°C, with minima at 3.2 and 2.4 ka BP interrupted by a short warming at 2.7 ka BP. In the most recent period after 2 ka BP the SSTs again increased peaking at 1.8 ka BP, yet SSTs did not attain values as high as those reconstructed for 6.1-4 ka BP. … In the diatom-based record the mean reconstructed temperature between 4 and 2 ka BP is 11.5°C compared with 12.5 and 12.1°C in the periods before 4 ka BP and after 2 ka BP respectively, showing a reconstructed cooling of 0.6-1°C. In the dinocyst-based record the mean reconstructed temperature between 4 and 2 ka BP is 10.3°C compared with 11.3 and 11.6°C in the periods before 4 ka BP and after 2 ka BP respectively, showing a cooling of 1-1.3°C.”
Li et al, 2018
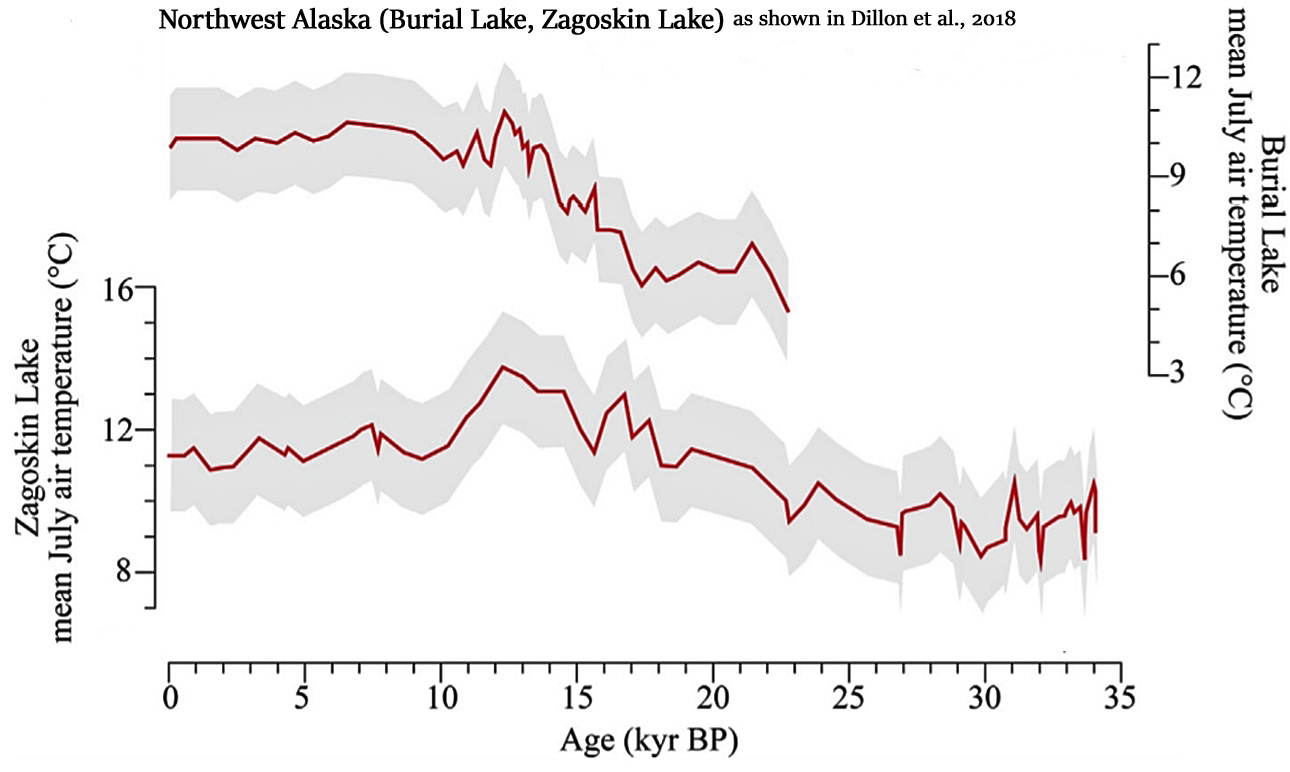
Dillon et al., 2018
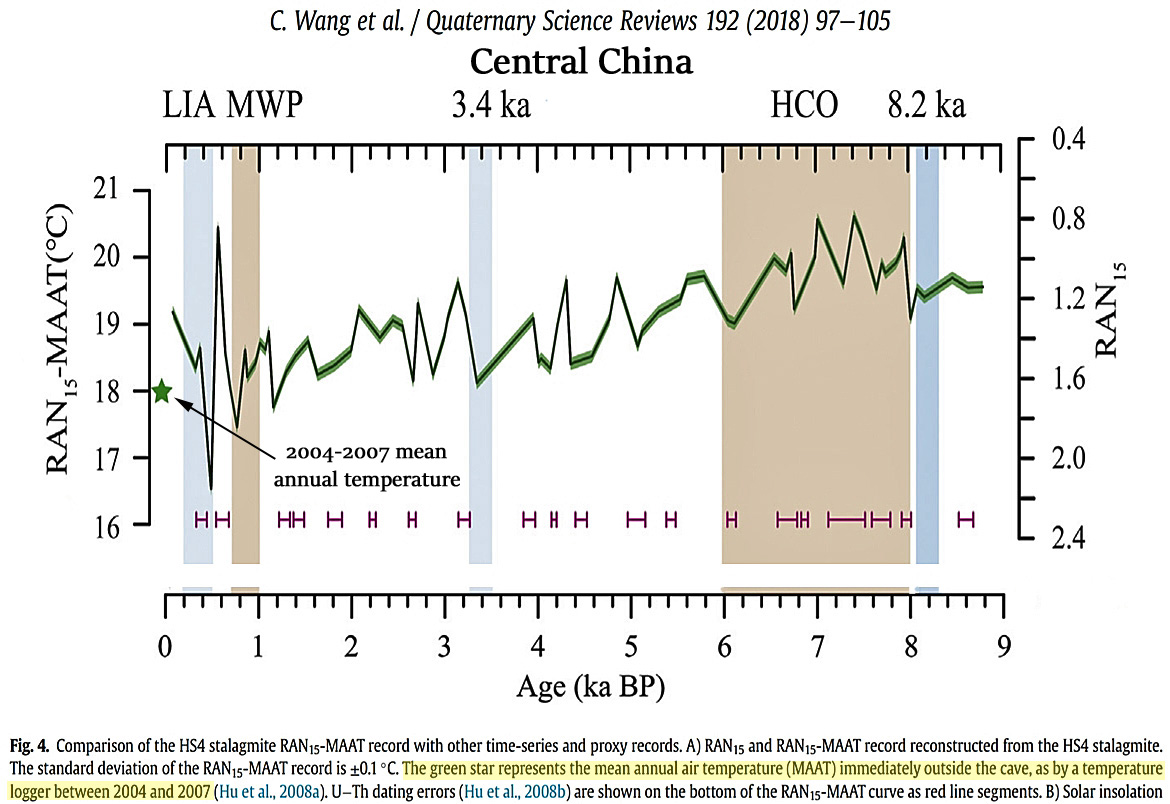
Wang et al., 2018
“The average RAN15-MAAT of 18.4°C over the most recent part of the record (<0.8 ka BP) [the last 800 years BP] overlaps with the range of MAATs, ca. 16.2°C to 18.7°C (av. 17.5°C) measured since 1952 at the nearest meteorological station (Yichang, located ca. 100 km away) and is very close to the av. MAAT of 18°C measured directly outside the cave by a temperature logger between 2004 and 2007 (Hu et al., 2008a). This agreement between reconstructed temperatures and instrumental measurements increases our confidence in the potential of the RAN15 proxy. RAN15-MAATs in HS4 vary from 16.5°C to 20.6°C (av. 19°C), during the last 9 ka BP, and broadly follow a long-term trend of declining temperatures in line with declining solar insolation at 30°N in July (Laskar et al., 2004). … Interestingly, the most recent 0.9 ka BP [900 years BP] is distinguished by greater variability with the highest (20.5°C) and lowest (16.5°C) RAN15-MAATs occurring consecutively at 0.6 ka BP [600 years BP] and 0.5 ka BP [500 years BP].” [Surface temperatures dropped by -4.0°C within ~100 years.]
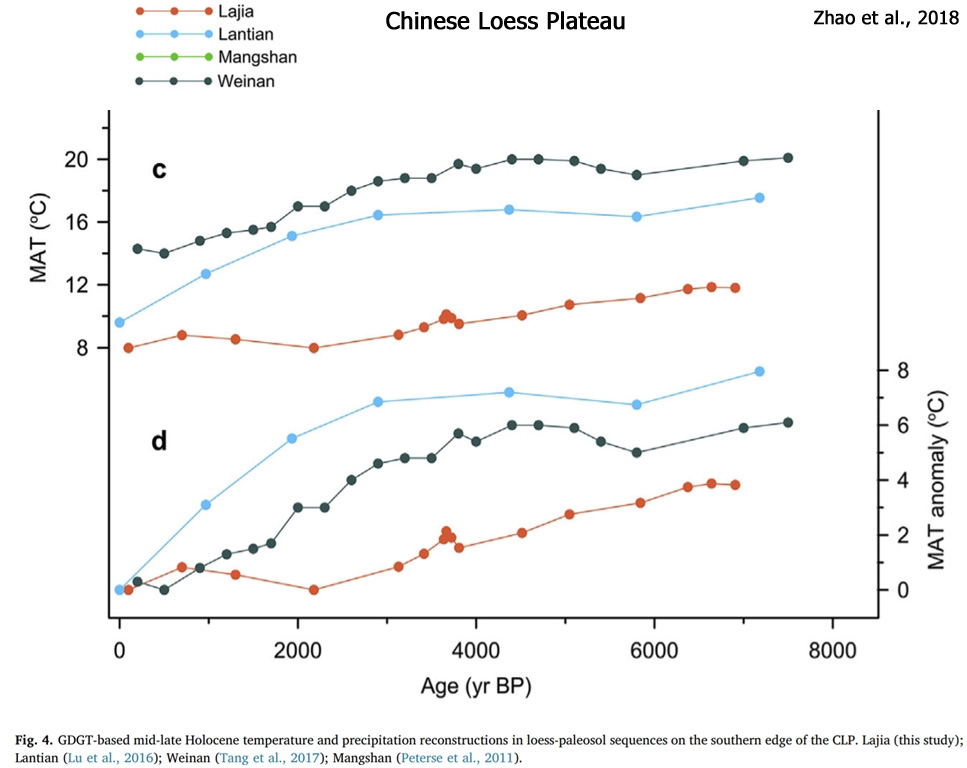
Zhao et al., 2018
“According to the interpolation of meteorological data of the two nearest weather stations at Linxia (ca. 46 km away; MAT [mean annual temperature] = 7.3 °C) and Minhe (ca. 54 km away; MAT [mean annual temperature] = 8.3 °C … In this study, we reconstructed mid-late Holocene climatic changes using GDGT distributions in a loess-paleosol sequence in the Lajia Ruins of the Neolithic Qijia Culture, Guanting Basin, in the southwestern end of the Chinese Loess Plateau. … MAT [mean annual temperature] decreased from 11.9 °C to 8.0 °C, during the past ca. 7000 yr, and a drastic decline in MAP [mean annual precipitation] (70 mm), accompanied by a 0.8 °C decline in MAT [mean annual temperature], occurred at 3800–3400 yr BP.”
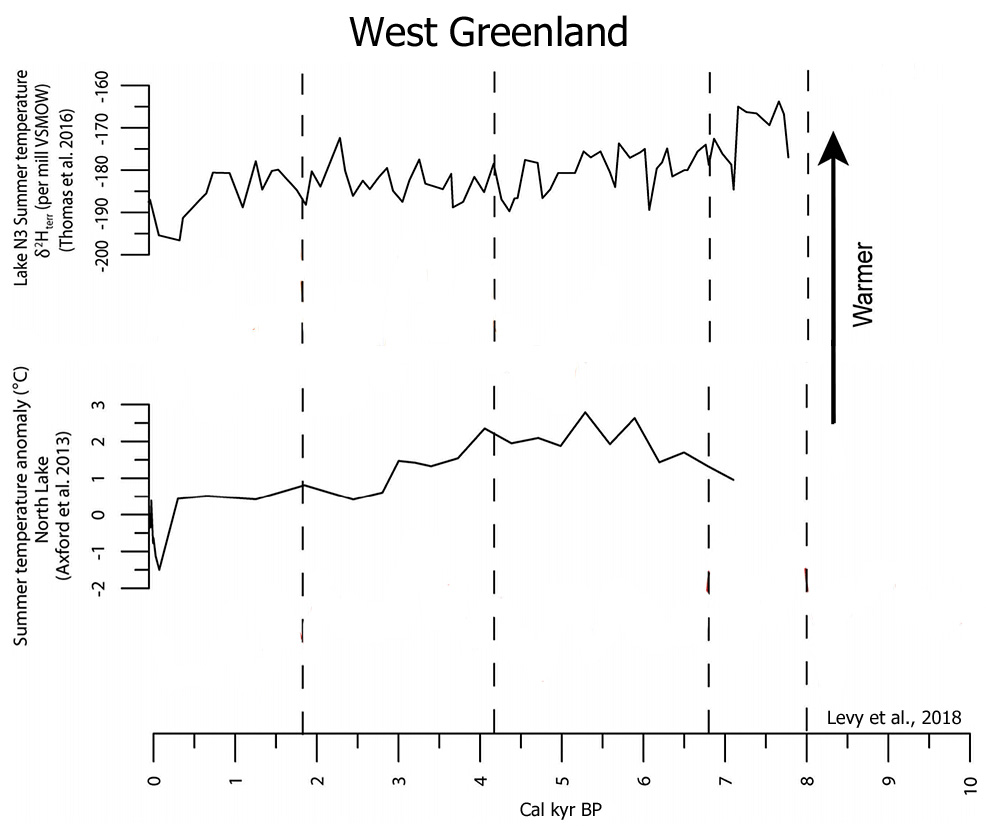
Levy et al., 2018
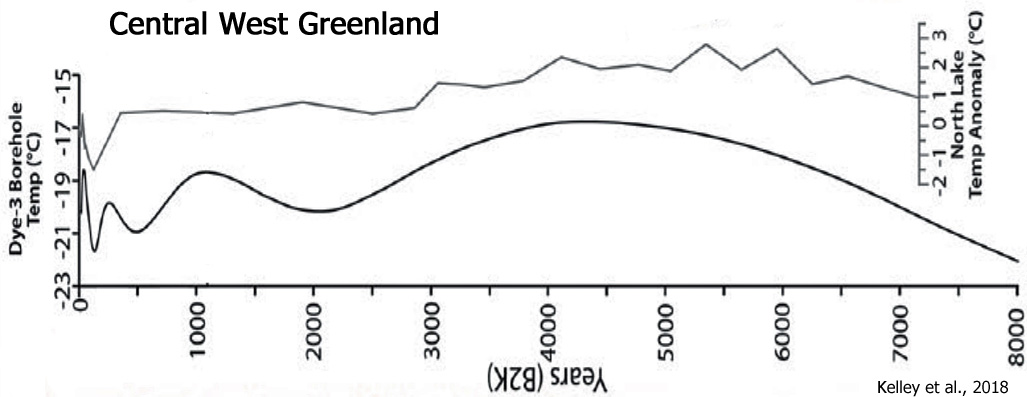
“The three historical moraine crests indicate that there were at least three ice-margin stillstands or advances during historical time. Summer temperature records from North lake (Axford et al. 2013) and Lake N3 (Thomas et al. 2016) broadly register cooling in the past 200 years in western Greenland, which likely influenced the advance to the historical moraines.”
Bajolle et al., 2018
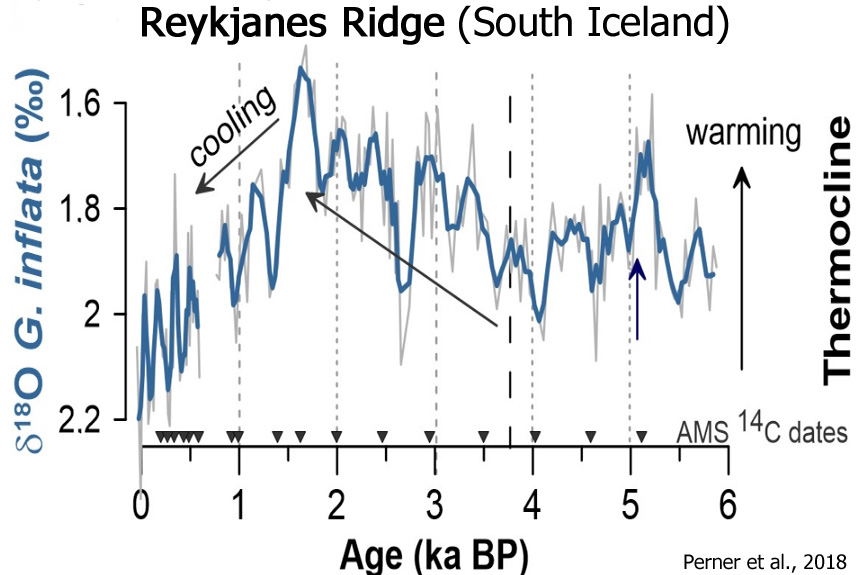
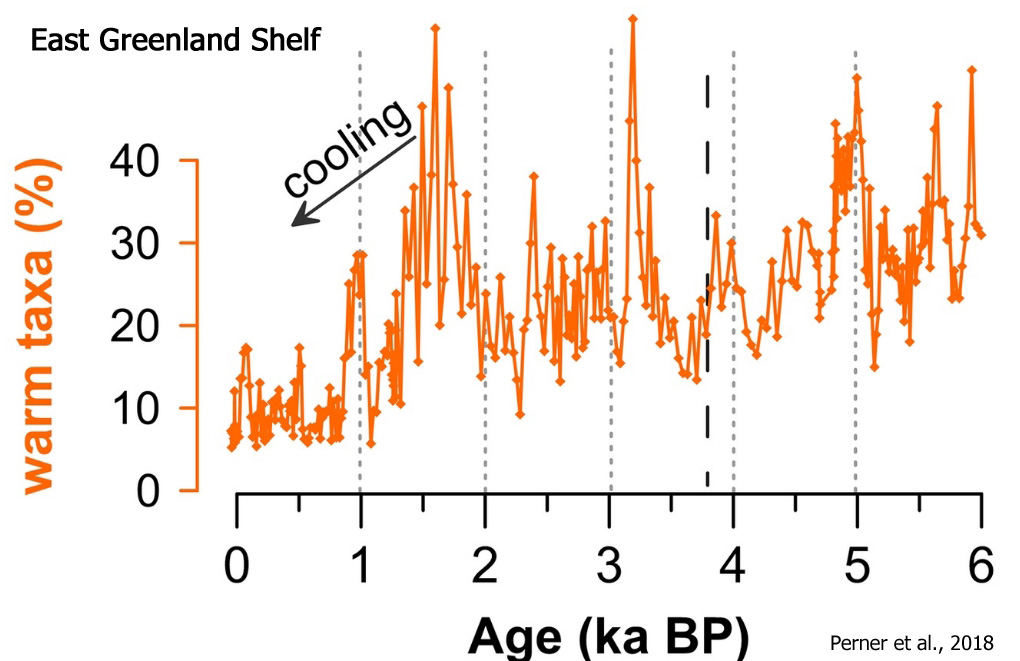
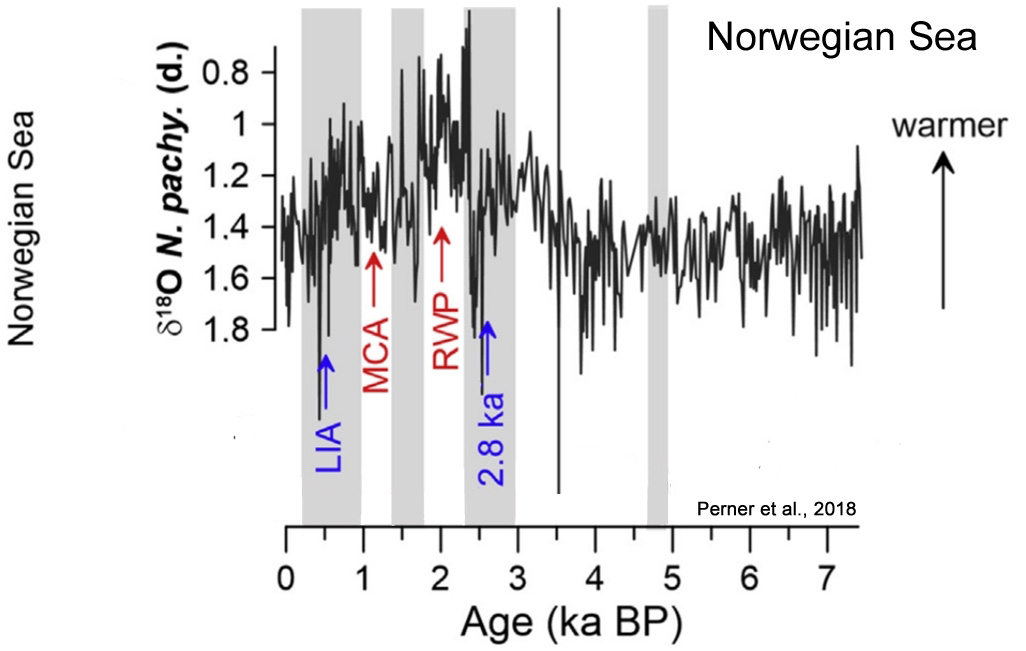
Perner et al., 2018
“From c. 1.5 ka BP onwards, we record a prominent subsurface cooling and continued occurrence of fresh and sea‐ice loaded surface waters at the study site.”
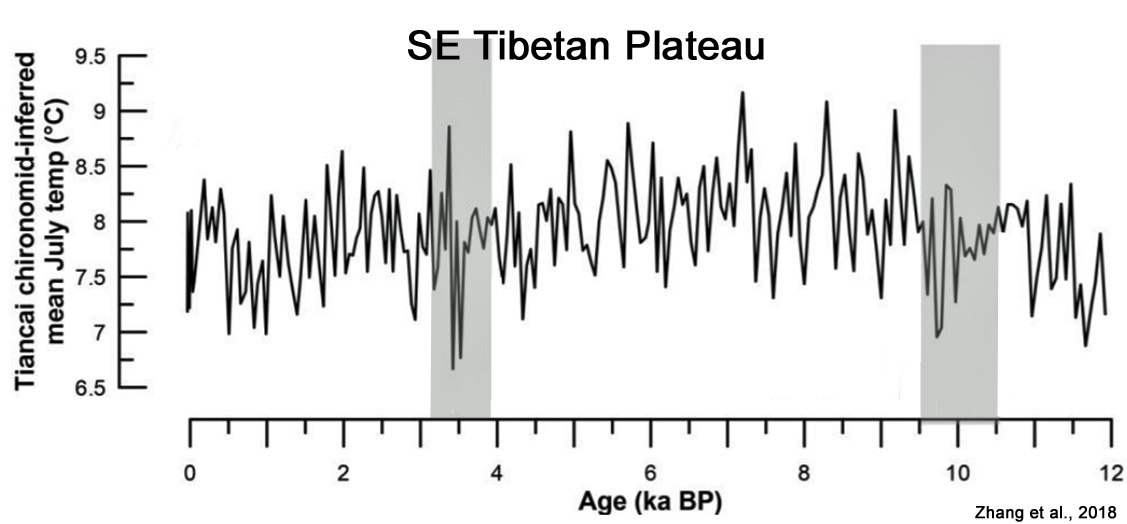
Zhang et al., 2018
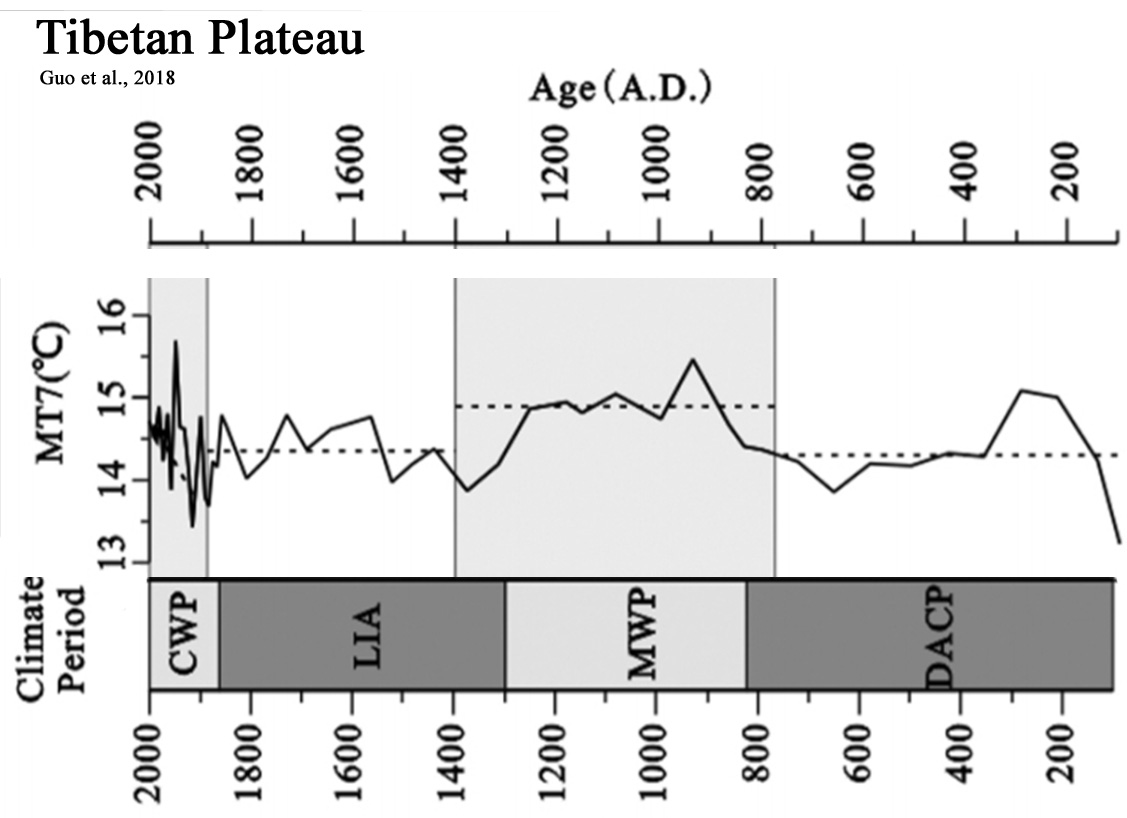
Guo et al., 2018
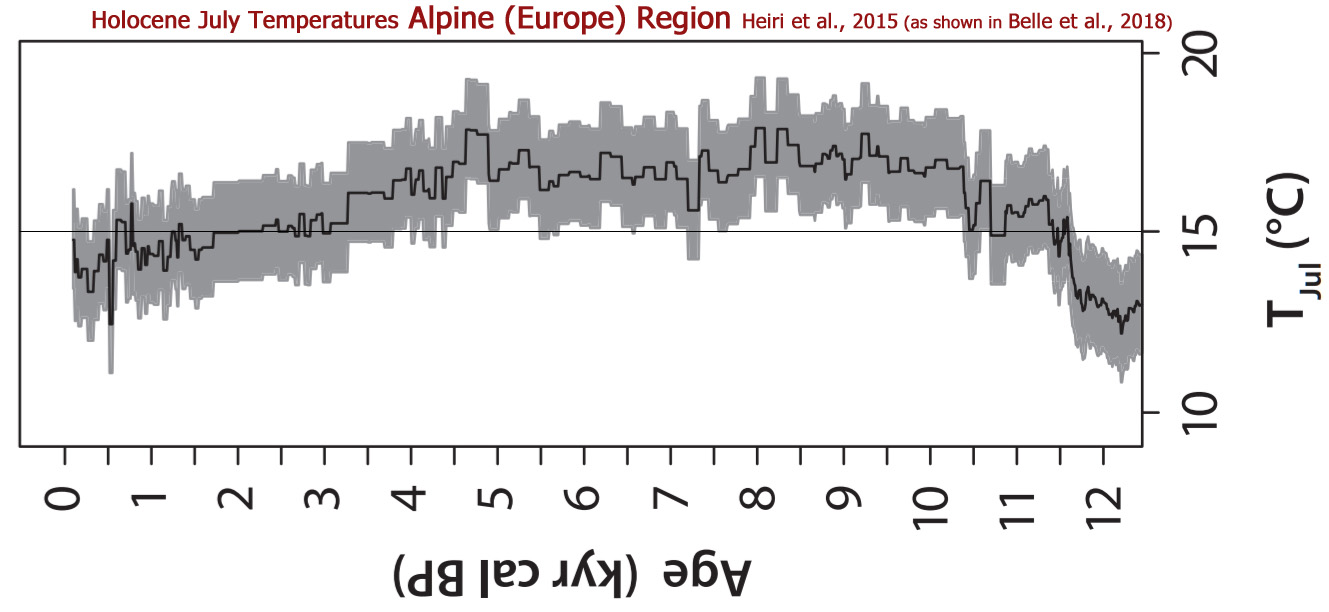
Belle et al., 2018
Taylor et al., 2018
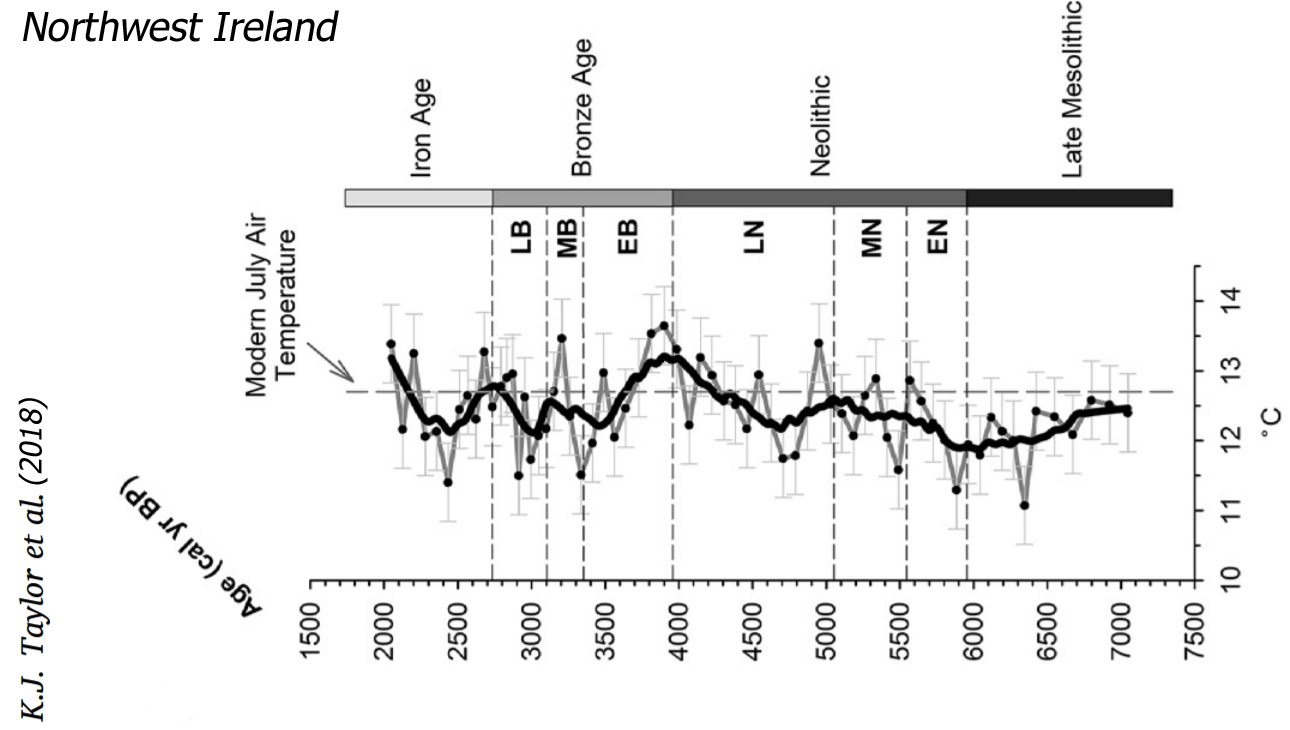
“This study provides the first mid to late Holocene chironomid-inferred temperature model for Ireland, creating a valuable climatic context for the development of Irish society during the Neolithic and Bronze Age. This reconstruction provides evidence of multiple fluctuations in temperature during the mid to late Holocene with a cold phase during the late Mesolithic (6800–5890 cal yr BP), followed by a warming period during the early Neolithic (5890–5570 cal yr BP). C-ITs reflect a relatively warm climate during the middle Neolithic, with a substantial warming from the late Neolithic into the early Bronze Age (4630–3810 cal yr BP), with temperatures registering above the modern day average between 3990 and 3810 cal yr BP.”
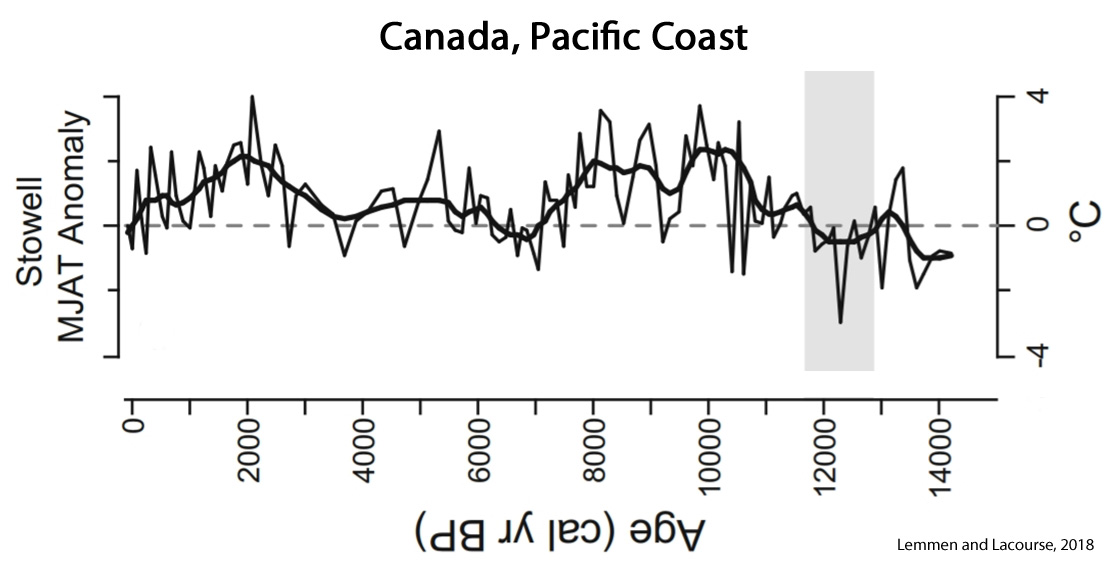
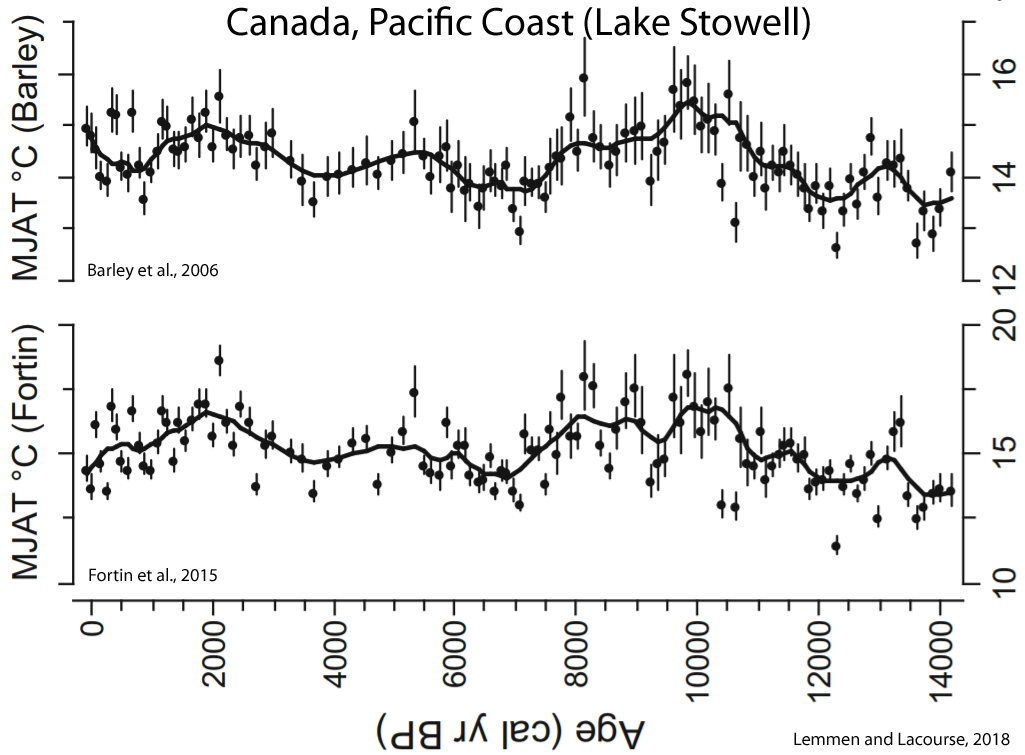
Lemmen and Lacourse, 2018
“The early Holocene was marked by relatively stable temperatures that exceeded modern by ~2 to 3°C. Inferred temperatures generally decrease through the remainder of the Holocene.”

Oppedal et al., 2018

Blundell et al., 2018
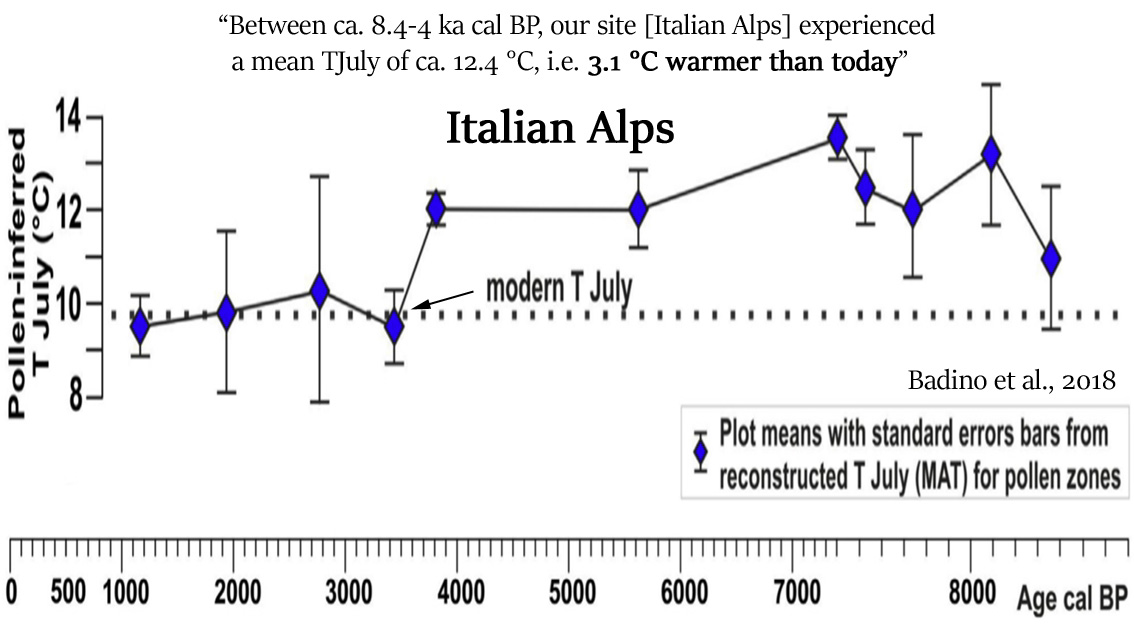
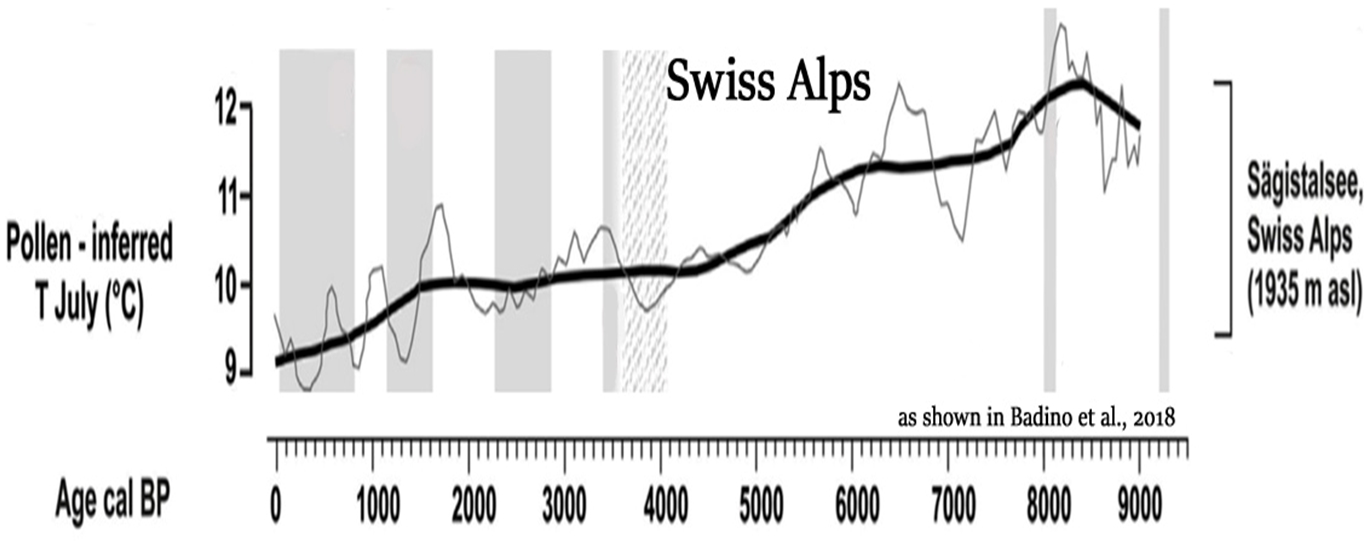
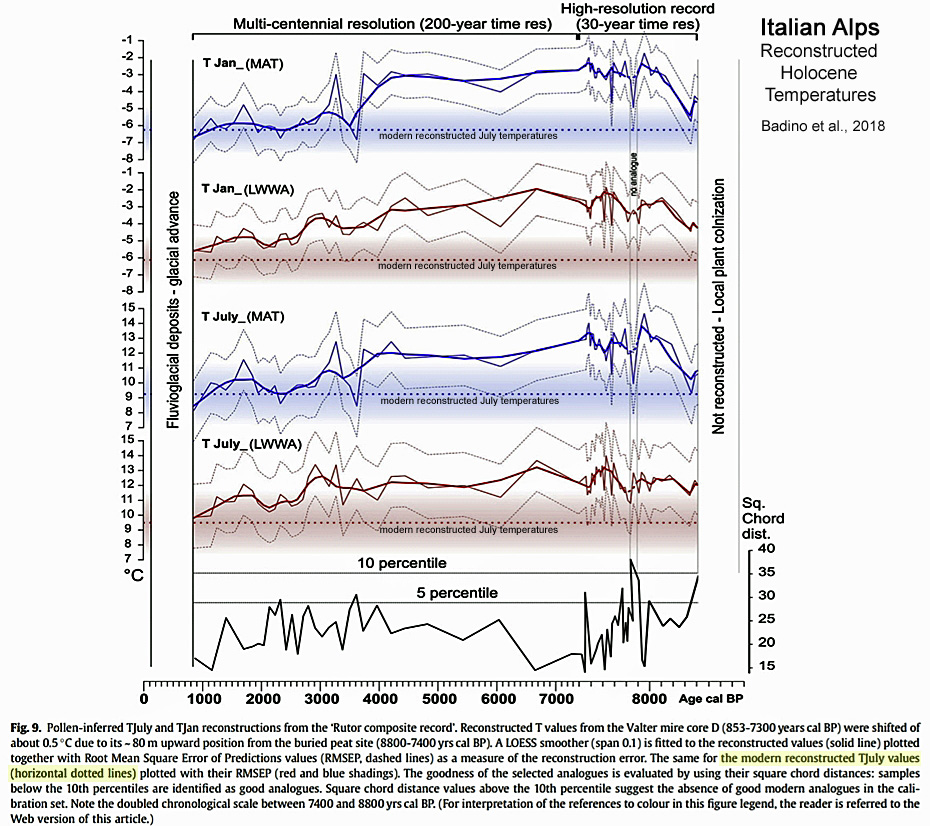
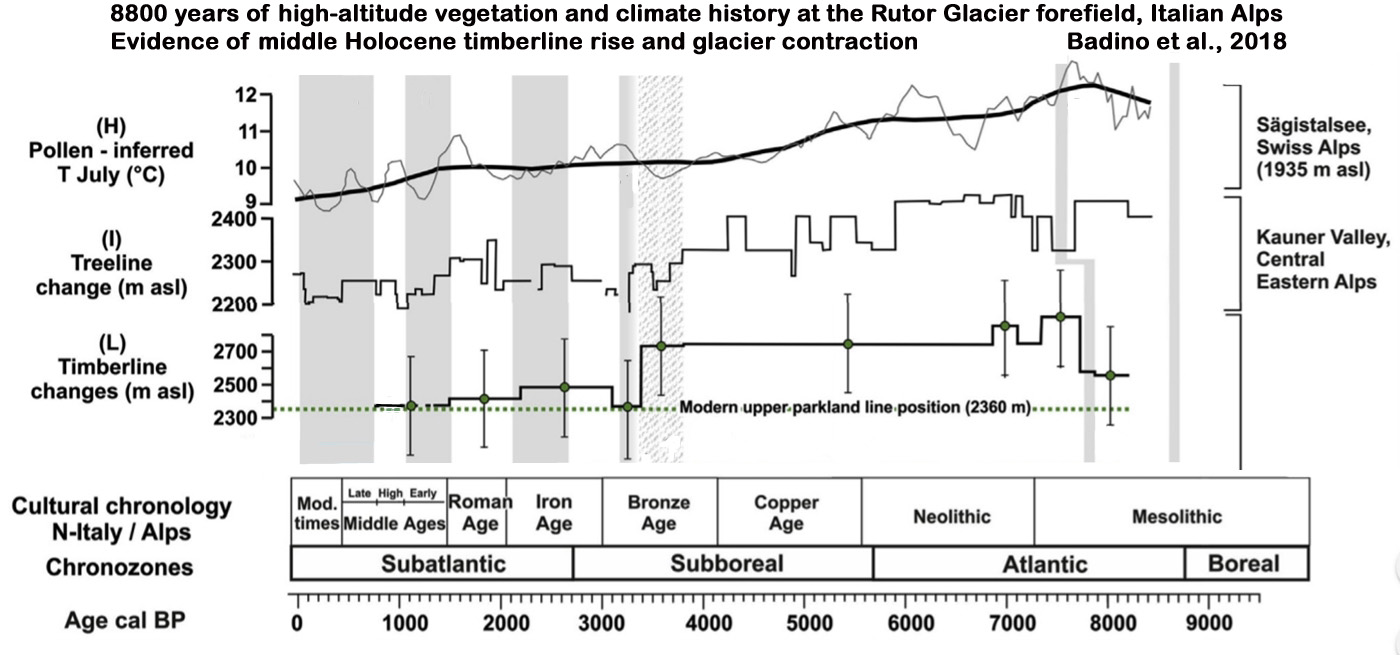
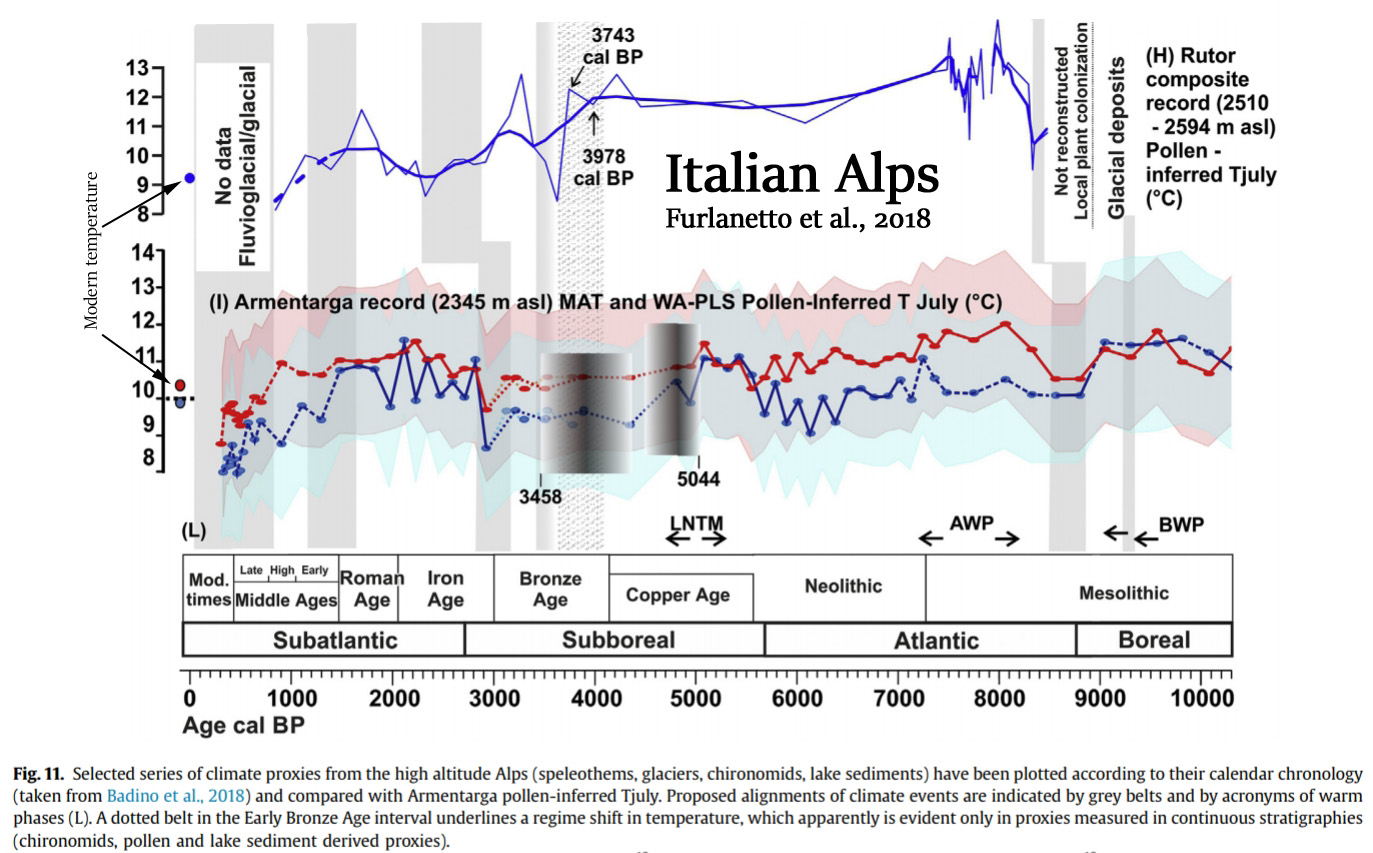
Badino et al., 2018
“Between ca. 8.4-4 ka cal BP [8,400 to 4,000 years before present], our site [Italian Alps] experienced a mean TJuly of ca. 12.4 °C, i.e. 3.1 °C warmer than today [9.3 °C]. … Between 7400 and 3600 yrs cal BP, an higher-than-today forest line position persisted under favorable growing conditions (i.e. TJuly at ca. 12 °C).”
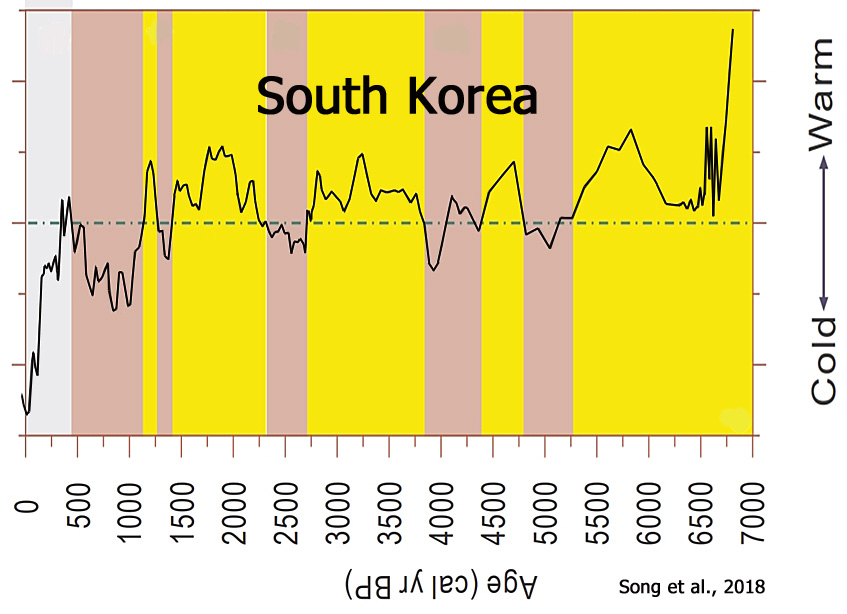
Song et al., 2018
“[A] general warm to cold climate trend from the mid-Holocene to the present, which can be divided into two different stages: a warmer stage between 6842 and 1297 cal yr BP and a colder stage from 1297 cal yr BP to the present.”
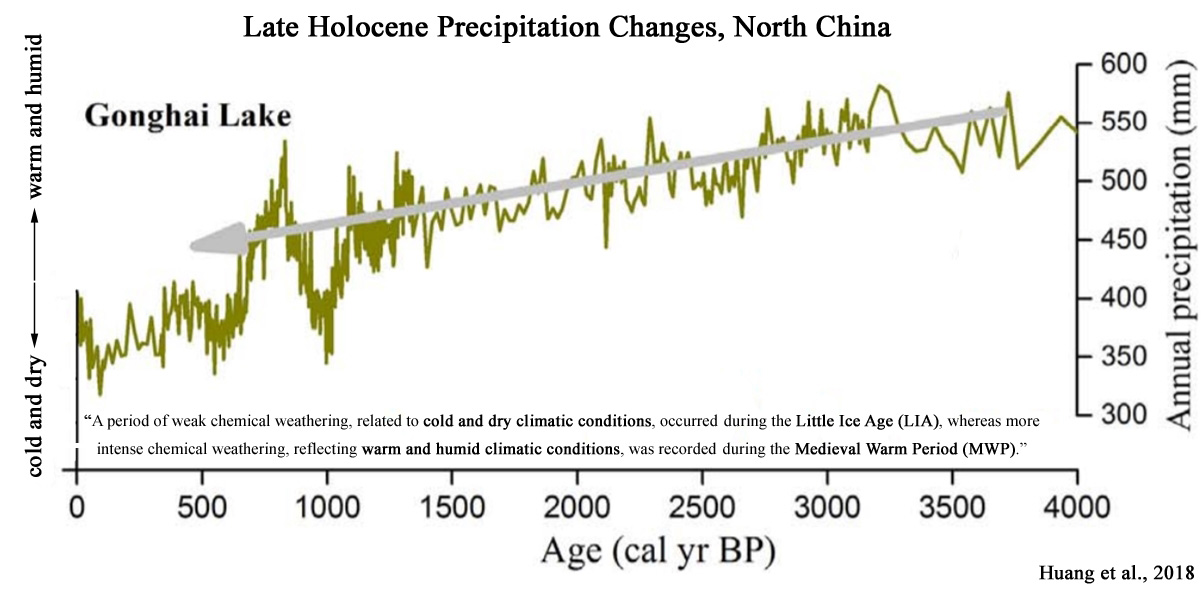
Huang et al., 2018
“A period of weak chemical weathering, related to cold and dry climatic conditions, occurred during the Little Ice Age (LIA), whereas more intense chemical weathering, reflecting warm and humid climatic conditions, was recorded during the Medieval Warm Period (MWP).”
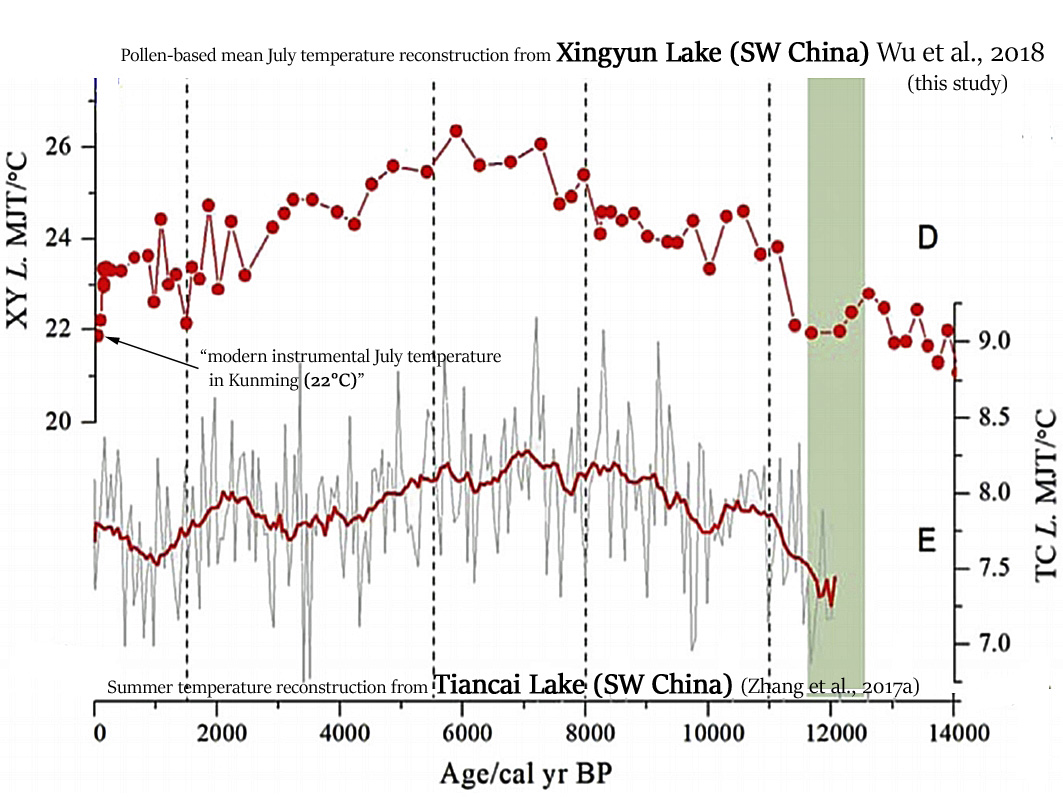
Wu et al., 2018
“Summer temperatures (MJT) at Xingyun Lake in the late glacial were low, increased during the early Holocene, were highest during the middle Holocene, and then decreased during the late Holocene. The range of inferred values [for the Holocene] was 21.0°- 26.5°C. The pollen inferred temperature derived from surface samples (21.2°C), is close to the modern instrumental July temperature in Kunming (22°C), supporting the reliability of reconstructions from down-core pollen assemblages.” [Modern temperatures are 1.0°C above the coldest of the last 14,000 years, and 4.5°C cooler than the warmest temperatures of the last 14,000 years.]
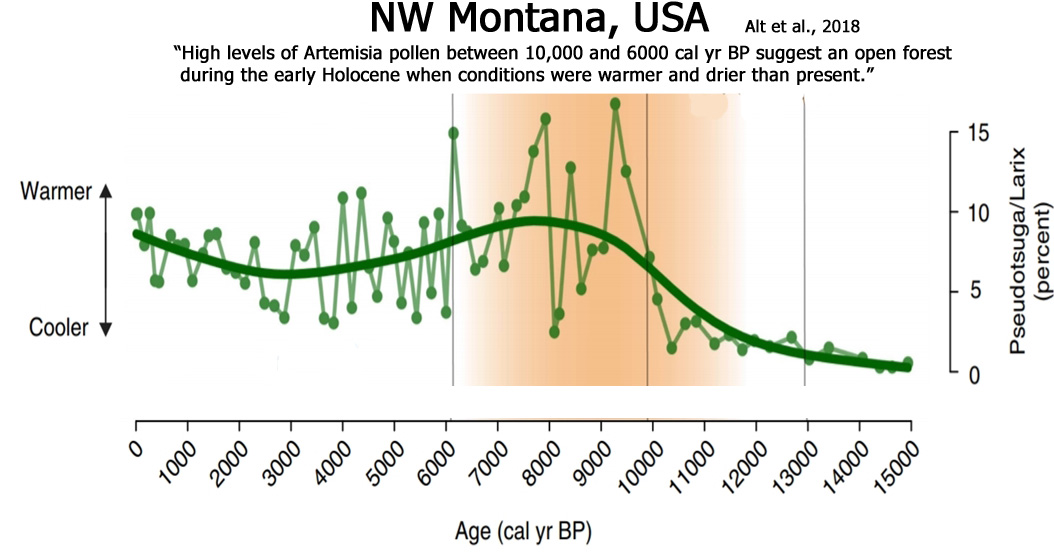
Alt et al., 2018
“High levels of Artemisia pollen between 10,000 and 6000 cal yr BP suggest an open forest during the early Holocene when conditions were warmer and drier than present.”
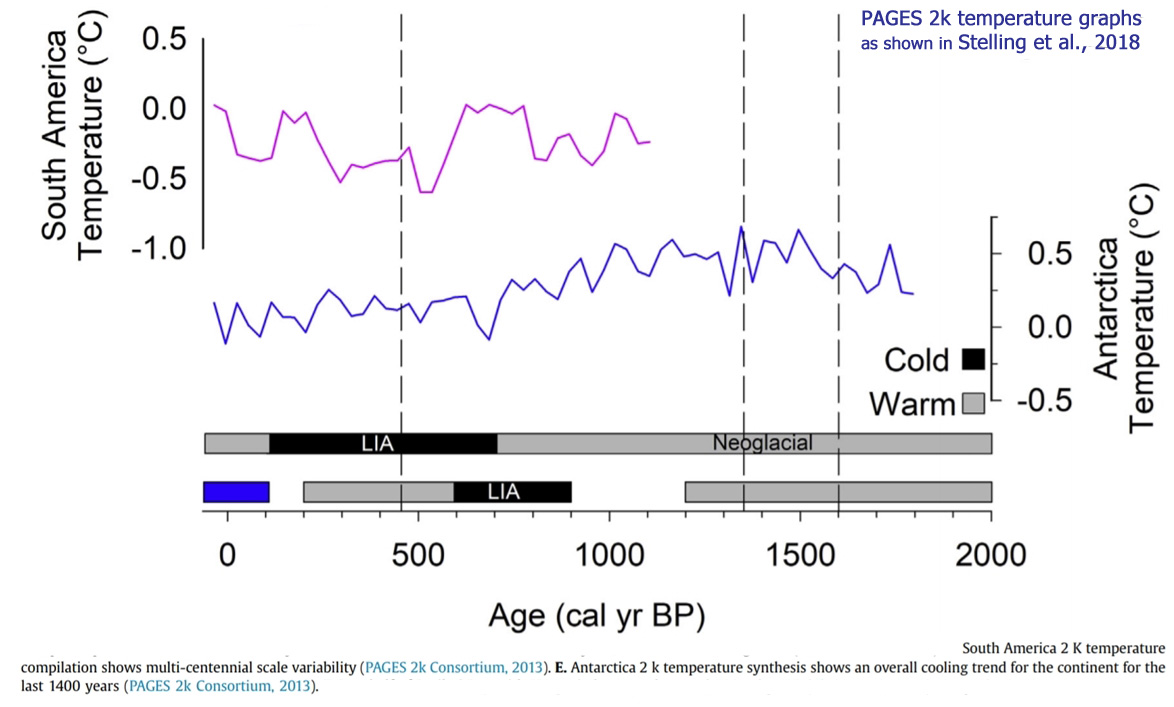
Stelling et al., 2018
Belle et al., 2018
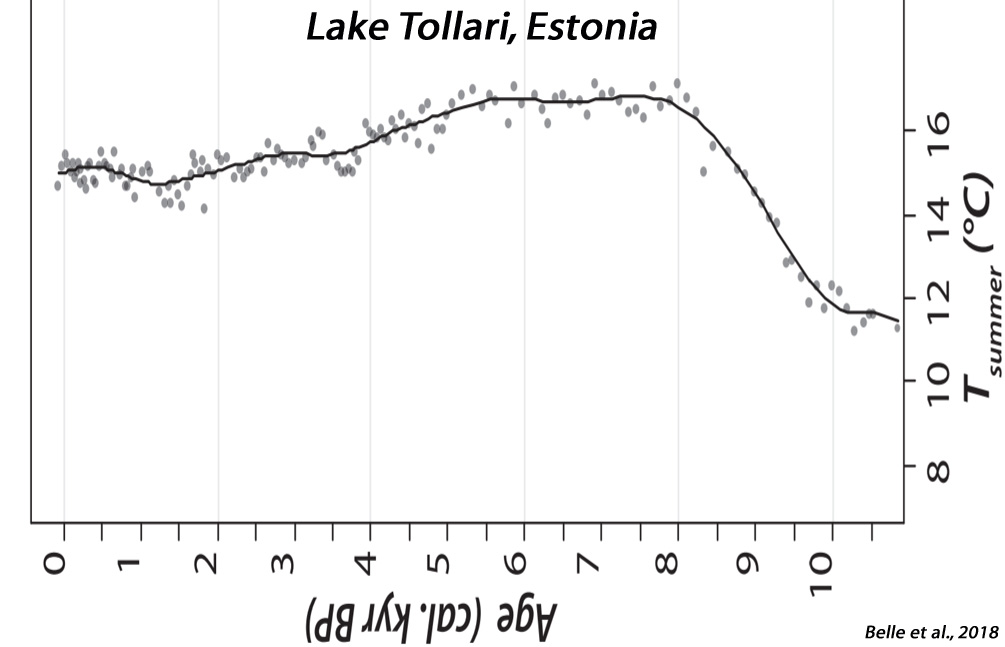
“Comparable patterns of air temperature changes for the two studied areas have been reported for the Holocene (Figure 2, Heiri et al., 2015; Holmstrom, Ilvonen, Seppa, & Veski, 2015; Belle, Poska, et al., 2017). These patterns can be divided into three climatic periods: (1) from c. 11.7 to 8.2 kyr cal. BP (Early Holocene) when the Holocene coolest temperatures were observed, followed by a rapid warming, (2) maximal and stable temperatures during the Holocene thermal maximum (from c. 8.2 to 4.2 kyr cal. BP) and (3) since c. 4.2 kyr cal. BP (Late Holocene) when a slight gradual cooling was observed.”
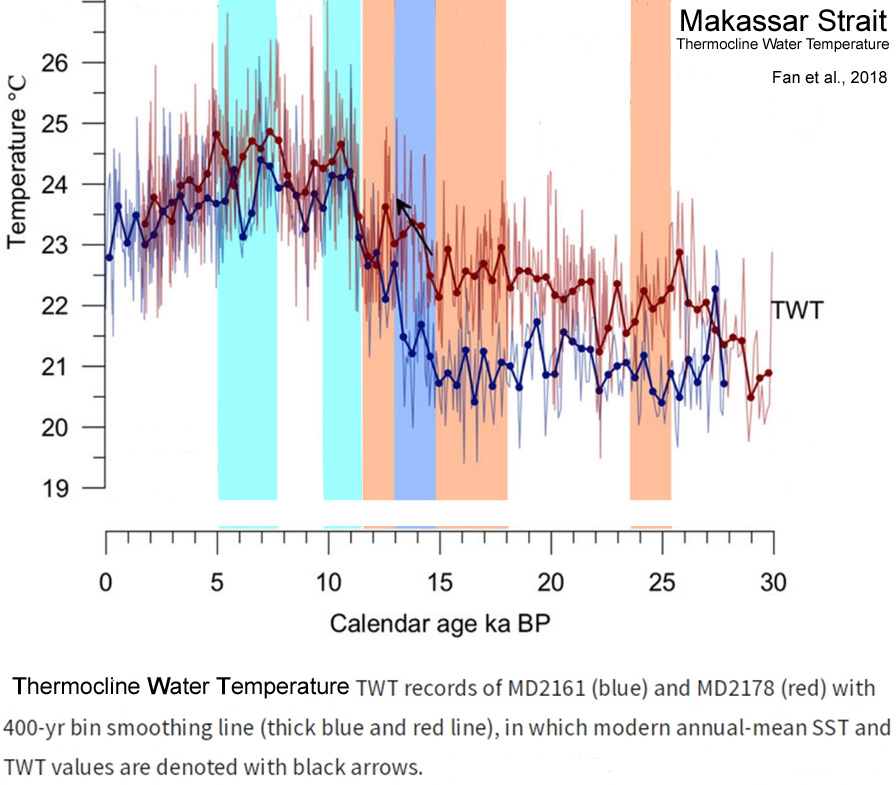
Fan et al., 2018
“The thermocline water temperature variabilities of the two sites, in particular the highest peaks at ~7 ka BP, are different from the records of the open western Pacific. Reoccurrence of the South China Sea Throughflow and thus a decreased surface throughflow along the Makassar Strait perhaps led to a warmer peak of thermocline temperature at ~7 ka BP than at ~11 ka BP.”
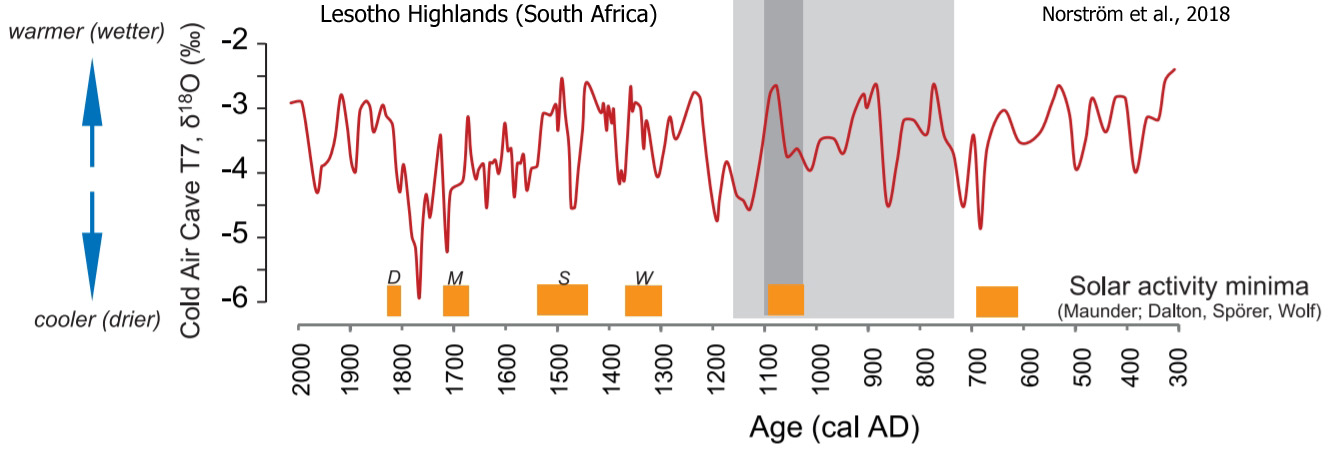
Norström et al., 2018
“The first part of the multi-proxy record (AD 400–800) shows stable terrestrial conditions and low detrital input, followed by higher variability in almost all proxies between ca. AD 900 and 1200. The δ13 C record infers a higher proportion of C4 vegetation, tentatively associated with higher temperatures during this phase, coeval with the Medieval Climate Anomaly (MCA). … Although age-model constraints impedes a robust regional comparison, the inferred climate variability is discussed as a tentative response to enhanced mid-latitude cyclonic activity during LIA, and the variable MCA climate conditions as indirectly dictated by changes in solar activity.”
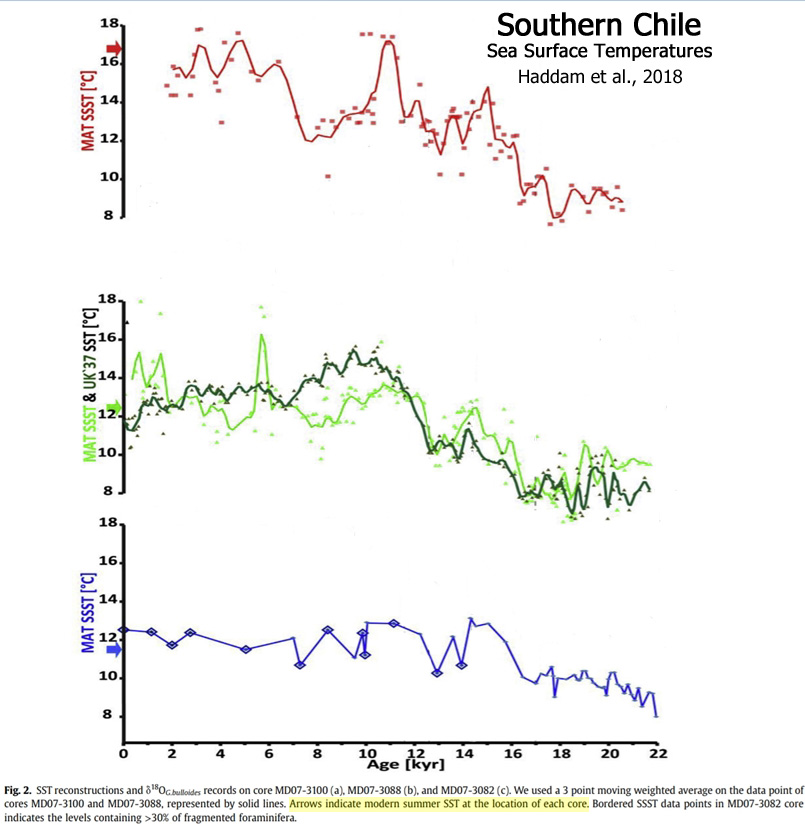
Haddam et al., 2018
“The MD07-3100 SSST [summer sea surface temperature] reconstruction displays values ranging from 8° to 17°C over the last 21 kyr. Lowest temperatures are recorded at 18 kyr just before the onset of the deglaciation, while the warmest ones are recorded at 15 kyr (15-17°C), from 11 to 10 kyr and from 4.7 to 3 kyr. After 6.5 kyr, SSSTs stay mostly 15°C and are marked by two short-term warming events up to ~18°C, at 4.7 and 3.1 kyr respectively until reaching the present-day summer temperature values at the core location. … Core MD07-3088 displays SSST values ranging from 7 to 18°C over the last 21.4 kyr. The lowest values are observed from 18.3 to 16.5 kyr, while the highest are recorded during the middle to late Holocene (at 5.7, 1.5 and 0.7 kyr respectively). The Early Holocene, from 11.5 kyr to 10 kyr, is characterized by SSST values at around 13°C followed by a progressive 1.5°C decreasing trend until 7.7 kyr. Then a sharp SSST increase culminated at 5.8 kyr (~16°C) before decreasing again at 4.5 kyr. … The UK 37 SST reconstructions for core MD07-3088 show similar trends compared to MAT-SSST displaying the lowest and highly variable temperatures between 21 and 18 kyr. [A] sharp SST increase (~5°C) marks the Early Holocene (~10.4 kyr). Between 10.4 and 6.5 kyr, SST decreased again, followed by a plateau until 3 kyr with mean values of 13°C. Finally, after an abrupt SST rise (~2°C) centered at 1.5 kyr, UK 37 SST decrease until present-day. … The MAT SSST reconstruction of core MD07-3082 shows values ranging from 9°C to 13°C over the last 22 kyr. The lowest temperatures are recorded between 22 and 20.5 kyr, whereas a progressive SSST increase representing the last deglaciation culminates at 14.3 kyr. A two-step SSST lowering of about 3°C is recorded between 14.3 and 12.9 kyr and attributed to the ACR before reaching stable values at 12°C during the Holocene.”
Blarquez et al., 2018
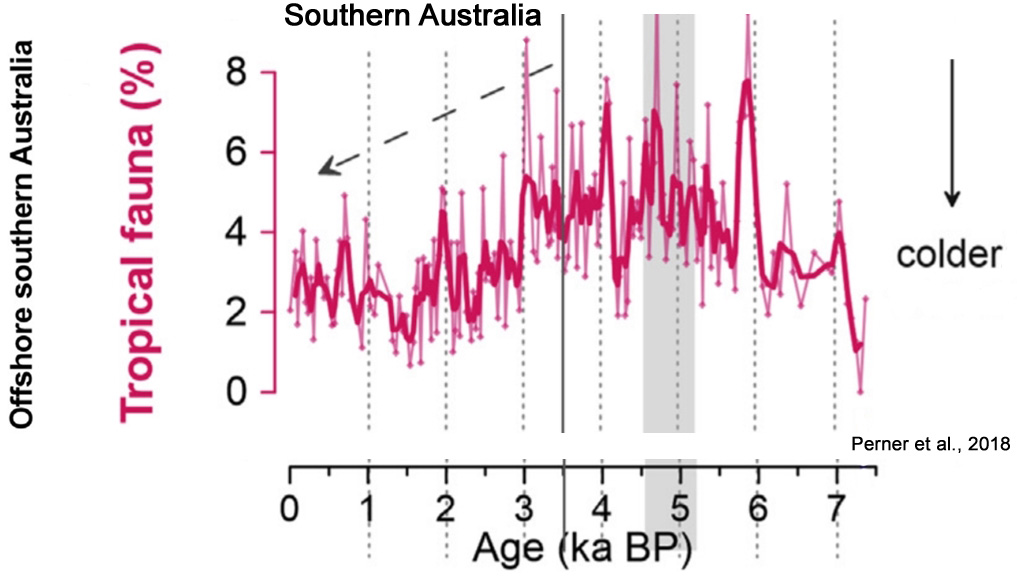
Perner et al., 2018
“[W]e find evidence of distinct late Holocene millennial-scale phases of enhanced El Niño/La Niña development, which appear synchronous with northern hemispheric climatic variability. … Phases of dominant El Niño-like states occur parallel to North Atlantic cold phases: the ‘2800 years BP cooling event’, the ‘Dark Ages’ and the ‘Little Ice Age’, whereas the ‘Roman Warm Period’ and the ‘Medieval Climate Anomaly’ parallel periods of a predominant La Niña-like state.”
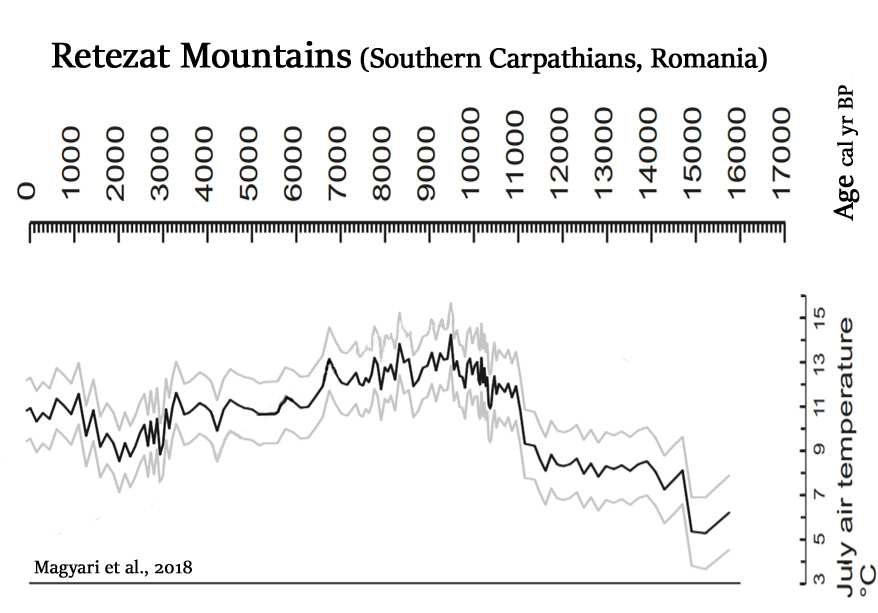
Magyari et al., 2018
“…its climatic tolerance limits were used to infer July mean temperatures exceeding modern values by 2.8°C at this time [8200-6700 cal yr BP] (Magyari et al., 2012).”
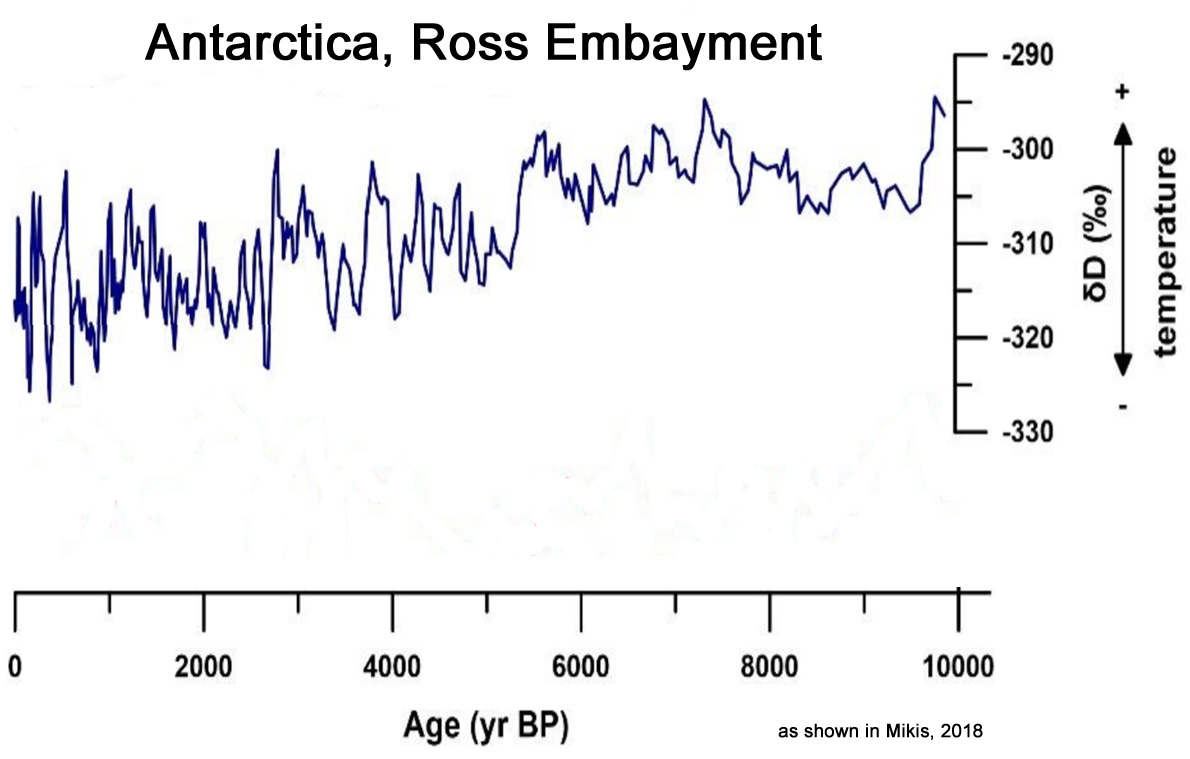
Mikis, 2018
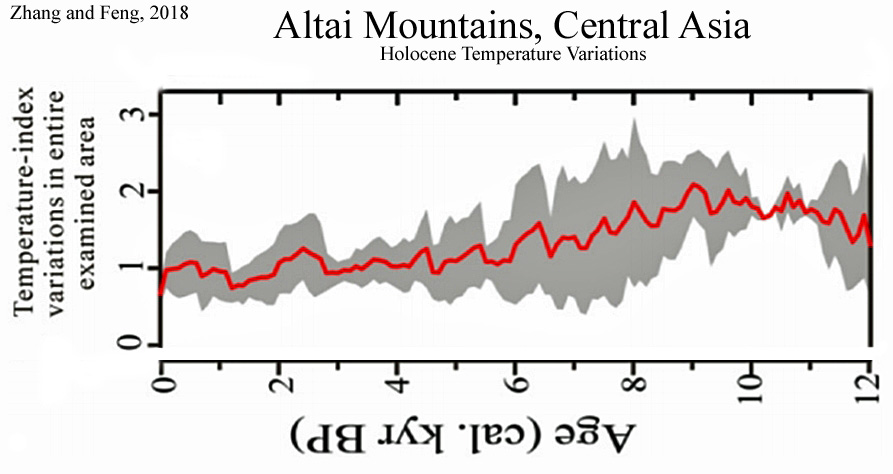
Zhang and Feng, 2018
Kelley et al., 2018
“Historical and remote-sensing records indicate that Nordenskiöld Gletscher has been stable or advancing since AD 1950 (Weidick, 1968, 1994).”
“[A] drop in temperature is documented in both reconstructions at around 2.9 ka cal BP in the Early Iron Age. After a warmer period around 2.8-1.5 ka cal BP, a new cooling trend appears from the Late Middle Age to Modern times in a phase of higher human impact“
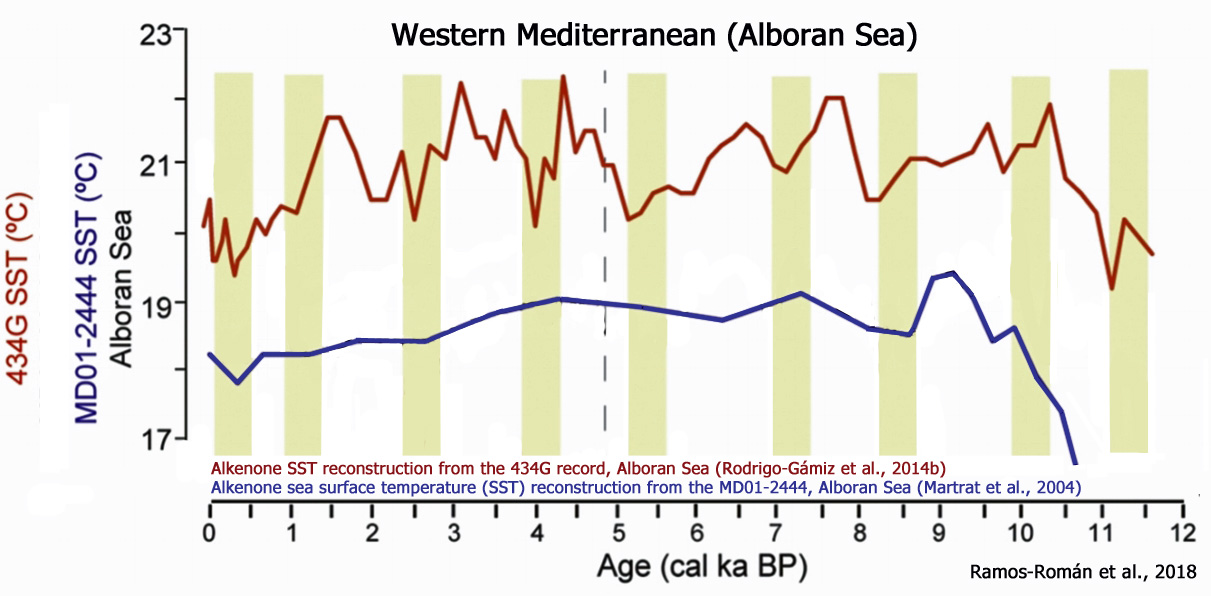
Ramos-Román et al., 2018
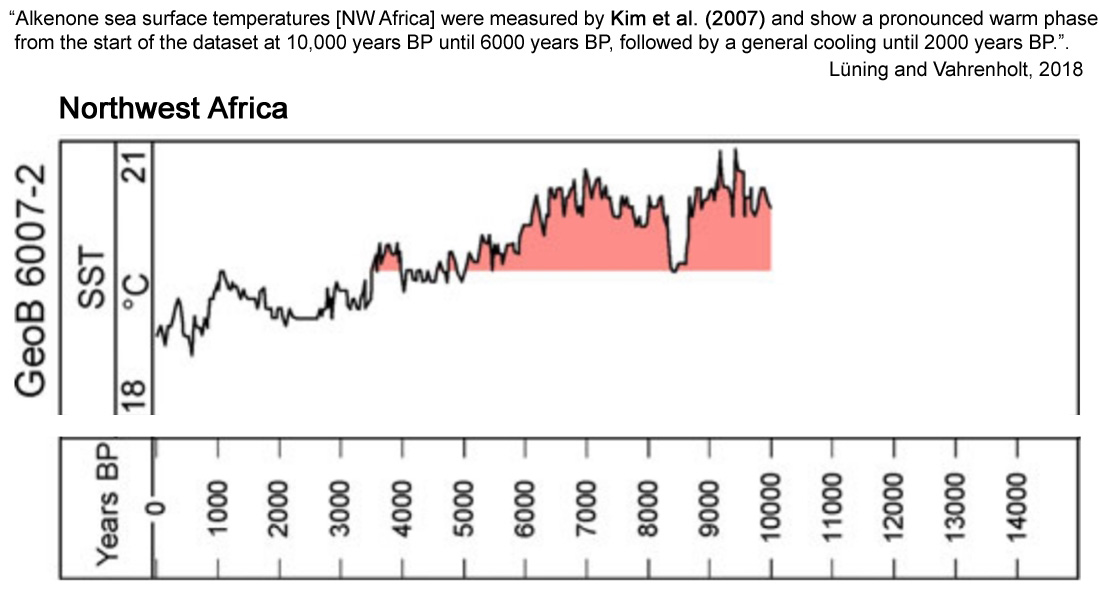
Lüning and Vahrenholt, 2018
“The early Holocene ‘Green Sahara’ forms part of a long series of wet periods that have occurred over the past hundred thousand to million years in North Africa and Arabia. Notably, climate models are still unable to match the observed hydroclimatic changes in a quantitative way. Simulated rainfall during the African Humid Period over the Sahara is not sufficient to sustain vegetation at a level seen in the palaeo record, indicating that processes such as vegetation and dust feedbacks still need to be refined. Sea surface temperatures in North Africa and Arabia during the early Holocene were generally one to several degrees C warmer than during the late Holocene. Warming began around 12,000 years BP and ended around 5000 years BP. The warm period generally coincided with the early Holocene wet phase in the region and is linked to the Holocene Thermal Maximum, an early Holocene period during which temperatures were globally elevated. The review suggests that the Holocene climate history of North Africa and Arabia is closely linked to the global development and that significant temperature changes have also occurred in subtropical climate belts.”
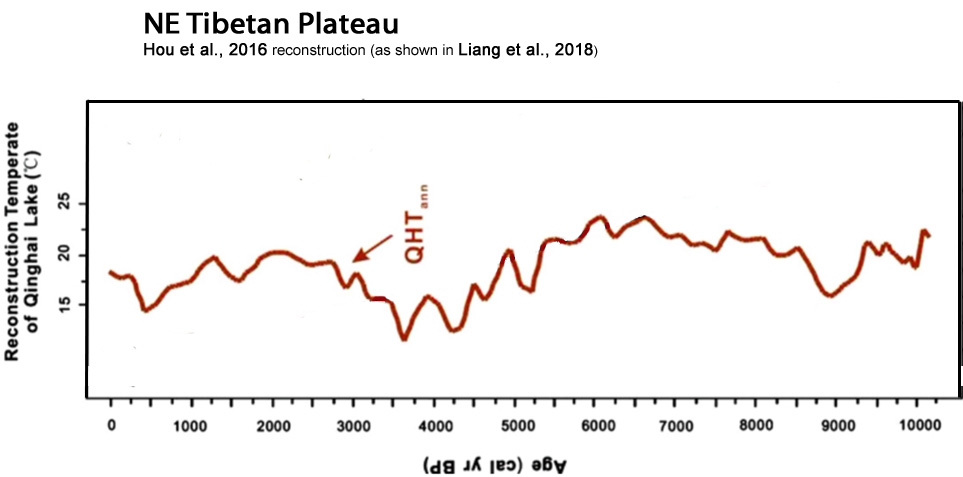
Liang et al., 2018
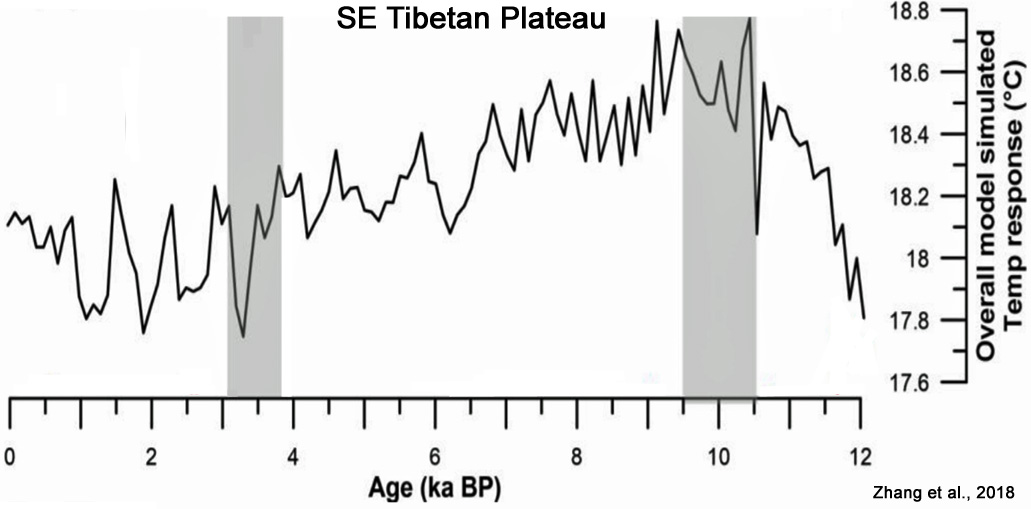
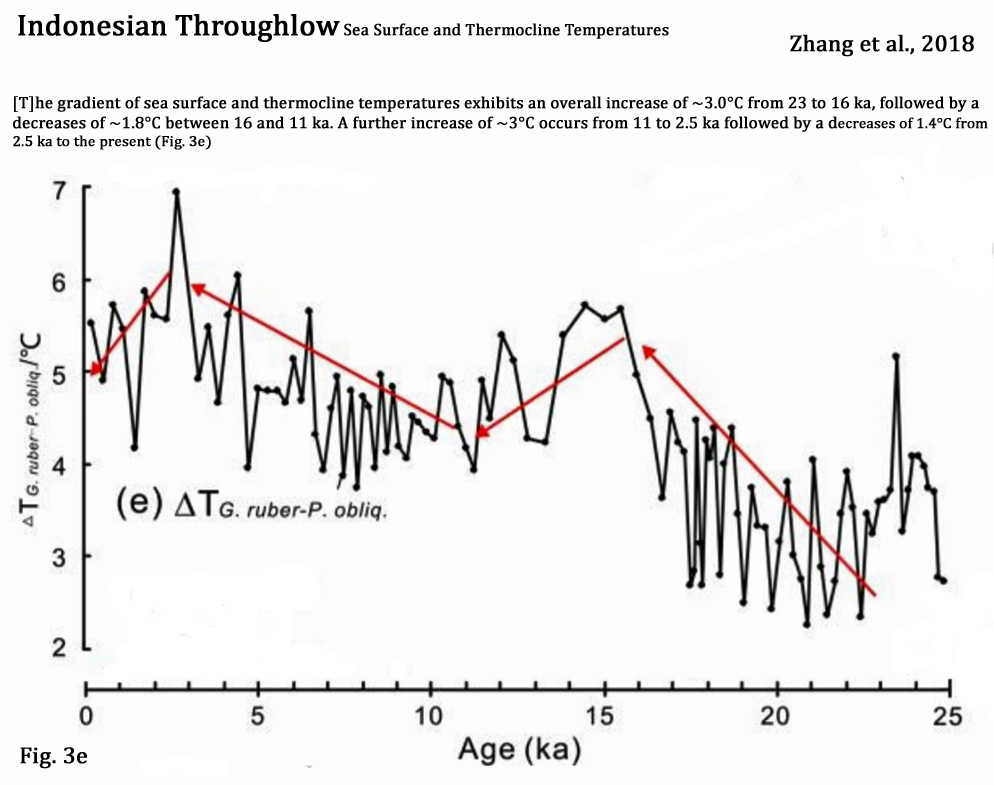
Zhang et al., 2018
“[T]he gradient of sea surface and thermocline temperatures exhibits an overall increase of ~3.0°C from 23 to 16 ka, followed by a decreases of ~1.8°C between 16 and 11 ka. A further increase of ~3°C occurs from 11 to 2.5 ka followed by a decrease of 1.4°C from 2.5 ka to the present (Fig. 3e).”
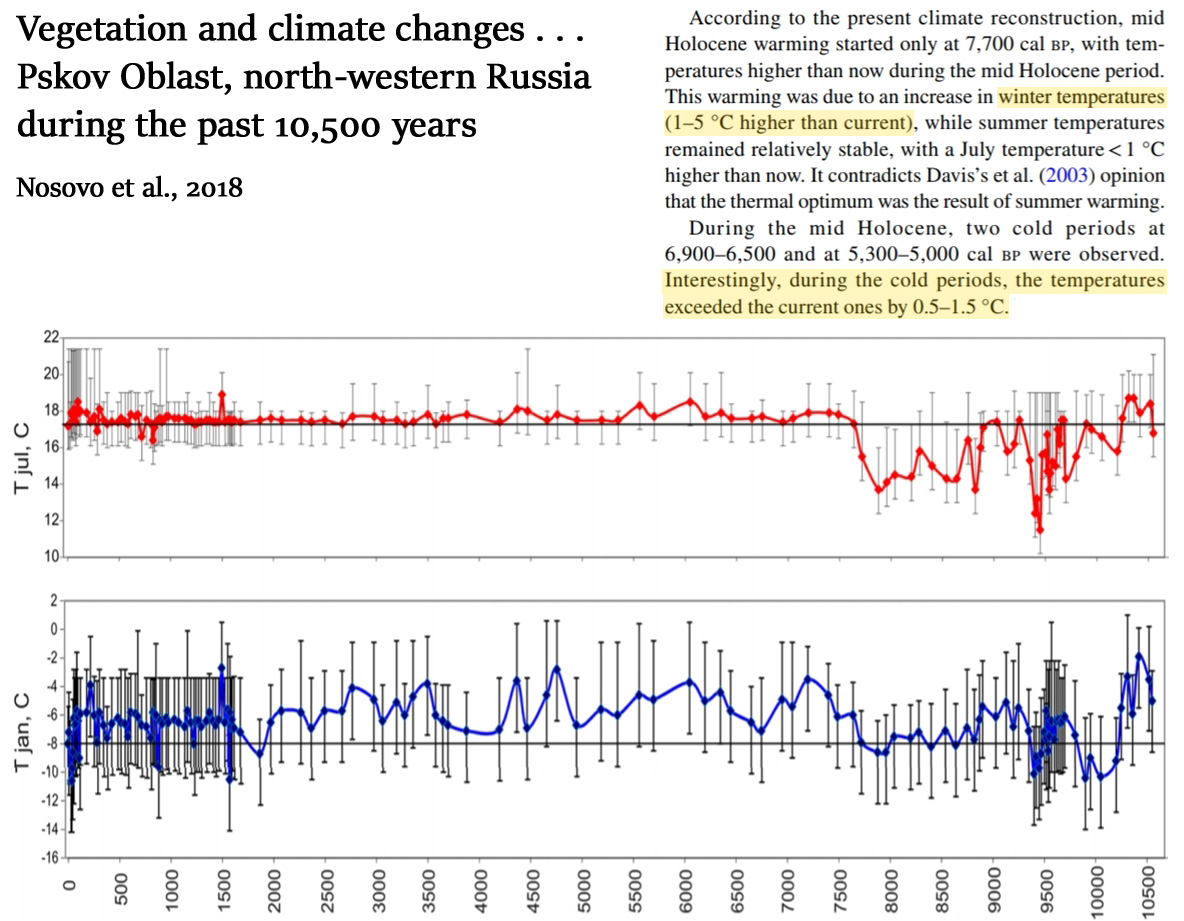
Nosova et al., 2018
“According to the present climate reconstruction, mid Holocene warming started only at 7,700 cal bp, with temperatures higher than now during the mid Holocene period. This warming was due to an increase in winter temperatures (1–5 °С higher than current), while summer temperatures remained relatively stable, with a July temperature<1 °С higher than now. … During the mid Holocene, two cold periods at 6,900–6,500 and at 5,300–5,000 cal bp were observed. Interestingly, during the cold periods, the temperatures exceeded the current ones by 0.5–1.5 °С. … The transition from the mid Holocene thermal maximum to the following period occurred without considerable climatic changes. The mean annual temperatures remained much higher than the current ones by 0.5–2.5 °С until 2,500 cal bp. Local maximum temperatures were observed at 4,800, 4,300, 3,500 and 2,900–2,700 cal bp. The present climatic reconstruction demonstrates a gradual cooling down to current levels at ca. 2,500 cal bp, and then followed by a new warming phase with up to 1–2 °С increase at approximately 1,500 cal bp.”
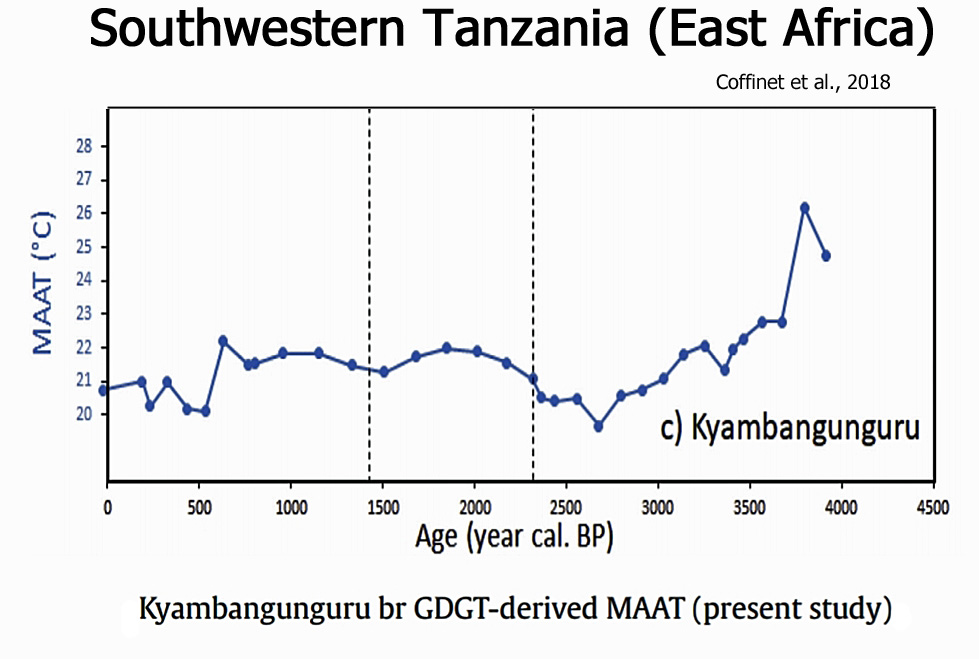
Coffinet et al., 2018
“This study represents the first detailed late Holocene quantitative air temperature reconstruction from the RVP [Rungwe Volcanic Province, southwestern Tanzania/East Africa] region. We identified a succession of cold/warm/cold events, largely in phase with the other regional East African climate records and with the cold periods identified worldwide by Wanner et al. (2011). This further supports that global scale processes may be the main drivers of the Holocene climatic variability. Moreover, warm conditions during the MCA followed by abrupt cooling during the LIA were observed at Kyambangunguru and elsewhere in East Africa suggesting that these two recent events occurred globally.”
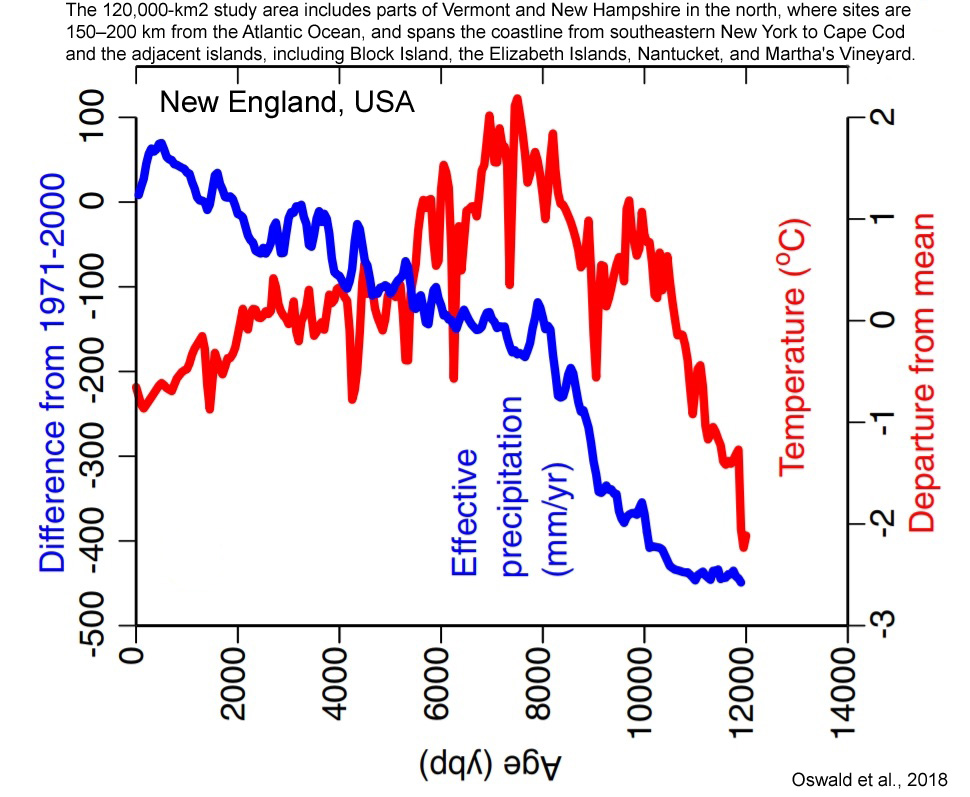
Oswald et al., 2018
Troncoso Castro et al., 2018
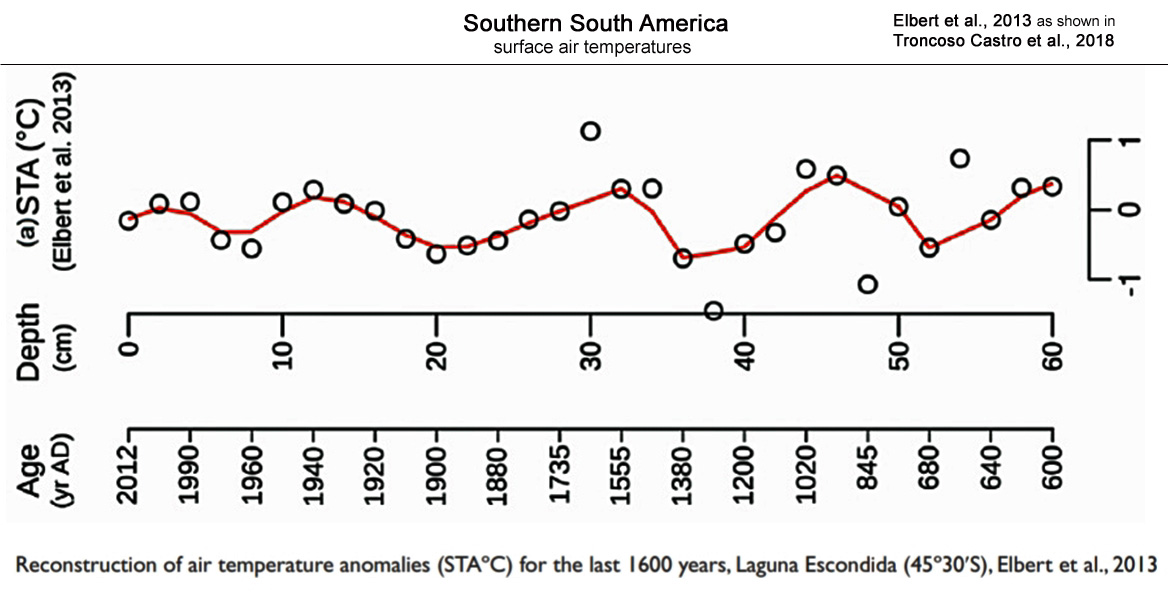
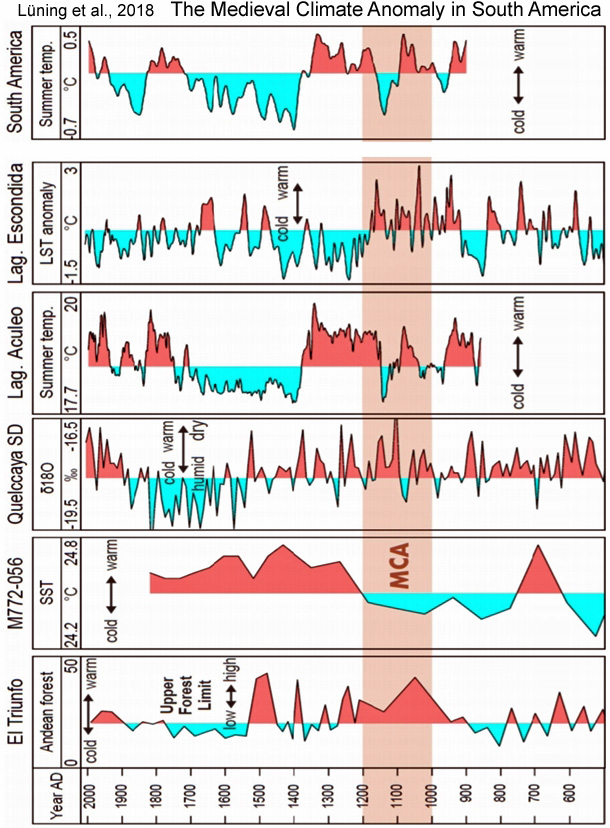
Lüning et al., 2018
“MCA [Medieval Climate Anomaly] warming in South America and the NH appears to have occurred largely synchronous, probably reaching comparable intensities. Future studies will have to address major MCA data gaps that still exist outside the Andes in the central and eastern parts of the continent. The most likely key drivers for the medieval climate change are multi-centennial Pacific and Atlantic ocean cycles, probably linked to solar forcing.”
Tarasov et al., 2018
“In the Korovinskoe record (Fig. 10A) the first increase in temperate deciduous tree/shrub percentages is dated to ca. 10,400 cal BP followed by a second, more pronounced increase (up to 21%) between ca. 10,100 and 9800 cal BP. The latter rise corresponds to maximum summer SSTs (i.e. 6-7°C above the mean modern SST value) reconstructed in the NE North Atlantic (Fig. 10E) and the NW Barents Sea (Fig. 10F). … A pollen-based reconstruction of the summer temperature anomaly at Lake Kurjanovas (Fig. 1) in Latvia suggests that the warmest interval in the area located ca. 270 km west of Korovinskoe occurred ca. 8100-5600 cal BP (Fig. 10C; Heikkila and Seppa, 2010). … Mangerud and Svendsen (2018) reported appearance of the most warmth-demanding mollusk species ca. 1000 km farther north of its current distribution indicating that August temperatures on Svalbard were 6°C warmer at around 10,200-9200 cal BP and that the regional climate was as warm as present by ca. 11,000 cal BP.”
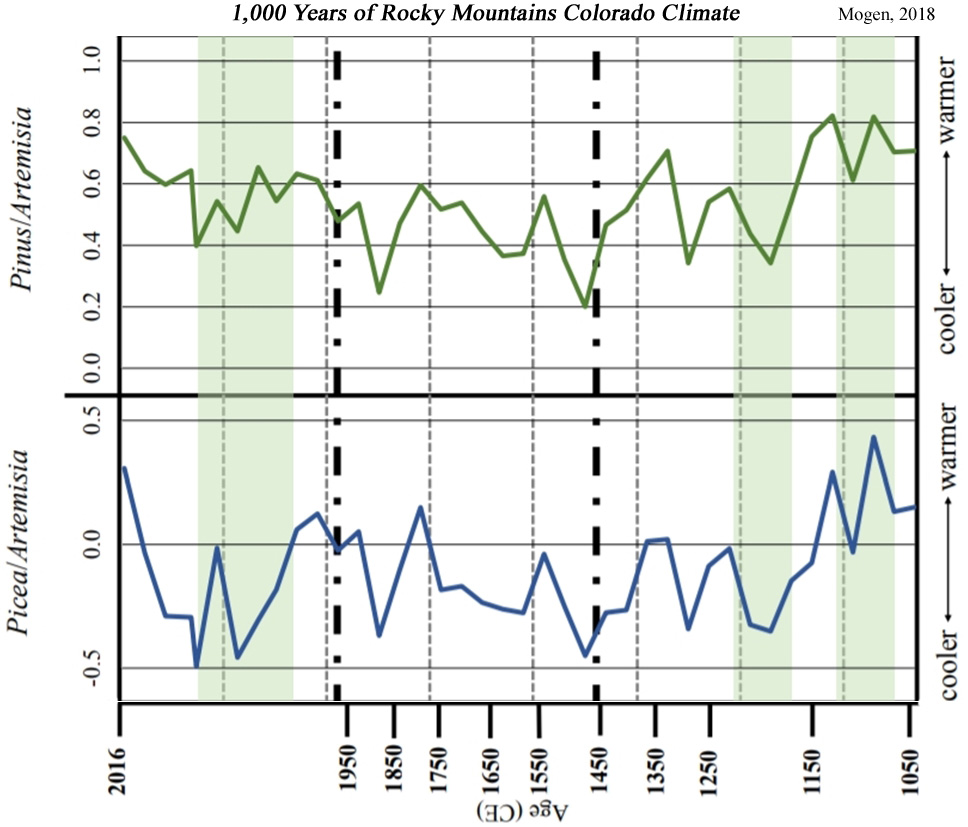
Mogen, 2018
“Around 9 ka [9,000 years ago] average summer temperatures are estimated to have been over 2°C warmer than present, and between 10.4-6.6 ka treeline was about 80 m higher than present in the San Juan Mountains [Colorado, Rockies] (Elias et al., 1991; Carrara, 2011).”
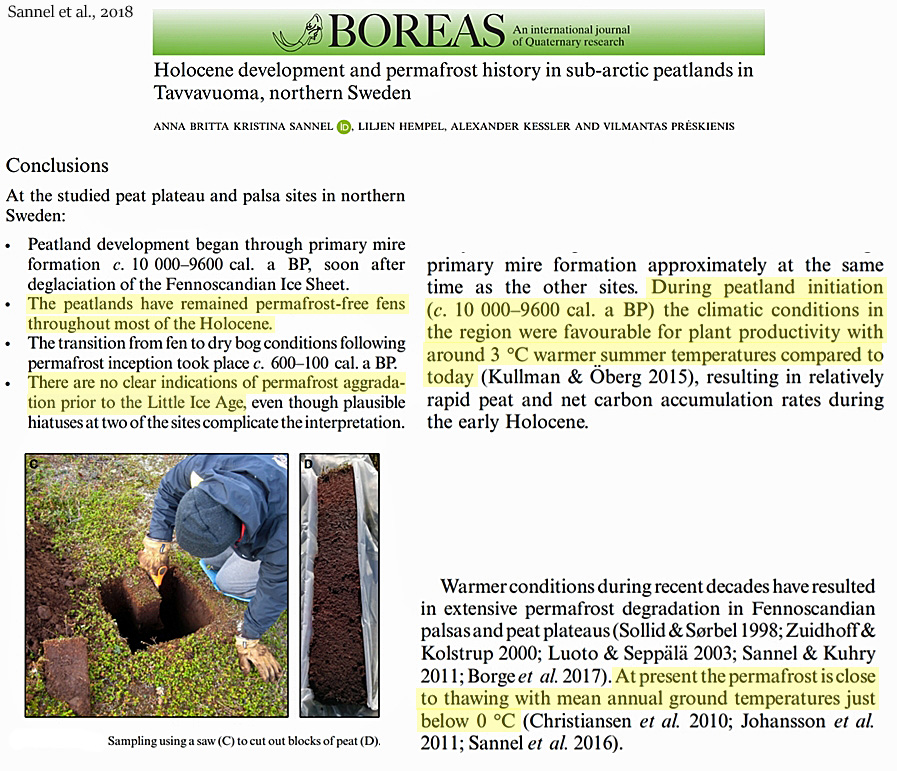
Sannel et al., 2018 (Subarctic Northern Sweden)
“At all these sites the datings together with the results of the plant macrofossil analyses suggest that permafrost aggradation took place around 600–100 cal. a BP [the Little Ice Age]. … [A]t these sites there are no indications of permafrost inception prior to the Little Ice Age. … Warmer conditions during recent decades have resulted in extensive permafrost degradation in Fennoscandian palsas and peat plateaus (Sollid& Sørbel 1998; Zuidhoff& Kolstrup 2000; Luoto & Seppala 2003; Sannel & Kuhry 2011; Borge et al. 2017). At present the permafrost is close to thawing with mean annual ground temperatures just below 0 °C (Christiansen et al. 2010; Johansson et al. 2011; Sannel et al. 2016). … Throughout most of the Holocene, these northern peatlands have not experienced climatic conditions cold enough for permafrost to form. … During peatland initiation (c. 10 000–9600 cal. a BP) the climatic conditions in the region were favourable for plant productivity with around 3 °C warmer summer temperatures compared to today (Kullman & Oberg 2015), resulting in relatively rapid peat and net carbon accumulation rates during the early Holocene.” [Subarctic Northern Sweden has yet to fully recover from the Little Ice Age cooling, as permafrost still exists in regions where there was no recorded permafrost during nearly all of the last 10,000 years.]
Papadomanolaki et al., 2018 (Baltic Sea)
“A large fraction of the Baltic Proper became hypoxic again between 1.4 and 0.7 ka BP, during the Medieval Climate Anomaly (MCA), when mean air temperatures were 0.9–1.4 °C higher than temperatures recorded in the period 1961–1990 (e.g. Mann et al., 2009; Jilbert and Slomp, 2013).”
Leonard et al., 2018 (Great Barrier Reef, Australia)
“Coral derived sea surface temperature (SST-Sr/Ca) reconstructions demonstrate conditions ∼1 ◦C warmer than present at ∼6200 (recalibrated 14C) and 4700 yr BP, with a suggested increase in salinity range (δ18O) associated with amplified seasonal flood events, suggestive of La Niña (Gagan et al., 1998; Roche et al., 2014).”
Suvorov and Kitov, 2018 (Eastern Sayan, Siberia)
“The authors examined the variability of activity of modern glaciation and variation of natural conditions of the periglacial zone on climate and on dendrochronological data. Results of larch and Siberian stone pine growth data were revealed at the higher border of forest communities. … It is believed that the temperature could be 3.5 °C warmer at the Holocene optimum than at the present time (Vaganov and Shiyatov 2005). … Since 2000, there has been growth of trees instability associated with a decrease in average monthly summer temperatures. … Since the beginning of 2000, decrease in summer temperatures was marked.”
Lozhkin et al., 2018 (East Siberia)
“The postglacial occurrence of relatively warm/dry and warm/wet intervals is consistent with results of a regional climate‐model simulation that indicates warmer than present temperatures and decreased effective moisture at 11 000 cal. a BP and persistence of warm conditions but with greater moisture and longer growing season at 6000 cal. a BP.”
Xu et al., 2018 (Northern South China Sea)
“This study provides evidence that thermal coral bleaching events have occurred in the warmer mid-Holocene (where maximum monthly summer SST was 2 °C higher than at present) in Hainan island. … [C]oral bleaching events under high SST conditions have already occurred in the mid-Holocene and are by no means a new ecological phenomenon of current global warming.”
Leopold et al., 2018 (Arctic Svalbard)
“[T]he summer SSTs today around Svalbard are some 5–8 °C lower than during the thermal peak of the early Holocene”
Clarke et al., 2018 (Fennoscandia)
“Early Holocene climate in northern Fennoscandia was affected by summerinsolation that was higher than present (Berger 1978; Berger&Loutre 1991). … [P]ollen-based summer temperature reconstructions indicate July temperatures of +1.5 +/- 0.5 °C above modern (1961–1990) values in northern Fennoscandia during the regional HTM identified at c. 8000–6000 cal. a BP (Møller & Holmeslet 2002; Jensen & Vorren 2008; Seppa et al. 2009; Sejrup et al. 2016).”
Voldstad, 2018 (Arctic Svalbard)
“The early record of thermophilous species not commonly distributed around Svalbard today is in line with the description of a first Holocene warm period in Svalbard with climate about 6°C warmer than present between 10 and 9,2 cal. ka BP (Mangerud & Svendsen 2018).”
Kullman, 2018 (Scandes, Northern Sweden)
“The present paper reports results from an extensive project aiming at improved understanding of postglacial subalpine/alpine vegetation, treeline, glacier and climate history in the Scandes of northern Sweden. The main methodology is analyses of mega fossil tree remnants, i.e. trunks, roots and cones, recently exposed at the fringe of receding glaciers and snow/ice patches. This approach has a spatial resolution and accuracy, which exceeds any other option for tree cover reconstruction in high-altitude mountain landscapes. … All recovered tree specimens originate from exceptionally high elevations, about 600-700 m atop of modern treeline positions. … Conservatively drawing on the latter figure and a summer temperature lapse rate of 0.6 °C per 100 m elevation (Laaksonen 1976), could a priori mean that, summer temperatures were at least 4.2 °C warmer than present around 9500 year before present. However, glacio-isostatic land uplift by at least 100 m since that time (Möller 1987; Påsse & Anderson 2005) implies that this figure has to be reduced to 3.6 °C higher than present-day levels, i.e. first decades of the 21st century. Evidently, this was the warmth peak of the Holocene, hitherto. This inference concurs with paleoclimatic reconstructions from Europe and Greenland (Korhola et al. 2002; Bigler et al. 2003; Paus 2013; Luoto et al. 2014; Väliranta et al. 2015).”
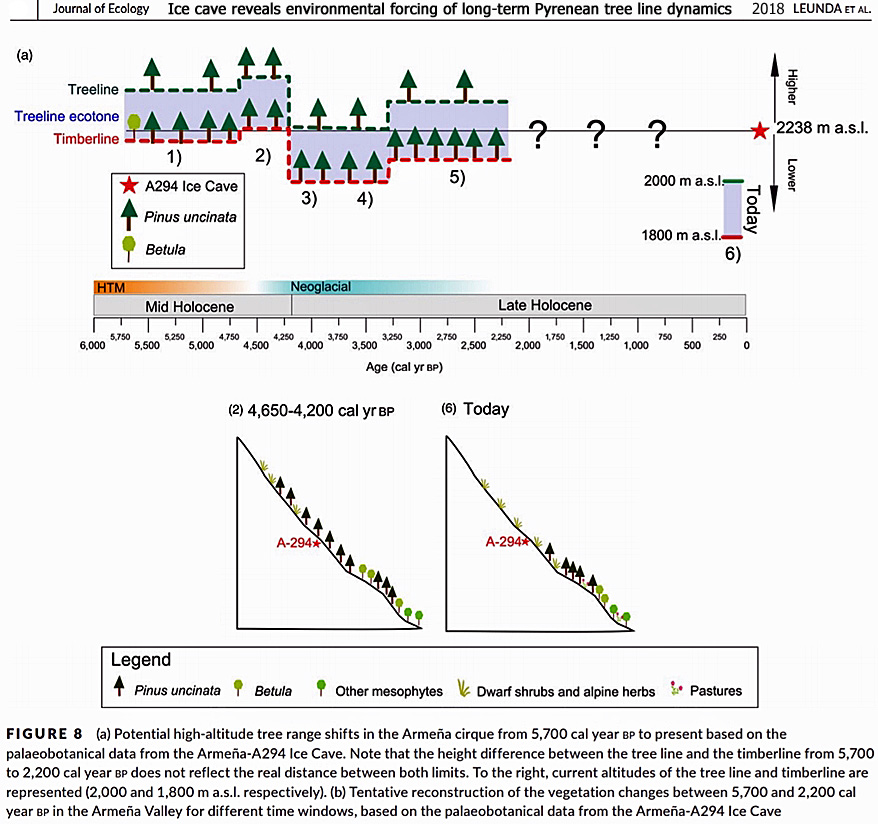
Leunda et al., 2018 (Spanish Pyrenees)
“The tree line ecotone was located at the cave altitude from 5,700 to 4,650 cal year bp, when vegetation consisted of open Pinus uncinata Ramond ex DC and Betula spp. Woodlands and timberline were very close to the site. Subsequently, tree line slightly raised and timberline reached the ice cave altitude, exceeding its today’s uppermost limit by c. 300–400 m during more than four centuries (4,650 and 4,200 cal year bp) at the end of the Holocene Thermal Maximum. After 4,200 cal year bp, alpine tundra communities dominated by Dryas octopetala L. expanded while tree line descended, most likely as a consequence of the Neoglacial cooling. Prehistoric livestock raising likely reinforced climate cooling impacts at 3,450– 3,250 cal year bp. Finally, a tree line ecotone developed around the cave that was on its turn replaced by alpine communities during the past 2,000 years.” [Assuming a temperature lapse rate of +0.517°C/100 m {Navarro-Serrano et al., 2018*}, a 300-400 m decline in today’s uppermost treeline limit would indicate that Pyrnees temperatures were about 1.81°C warmer than today during 4,650-4,200 cal year bp.]
*Navarro-Serrano et al., 2018 Estimation of near‐surface air temperature lapse rates over continental Spain and its mountain areas … “The median NSLR [near‐surface (i.e., non‐free atmosphere) air temperature lapse rates] … Pyrenees −5.17 °C/km“
Bartels et al., 2018 (North Atlantic Region)
“During summer, AW [Atlantic Water] rises up to waterdepths as shallow as ~55 m. … Summer surface temperatures [1955-2012] range between up to 3°C at the northern mouth and <-1.5 °C at the southern mouth of the Hinlopen Strait, while winter surface temperatures vary between 0.5 and <~1.5°C (averaged, 1955–2012; Locarnini et al. 2013). … Increased summer insolation probably amplified the surface melting of the glaciers resulting in enhanced meltwater production and in a very high accumulation of finegrained sediments within the fjord […]. In addition, during the mild early Holocene conditions, summer sea-surface temperatures probably reaching 8–10°C [5 – 9.5°C warmer than 1955-2012] (indicated by M. edulis findings as discussed in Hansen et al. 2011) may have contributed to reducing the number of glaciers that entered the fjord directly as tidewater glaciers and thus causing a diminished IRD input. … In lake sediments from northwestern Spitsbergen a temperature drop of ~6°C is recorded between c. 7.8 and c. 7 ka [-0.8°C per century], which has been connected to a stronger influence of Arctic Water and expanding sea ice (van der Bilt et al. 2018).”
Smith, 2018 (Greenland Ice Sheet)
“To project how much sea level will rise in response to ongoing climate warming, one of the things we need to know is how sensitive the rate of Greenland Ice Sheet melting is to rising temperatures. McFarlin et al. present results from a set of sediment cores from a small nonglacial lake in the highlands of northwest Greenland, which contain deposits from the Holocene and the Last Interglacial (LIG). They found midge assemblages indicating peak July temperatures that were 4.0° to 7.0°C warmer than modern temperatures during the early Holocene and at least 5.5° to 8.5°C warmer during the LIG. This perspective of extreme warming suggests that even larger changes than predicted for this region over the coming century may be in store.”
Pozachenuk, 2018 (Western Russia)
“Mass peat accumulation in the territory of Vyatka region began only in the first half of the Atlantic Holocene period. The maximum warming corresponds to the second half of at (climatic optimum Holocene), when the average temperatures of January and July exceeded modern 2-3˚C at this time in the region formed coniferous-broad-leaved forests of complex composition, with a slight presence of broad-leaved species (Qercus, Tilia, Ulmus) and Corulus. Siberian element of flora-fir on the territory of Vyatka region appeared only in the Subatlantic period of Holocene, most likely due to climatic conditions.”
Street-Perrot et al., 2018 (Estonia)
“Estimates of summer temperatures in Estonia based on rapidly responding proxies such as aquatic macrofossils (Valiranta et al., 2015) and chironomids (Heiri et al., 2014) suggest conditions 2 °C warmer than today during the early Holocene.”
Kolaczek et al., 2018 (Southeastern Poland)
“The reconstruction of the mean July temperature based on Chironomidae revealed the exceptionally high rate of warming during the period of ca. 11,490–11,460 cal. BP (at least 1 °C per decade) up to values > 2 °C than modern ones. … Between ca. 11,490 and 11,460 cal. BP, the strongest warming trend in the Early Holocene MJT was registered, that is from 15 to 20.7°C (0.19°C yr1, 1.9°C/decade). Then, ca. 11,450 cal. BP, the temperature decreased to 18.3°C and up to ca. 10,560 cal. BP MJT fluctuated between 17 and 19°C. The climate of the area [today] is classified as cold temperate with mean annual air temperature of 8.2°C and mean annual precipitation 620 mm. A mean temperature of the warmest month, i.e. July, is +18.2°C [today], whereas a mean temperature of the coldest month, i.e. January, is -3.6°C.”
Ruskeeniemi et al., 2018 (Greenland Ice Sheet)
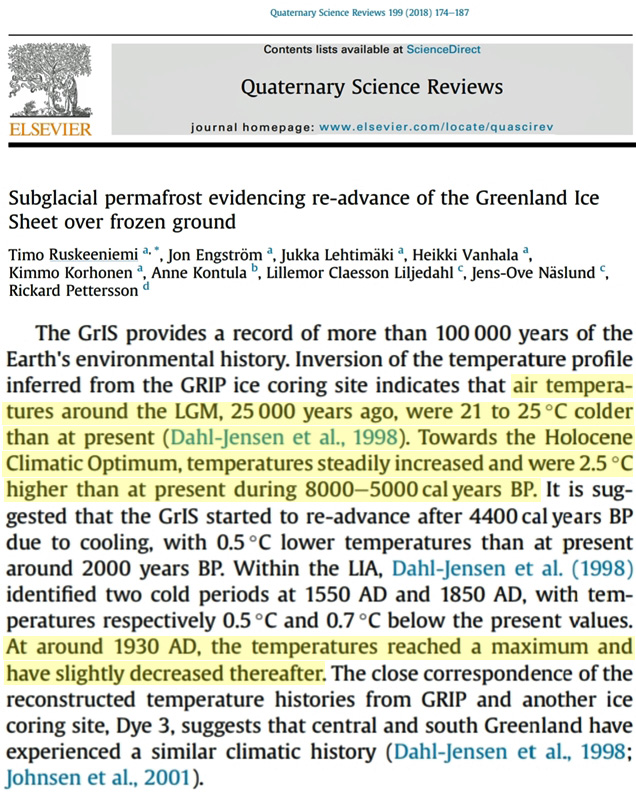
“Towards the Holocene Climatic Optimum, temperatures steadily increased and were 2.5°C higher than at present during 8000-5000 cal years BP. It is suggested that the GrIS started to re-advance after 4400 cal years BP due to cooling, with 0.5°C lower temperatures than at present around 2000 years BP. Within the LIA, Dahl-Jensen et al. (1998) identified two cold periods at 1550 AD and 1850 AD, with temperatures respectively 0.5°C and 0.7°C below the present values. At around 1930 AD, the temperatures reached a maximum and have slightly decreased thereafter.”
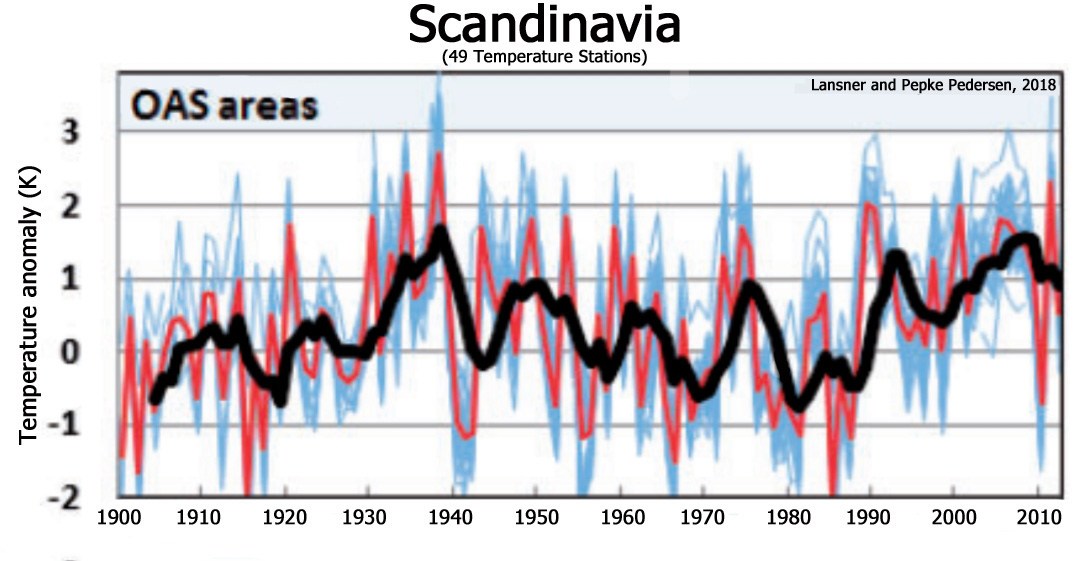
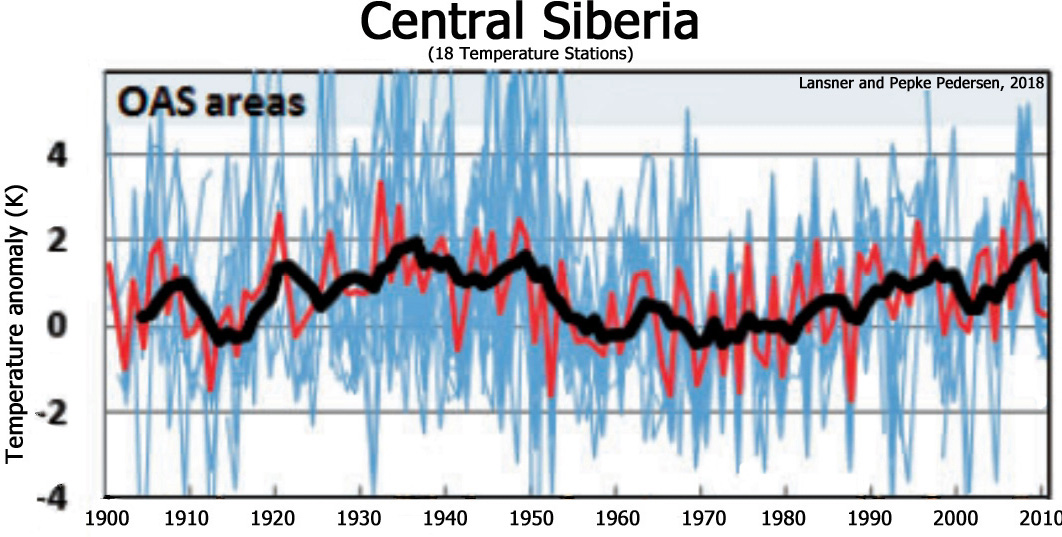
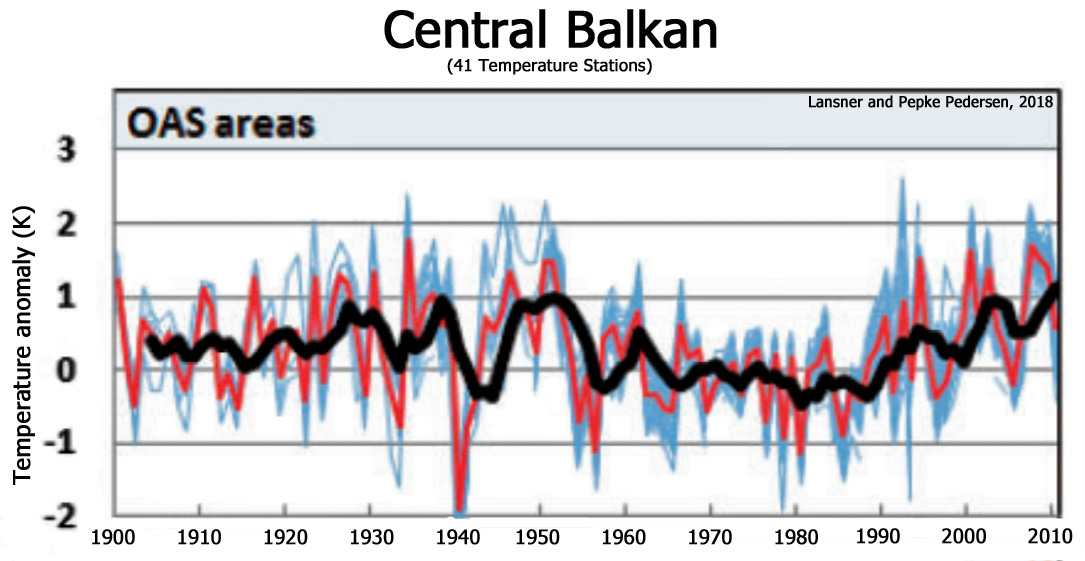
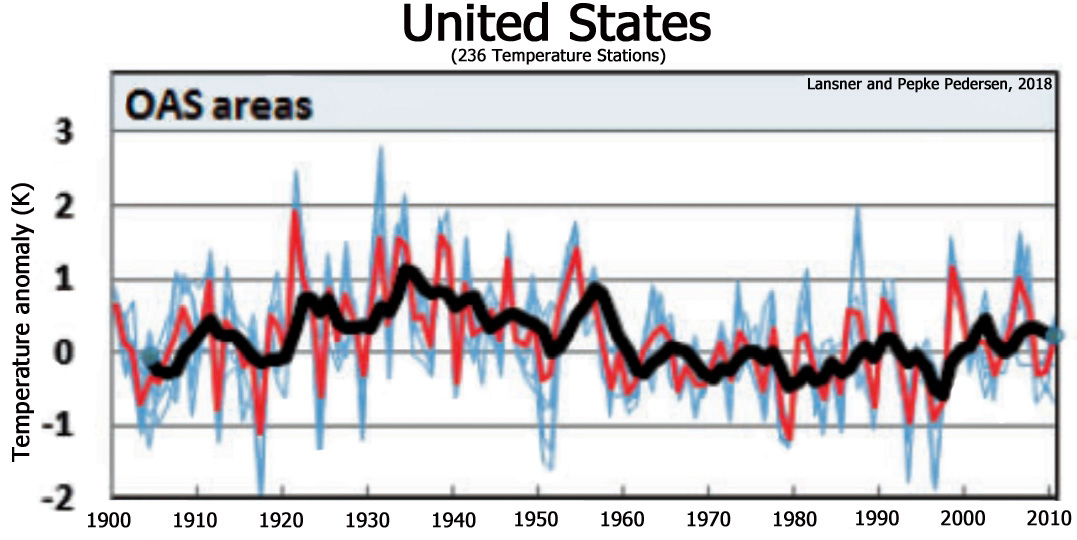
20th/21st Centuries Non-Warming
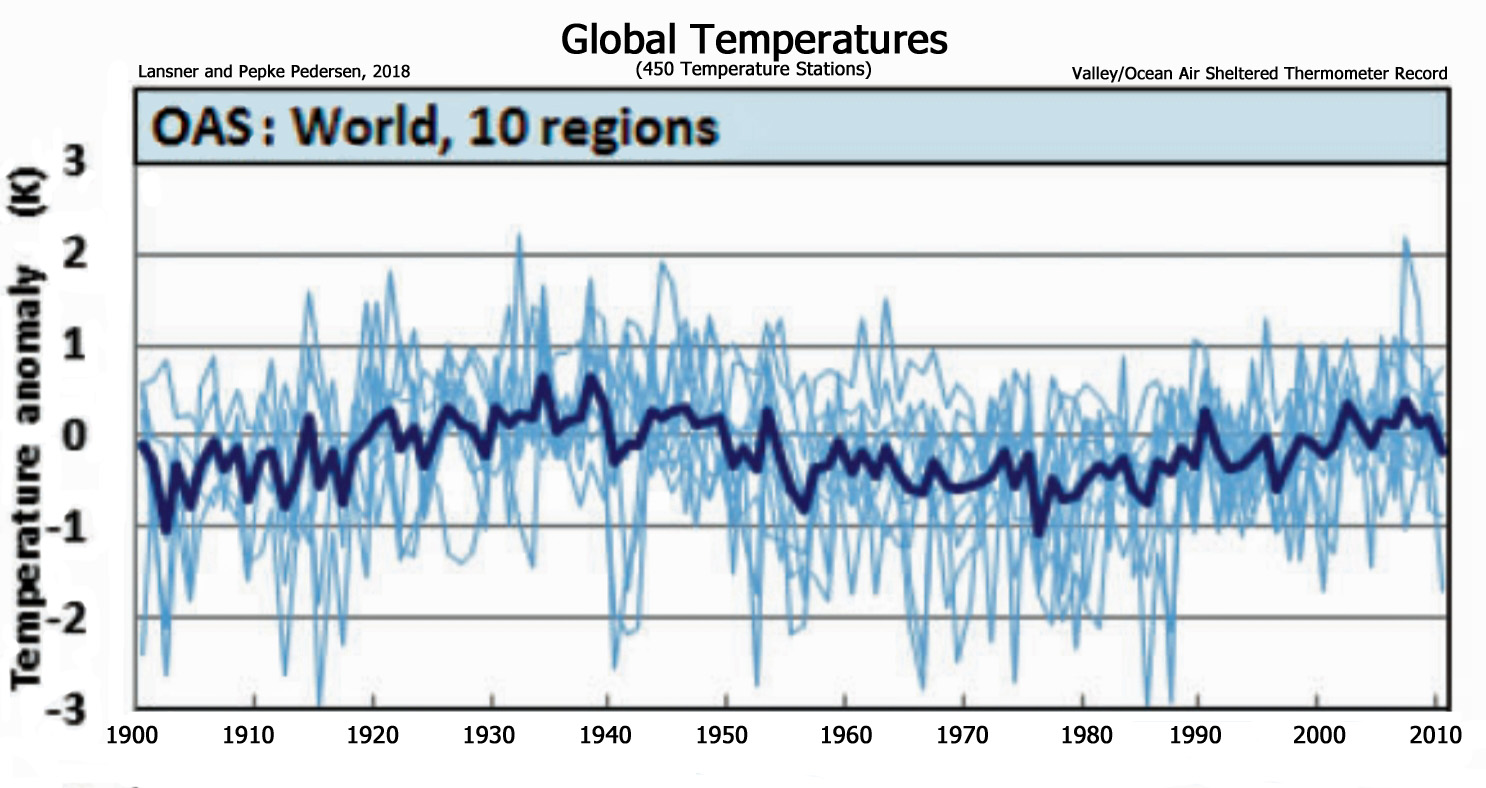
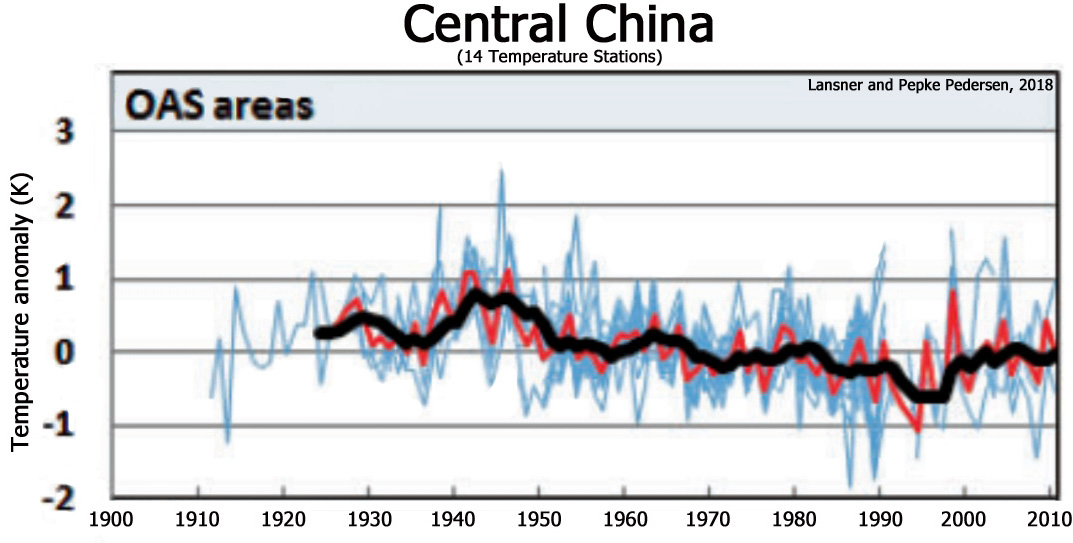
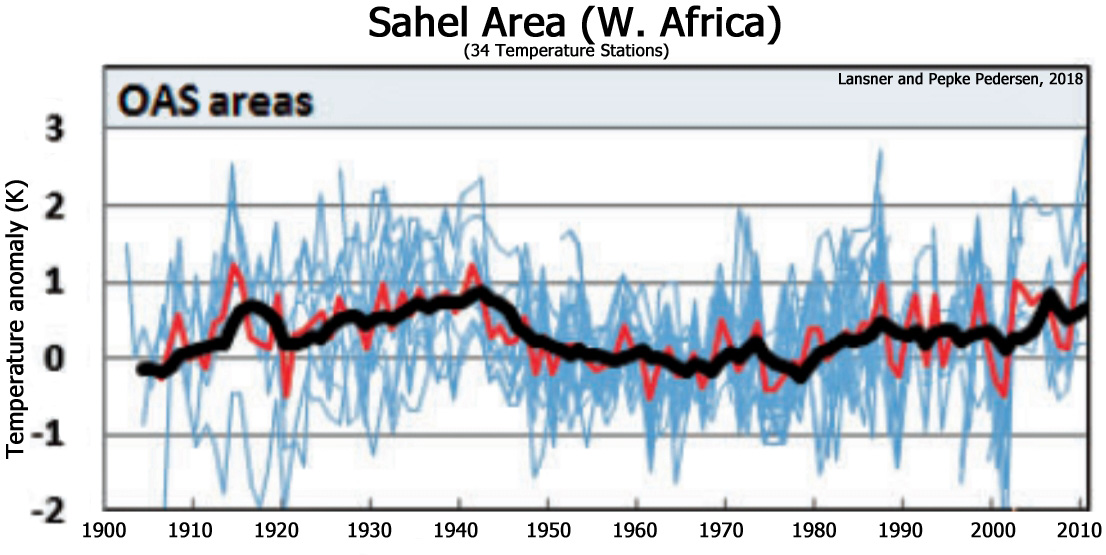
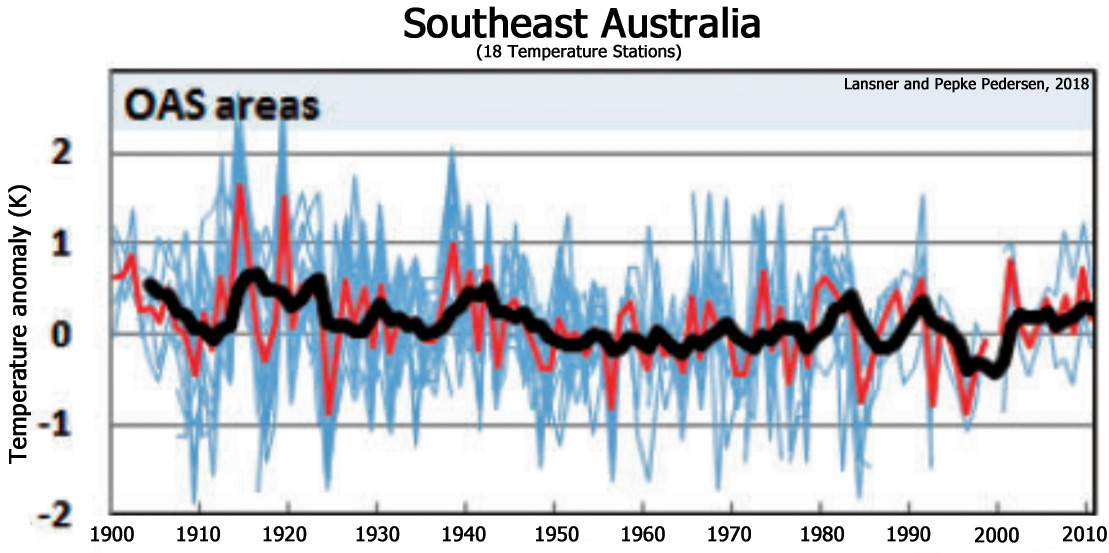
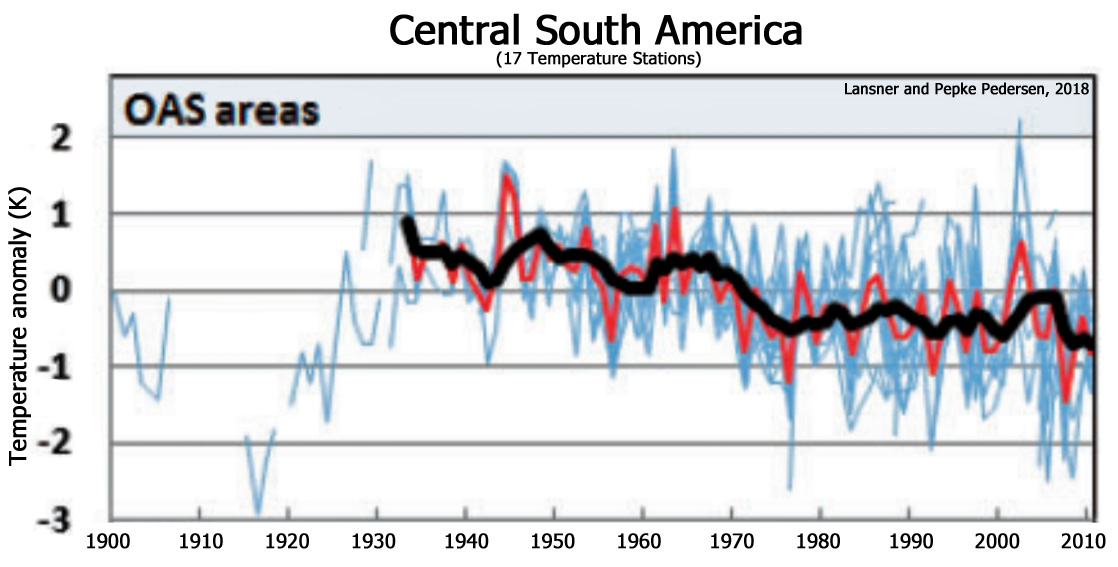
Lansner and Pepke Pedersen, 2018
“In locations best sheltered and protected against ocean air influence, the vast majority of thermometers worldwide trends show temperatures in recent decades rather similar to the 1920–1950 period. This indicates that the present-day atmosphere and heat balance over the Earth cannot warm areas – typically valleys – worldwide in good shelter from ocean trends notably more than the atmosphere could in the 1920–1950 period. … [T]he lack of warming in the OAS temperature trends after 1950 should be considered when evaluating the climatic effects of changes in the Earth’s atmospheric trace amounts of greenhouse gasses as well as variations in solar conditions.”


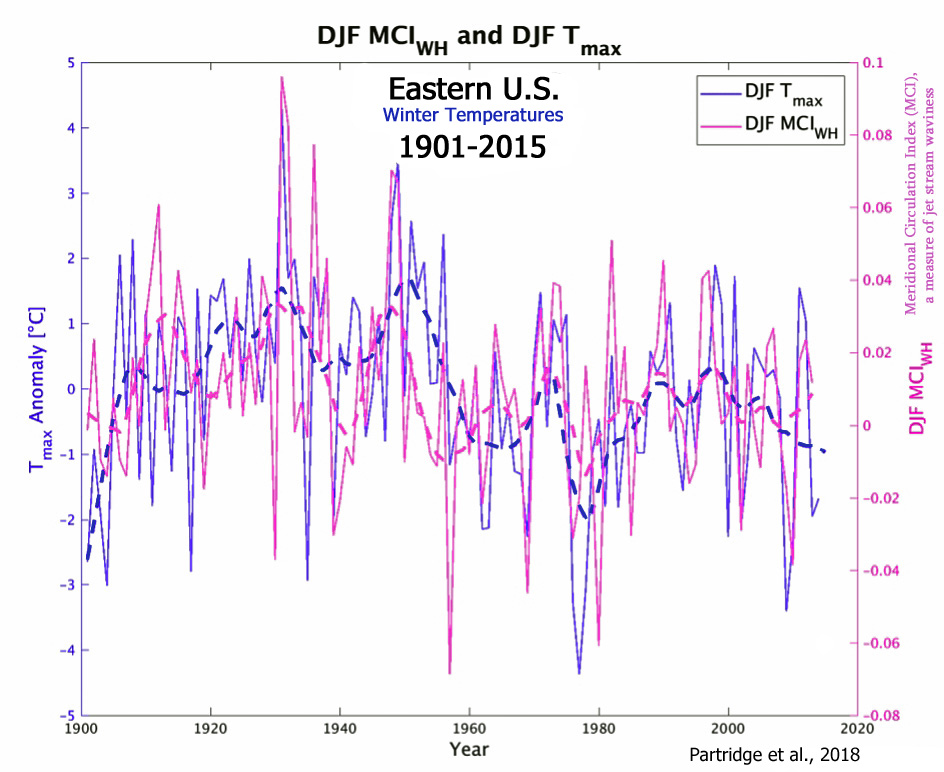
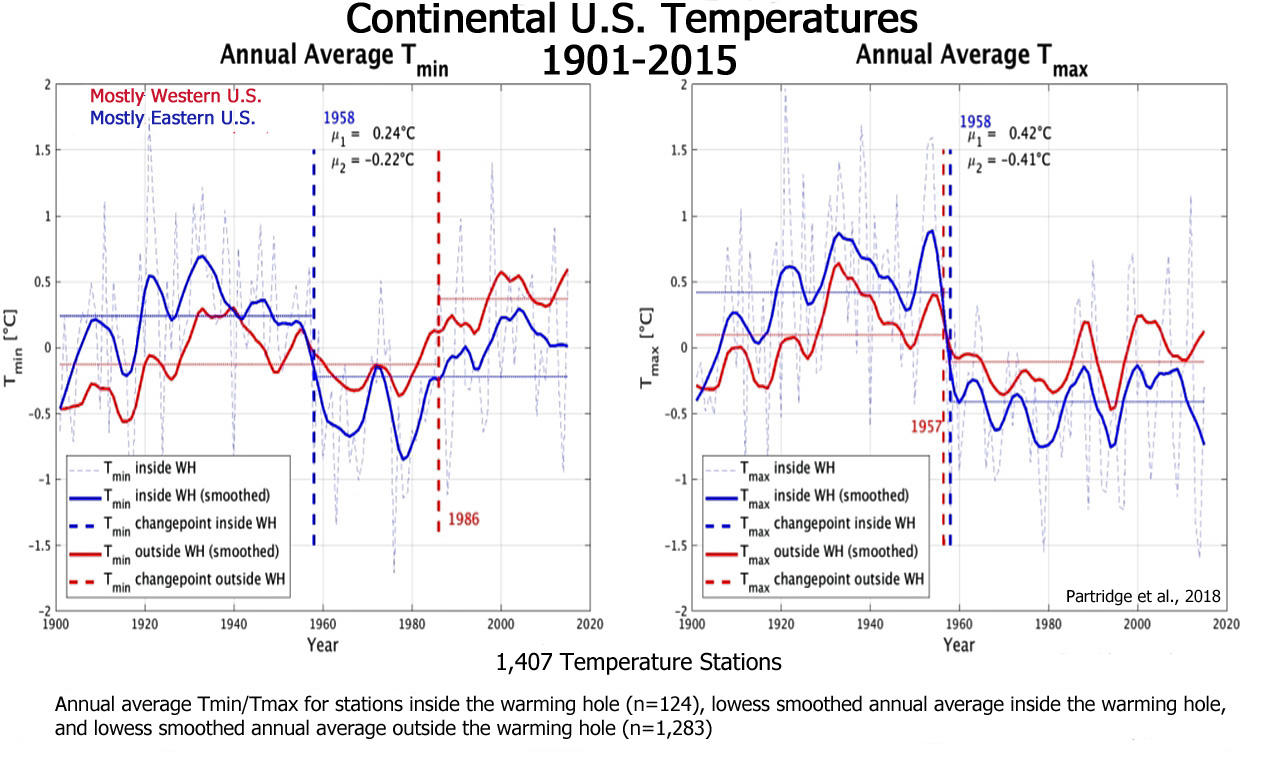
Partridge et al., 2018
“We present a novel approach to characterize the spatiotemporal evolution of regional cooling across the eastern U.S. (commonly called the U.S. warming hole), by defining a spatially explicit boundary around the region of most persistent cooling. The warming hole emerges after a regime shift in 1958 where annual maximum (Tmax) and minimum (Tmin) temperatures decreased by 0.46°C and 0.83°C respectively.”

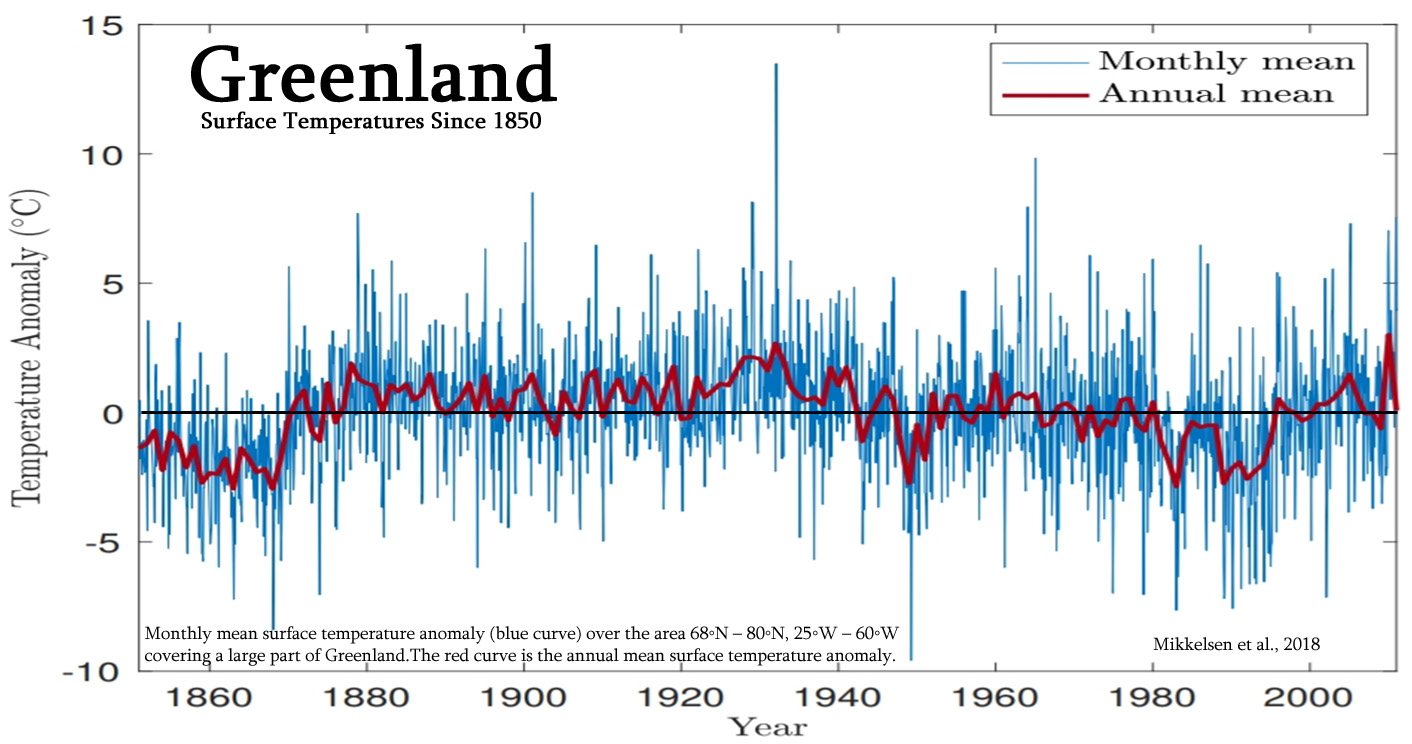
Mikkelsen et al., 2018
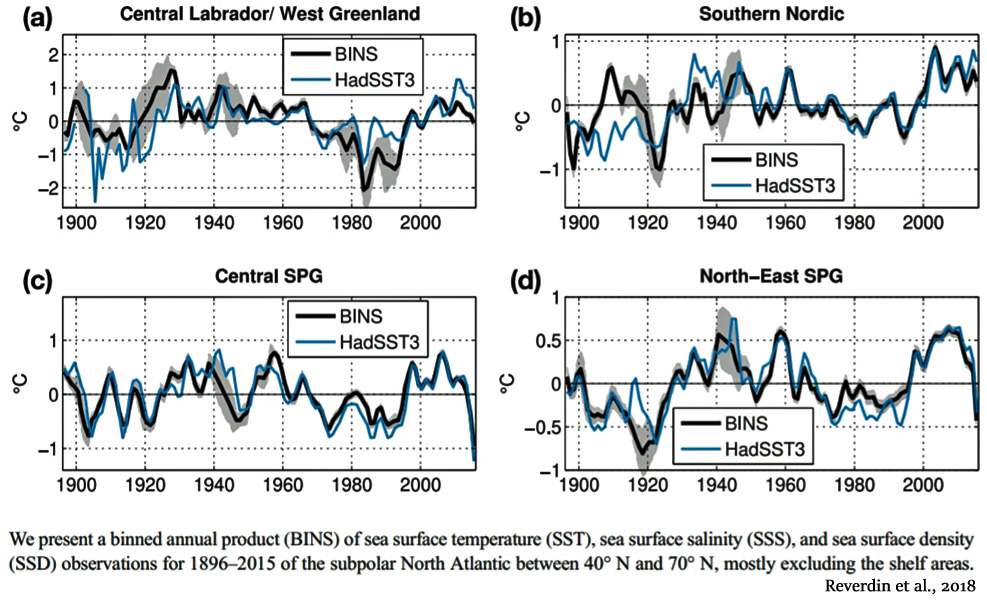
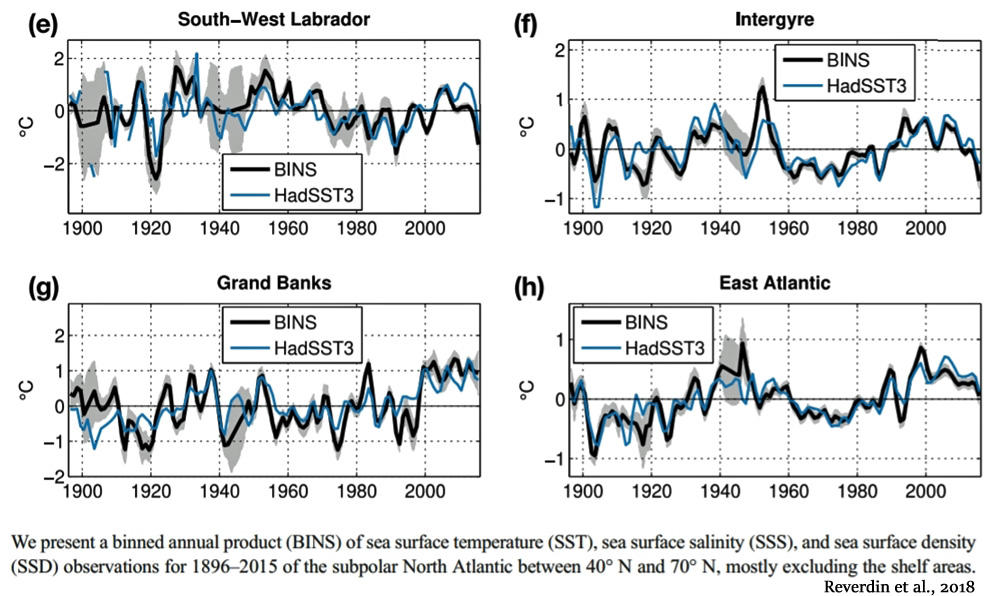
Reverdin et al., 2018
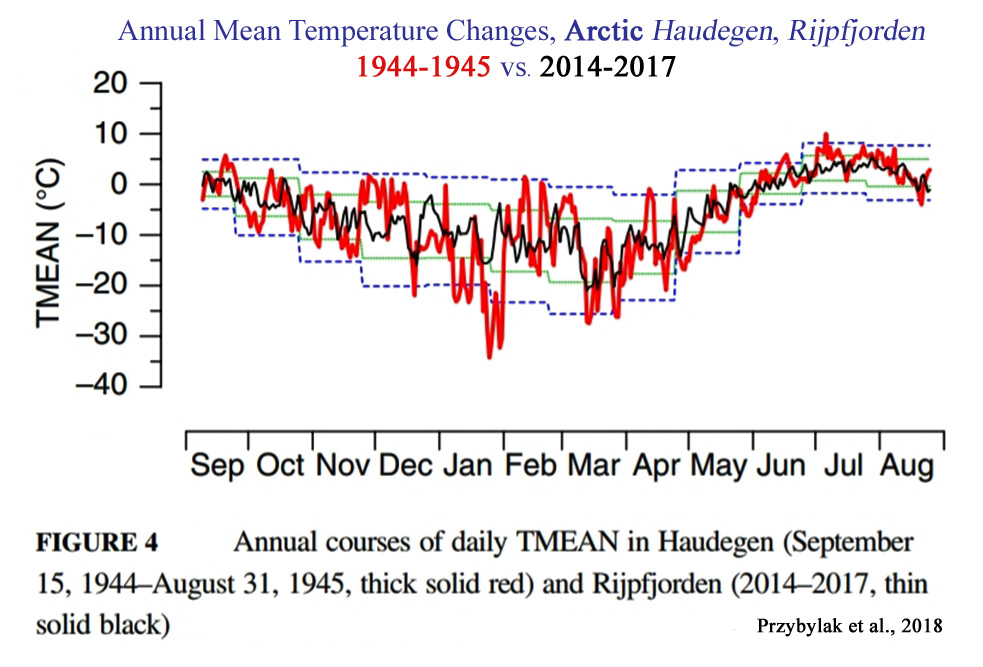
Przybylak et al., 2018
“Analysis reveals that the expedition year 1944/1945 in Nordaustlandet was, in the majority of months, the warmest of all analysed periods, that is, both historical and contemporary periods. The study period was markedly warmer than 1981–2010 (mean annual −6.5 vs. −8.4°C) but colder than the periods 2011–2016 (−5.7°C) and 2014–2017 (−5.8°C). … Generally, no change is observed in frequency of occurrence of cold days between the ETCWP [early twentieth century warm period] and CWPs [contemporary warm periods]. A slightly smaller number of cold summer days occurred in the ETCWP than occur at present. … The majority of mean monthly air temperatures in the ETCWP [early twentieth century warm period] is within two SDs of the modern 1981–2010 mean. This means that values of air temperature in the study period [1944/1945] lie within the range of recent temperature variability. Similar results were obtained for older historical periods, for example, for the Canadian Arctic, the entire Svalbard archipelago and surrounding seas, Novaya Zemlya as well as for the entire Arctic.”
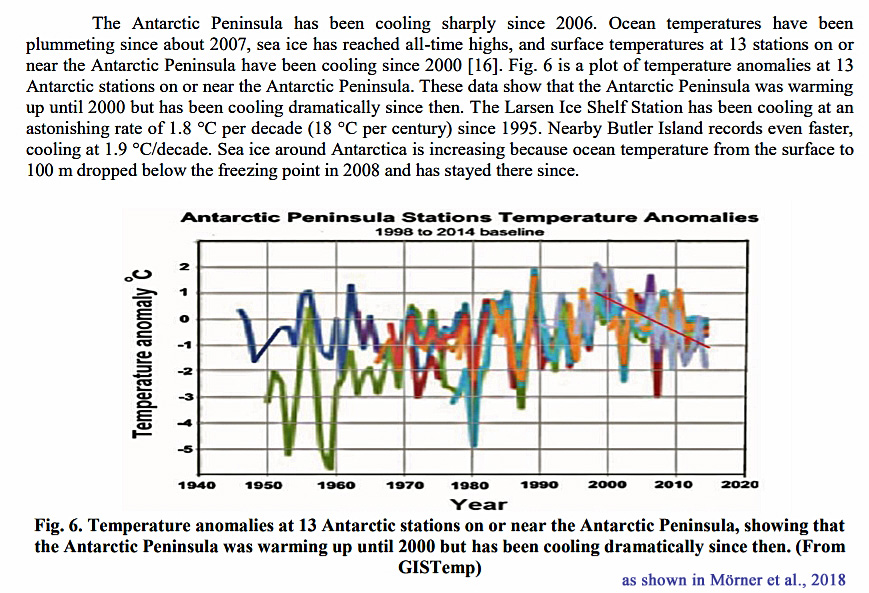
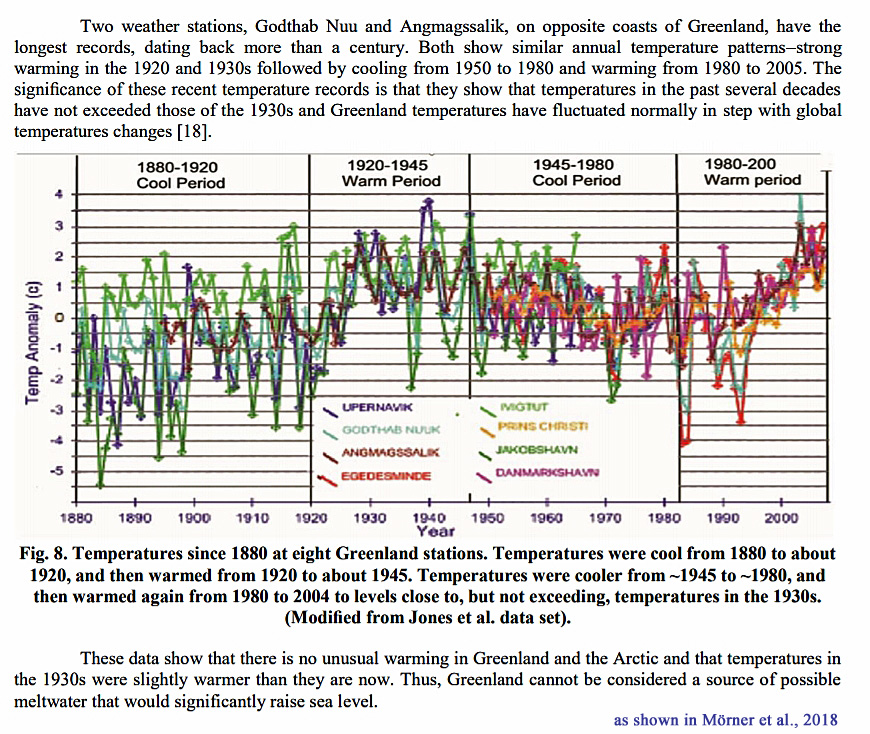
Mörner et al., 2018
“Is Greenland warming and the ice sheet melting away? Chylek et al. [2004] analyzed temperature histories of coastal stations in southern and central Greenland having almost uninterrupted temperature records between 1950 and 2000 and found that coastal Greenland’s peak temperatures occurred between 1930 and 1940, after which subsequent decrease in temperature was so substantial and sustained that current coastal temperatures ‘are about 1°C below their 1940 values.’ At the summit of the Greenland Ice Sheet, the summer average temperature has decreased at the rate of 2.2 °C per decade since the beginning of measurements in 1987. Two weather stations, Godthab Nuu and Angmagssalik, on opposite coasts of Greenland, have the longest records, dating back more than a century. Both show similar annual temperature patterns–strong warming in the 1920 and 1930s followed by cooling from 1950 to 1980 and warming from 1980 to 2005. The significance of these recent temperature records is that they show that temperatures in the past several decades have not exceeded those of the 1930s and Greenland temperatures have fluctuated normally in step with global temperatures changes [Easterbrook, 2016].”
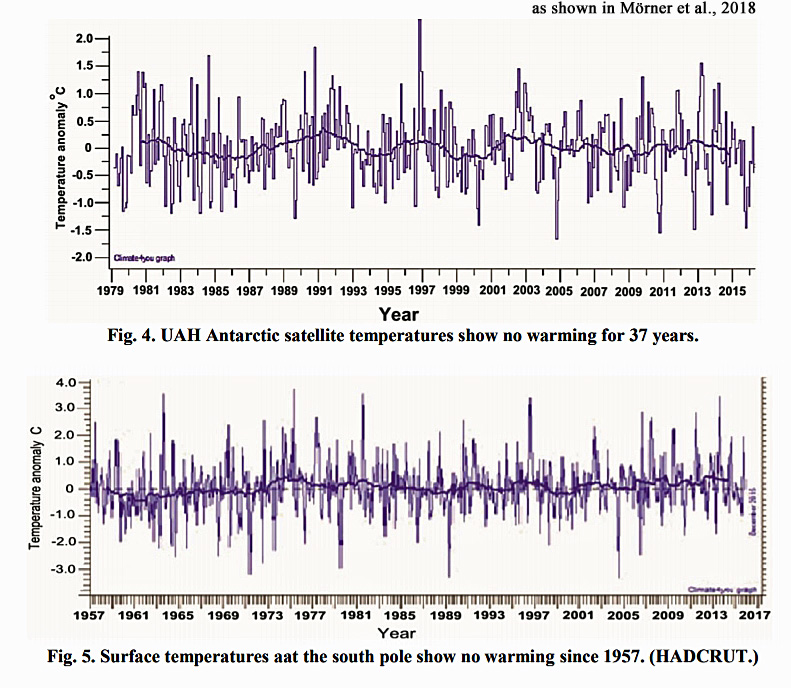
“Satellite and surface temperature records and sea surface temperatures show that both the East Antarctic Ice Sheet and the West Antarctic Ice Sheet are cooling, not warming. Satellite and surface temperature measurements show that the East Antarctic Ice Sheet is cooling, not warming, and glacial ice is increasing, not melting. Satellite and surface temperature measurements of the southern polar area show no warming over the past 37 years. Growth of the Antarctic ice sheets means sea level rise is not being caused by melting of polar ice and, in fact, is slightly lowering the rate of rise. Satellite Antarctic temperature records show 0.02 °C/decade cooling since 1979. The Southern Ocean around Antarctica has been getting sharply colder since 2006. Antarctic sea ice is increasing, reaching all-time highs. Surface temperatures at 13 stations show the Antarctic Peninsula has been sharply cooling since 2000. This indicates that the hypothetical ‘enhanced Antarctic Ice Sheet contribution’ of Garner et al. [2017] is a serious mistake (Fig. 1) not anchored in facts.”
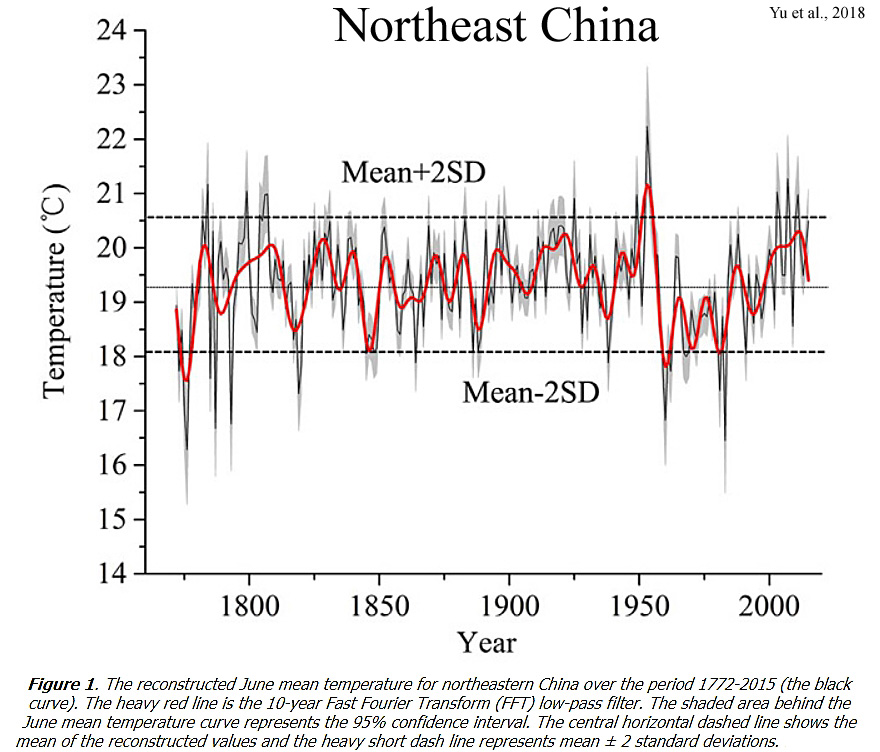
Yu et al., 2018
“Reconstruction results explained 39.3% of climatic variance over the calibration period 1959–2015, and they indicated that the central XiaoXing Anling Mountains have experienced six major warm periods, five major cold periods, and several cold years that coincided with a sequence of major tropical volcanic eruptions. … Power spectrum revealed the existence of significant frequency cycles of variability at 2.0–2.3, 2.5–2.7, 2.9, 3.0, 3.4–4.5, 5.6, 7.2, 7.5–8.0, 8.2, 8.9, 9.9, 10.5–11.5, and 70.5 years, which may be linked to large-scale atmospheric-oceanic variability, such as the El Niño-Southern Oscillation, solar activity, and the Pacific Decadal Oscillation.”
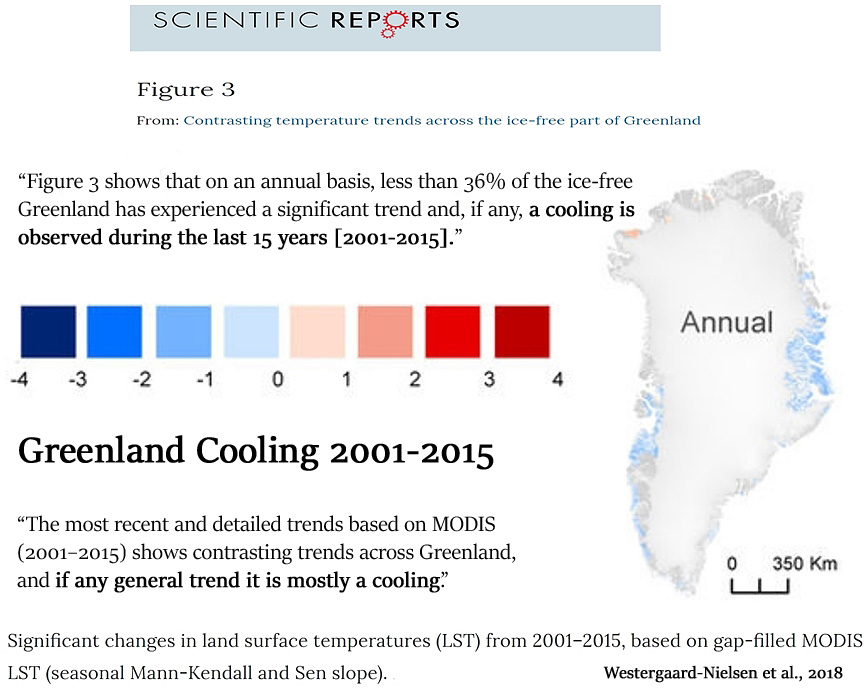
Westergaard-Nielsen et al., 2018
“Here we quantify trends in satellite-derived land surface temperatures and modelled air temperatures, validated against observations, across the entire ice-free Greenland. … Warming trends observed from 1986–2016 across the ice-free Greenland is mainly related to warming in the 1990’s. The most recent and detailed trends based on MODIS (2001–2015) shows contrasting trends across Greenland, and if any general trend it is mostly a cooling. The MODIS dataset provides a unique detailed picture of spatiotemporally distributed changes during the last 15 years. … Figure 3 shows that on an annual basis, less than 36% of the ice-free Greenland has experienced a significant trend and, if any, a cooling is observed during the last 15 years (<0.15 °C change per year).”
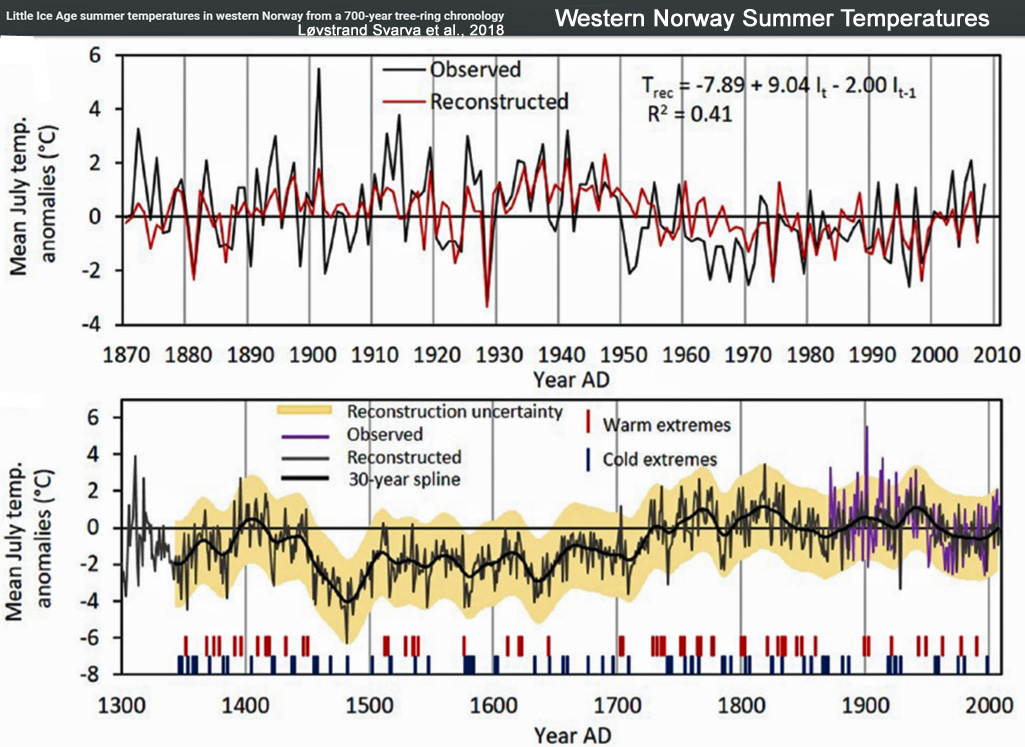
Løvstrand Svarva 2018 et al., 2018
“A ring-width Pinus sylvestris chronology from Sogndal in western Norway was created, covering the period AD 1240–2008 and allowing for reconstruction of monthly mean July temperatures. This reconstruction is the first of its kind from western Norway and it aims to densify the existing network of temperature-sensitive tree-ring proxy series to better understand past temperature variability in the ‘Little Ice Age’ and diminish the spatial uncertainty. Spatial correlation reveals strong agreement with temperatures in southern Norway, especially on the western side of the Scandinavian Mountains. Five prominent cold periods are identified on a decadal timescale, centred on 1480, 1580, 1635, 1709 and 1784 and ‘Little Ice Age’ cooling spanning from 1450 to the early 18th century. High interannual and decadal agreement is found with an independent temperature reconstruction from western Norway, which is based on data from grain harvests and terminal moraines.”
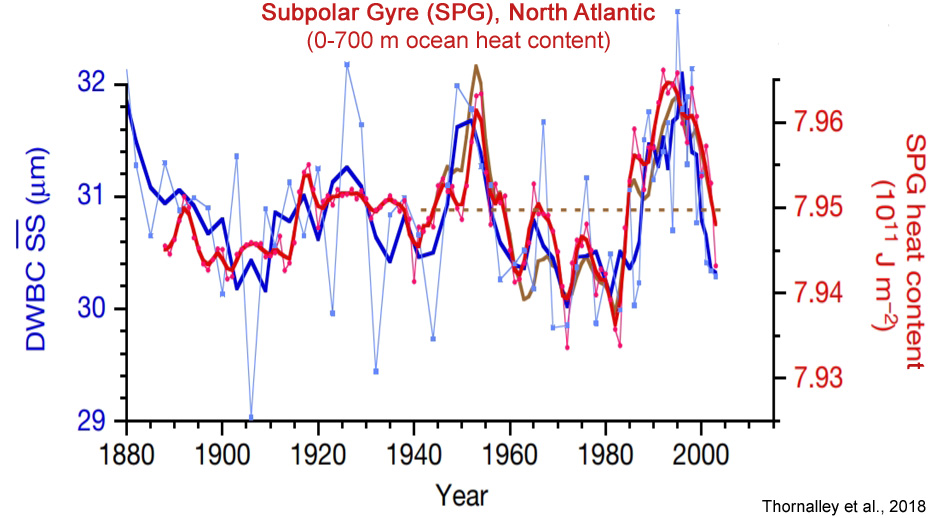
Thornalley et al., 2018
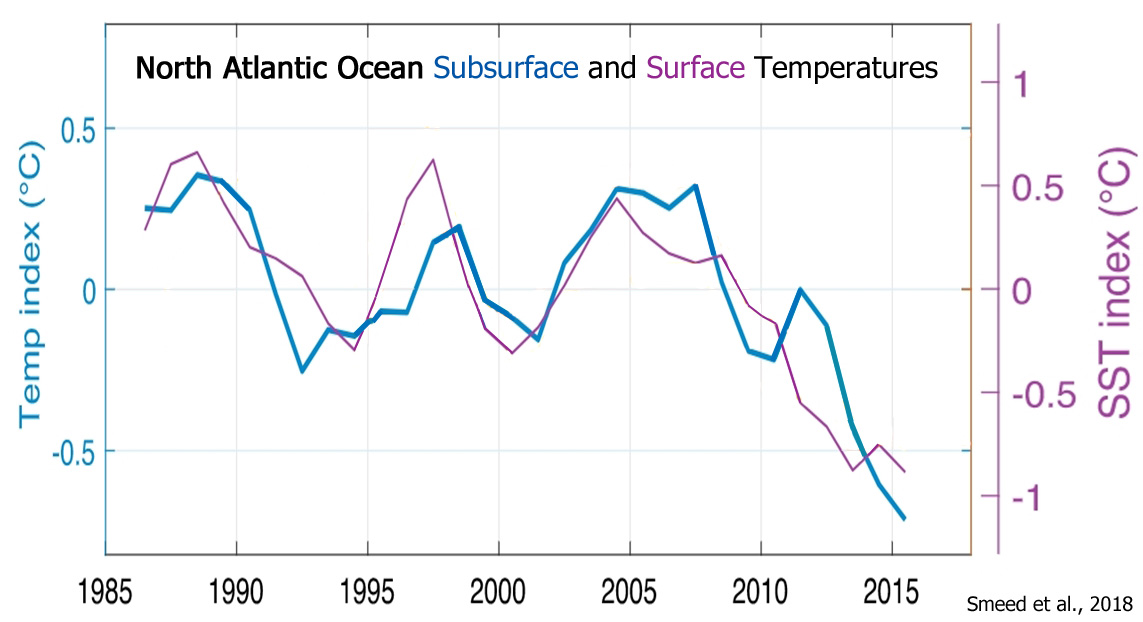
Smeed et al., 2018
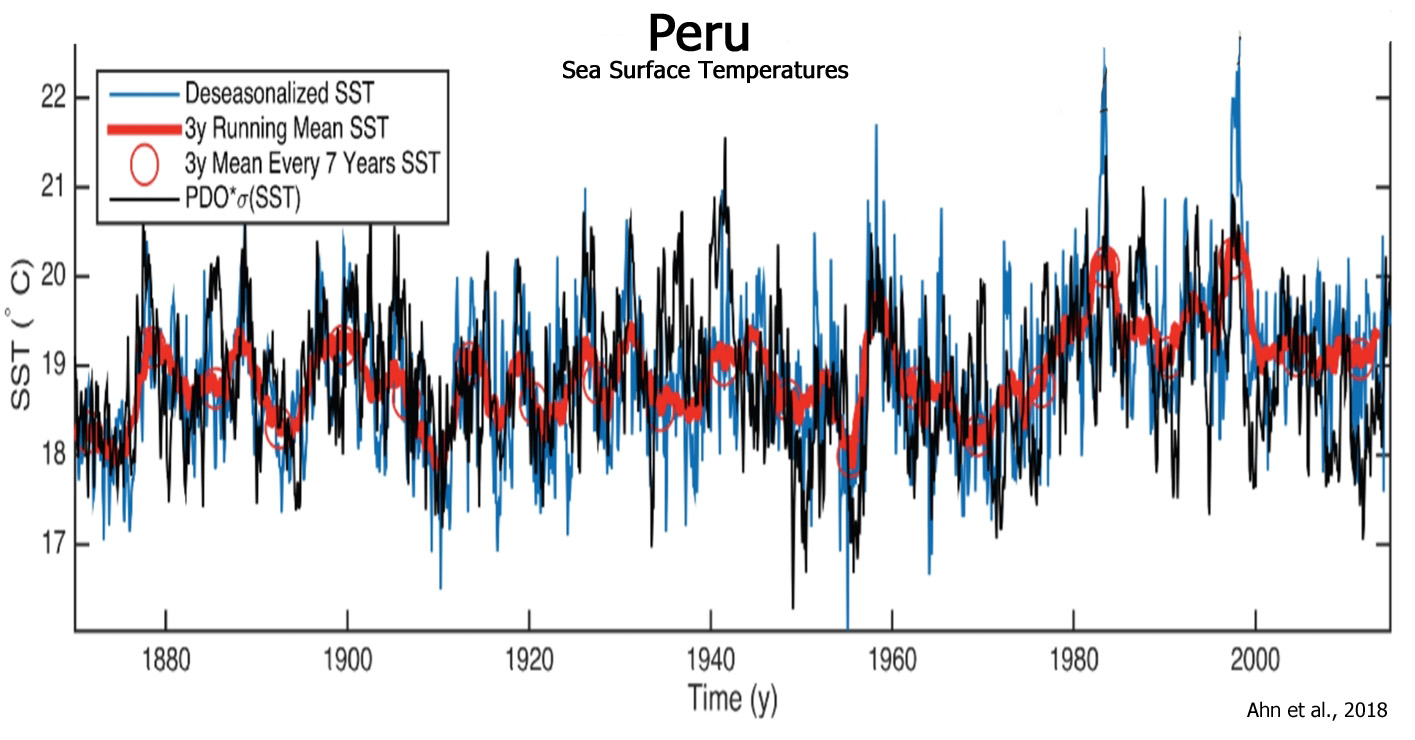
Ahn et al., 2018
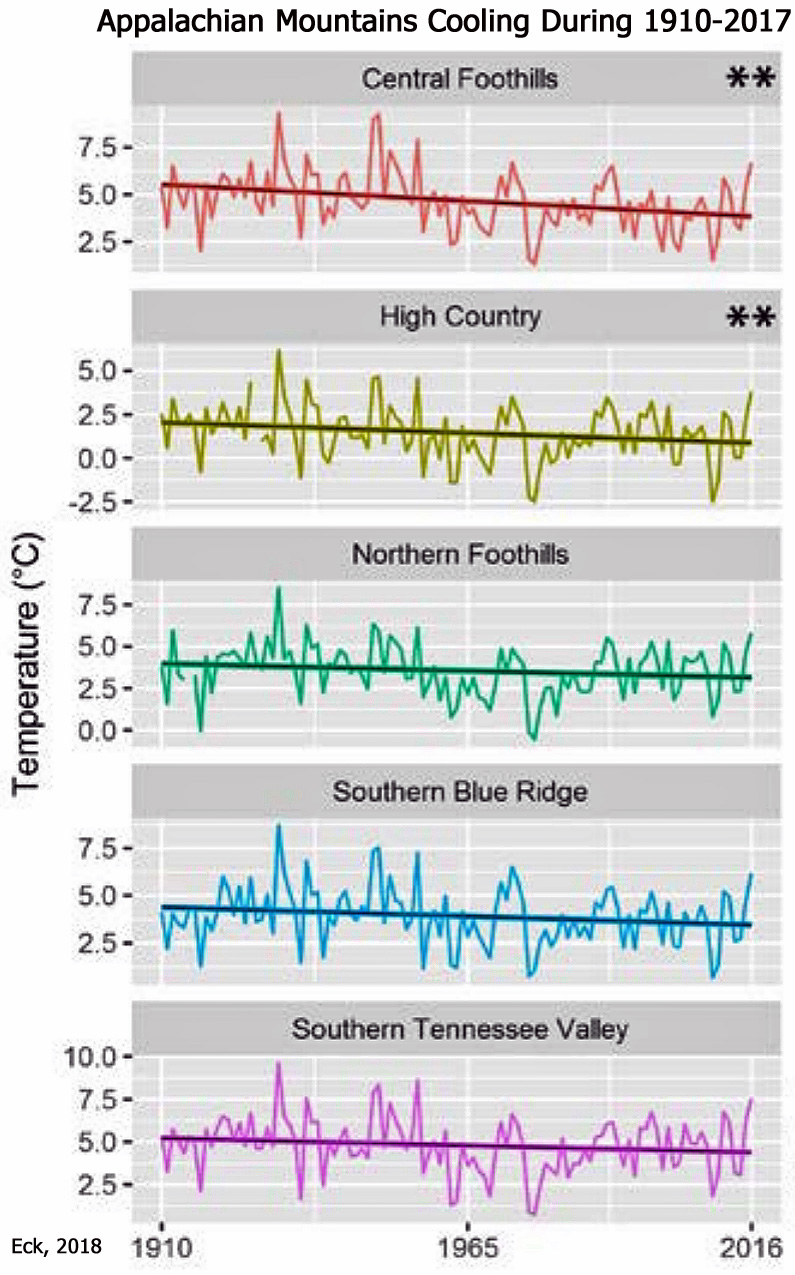
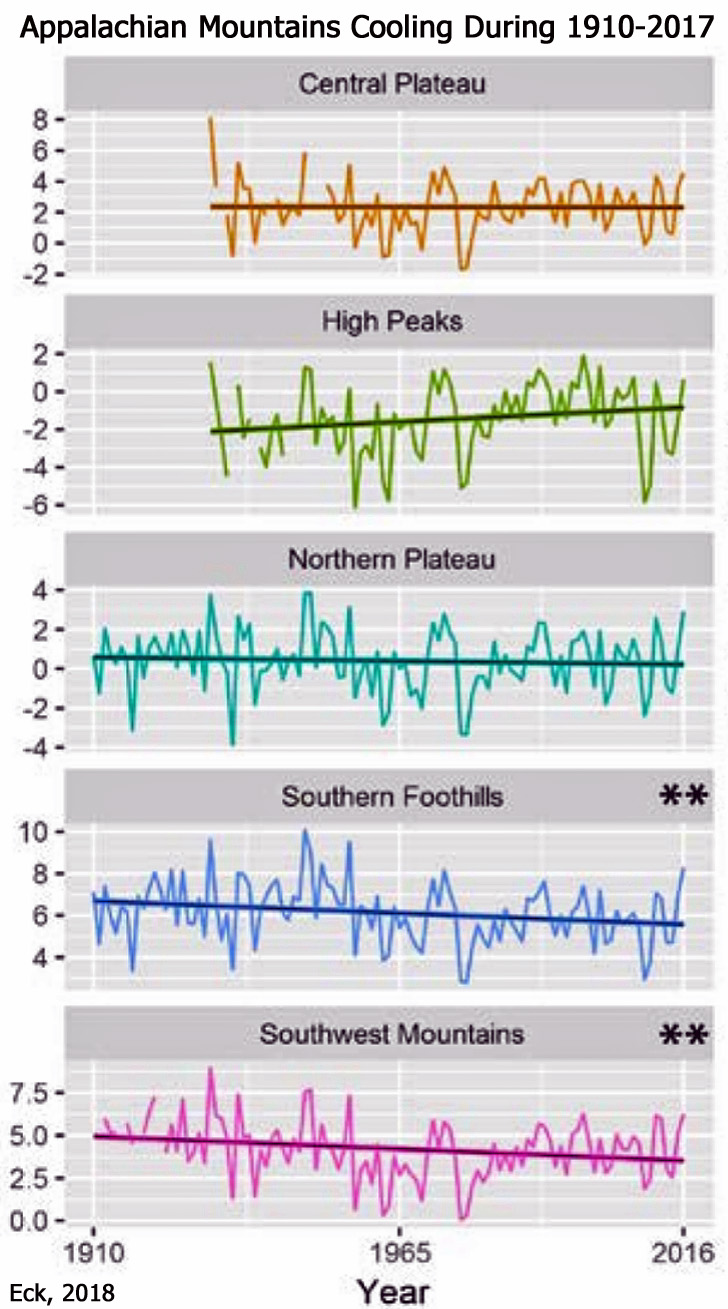
Eck, 2018
“[A] majority (12/14) of the regions within the SAM [Southern Appalachian Mountains] have experienced a long-term decline in mean winter temperatures since 1910. Even after removing the highly anomalous 2009-2010 winter season, which was more than two standard deviations away from the long-term mean, the cooling of mean winter temperatures is still evident. … Higher winter temperatures dominated the early 20th century in the SAM [Southern Appalachian Mountains] with nine of the ten warmest winter seasons on record in the region having occurred before 1960. The 1931-1932 winter season, the warmest on record, averaged 8.0°C for DJF [December-February], nearly 4.7°C higher than the 1987-2017 normal mean winter temperature of 3.3°C. … Despite the 2016-2017 winter season finishing with the highest mean temperatures (5.7ºC) observed in the SAM [Southern Appalachian Mountains] since 1956-1957, there have been several years of anomalous negative temperature anomalies, with the 2009-2010 (0.3ºC) and 2010-2011 (1.2ºC) winter seasons finishing as two of the coldest on record for all regions.”

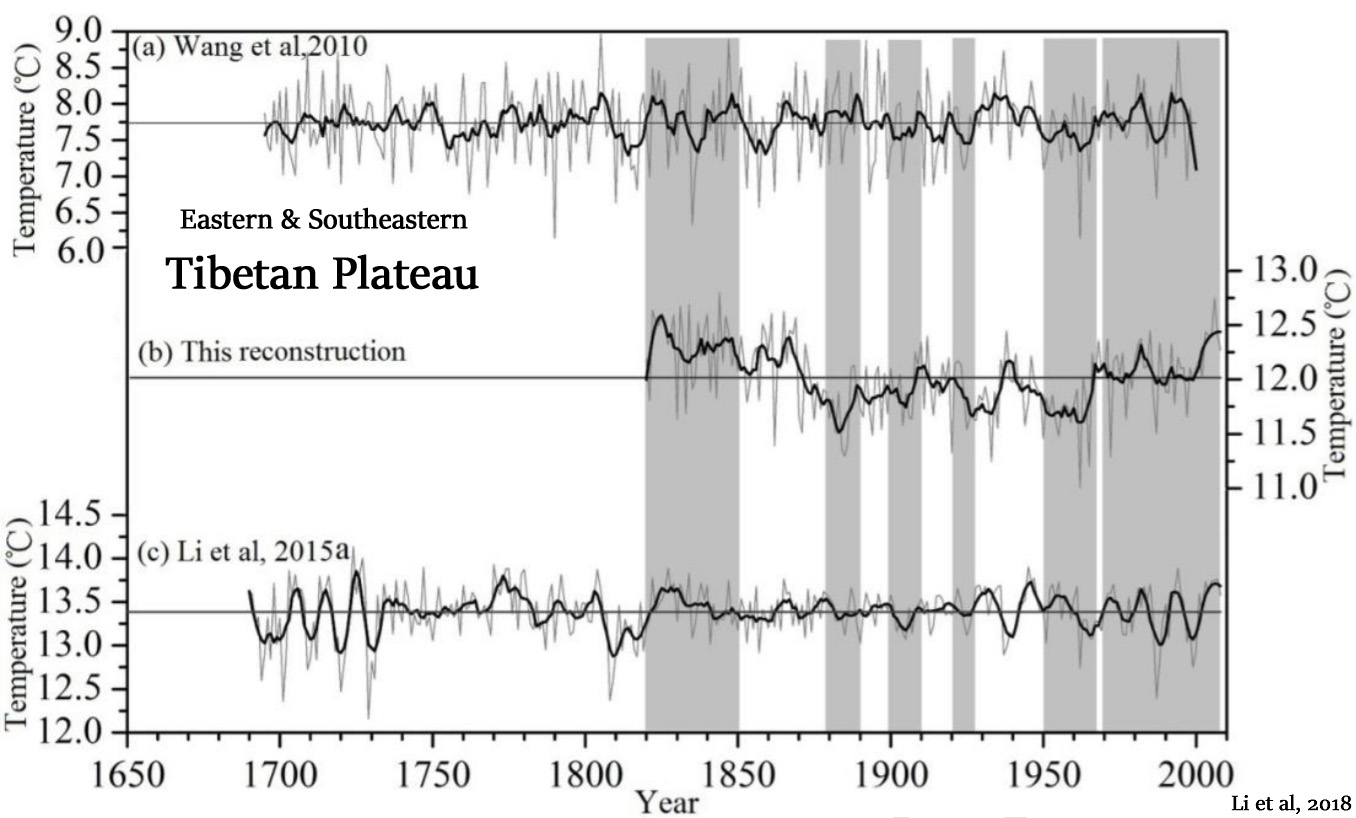
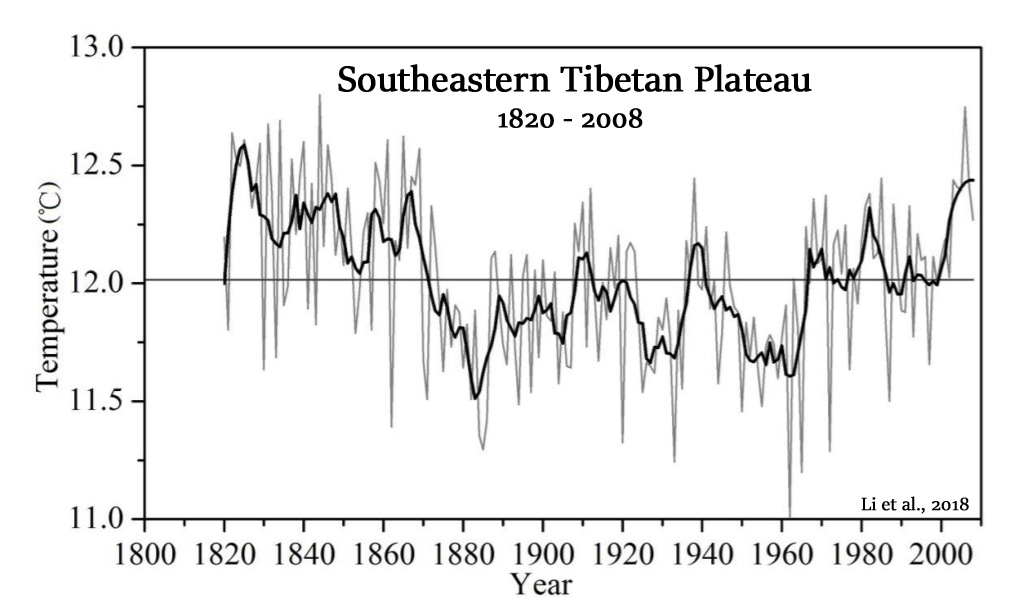
Li et al., 2018
“There are also other studies that suggest that the recent climate warming over the southeastern TP actually began in the 1820s (Shi et al., 2015). However, a few reconstructions from the west and northwest parts of Sichuan or from the southeastern TP indicate that there were no obvious increase of temperature during the past decades (Li et al., 2015b; Zhu et al., 2016).”
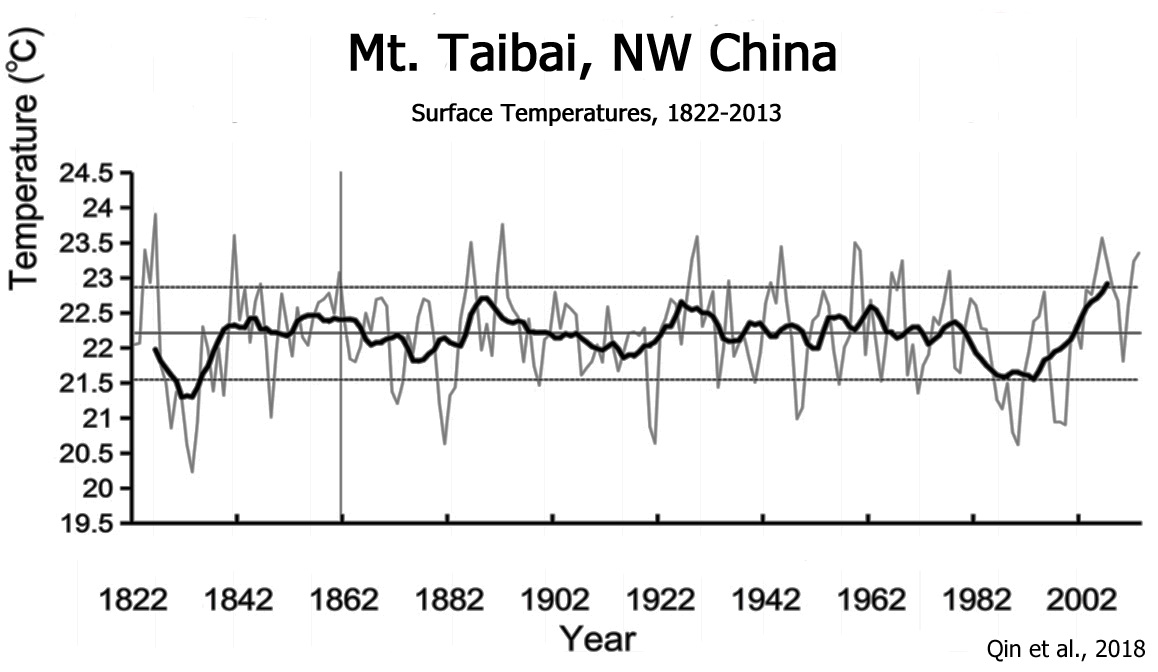
Qin et al., 2018
“Three quasi-oscillations with cycles of 31–22, 22–18, and 12–8 years may reflect the joint influence of PDO, southern oscillation, and solar activity on climate variation in the Qinling Mountains. … [T]he third cycle of 12–8 years exhibited 18 distinct cold-hot events, which were approximately equivalent to the changes of solar activity and sunspot activity and corresponded to the 11-year cycle of drought in northwestern China (Cai and Liu. 2007).”
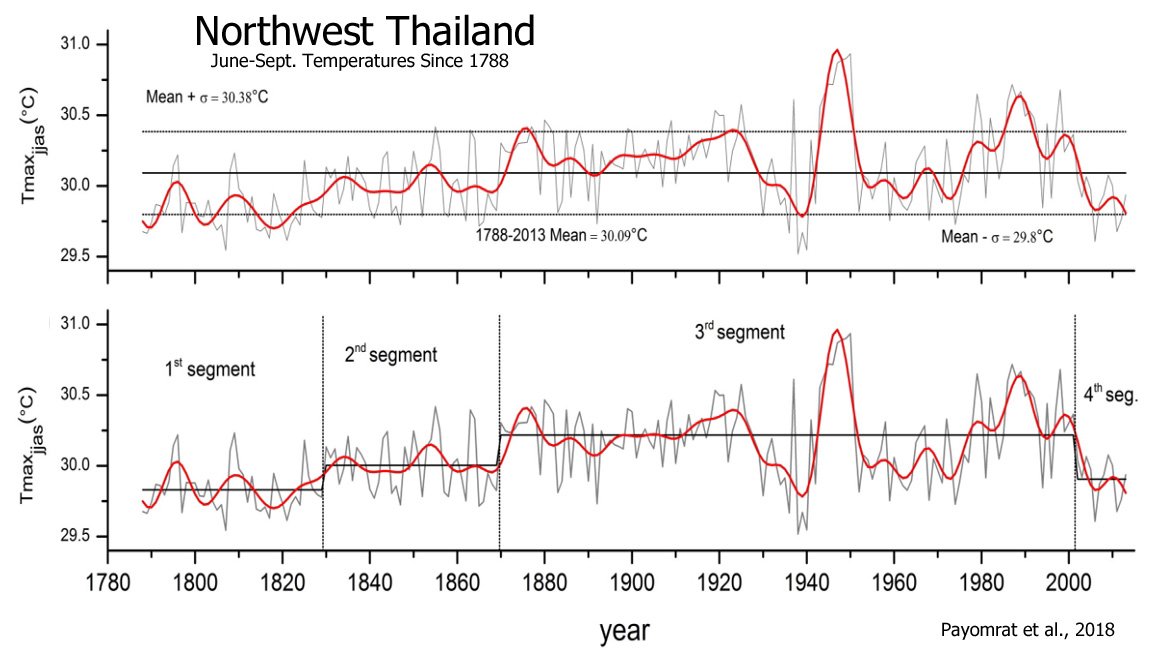
Payomrat et al., 2018
“During the third segment (1870–2001), the maximum temperature pattern seemed to be constant compared to the changing rate (+0.004 °C/decade). … The short fourth segment, which occurred from 2002 to 2013, showed a deceasing trend at a rate of -0.12 °C/decade.”
Wang et al., 2018
Birkel et al., 2018
Reynolds et al., 2018
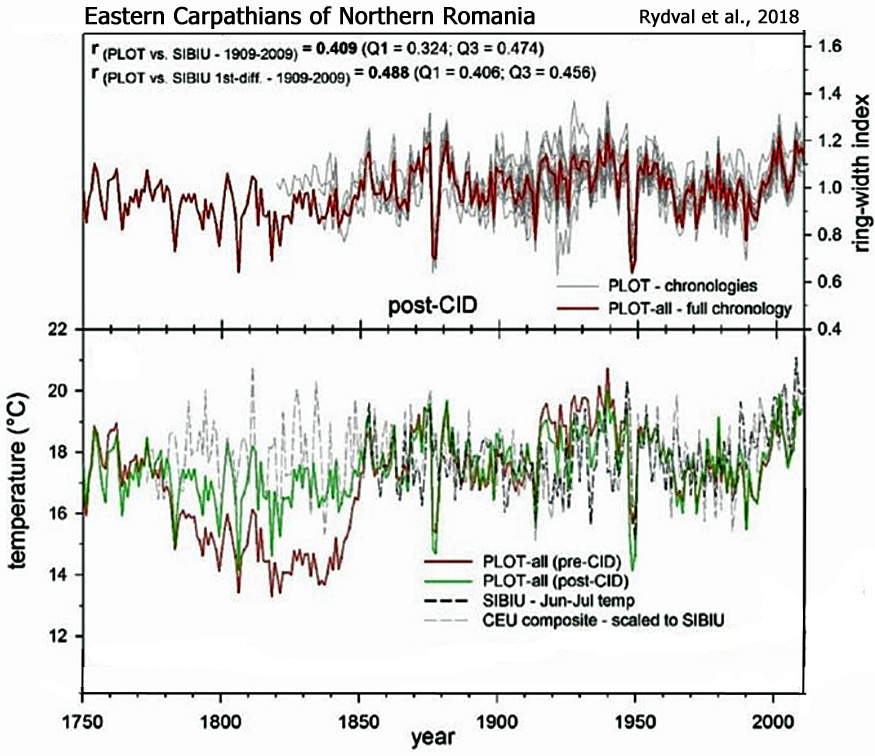
Rydval et al., 2018
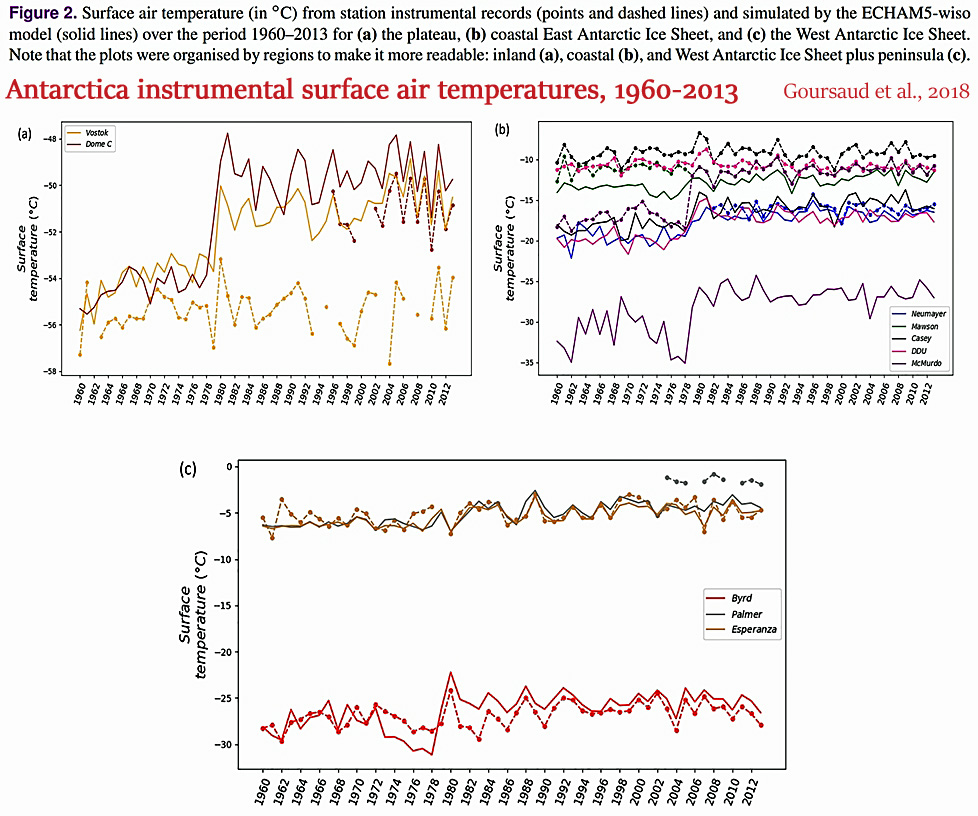
Goursaud et al., 2018
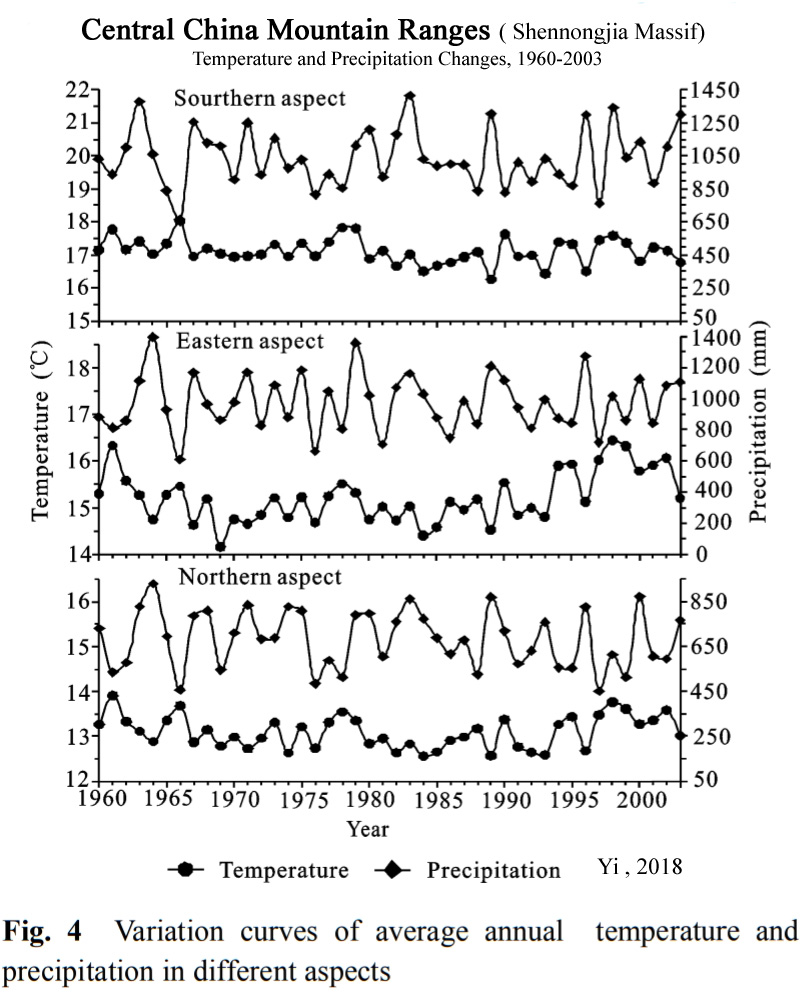
Yi, 2018
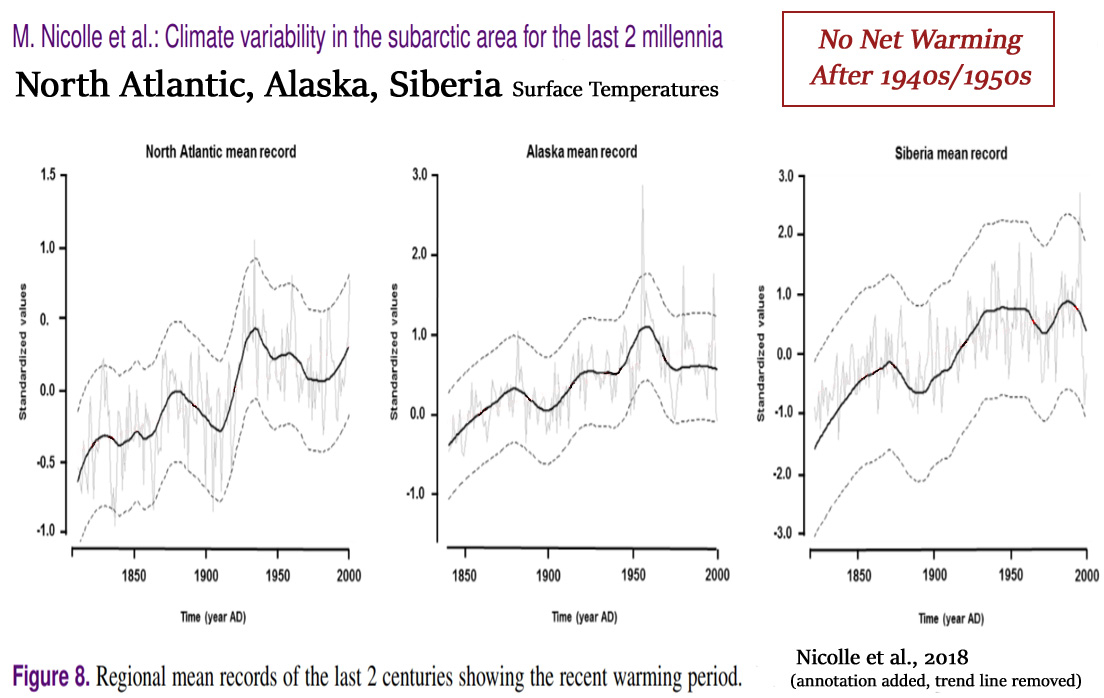
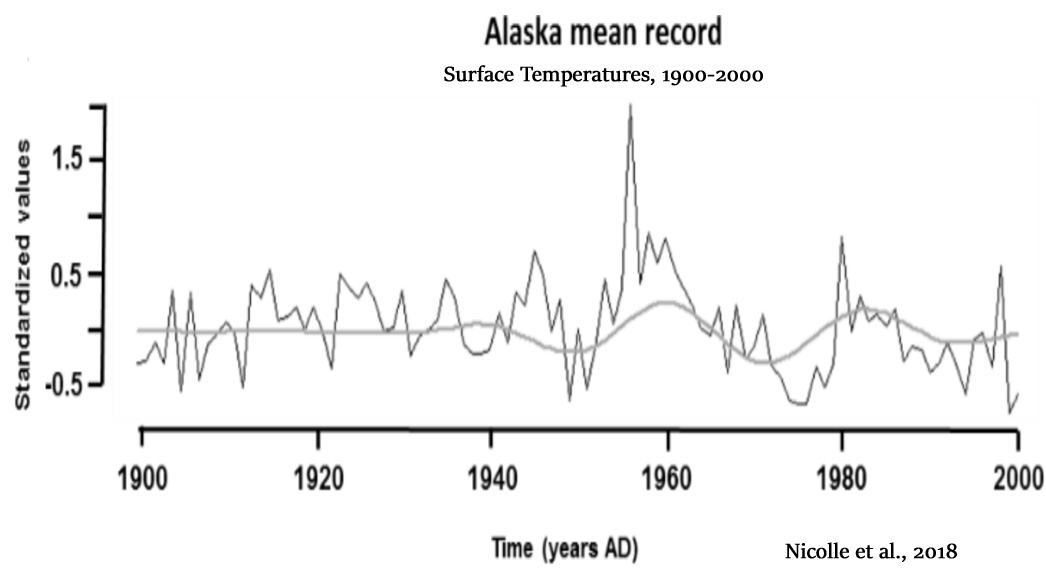
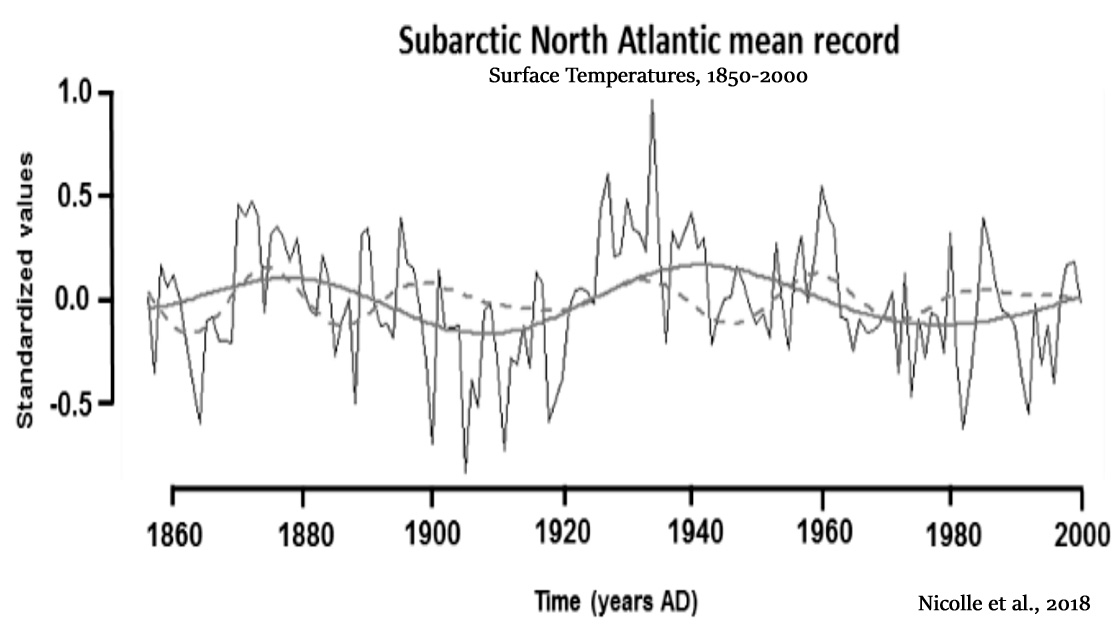
Nicolle et al., 2018
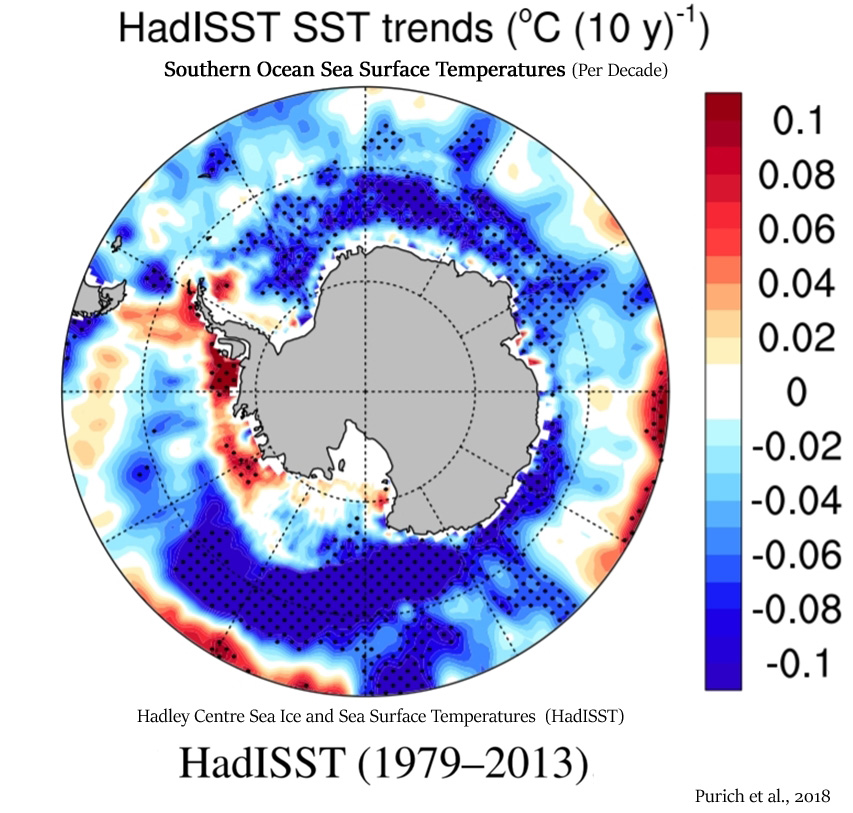
Purich et al., 2018
“Observed Southern Ocean changes over recent decades include a surface freshening (Durack and Wijffels 2010; Durack et al. 2012; de Lavergne et al. 2014), surface cooling (Fan et al. 2014; Marshall et al. 2014; Armour et al. 2016; Purich et al. 2016a) and circumpolar increase in Antarctic sea ice (Cavalieri and Parkinson 2008; Comiso and Nishio 2008; Parkinson and Cavalieri 2012). … Our results suggest that recent multi-decadal trends in large-scale surface salinity over the Southern Ocean have played a role in the observed surface cooling seen in this region. … The majority of CMIP5 models do not simulate a surface cooling and increase in sea ice, as seen in observations.”
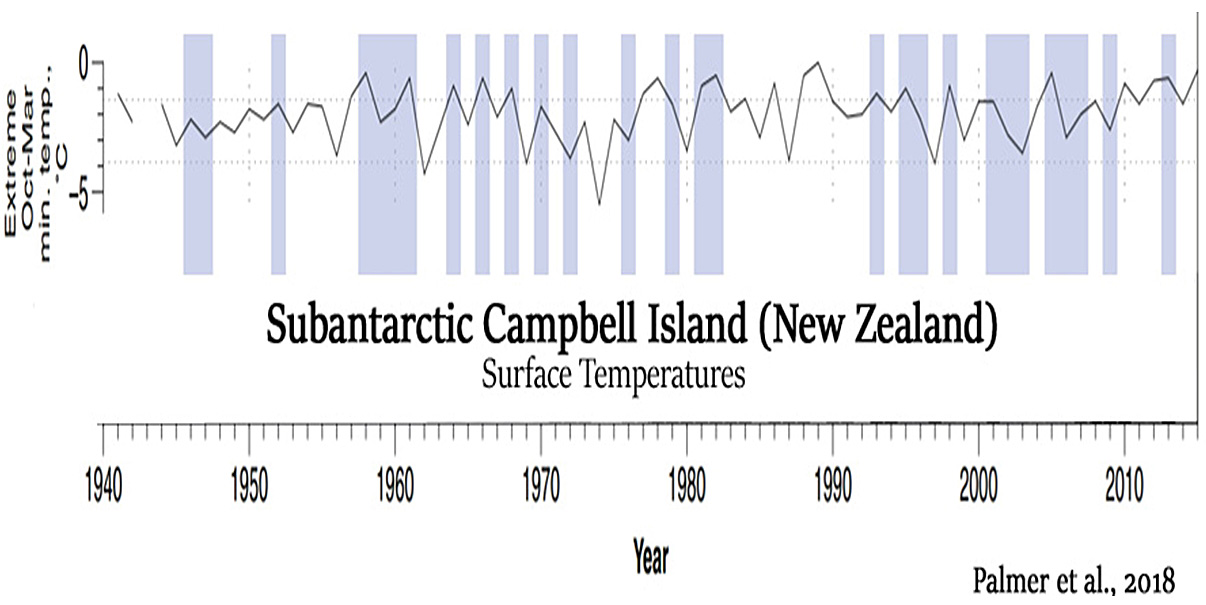
Palmer et al., 2018
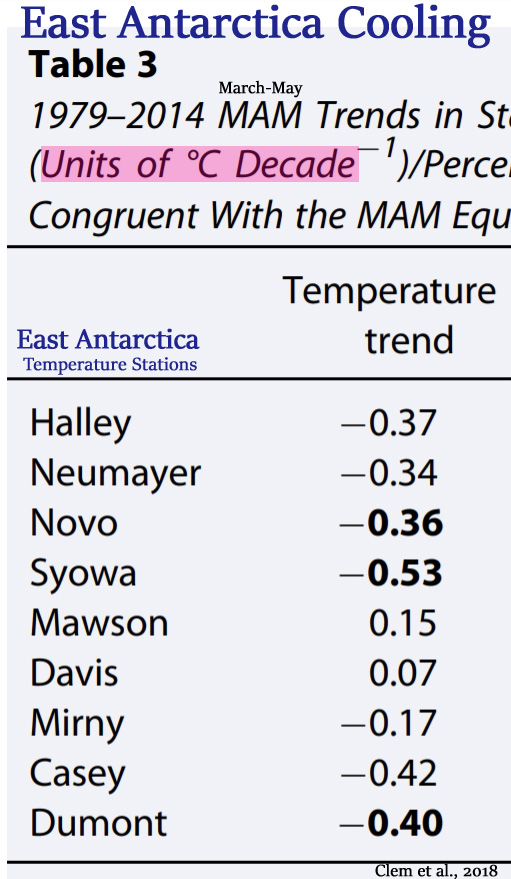
Clem et al., 2018
“This study finds recent (post-1979) surface cooling of East Antarctica during austral autumn to also be tied to tropical forcing, namely, an increase in La Niña events. … The South Atlantic anticyclone is associated with cold air advection, weakened northerlies, and increased sea ice concentrations across the western East Antarctic coast, which has increased the rate of cooling at Novolazarevskaya and Syowa stations after 1979. This enhanced cooling over western East Antarctica is tied more broadly to a zonally asymmetric temperature trend pattern across East Antarctica during autumn that is consistent with a tropically forced Rossby wave rather than a SAM pattern; the positive SAM pattern is associated with ubiquitous cooling across East Antarctica.”
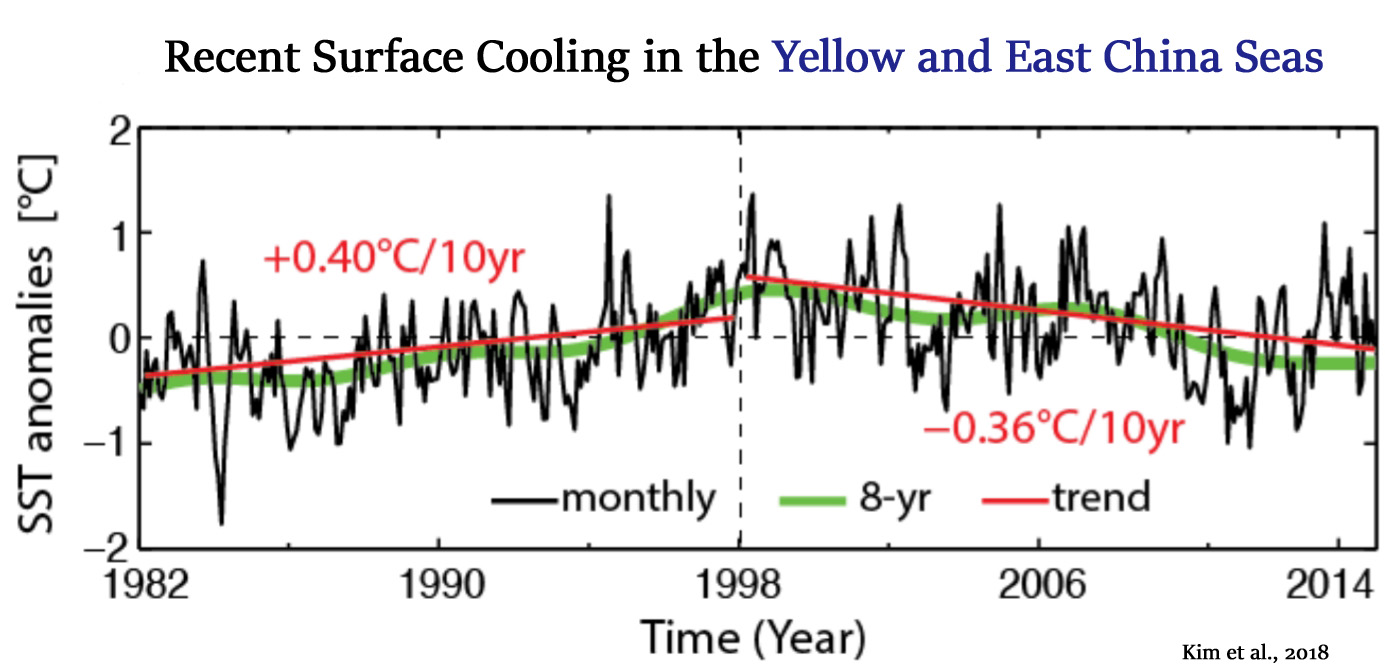
Kim et al., 2018
“Recent surface cooling in the Yellow and East China Seas and the associated North Pacific climate regime shift … The Yellow and East China Seas (YECS) are widely believed to have experienced robust, basin-scale warming over the last few decades. However, the warming reached a peak in the late 1990s, followed by a significant cooling trend. … The most striking evolution pattern is that a robust warming trend at a rate of +0.40°C per decade reached a peak in the late 1990s, and then it turned downward at a rate of −0.36°C per decade. The positive and then negative trends are estimated throughout the YECS for the periods 1982−1997.”
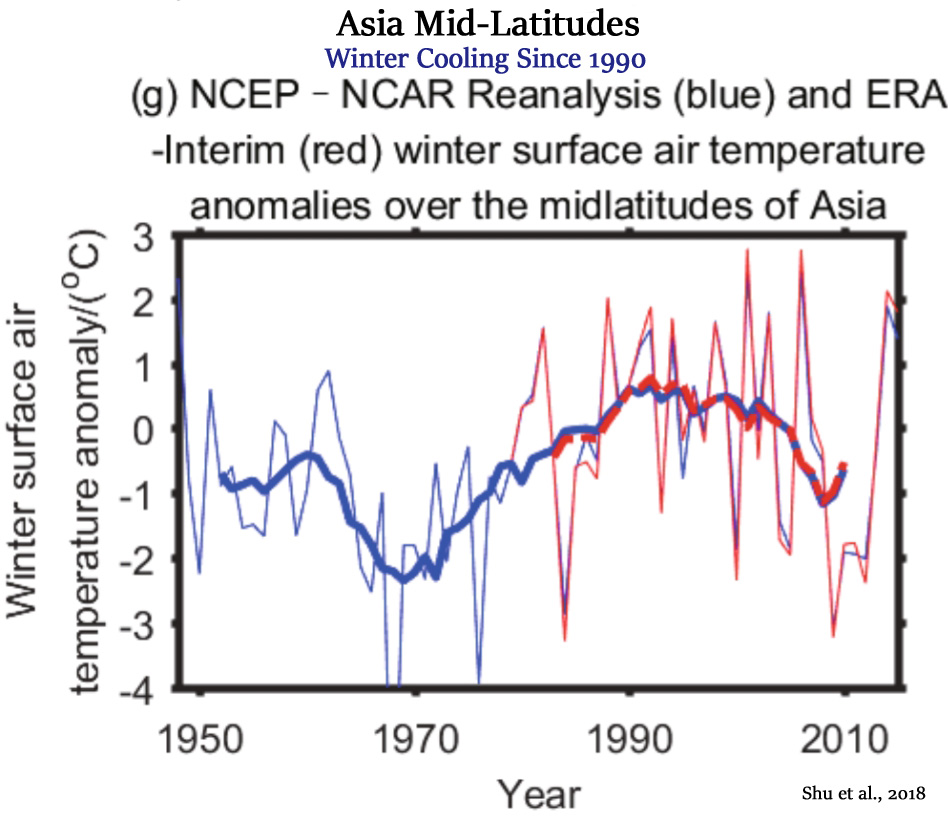
Shu et al., 2018
“The link between boreal winter cooling over the midlatitudes of Asia and the Barents Oscillation (BO) since the late 1980s is discussed in this study, based on five datasets. Results indicate that there is a large-scale boreal winter cooling during 1990–2015 over the Asian midlatitudes, and that it is a part of the decadal oscillations of long-term surface air temperature (SAT) anomalies.”
Mallory et al., 2018

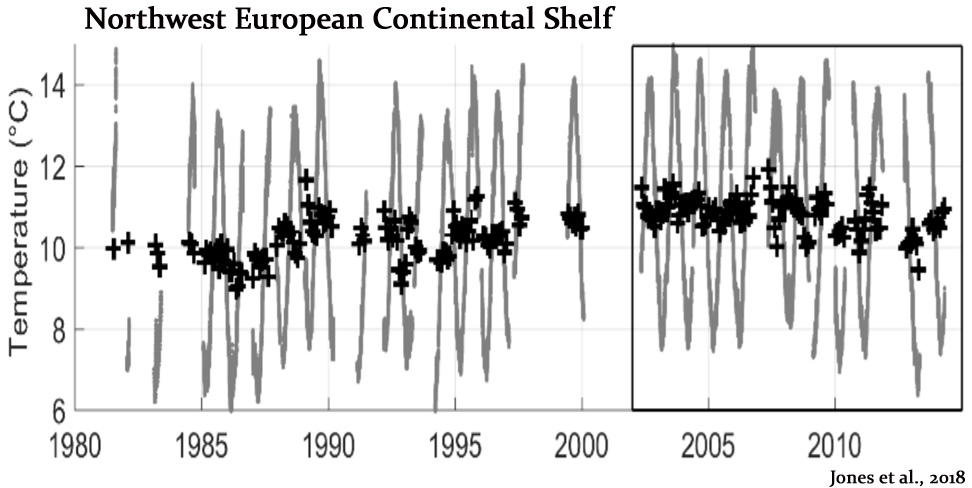
Jones et al., 2018
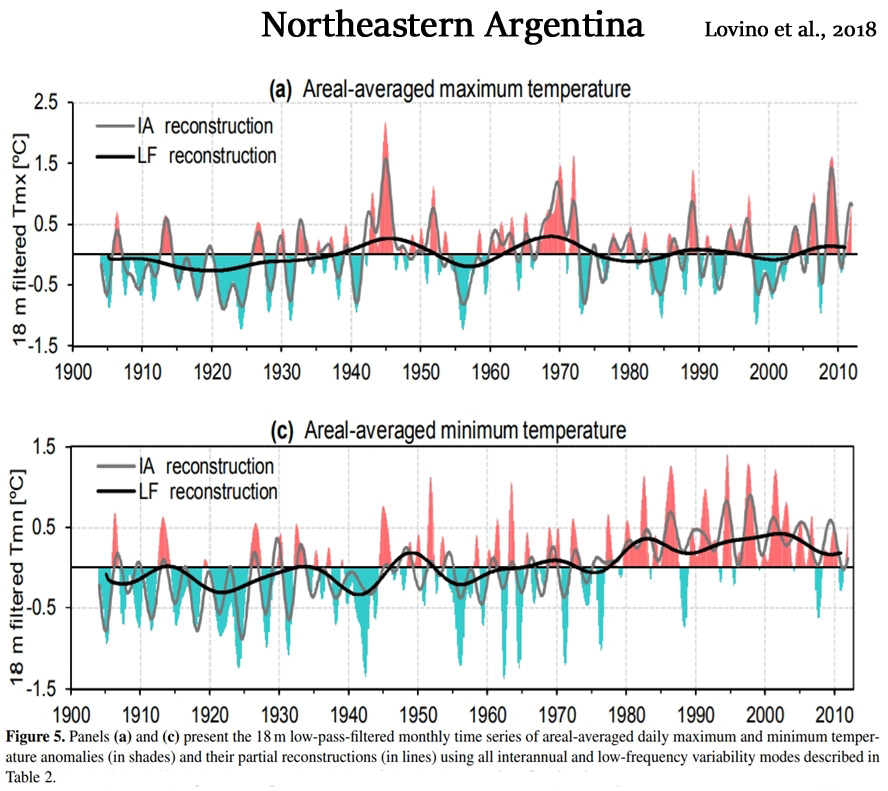
Lovino et al., 2018
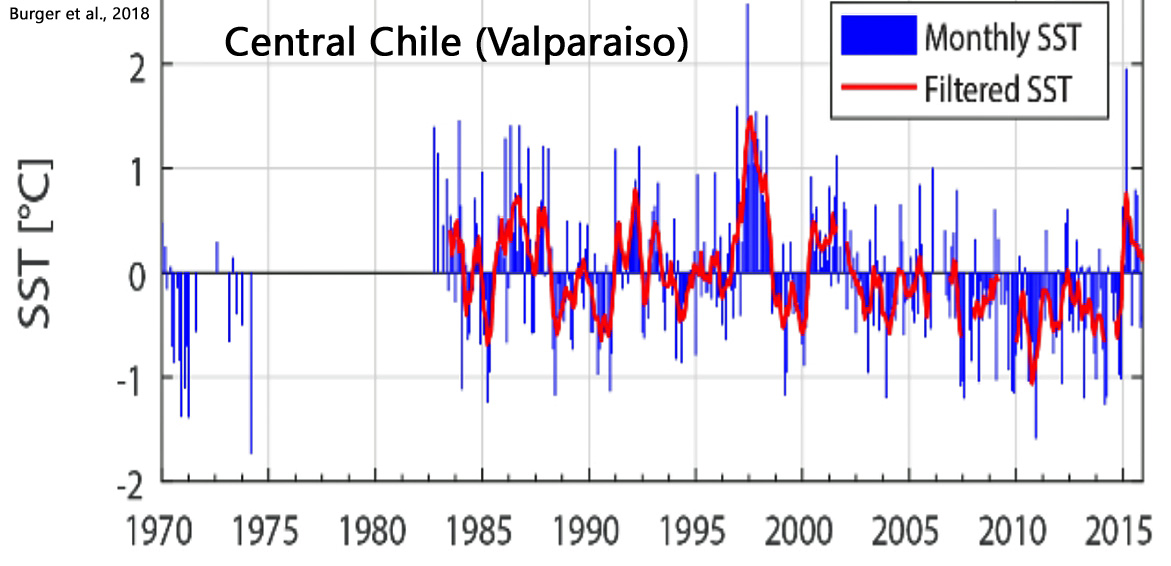
Burger et al., 2018
“Previous studies have identified spatial and temporal trends in temperature and precipitation in Chile over recent decades. Temperature rose significantly during the mid to late 20th century in coastal locations between 18 to 33 °S (Rosenblüth et al., 1997), but then started to decrease, with a cooling trend up to -0.20ºC decade-1 dominating over the past 20-30 years (Falvey and Garreaud, 2009).”
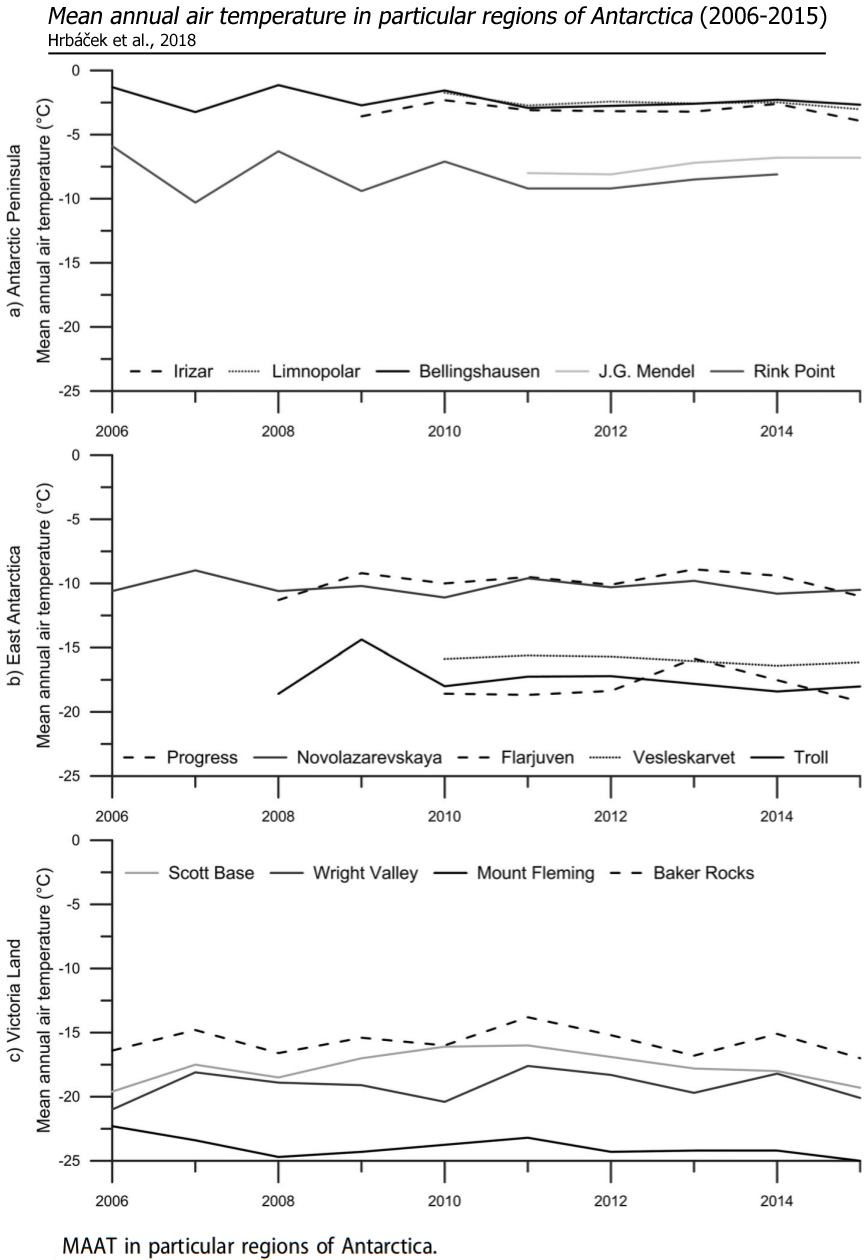
Hrbáček et al., 2018
“Active layer monitoring in Antarctica: an overview of results from 2006 to 2015 … Air temperatures showed significant regional differences within the study areas. In the western Antarctic Peninsula region, Vestfold Hills and northern Victoria Land, a slight air temperature cooling was detected, while at other sites in Victoria Land and East Antarctica the air temperature was more irregular, showing no strong overall trend of warming or cooling during the study period (Figure 2). The Antarctic Peninsula region has been reported as the most rapidly warming part of Antarctica (e.g. Turner et al., 2005, 2014),but cooling has been reported since 2000 (Turner et al., 2016). Relatively stable air temperature conditions during the past 20 years were reported in Victoria Land (Guglielmin & Cannone, 2012).”
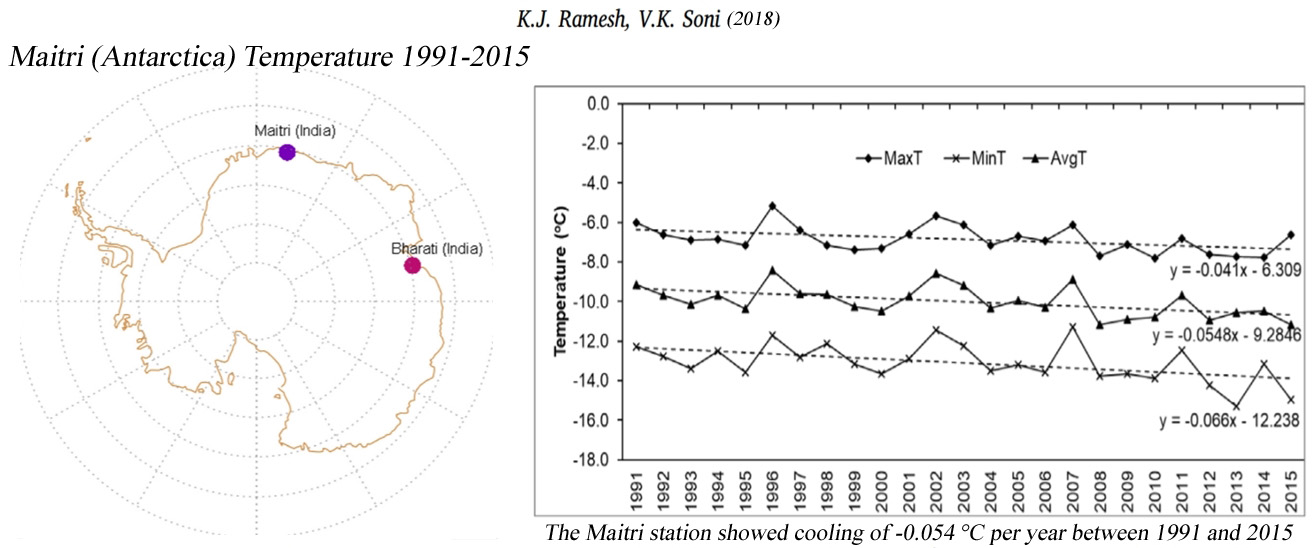
Ramesh and Soni, 2018
“The present paper reviews the progress of India’s scientific research in polar meteorology. The analysis of 25 years meteorological data collected at Maitri station for the period 1991–2015 is presented in the paper. The observed trend in the temperature data of 19 Antarctic stations obtained from READER project for the period 1991–2015 has also been examined. The 25 years long term temperature record shows cooling over Maitri station. The Maitri station showed cooling of 0.054 °C per year between 1991 and 2015, with similar pronounced seasonal trends. The nearby Russian station Novolazarevskaya also showed a cooling trend of 0.032 °C per year. … The temperature trend in average temperature of 19 Antarctica stations is also examined to ascertain the extent of cooling or warming trend (Supplementary Table_S1). The majority of stations in East Antarctica close to the coast show cooling or no significant trend. … Turner et al. (2016) using stacked temperature record found a significant cooling trend for the Antarctic Peninsula for the period 1999–2014.”
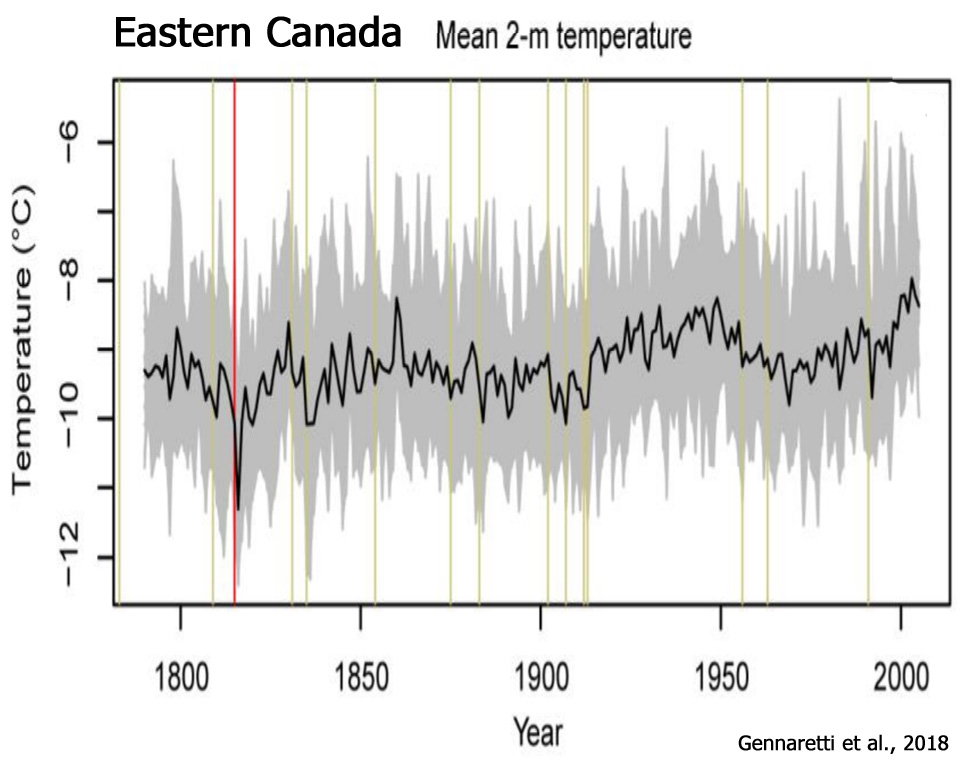
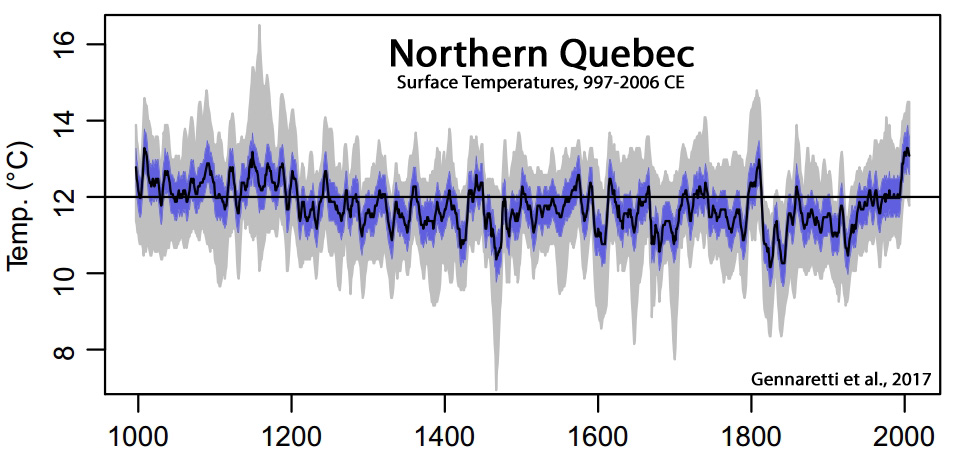
Gennaretti et al., 2018
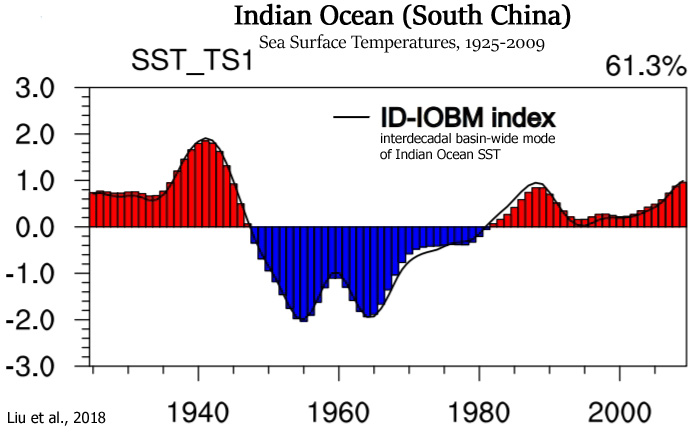
Liu et al., 2018
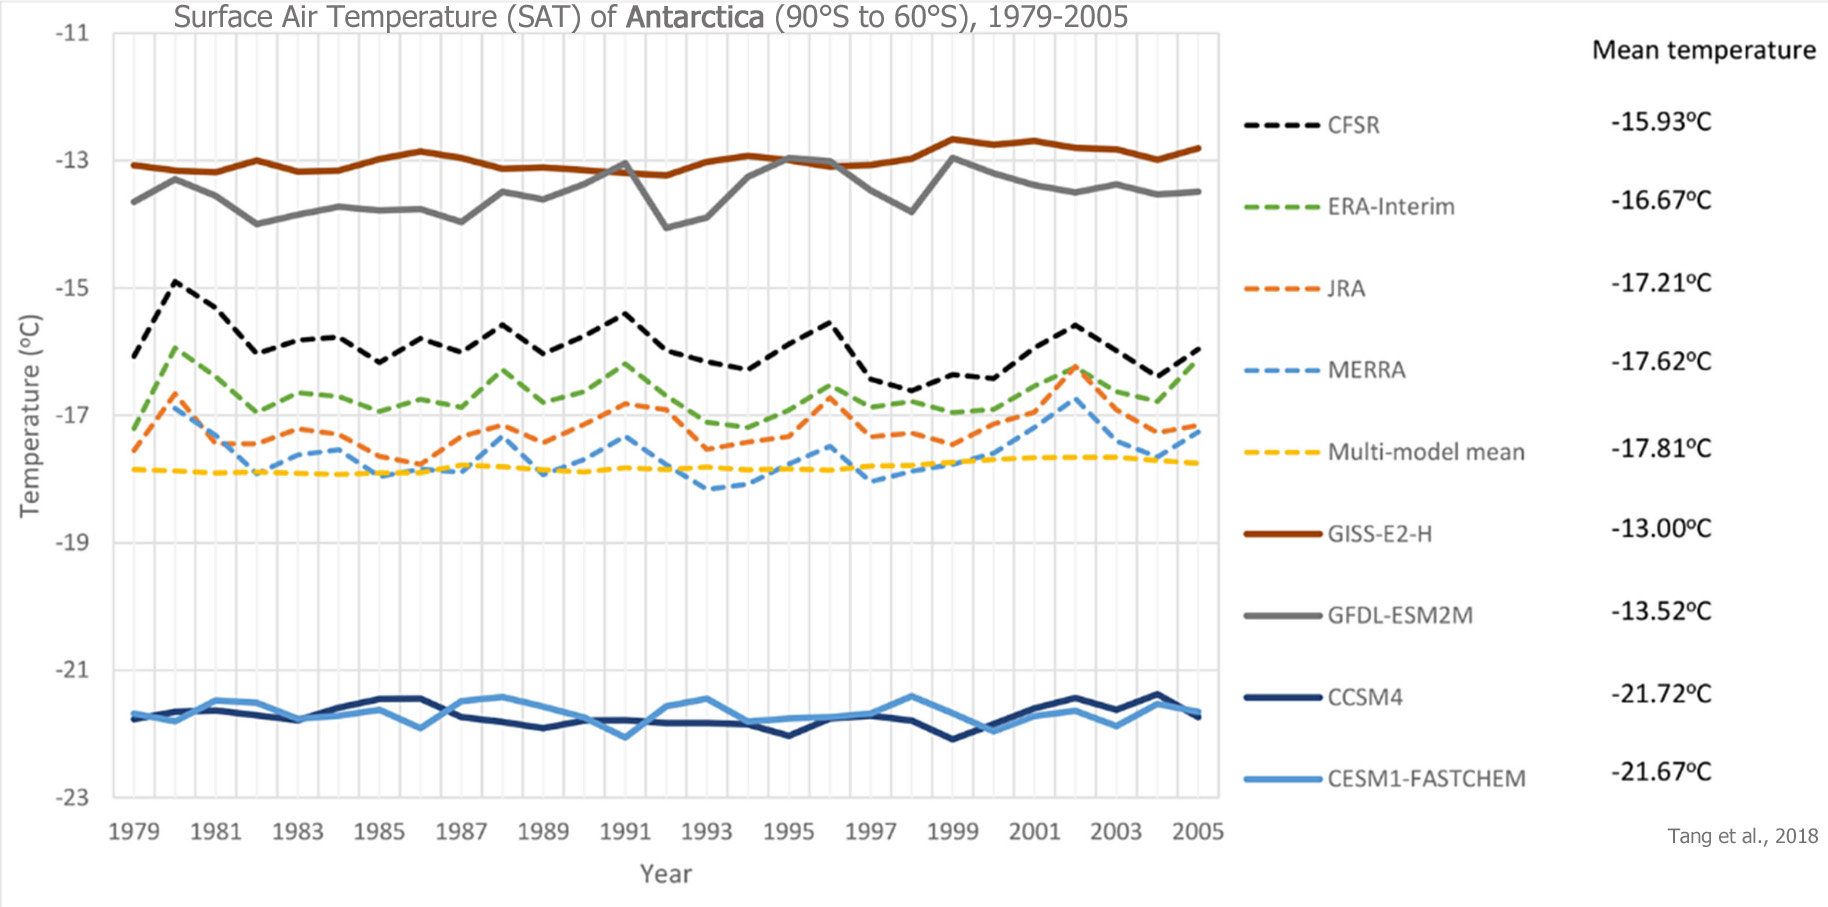
Tang et al., 2018
“The study of Antarctic precipitation has attracted a lot of attention recently. The reliability of climate models in simulating Antarctic precipitation, however, is still debatable. This work assess the precipitation and surface air temperature (SAT) of Antarctica (90°S to 60°S) using 49 Coupled Model Intercomparison Project phase 5 (CMIP5) global climate models”
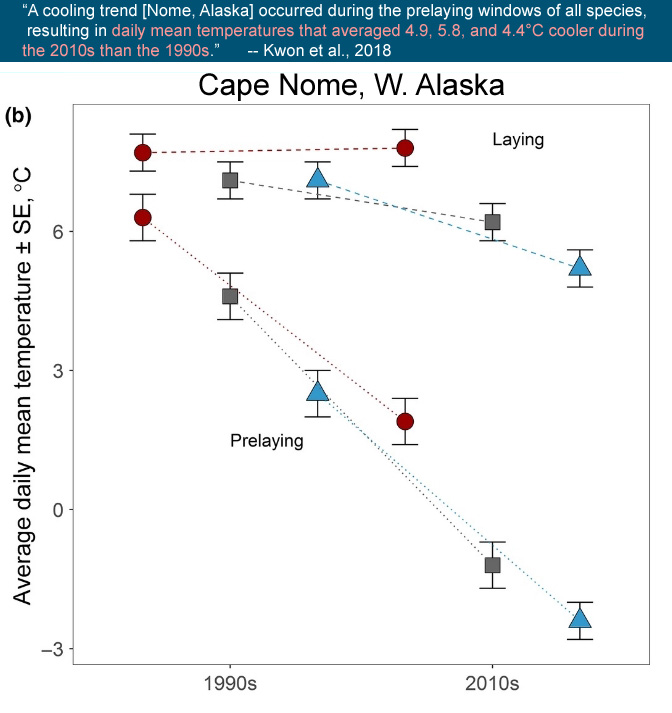
Kwon et al., 2018
“We monitored 1,378 nests of western sandpipers, semipalmated sandpipers, and red‐necked phalaropes at a subarctic site during 1993–1996 and 2010–2014. … We found an unexpected long‐term cooling trend during the early part of the breeding season. Three species delayed clutch initiation by 5 days in the 2010s relative to the 1990s. … A cooling trend occurred during the prelaying windows of all species, resulting in daily mean temperatures that averaged 4.9, 5.8, and 4.4°C cooler during the 2010s than the 1990s for western sandpiper, semipalmated sandpiper, and red‐necked phalaropes, respectively.”
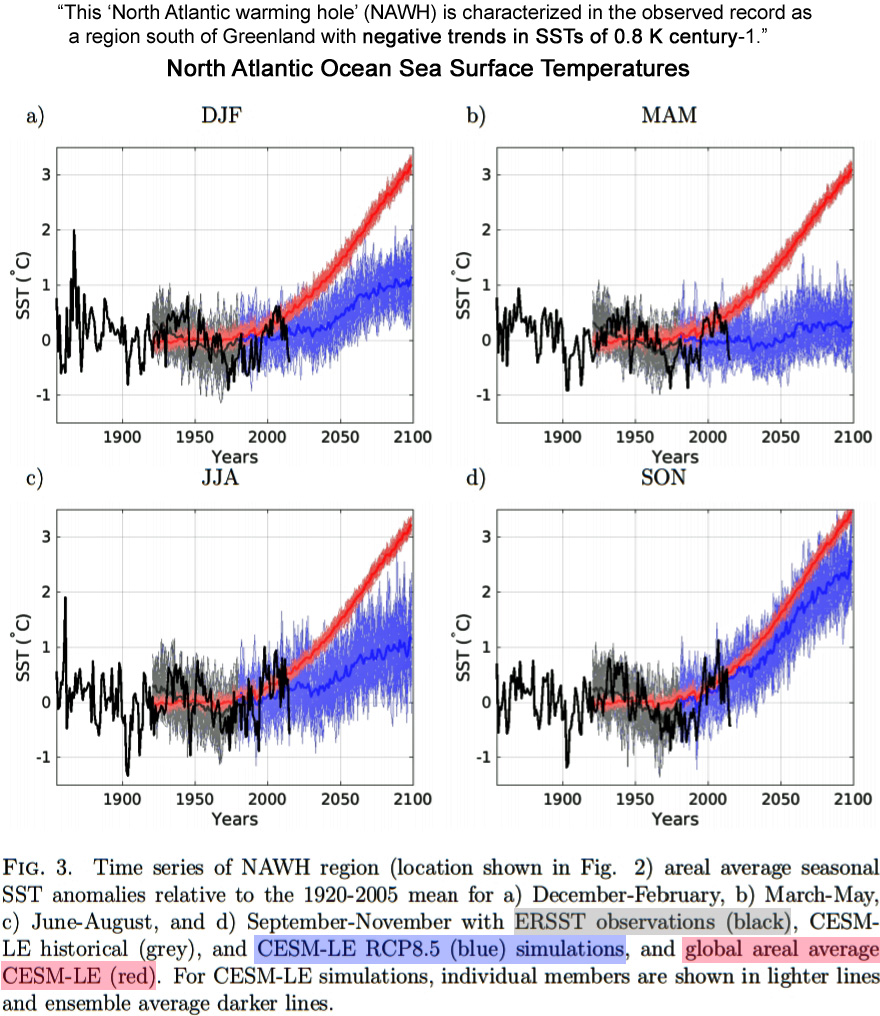
Gervais et al., 2018
“Recent studies have documented the development of a warming deficit in North Atlantic sea surface temperatures (SST) both in observations of the current climate (Rahmstorf et al. 2015; Drijfhout et al. 2012) and in future climate simulations (Drijfhout et al. 2012; Marshall et al. 2015; Woollings et al. 2012). “This “North Atlantic warming hole” (NAWH) is characterized in the observed record as a region south of Greenland with negative trends in SSTs [cooling] of 0.8 K century-1 (Rahmstorf et al. 2015).”
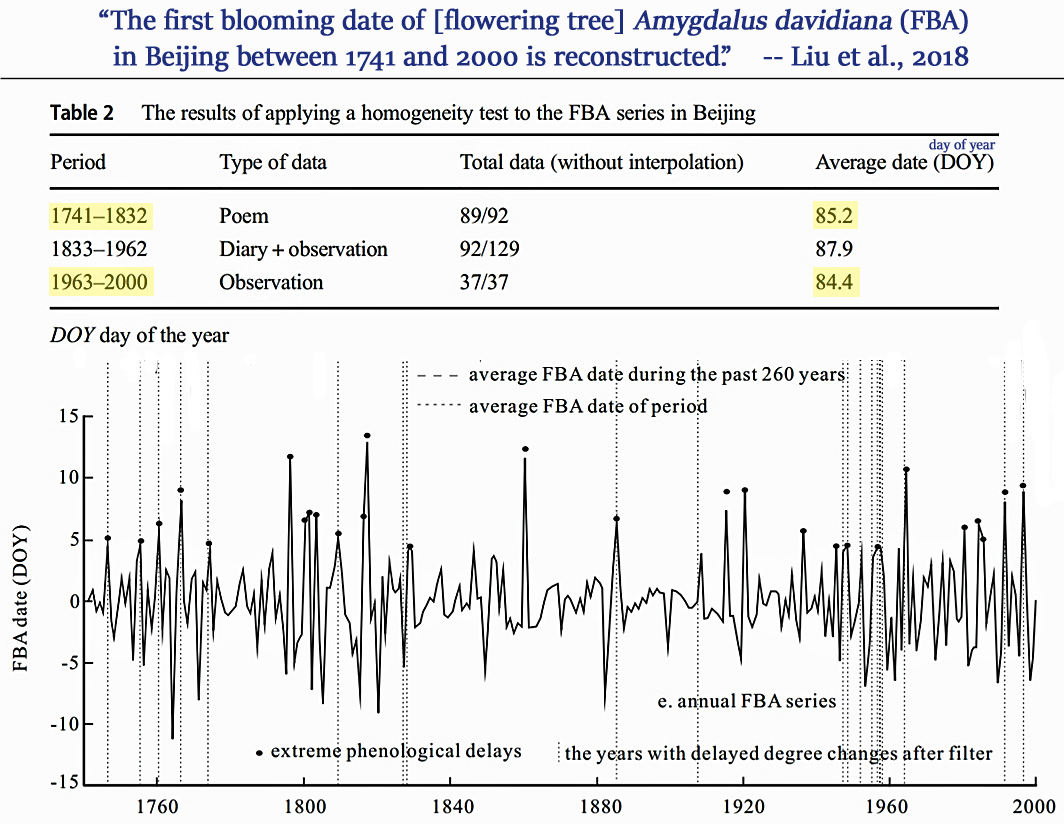
Liu et al., 2018
“Plant phenology is an important natural indicator of climate change (Körner and Basler 2010) and a proxy for climate reconstruction (Ge et al. 2008; Zheng et al. 2015; Fang and Chen 2015). … Based on the average of the FBA series, the original FBA series could be divided into 1 later blooming periods of A.D. 1796–1985 and 2 earlier blooming periods of A.D. 1741–1795 and A.D. 1985–2000.”
Cerrone and Fusco, 2018 (Antarctica)
“Compelling evidence indicates that the large increase in the SH sea ice, recorded over recent years, arises from the impact of climate modes and their long-term trends. The examination of variability ranging from seasonal to interdecadal scales, and of trends within the climate patterns and total Antarctic sea ice concentration (SIC) for the 32-yr period (1982–2013), is the key focus of this paper. The results herein indicate that a progressive cooling has affected the year-to-year climate of the sub-Antarctic since the 1990s.”
Fernandoy et al., 2018 (Antarctic Peninsula)
“As shown by firn core analysis, the near-surface temperature in the northern-most portion of the Antarctic Peninsula shows a decreasing trend (−0.33°C year−1) between 2008 and 2014 [-1.98°C].”
Vignon et al., 2018 (Antarctica)
“The near‐surface Antarctic atmosphere experienced significant changes during the last decades (Steig et al., 2009; Turner et al., 2006). In particular, the near‐surface air over the Western part of Antarctica exhibits one of the major warming over the globe (Bromwich et al., 2013a), with heating rates larger than 0.5 K per decade at some places. Despite a significant warming in the end of the 20th century, the Antarctic Peninsula has been slightly cooling since 1998, reflecting the high natural variability of the climate in this region (Turner et al., 2016). East Antarctica has experienced a slight cooling trend (Nicolas & Bromwich, 2014; Smith & Polvani, 2017) particularly marked during autumn.”
Lei et al.,2018 (N, NE, SE China)
“The authors analyzed the observed winter surface air temperature in eastern mainland China during the recent global warming hiatus period through 1998-2013. The results suggest a substantial cooling trend of about -1.0°/decade in Eastern China, Northeast China and Southeast China.”
Dahal et al., 2018 (Illinois, USA)
“Illinois ranks either first or second in soybean production and second in corn production among the Midwestern states, with more than 75% of its land used for crop production. Agriculture defines the economy and the social structure of the state. Any changes in climate, temperature and rainfall is expected to affect the Midwestern states and their agricultural productivity. This study shows us that the climate change has not yet manifested itself in the state of Illinois. Any changes in temperature observed in the last 60 years have only helped towards catalyzing the agricultural productivity. Most of the stations of the state do not show significant change in the temperature parameters. Among those stations where the change is significant, the majority show a cooling trend. It was especially significant agriculturally that the summer days show cooling effect. This would imply a decreasing exposure of the crops to heat stresses. Also, it was significant that the range between the maximum and minimum daily temperature is narrowing and the average temperature is shifting towards the warmer domain without getting extreme. Thus, we can safely conclude that over the second half of the twentieth century, the temperature has shown characteristics that are very encouraging for the farmers of Illinois.”

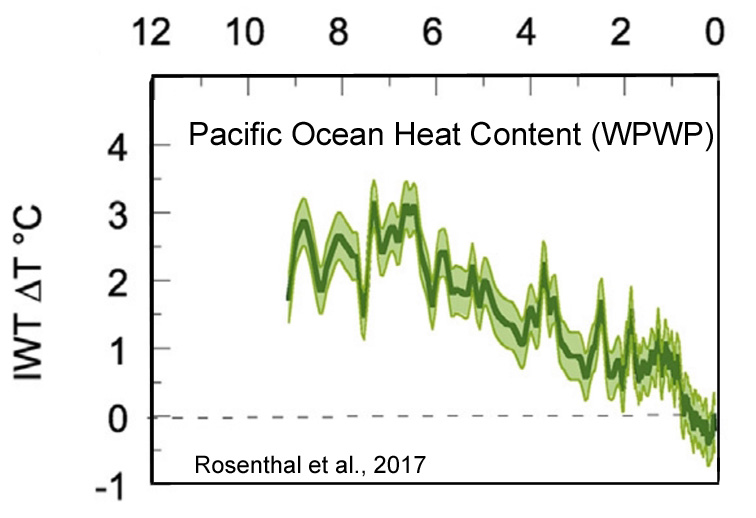
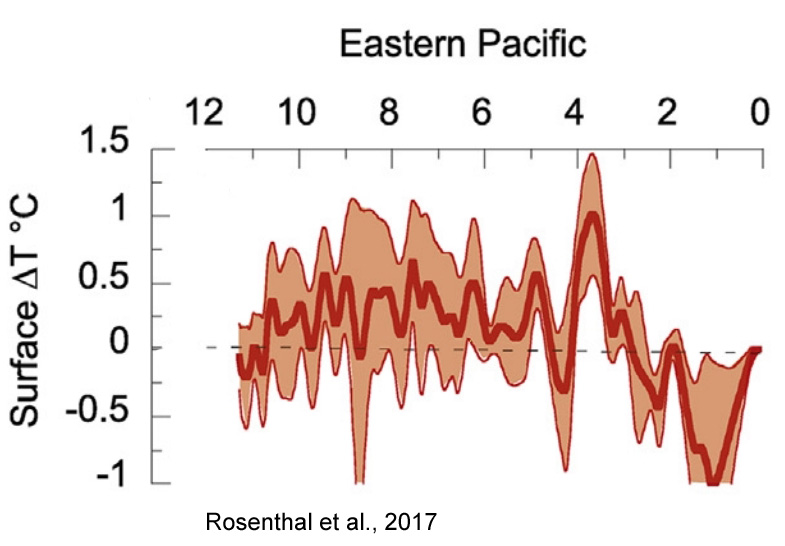
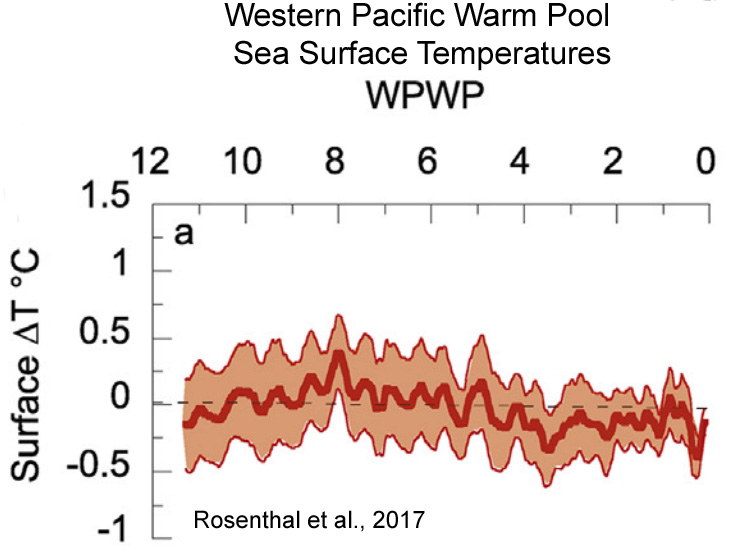
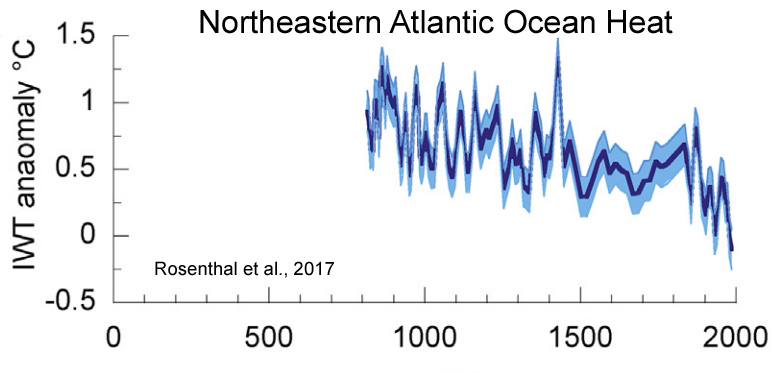
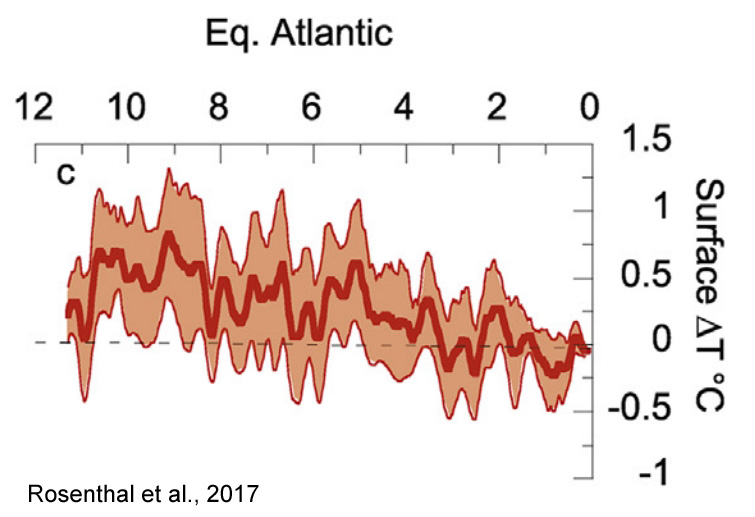
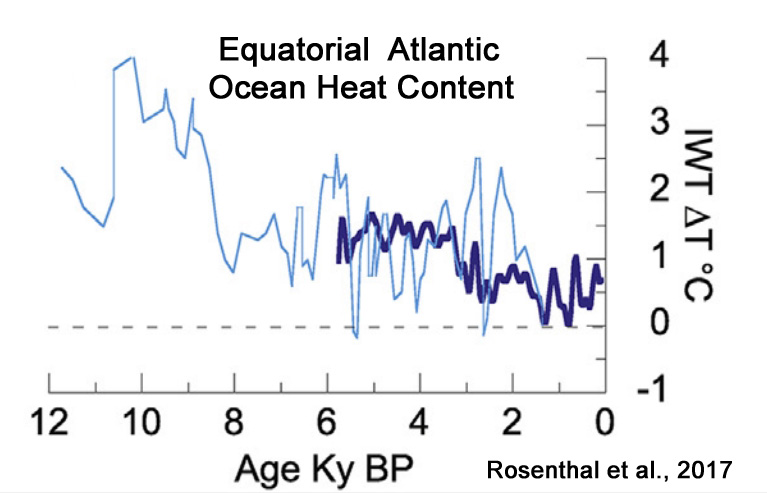
Rosenthal et al., 2017
“Here we review proxy records of intermediate water temperatures from sediment cores and corals in the equatorial Pacific and northeastern Atlantic Oceans, spanning 10,000 years beyond the instrumental record. These records suggests that intermediate waters [0-700 m] were 1.5-2°C warmer during the Holocene Thermal Maximum than in the last century. Intermediate water masses cooled by 0.9°C from the Medieval Climate Anomaly to the Little Ice Age. These changes are significantly larger than the temperature anomalies documented in the instrumental record. The implied large perturbations in OHC and Earth’s energy budget are at odds with very small radiative forcing anomalies throughout the Holocene and Common Era. … The records suggest that dynamic processes provide an efficient mechanism to amplify small changes in insolation [surface solar radiation] into relatively large changes in OHC.”
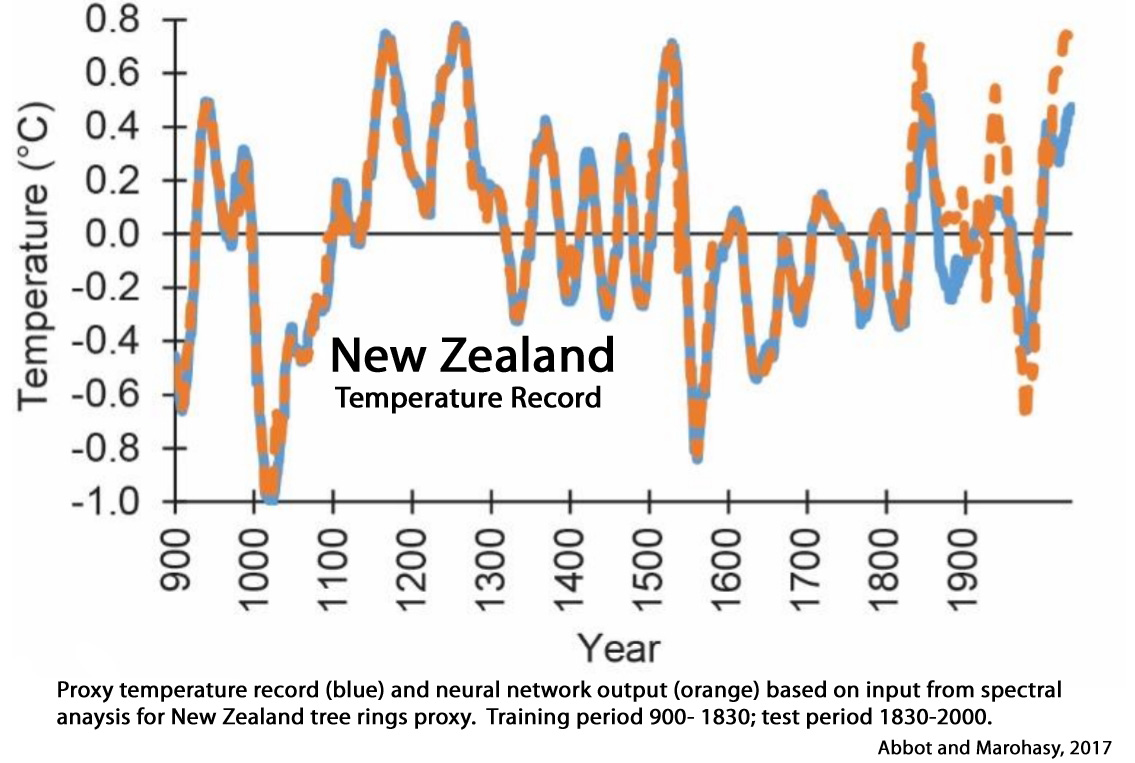
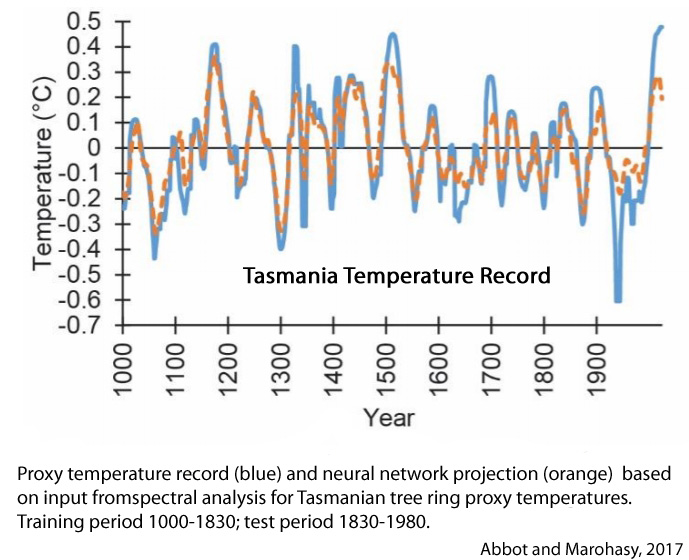
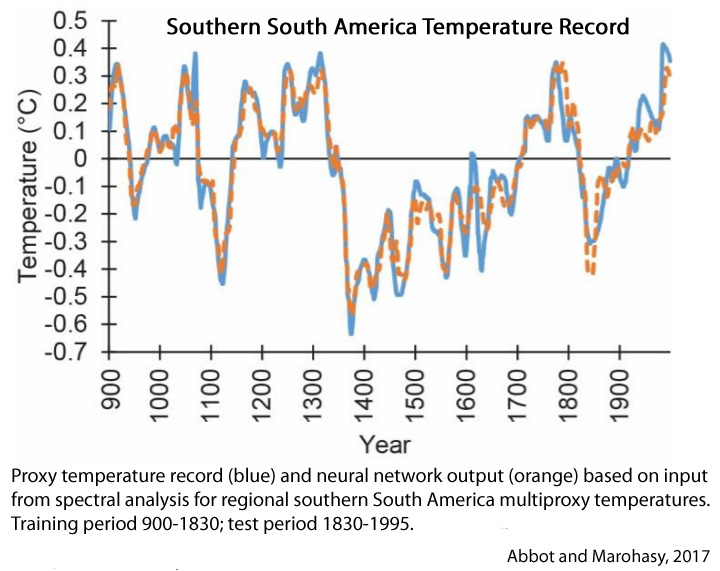
Abbot and Marohasy, 2017
“The proxy measurements suggest New Zealand’s climate has fluctuated within a band of approximately 2°C since at least 900 AD, as shown in Figure 2. The warming of nearly 1°C since 1940 falls within this band. The discrepancy between the orange and blue lines in recent decades as shown in Figure 3, suggests that the anthropogenic contribution to this warming [1°C since 1940] could be in the order of approximately 0.2°C. [80% of the warming since 1940 may be due natural factors]. … [T]he increase in temperature over the last 100 years can be largely attributed to natural phenomena.”
Gennaretti et al., 2017
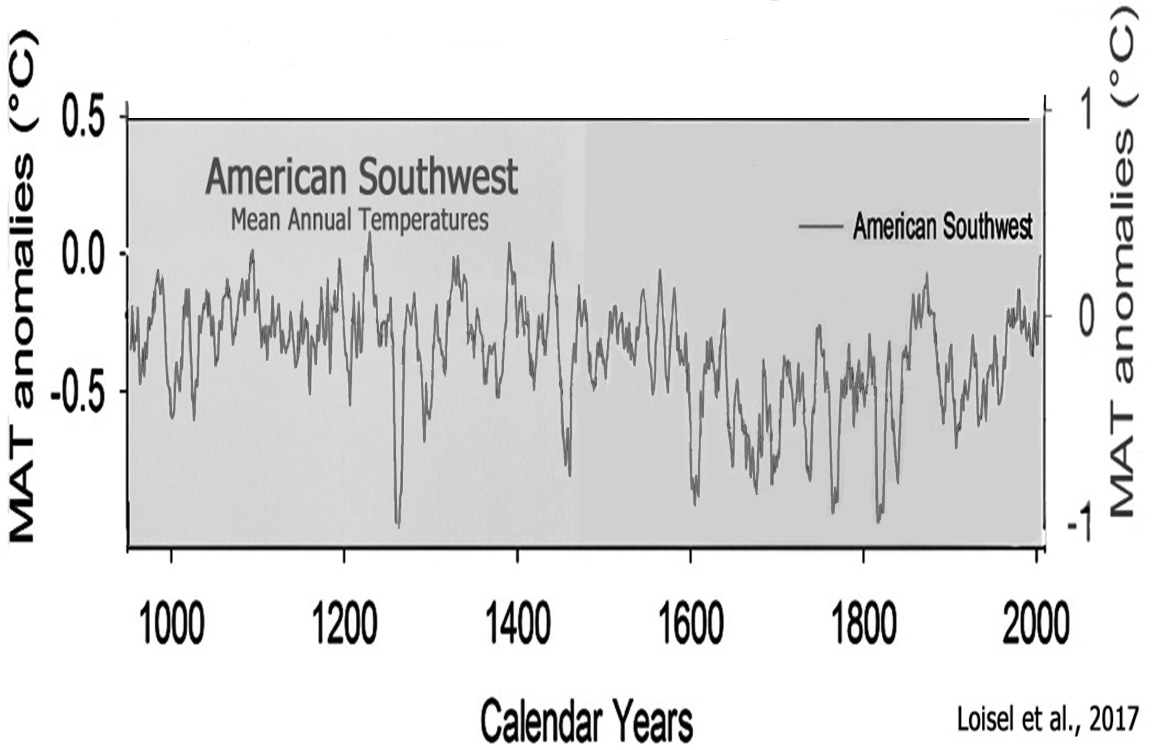
Loisel et al., 2017
“In this study, we demonstrate that the Little Ice Age (LIA, ~1400–1850 CE) might be more representative of future hydroclimatic variability than the conditions during the MCA megadroughts for the American Southwest, and thus provide a useful scenario for development of future water-resource management and drought and flood hazard mitigation strategies.”
Kong et al., 2017
“The general SST [sea surface temperatures] variation pattern matches well with total solar irradiance (TSI) changes.”

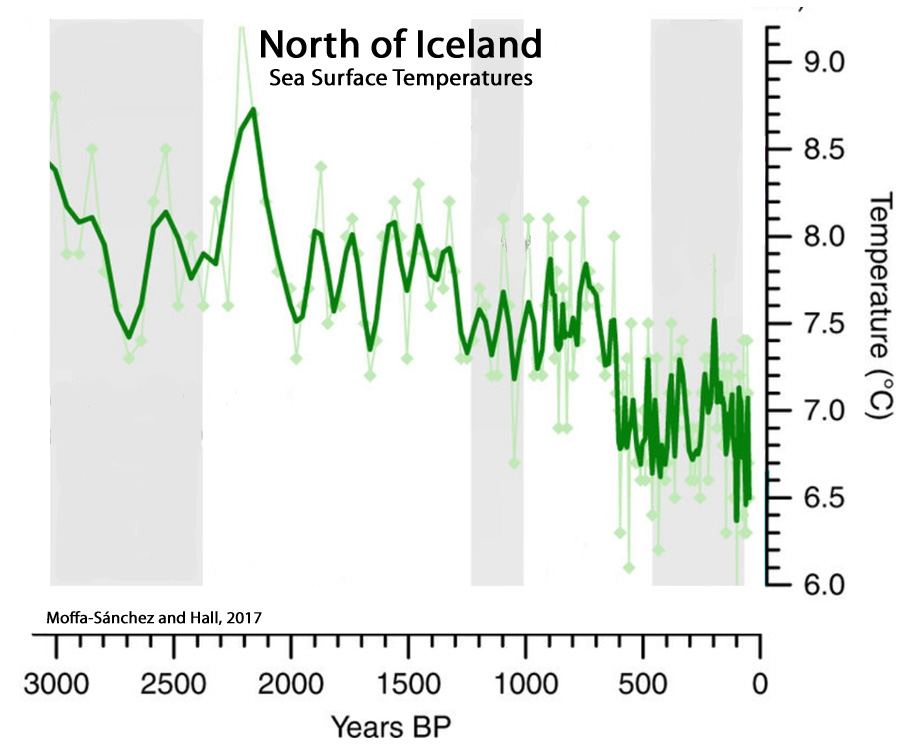
Moffa-Sánchez and Hall, 2017
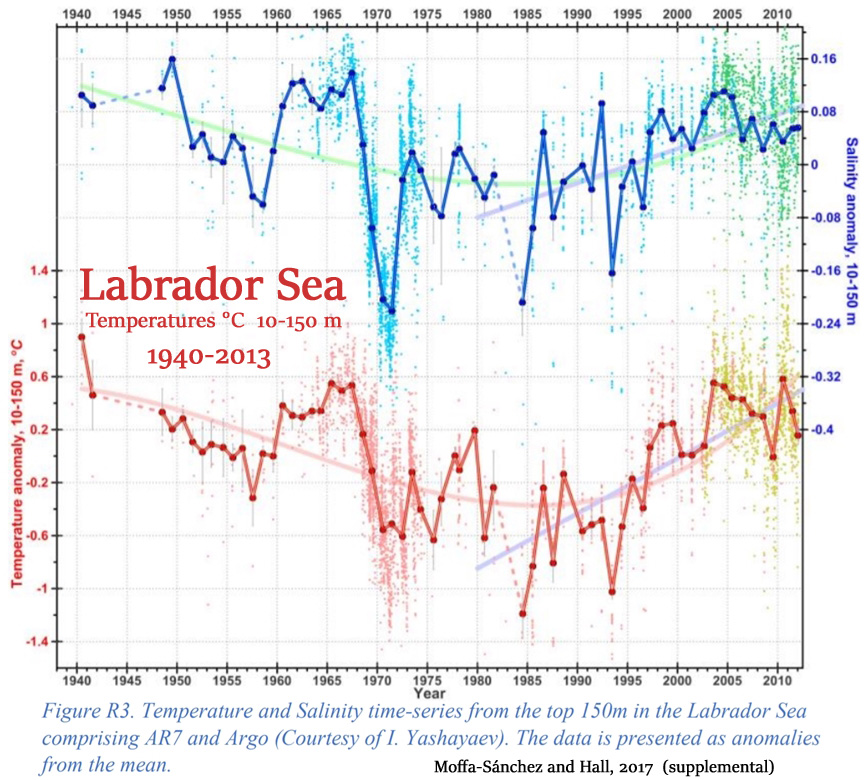
Moffa-Sánchez and Hall, 2017 (supplemental)
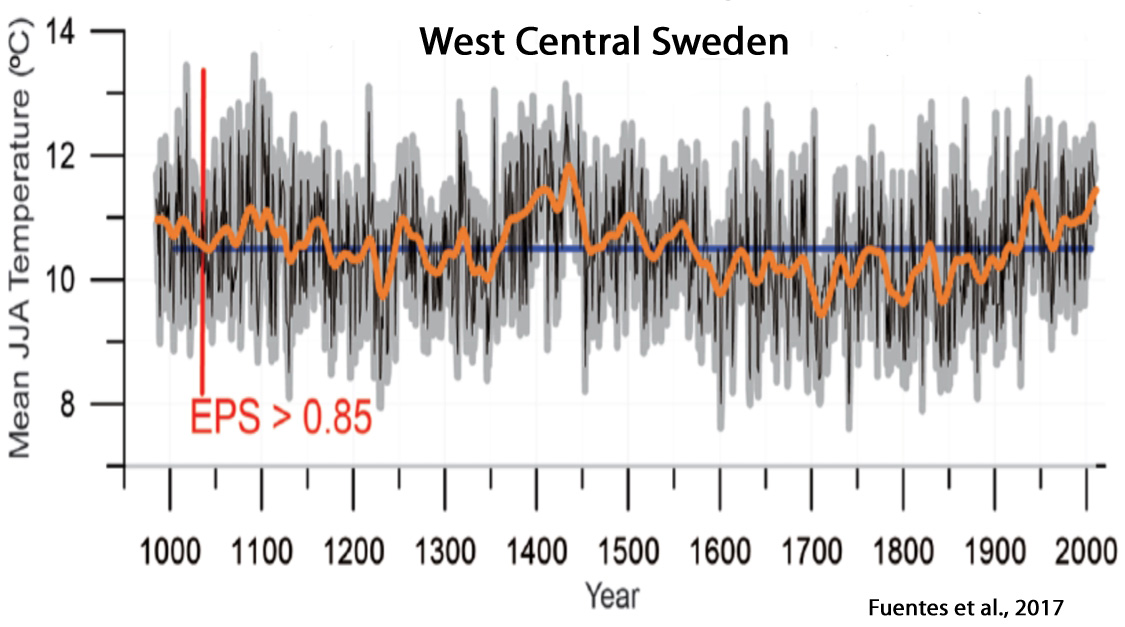
Fuentes et al., 2017
“The summer (June through August) temperature reconstruction, extending back to 1038 CE, exhibits three warm periods in 1040–1190 CE, 1370–1570 CE and the 20th century and one extended cold period between 1570 and 1920 CE.”
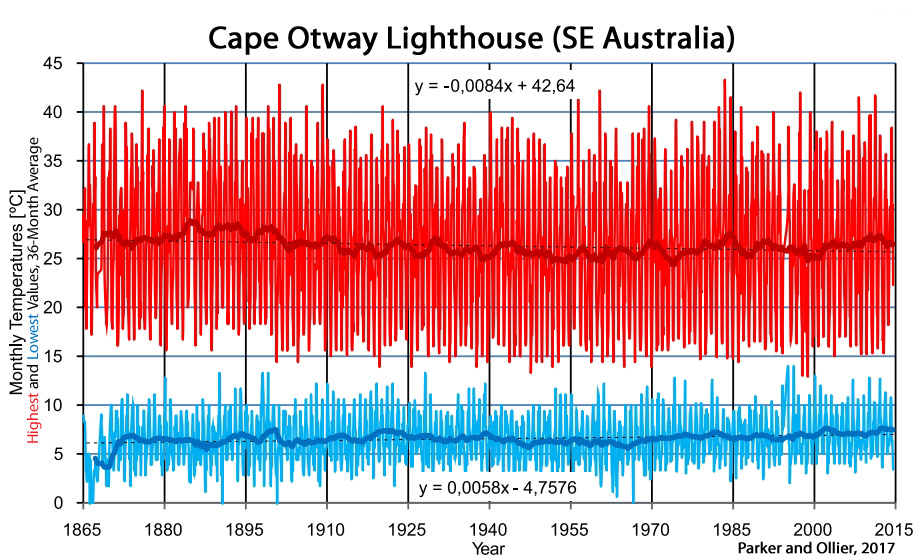
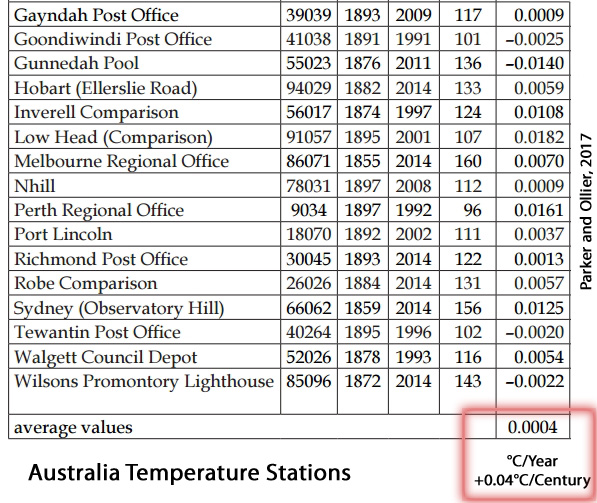
Parker and Ollier, 2017
“The Global Historical Climatology Network (GHCN) v2 temperature time series (GISS Surface Temperature Analysis, 2012) in Alice Spring and all the 36 other stations located in a circle of 1,000 km from Alice Spring do not show any warming. There are stations covering different time windows having very close patterns of temperatures. In this circle of 3,141,593 km2 (roughly 50% of Australia) that is mostly underdeveloped, none of the stations […] has a warming trend. … Table 1 presents the warming trend for the 30 longest temperature records of Australia collected in a single location, with measurements started before 1900 and continued until after 1985. … In the 30 locations, the monthly mean maximum temperature is warming 0.0004°C/year, or 0.04°C/century. That means there is no change within the limits of accuracy of the measurements.”

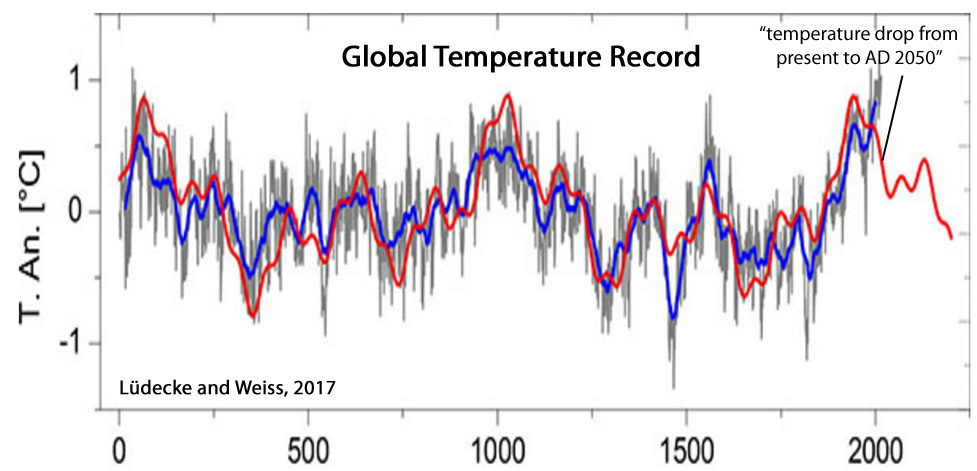
Lüdecke and Weiss, 2017
“By wavelet analysis, a new proof has been provided that at least the ~190-year climate cycle has a solar origin. … G7 [global temperature over the last 2000 years], and likewise the sine representations have maxima of comparable size at AD 0, 1000, and 2000. We note that the temperature increase of the late 19th and 20th century is represented by the harmonic temperature representation, and thus is of pure multiperiodic nature. It can be expected that the periodicity of G7, lasting 2000 years so far, will persist also for the foreseeable future. It predicts a temperature drop from present to AD 2050, a slight rise from 2050 to 2130, and a further drop from AD 2130 to 2200.”
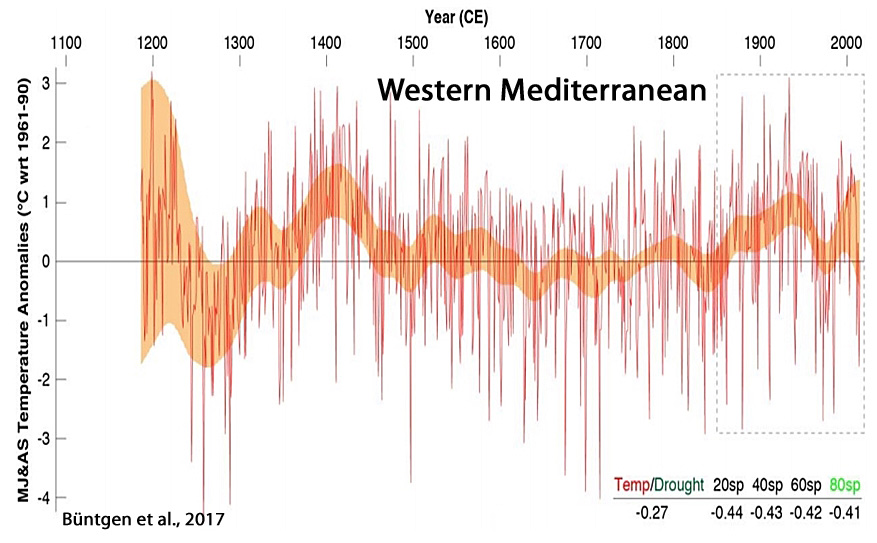
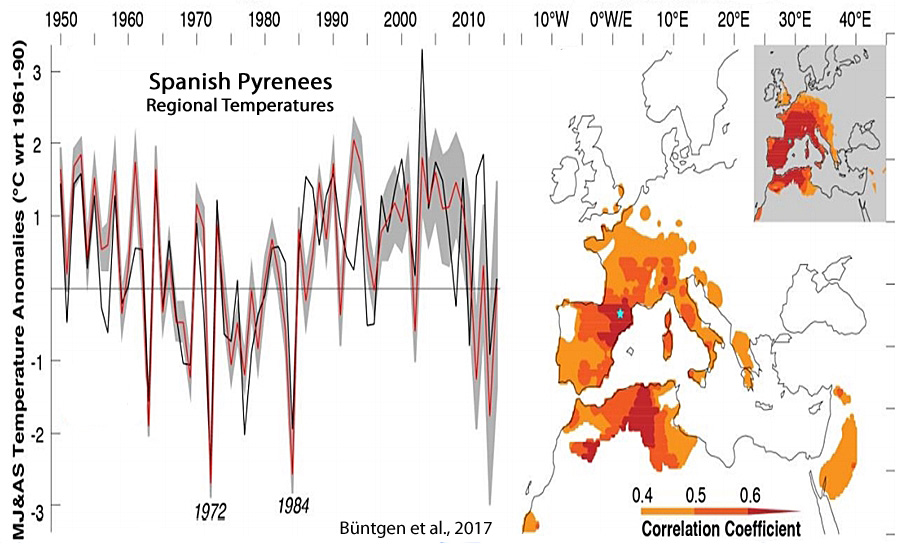
Büntgen et al., 2017
“Spanning the period 1186-2014 CE, the new reconstruction reveals overall warmer conditions around 1200 and 1400, and again after ~1850. … Little agreement is found with climate model simulations that consistently overestimate recent summer warming and underestimate pre-industrial temperature changes. … [W]hen it comes to disentangling natural variability from anthropogenically affected variability the vast majority of the instrumental record may be biased. …
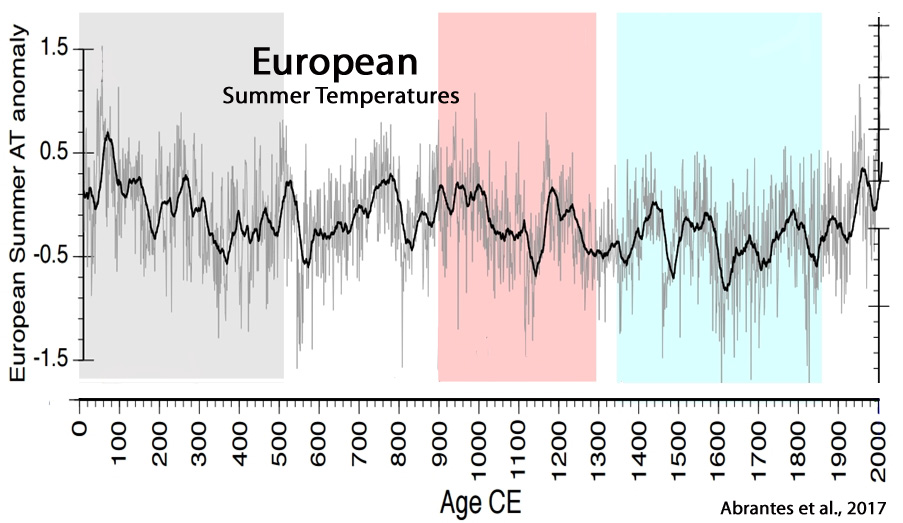
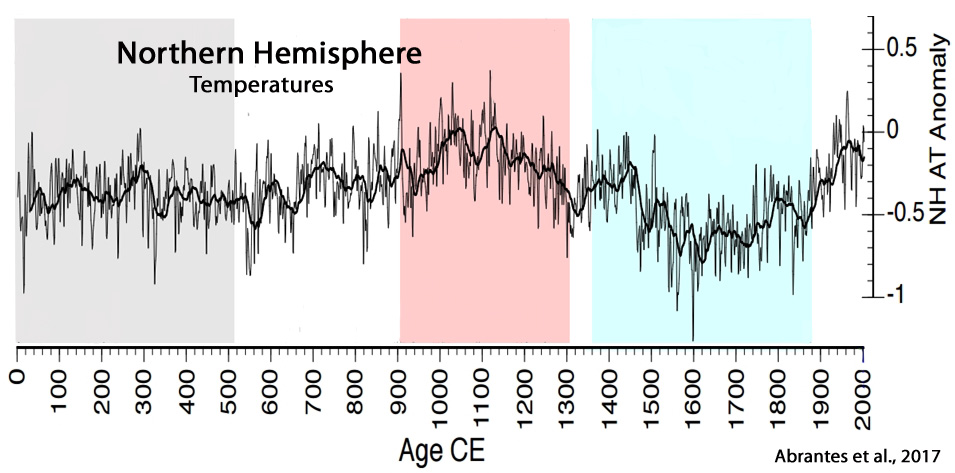
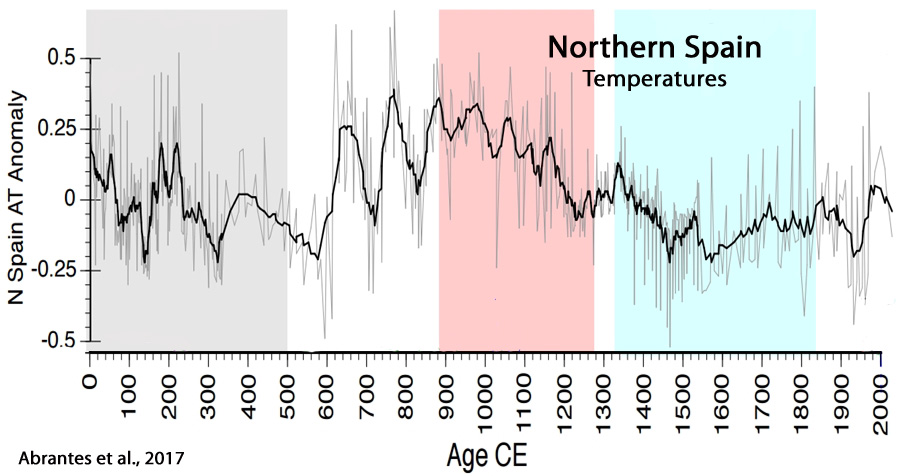
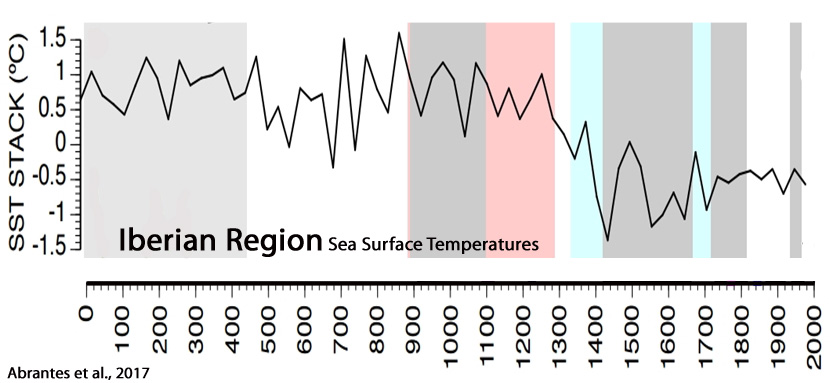
Abrantes et al., 2017
“The transition from warm to colder climatic conditions occurs around 1300 CE associated with the Wolf solar minimum. The coldest SSTs are detected between 1350 and 1850 CE, on Iberia during the well-known Little Ice Age (LIA) (Bradley and Jones, 1993), with the most intense cooling episodes related with other solar minima events, and major volcanic forcing and separated by intervals of relative warmth (e.g. (Crowley and Unterman, 2013; Solanki et al., 2004; Steinhilber et al., 2012; Turner et al., 2016; Usoskin et al., 2011). During the 20th century, the southern records show unusually large decadal scale SST oscillations in the context of the last 2 millennia, in particular after the mid 1970’s, within the Great Solar Maximum (1940 – 2000 (Usoskin et al., 2011)) and the “greater salinity anomaly” event in the northern Atlantic (Dickson et al., 1988), or yet the higher global temperatures of the last 1.4 ky detected by (Ahmed et al., 2013).”
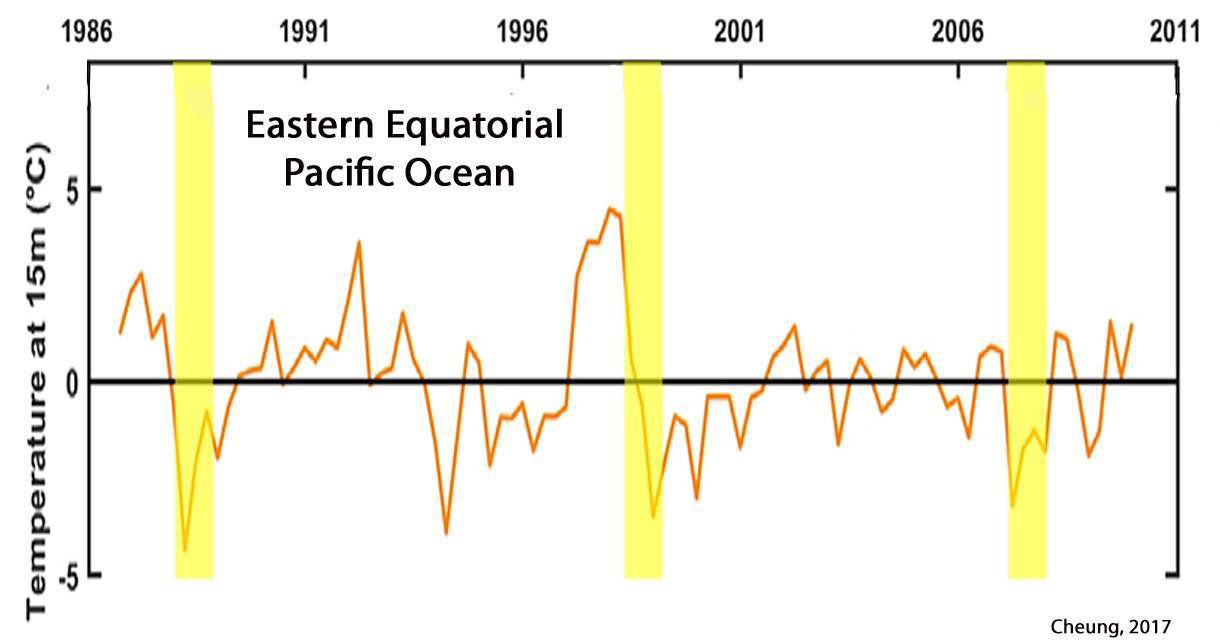
Cheung, 2017
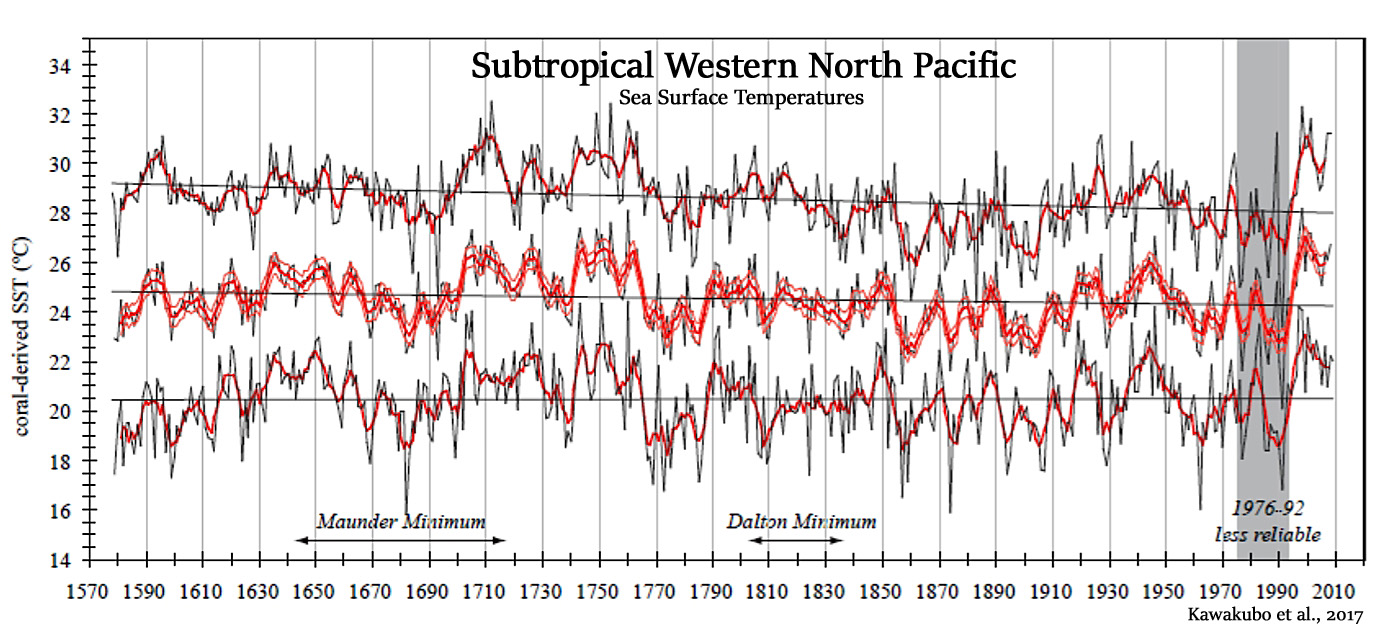
Kawakubo et al., 2017
“Spring-summer climate south of Japan is mainly controlled by solar radiation and surface heat fluxes, with lesser ocean current influence on SST, with a few exceptions as mentioned above for the summers of 1998 and 2001. … The cold period between 1660-1700 in the coral record aligns with the minimum total solar irradiance that defines the Maunder Minimum (MM) ca. 1645-1715 (Steinhilber et al., 2009).”
Werner et al., 2017

Deng et al., 2017
“The results indicate that the climate of the Medieval Climate Anomaly (MCA, AD 900–1300) was similar to that of the Current Warm Period (CWP, AD 1850–present) … As for the Little Ice Age (LIA, AD 1550–1850), the results from this study, together with previous data from the Makassar Strait, indicate a cold and wet period compared with the CWP and the MCA in the western Pacific. The cold LIA period agrees with the timing of the Maunder sunspot minimum and is therefore associated with low solar activity.”

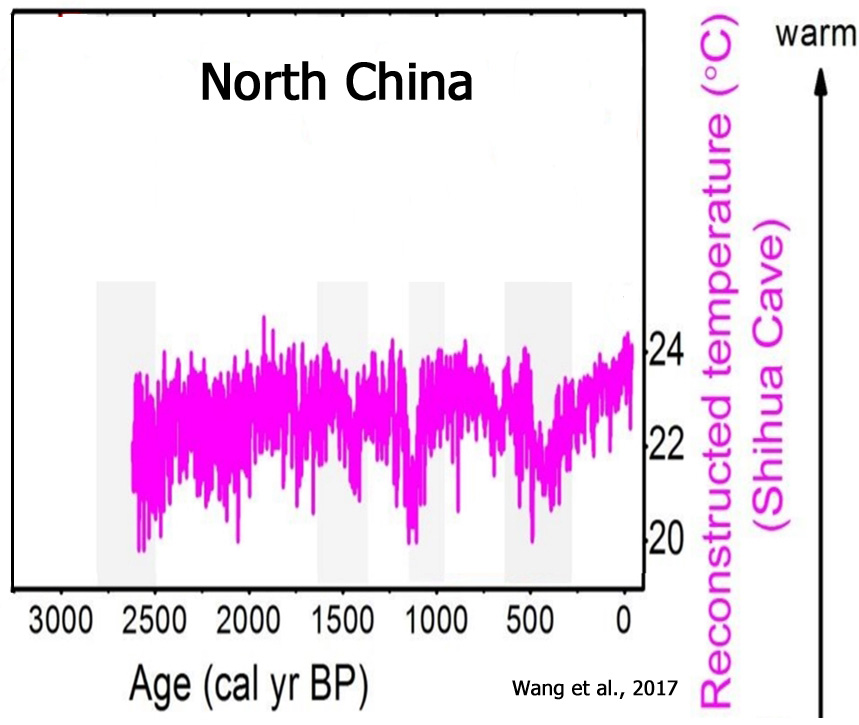
Wang et al., 2017
“Our results show that: (1) the mean annual temperature (TANN) was relatively high from 4000-2700 cal yr BP, decreased gradually from 2700-1270 cal yr BP, and then fluctuated drastically during the last 1270 years. (2) A cold climatic event in the Era of Disunity, the Sui-Tang Warm Period (STWP), the Medieval Warm Period (MWP) and the Little Ice Age (LIA) can all be recognized in the paleotemperature record, as well as in many other temperature reconstructions in China.”
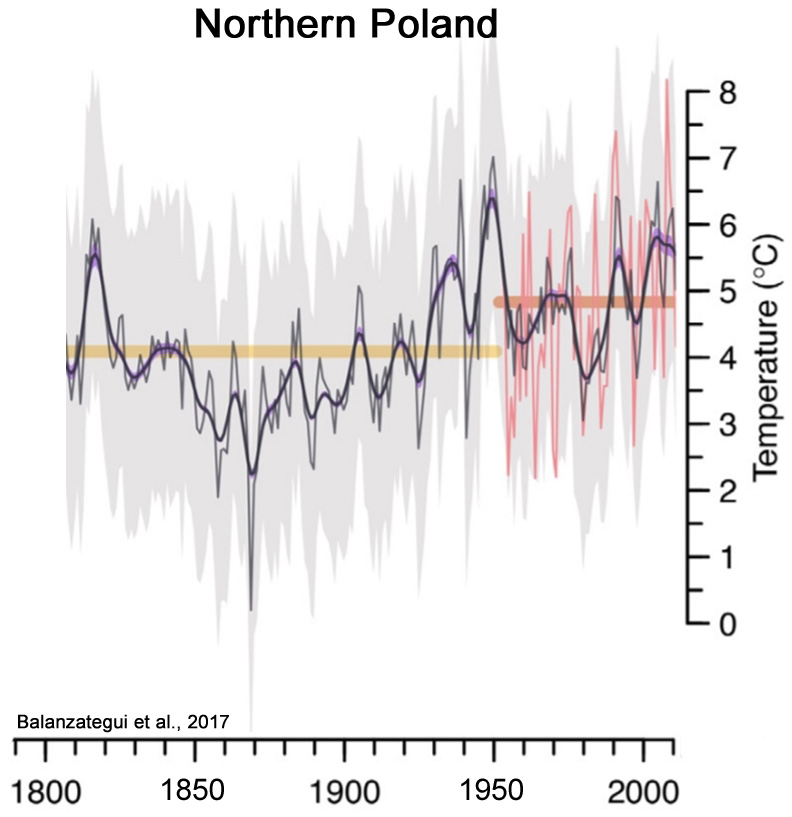
Balanzategui et al., 2017
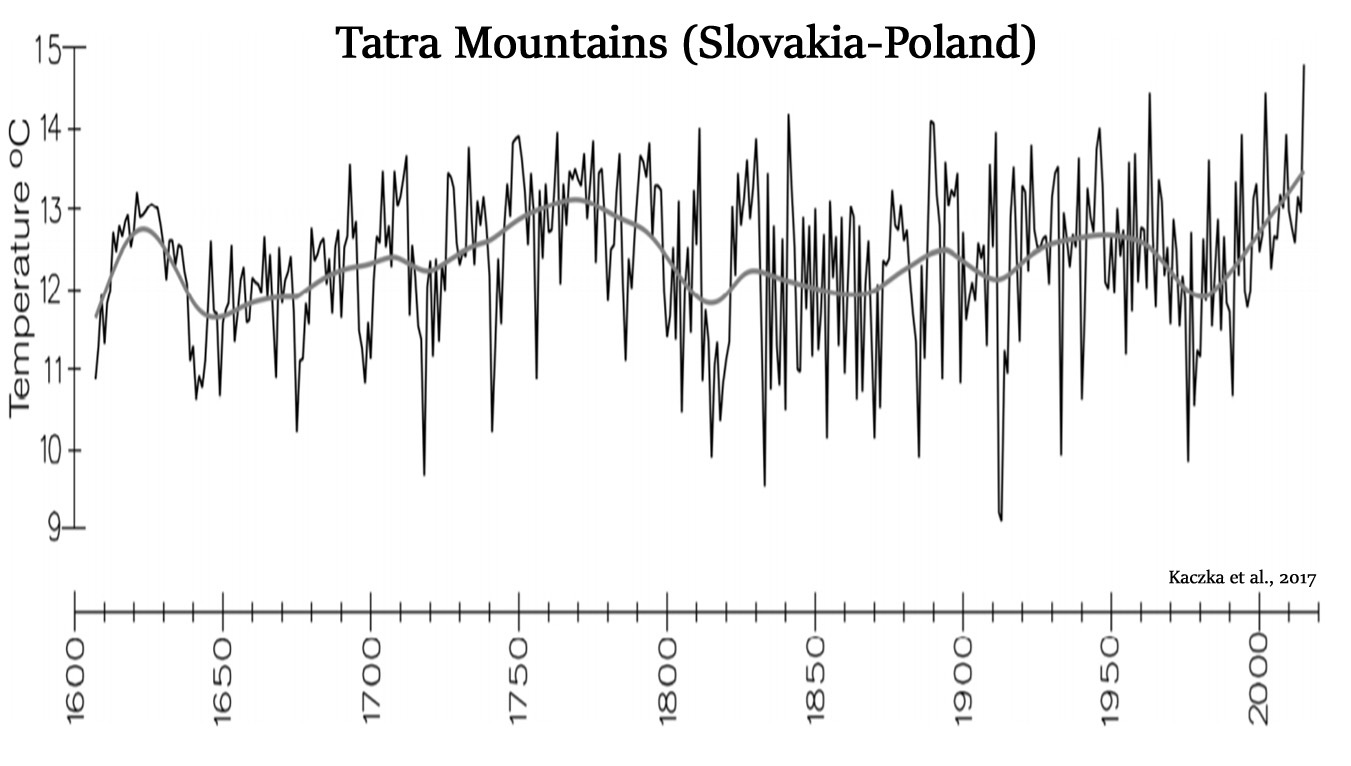
Kaczka et al., 2017
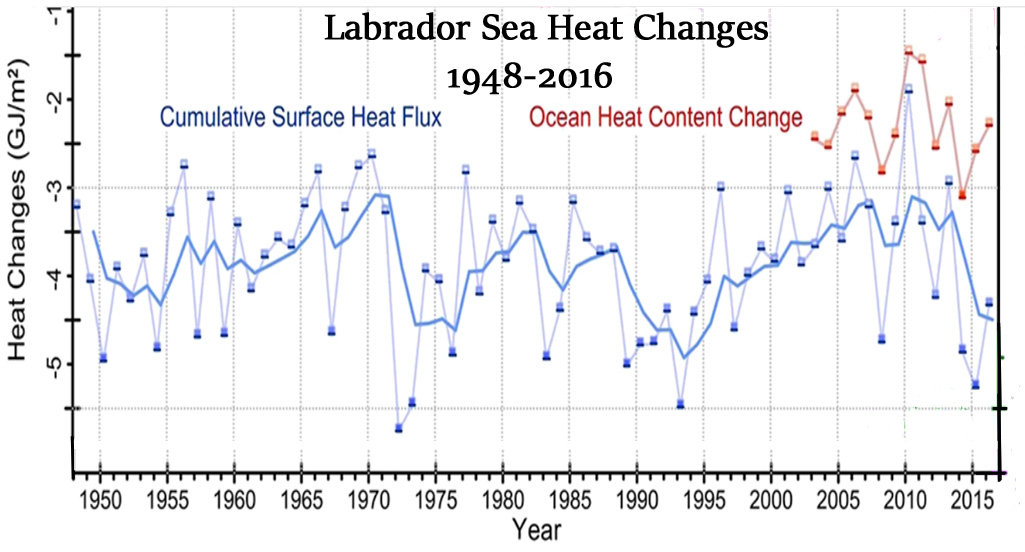
Yashayaev and Loder, 2017
“As a result of this intermittent recurrence of intensified Labrador Sea Water formation, the annual average temperature and density in the region’s upper 2000m have predominantly varied on a bi-decadal time scale, rather than having a long-term trend as might be expected from anthropogenic climate change. … [I]ntermittent recurrence of enhanced deep convection periods in the Labrador Sea, and the associated formation of major LSW classes, are contributing to a predominant decadal-scale variation in hydrographic properties which makes it difficult to determine whether anthropogenic changes are occurring. … This strong, apparently natural, decadal-scale variability makes it very difficult to determine whether significant anthropogenic changes in LSW formation and properties have occurred.”

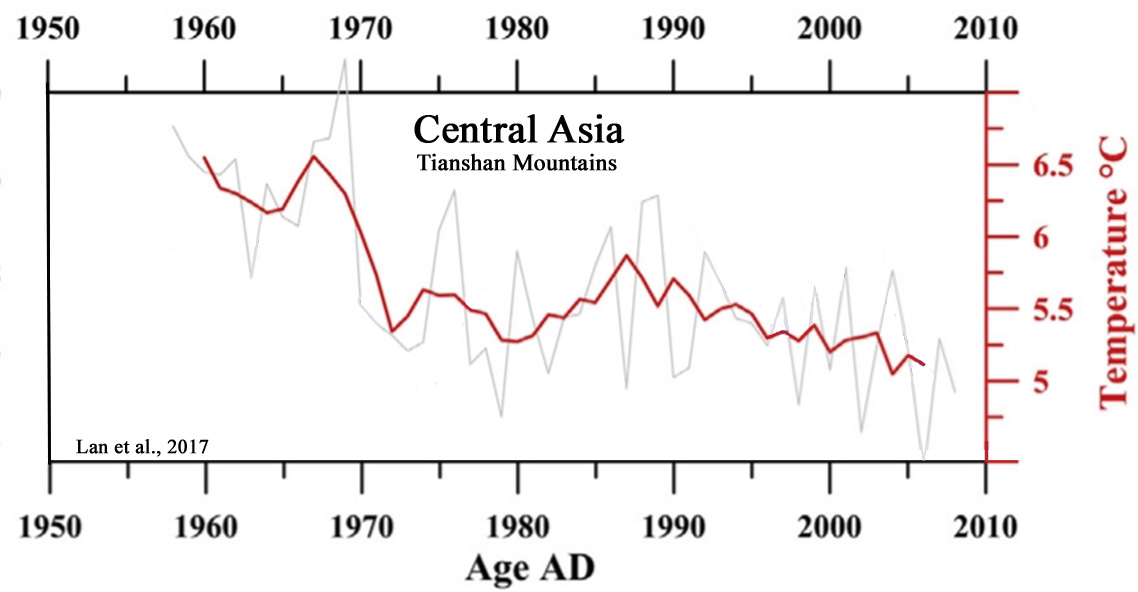
Lan et al., 2017
“The results show that the centennial HCA [High Central Asia] temperature changes not only significantly correlate with those in China (Yang et al., 2002a) and northwestern China (He et al., 2013), but also with those in Northern Hemisphere (Moberg et al., 2005; Ljungqvist, 2010), implying that the centennial HCA [High Central Asia] temperature changes may have similar driving forces with those in Northern Hemisphere at least over the past two millennia, like solar forcing (Bond et al., 2001; Gray et al., 2010; Moffa-Sanchez et al., 2014) and volcanic eruption (Schurer et al., 2014; Sigl et al., 2015; Stoffel et al., 2015), etc.”
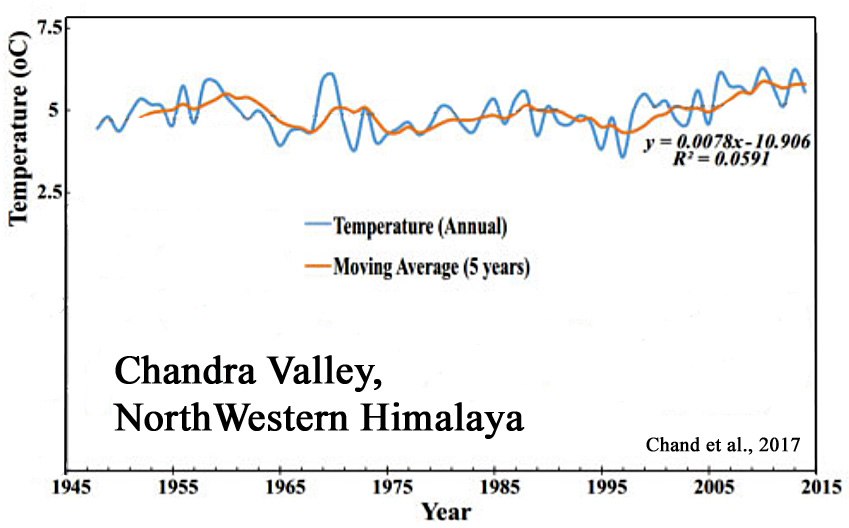
Chand et al., 2017
“The LIA [Little Ice Age] is a globally documented cooling event that began around the 13th or 14th century and culminated between the mid- 16th and mid-19th centuries. Although the cause of LIA glaciation is not fully understood, climatologists contend that reduced solar output, changes in atmospheric circulation as a result of a reversal of the North Atlantic Oscillation and explosive volcanism could have decreased the global temperature. … Based on the GSI’s repeated photographs of 1906, 1956 and 1963, and the position of the recessional moraine ridges, it is clear that the lower frontal tongue of the Bara Shigri Glacier changed significantly from 1906 to 1965 (59 years). During this period, a loss 1.8 +/- 0.52 km2 in glacier area occurred at an annual rate of 0.03 +/- 0.02km2 … The total frontal area vacated by the glacier for the period between 1965 and 2014 is 1.1 +/- 0.01 km2 with an annual rate of 0.02 +/- 0.0003 km2.” [Glacier recession was 1.8 km2 and -0.03 km2 per year for 1906-1965 (59 years), with a 30-40% deceleration to 1.1 km2 and -0.02 km2 per year for 1965-2014 (59 years)]
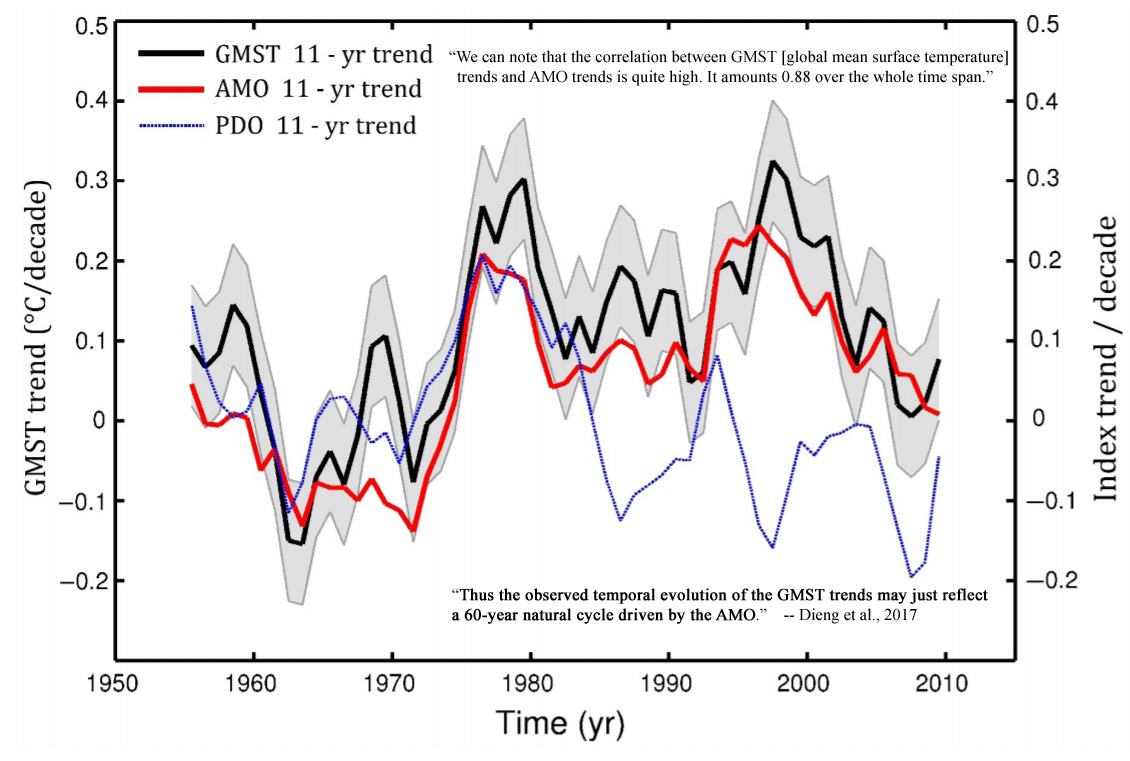
Dieng et al., 2017
“We can note that the correlation between GMST [global mean surface temperature] trends and AMO trends is quite high. It amounts 0.88 over the whole time span. At the beginning of the record, the correlation with PDO trends is also high (equal to 0.8) but breaks down after the mid-1980s. The GMST and AMO trends shown in Figure 6 show a low in the 1960s and high in the 1990s, suggestive of a 60-year oscillation, as reported for the global mean sea level by Chambers et al. (2012). Thus the observed temporal evolution of the GMST [global mean surface temperature] trends may just reflect a 60-year natural cycle driven by the AMO.”
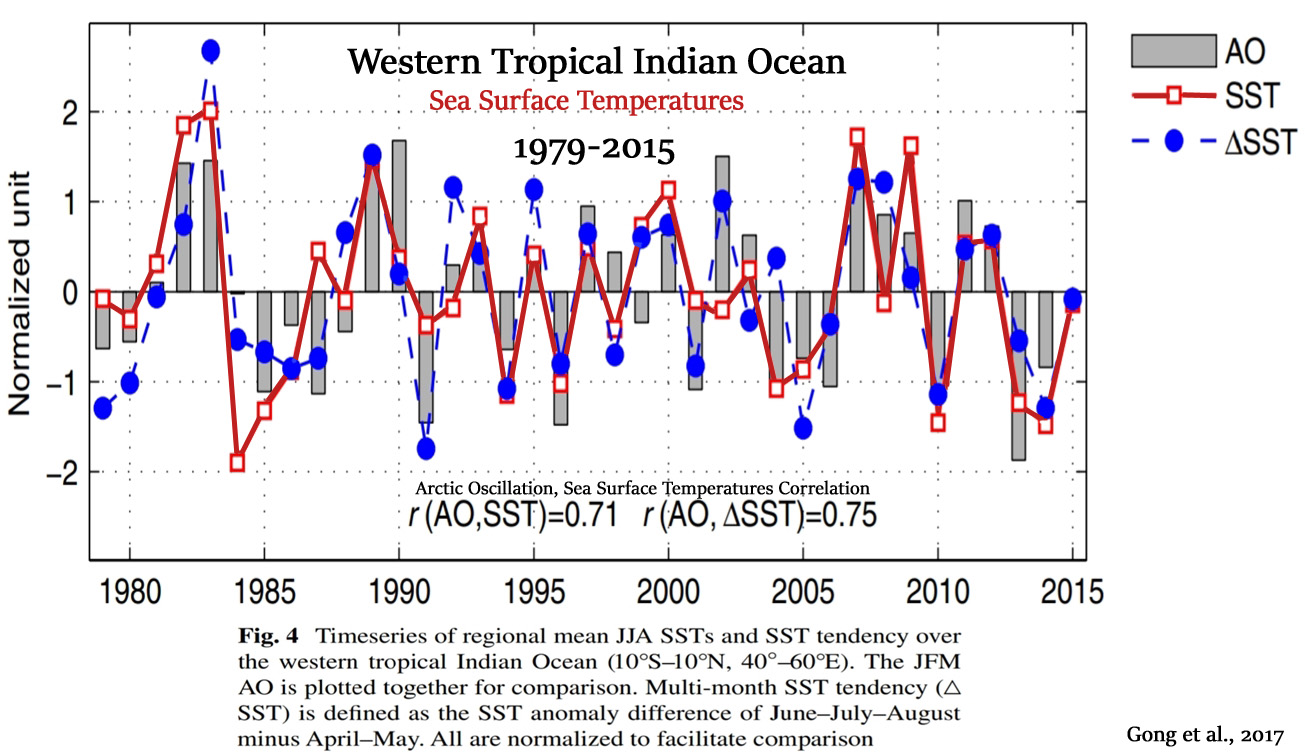
Gong et al., 2017
“The inter-annual relationship between the boreal winter Arctic Oscillation (AO) and summer sea surface temperature (SST) over the western tropical Indian Ocean (TIO) for the period from 1979 to 2015 is investigated. The results show that the January–February–March AO [Arctic Oscillation] is significantly correlated with the June–July–August SST and SST tendency.”
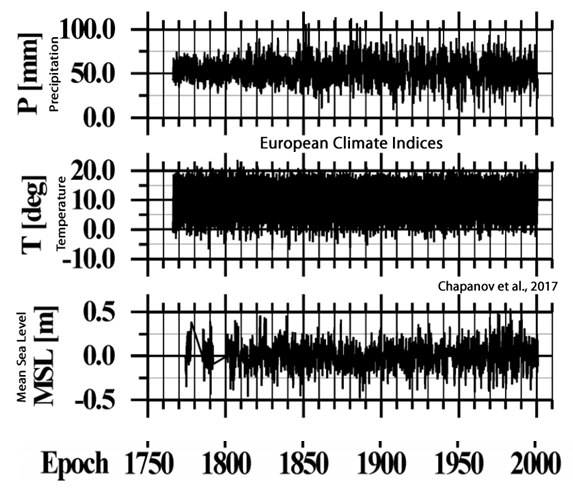
Chapanov et al., 2017
“A good agreement exists between the decadal cycles of LOD [length of day], MSL [mean sea level], climate and solar indices whose periods are between 12-13, 14-16, 16-18 and 28-33 years.”
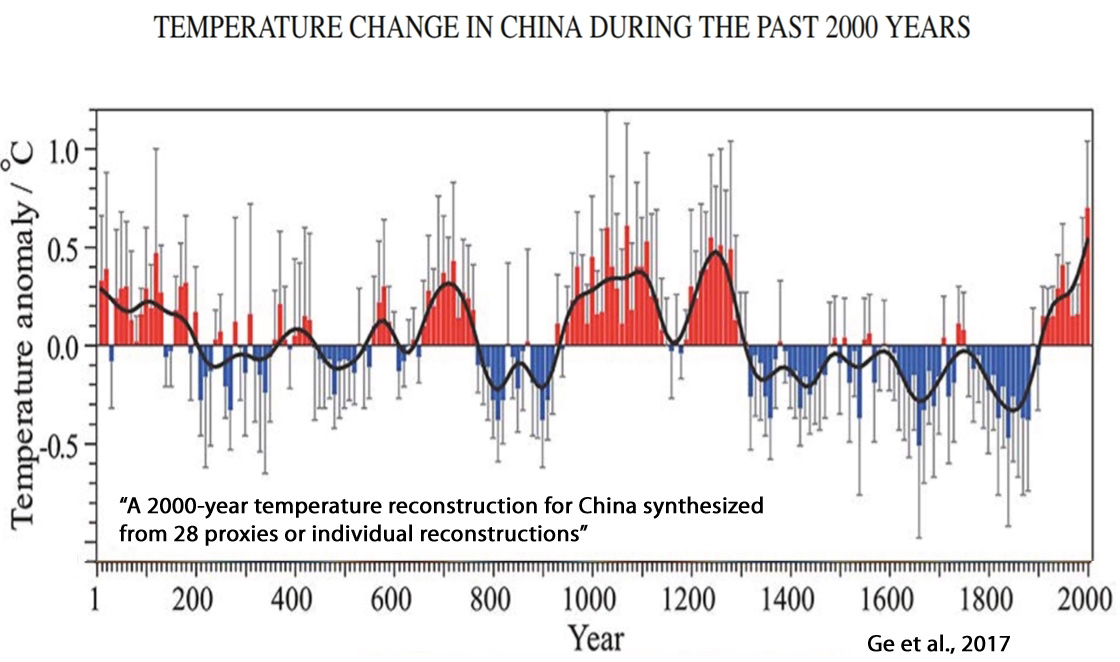
Ge et al., 2017
“This paper presents new high-resolution proxies and paleoclimatic reconstructions for studying climate changes in China for the past 2000 years. Multi-proxy synthesized reconstructions show that temperature variation in China has exhibited significant 50–70-yr, 100–120-yr, and 200–250-yr cycles. Results also show that the amplitudes of decadal and centennial temperature variation were 1.3◦C and 0.7◦C, respectively, with the latter significantly correlated with long-term changes in solar radiation, especially cold periods, which correspond approximately to sunspot minima. The most rapid warming in China occurred over AD 1870–2000, at a rate of 0.56◦ ± 0.42◦C (100 yr)−1; however, temperatures recorded in the 20th century may not be unprecedented for the last 2000 years, as data show records for the periods AD 981–1100 and AD 1201–70 are comparable to the present.”
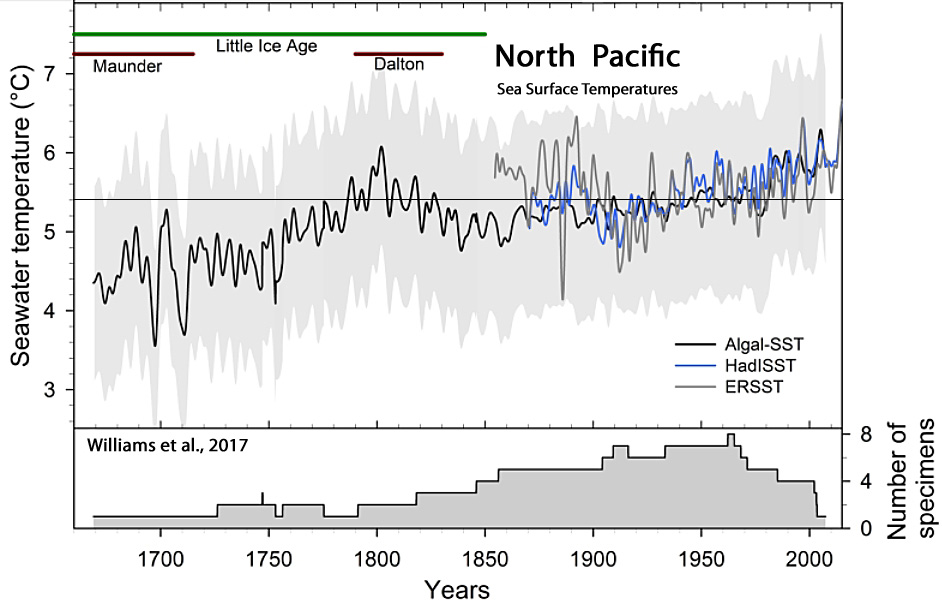
Williams et al., 2017
“Reconstructed SSTs significantly warmed 1.1°C … from 1660s to 1800 (rate of change: 0.008°C/year), followed by a significant cooling of 0.8°C … until 1840 (rate of change: 0.02°C/year), then a significant warming of 0.8°C from 1860 until the end of reconstruction in 2007 (rate of change: 0.005°C/year).” [The amplitude of sea surface temperature warming and cooling was higher and more rapid from 1660s-1800 than from 1860-2007.]
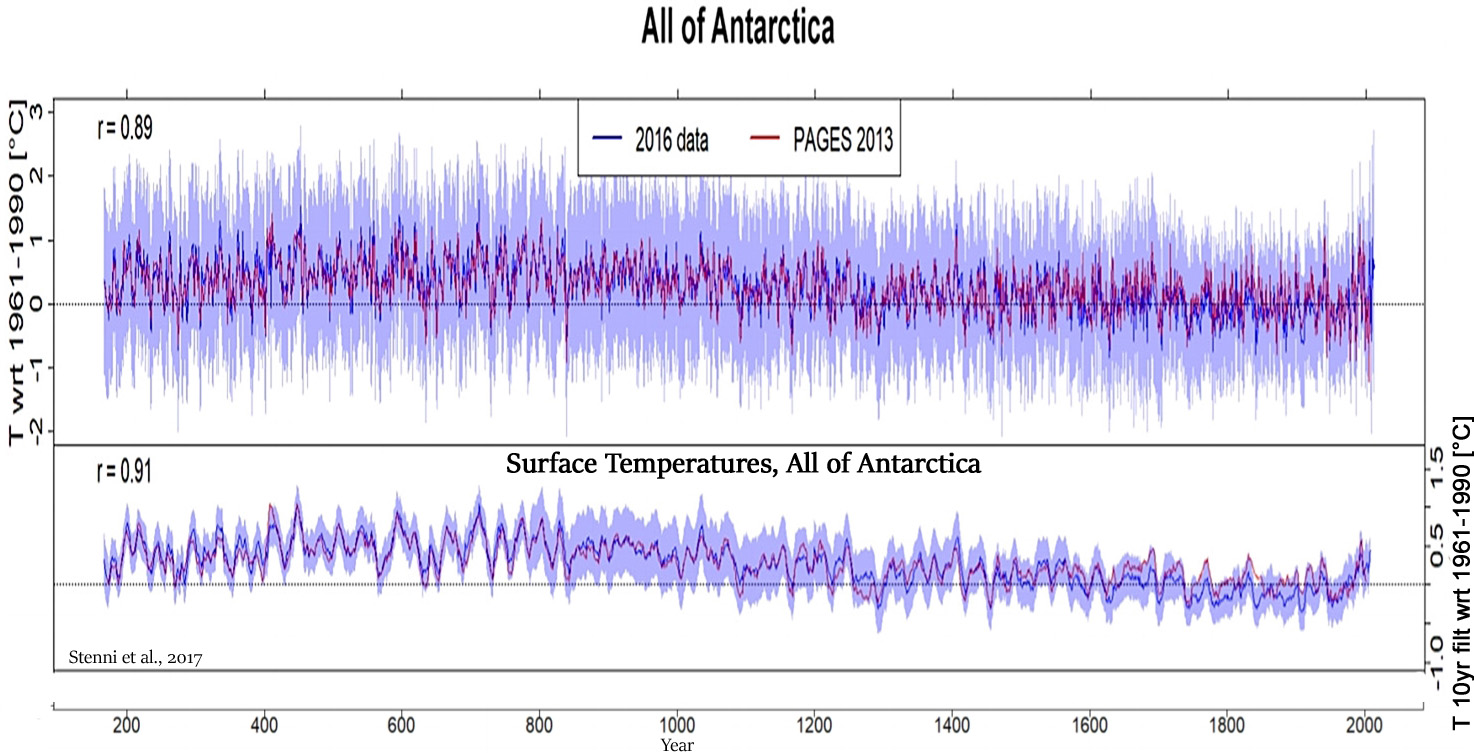
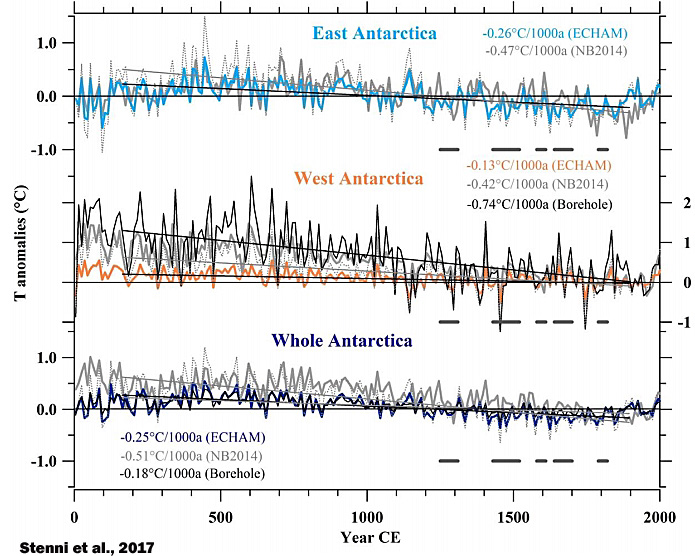
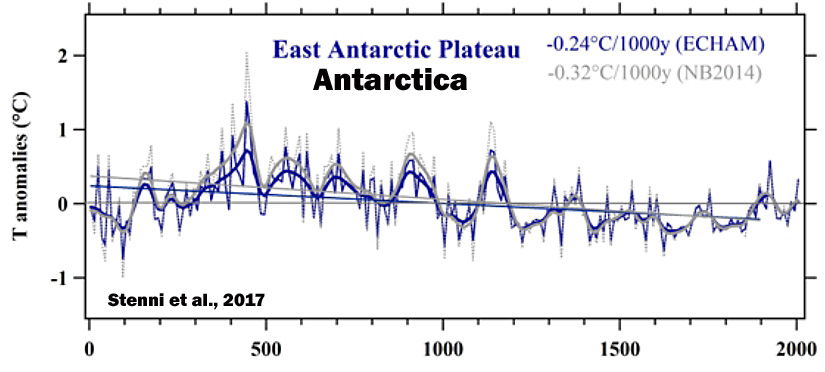
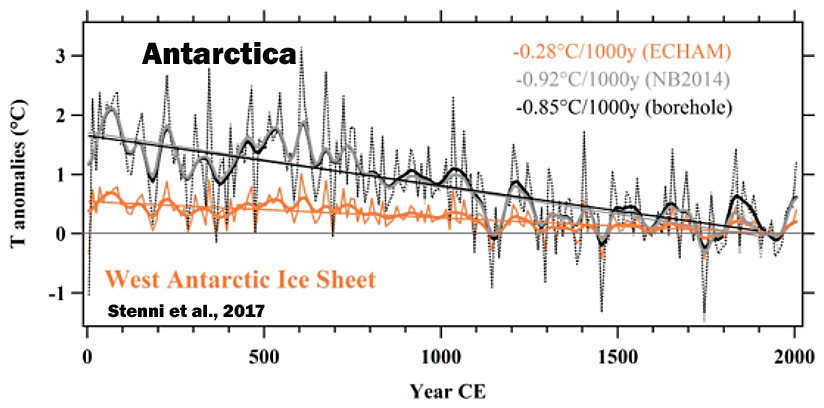
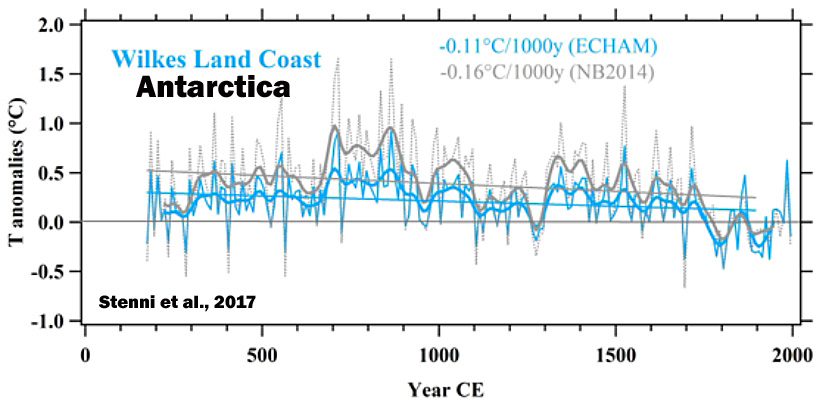
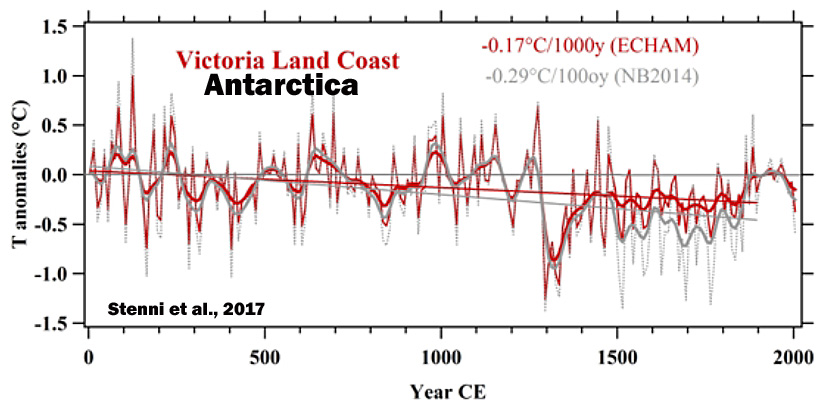
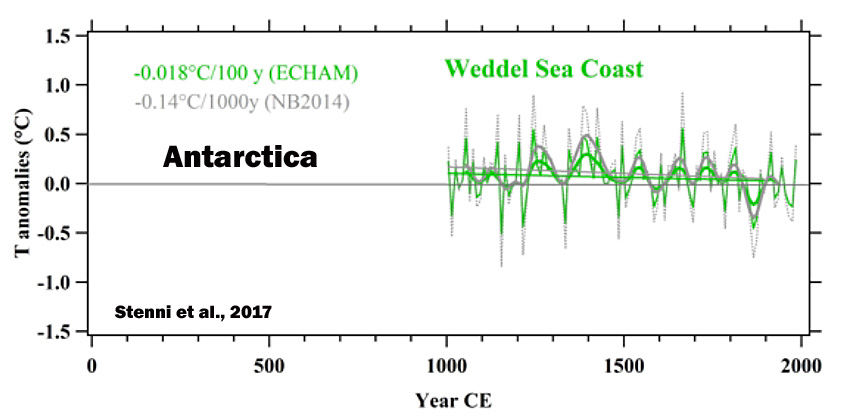
Stenni et al., 2017
“A recent effort to characterize Antarctic and sub-Antarctic climate variability during the last 200 years also concluded that most of the trends observed since satellite climate monitoring began in 1979 CE cannot yet be distinguished from natural (unforced) climate variability (Jones et al., 2016), and are of the opposite sign [cooling, not warming] to those produced by most forced climate model simulations over the same post-1979 CE interval. … (1) Temperatures over the Antarctic continent show an overall cooling trend during the period from 0 to 1900CE, which appears strongest in West Antarctica, and (2) no continent-scale warming of Antarctic temperature is evident in the last century.”
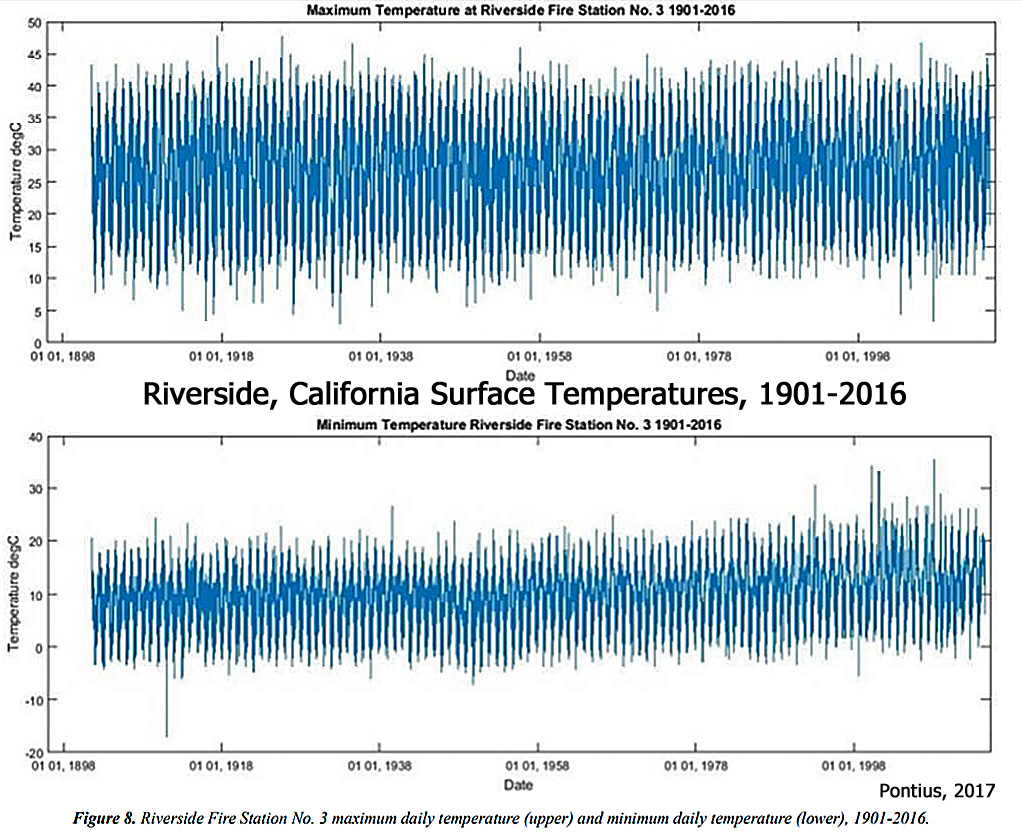
Pontius, 2017
“In general, ensemble model forecasts have been found unreliable for long-term climate prediction (Green and Armstrong, 2007, Mihailović et al., 2014). … Historical evidence of a significant increase in surface temperatures due to increases in atmospheric CO2 is absent from these data. … If atmospheric CO2 continues to increase at its current rate the small annual temperature increase expected at Riverside will likely be insignificant (e.g. < 0.01°C/yr) compared to natural temperature variability.”
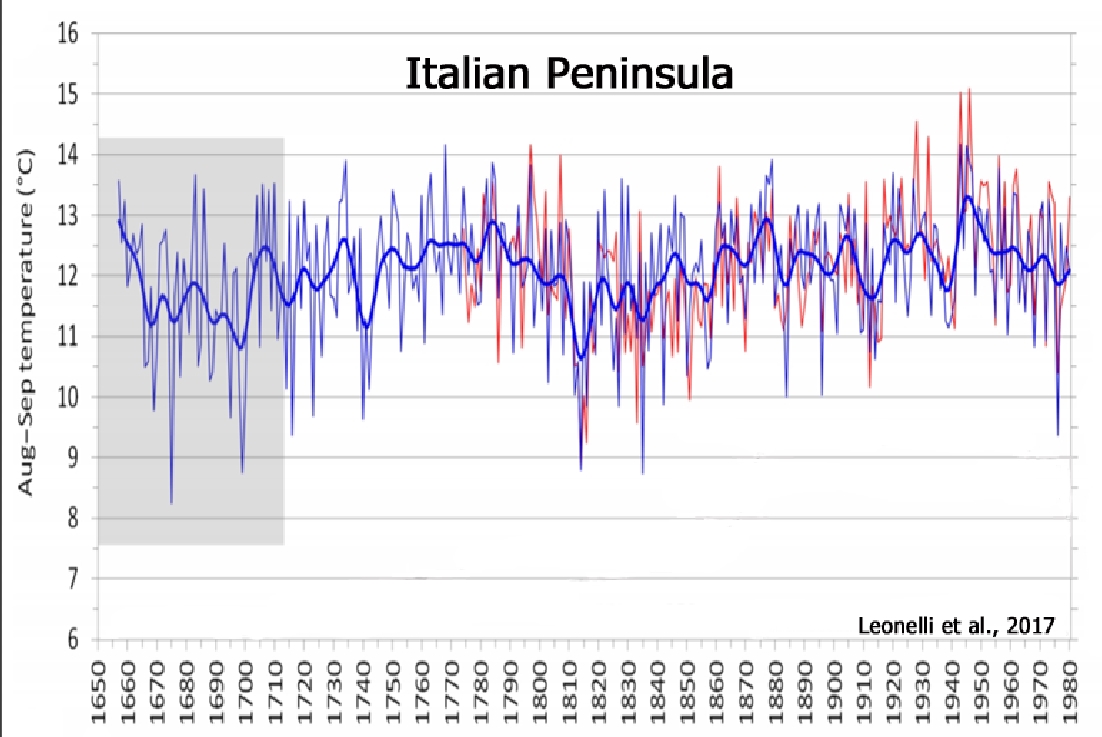
Leonelli et al., 2017
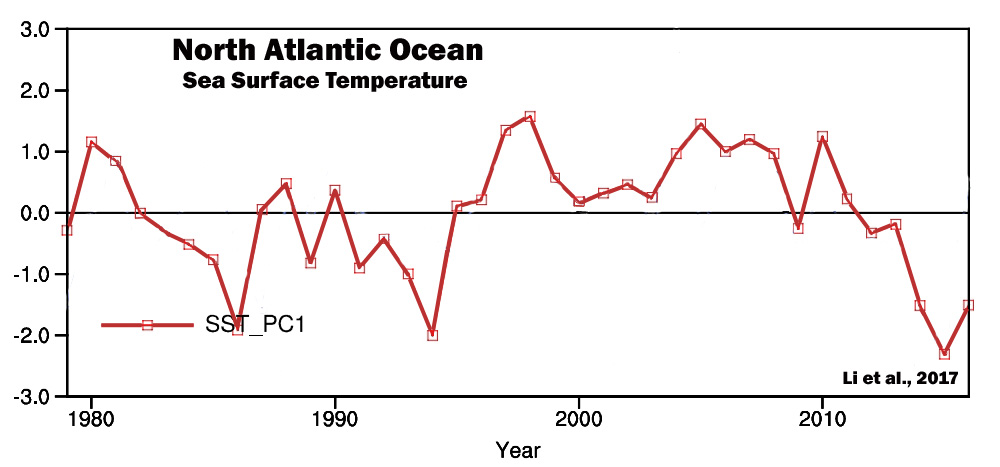
Li et al., 2017
Kobashi et al., 2017
“After the 8.2 ka event, Greenland temperature reached the Holocene thermal maximum with the warmest decades occurring during the Holocene (2.9 ± 1.4 °C warmer than the recent decades) at 7960 ± 30 years B.P. … For the most recent 10 years (2005 to 2015), apart from the anomalously warm year of 2010, mean annual temperatures at the Summit exhibit a slightly decreasing trend in accordance with northern North Atlantic-wide cooling. The Summit temperatures are well correlated with southwest coastal records (Ilulissat, Kangerlussuaq, Nuuk, and Qaqortoq).”

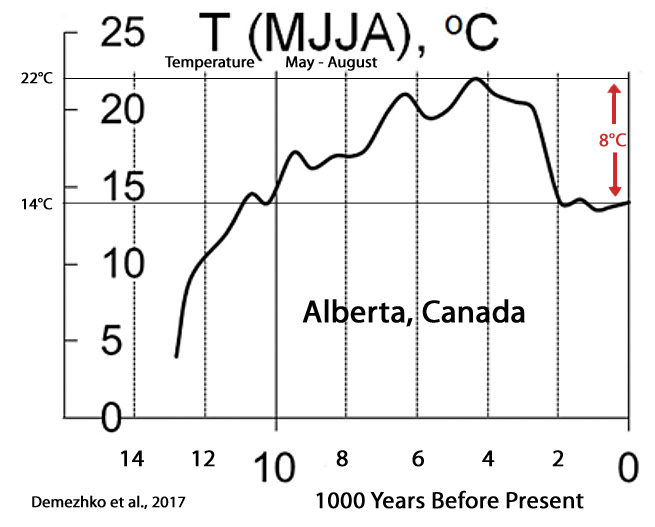
Demezhko et al., 2017
“GST [ground surface temperature] and SHF [surface heat flux] histories differ substantially in shape and chronology. Heat flux changes ahead temperature changes by 500–1000 years.”
Luoto and Nevalainen, 2017

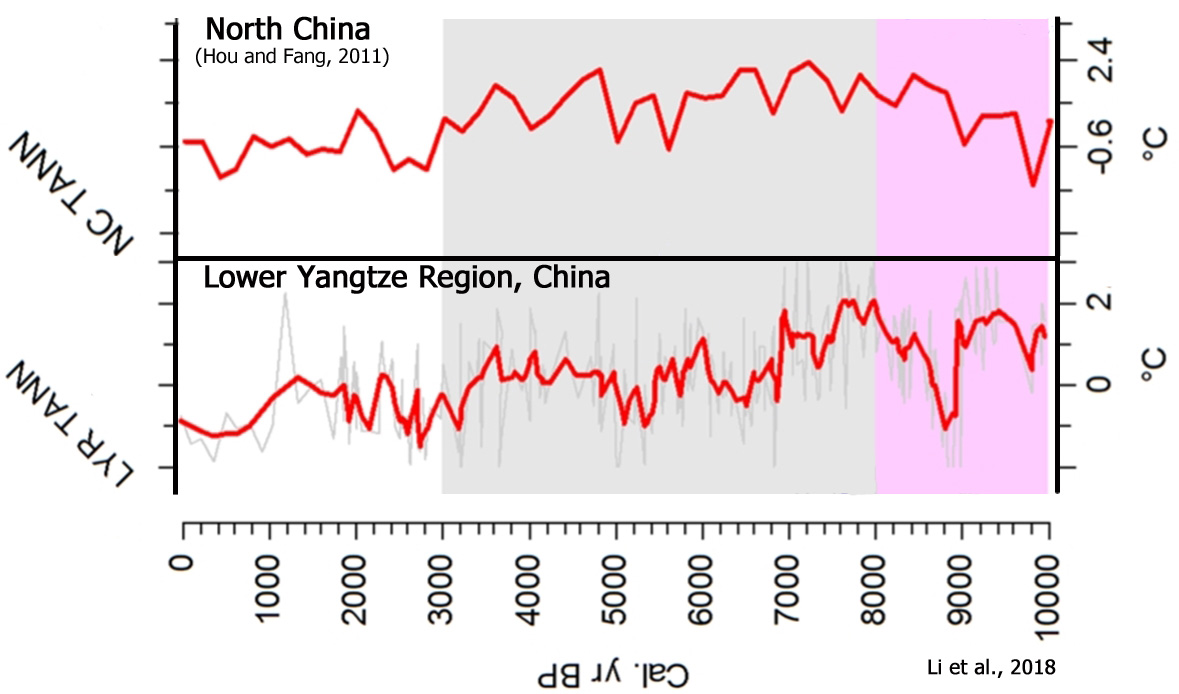
Li et al., 2017
“The main driving forces behind the Holocene climatic changes in the LYR [Lower Yangtze Region, East China] area are likely summer solar insolationassociated with tropical or subtropical macro-scale climatic circulations such as the Intertropical Convergence Zone (ITCZ), Western Pacific Subtropical High (WPSH), and El Niño/Southern Oscillation (ENSO).”

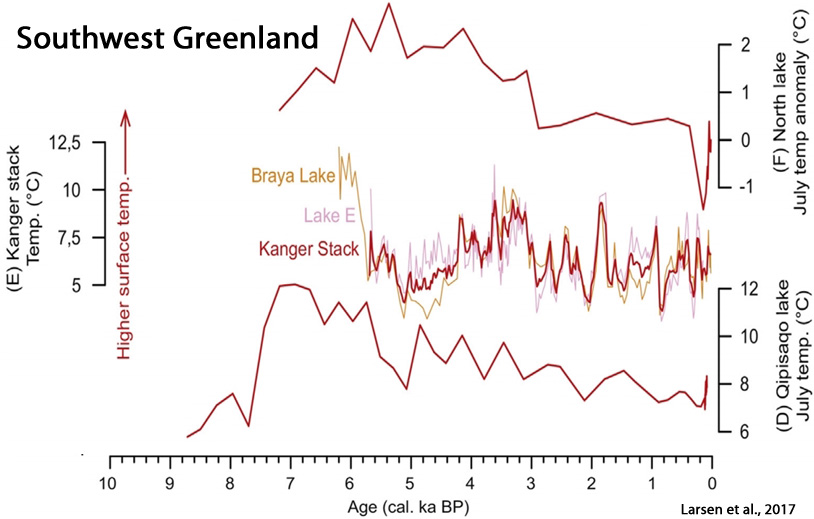
Larsen et al., 2017
“[K]nowledge remains sparse of GICs [glaciers and ice caps] fluctuations in Greenland and whether they survived past warmer conditions than today, e.g. the Holocene Thermal Maximum (HTM) ~8-5 cal. ka BP and the Medieval Climate Anomaly (MCA) ~1200-950 C.E. Only a few available studies have provided continuous records of Holocene glacier fluctuations in east Greenland (Lowell et al., 2013; Levy et al., 2014; Balascio et al., 2015) and west Greenland (Schweinsberg et al., 2017). These records show that local GICs [glaciers and ice caps] were significantly reduced and most likely completely absent during the HTM [Holocene Thermal Maximum].”
Zywiec et al., 2017
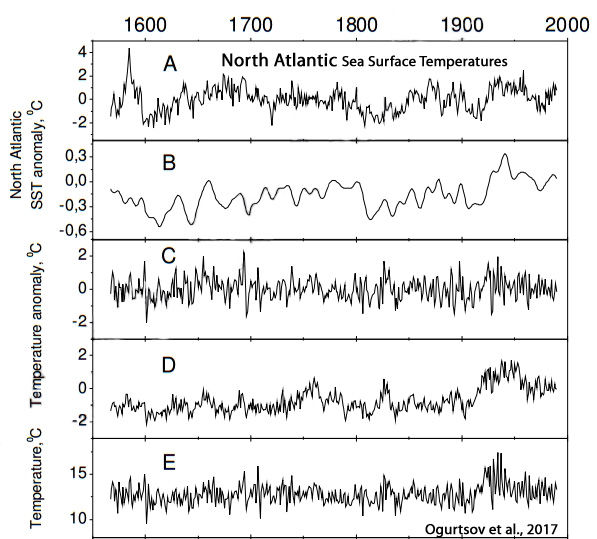
Ogurtsov et al., 2017
“Our analyses reveal appreciable and stable positive correlation between summer temperatures in Northern Fennoscandia and sea surface temperature in North Atlantic over AD 1567–1986. Thus a connection between climates of Northern Fennoscandia and North Atlantic basin is established for more than the last four centuries. Significant correlation was found between SST [sea surface temperatures] in NA [the North Atlantic] and solar activity (both instrumental data and proxies) during AD 1716–1986. … Thus, the connection between Northern Fennoscandian climate and solar activity, which has been previously established at century-scale (Ogurtsov et al., 2001, 2002, 2013) and millennial-scale (Helama et al., 2010), is confirmed for AD 1716–1986 over the entire frequency range using unfiltered records (with the exception for AMO reconstruction after Mann et al. (2009)).”
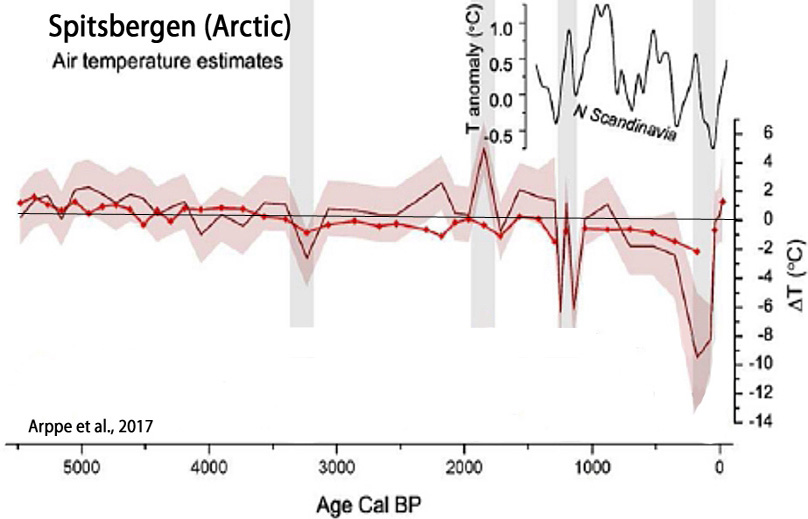
Arppe et al., 2017
“Factoring in respective age-model uncertainties, it appears that all major negative shifts, that is, ‘cold’ periods, in the δ18Olw record are roughly synchronous with periods of major negative anomalies in total solar irradiation and high modeled probabilities for extremely cold years in the Nordic Seas (Renssen et al., 2006), and widespread evidence of North Atlantic ‘cold spells’ (Bond et al., 2001; Sarnthein et al., 2003; Solomina et al., 2015; Wanner et al., 2008) linked to solar forcing.”
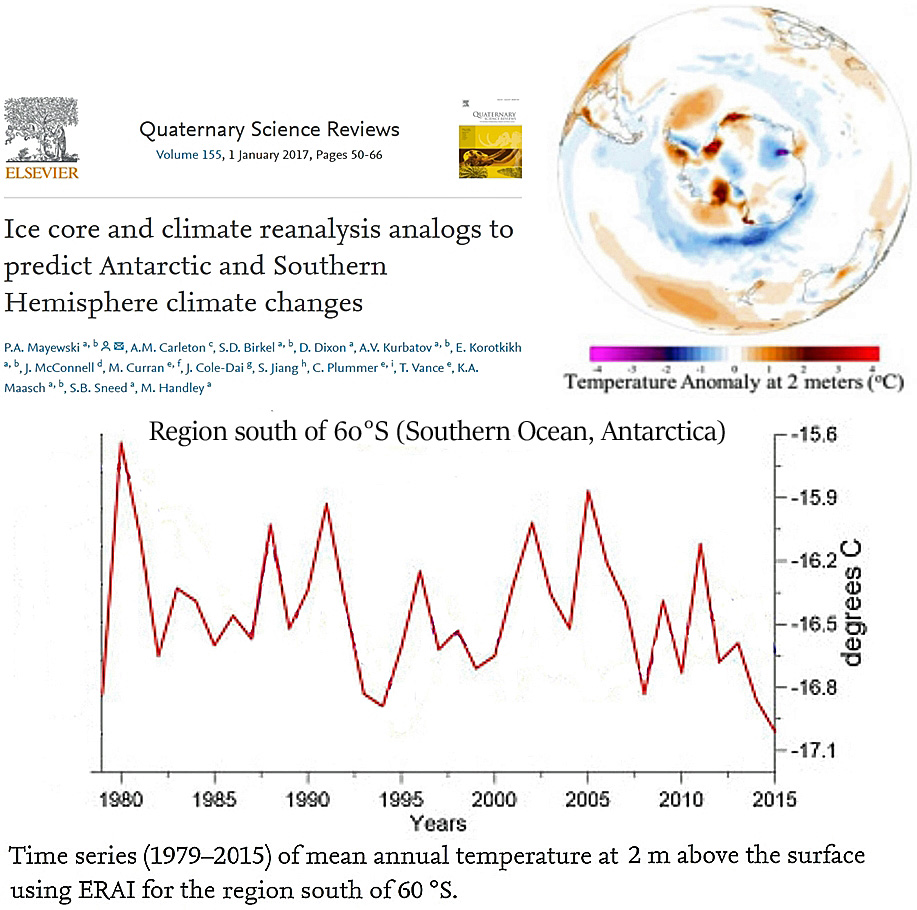
Mayewski et al., 2017
Turney et al., 2017
“Occupying about 14% of the world’s surface, the Southern Ocean plays a fundamental role in ocean and atmosphere circulation, carbon cycling and Antarctic ice-sheet dynamics. … As a result of anomalies in the overlying wind, the surrounding waters are strongly influenced by variations in northward Ekman transport of cold fresh subantarctic surface water and anomalous fluxes of sensible and latent heat at the atmosphere–ocean interface. This has produced a cooling trend since 1979.”
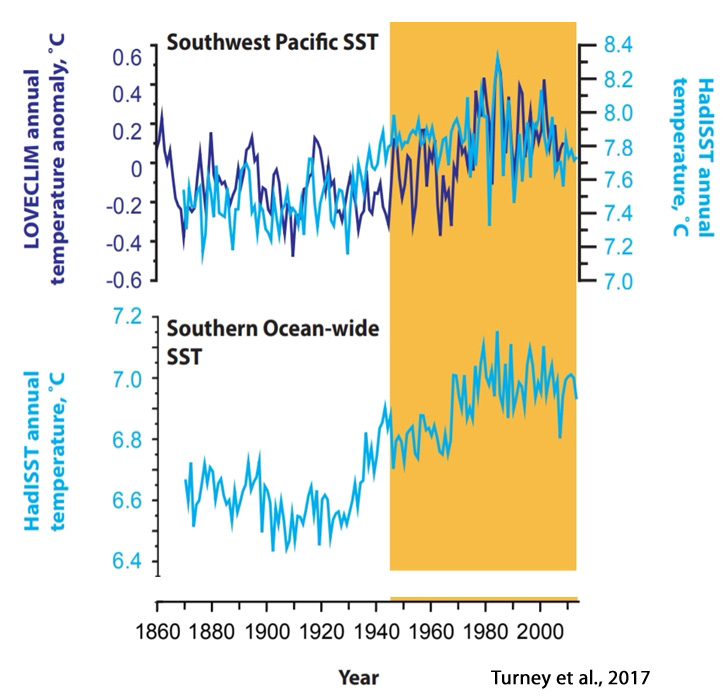
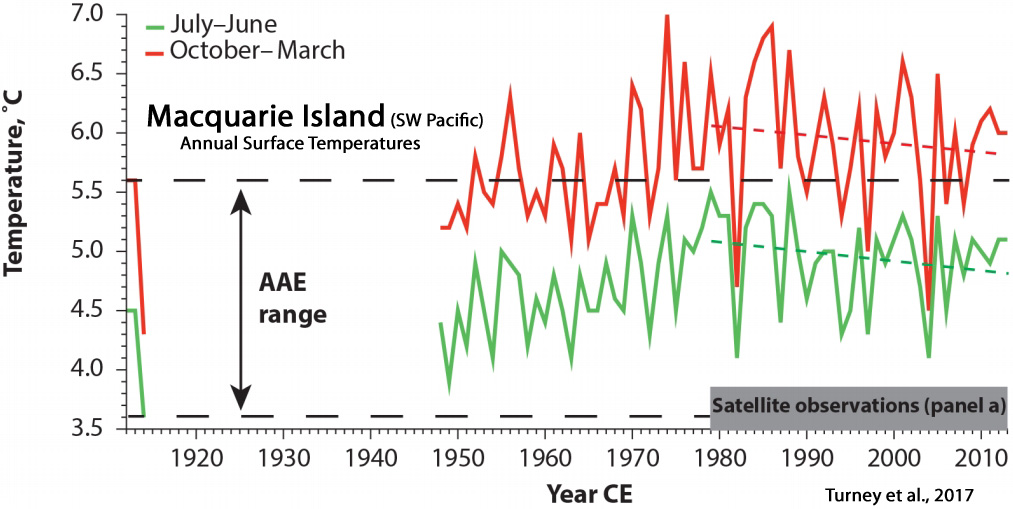
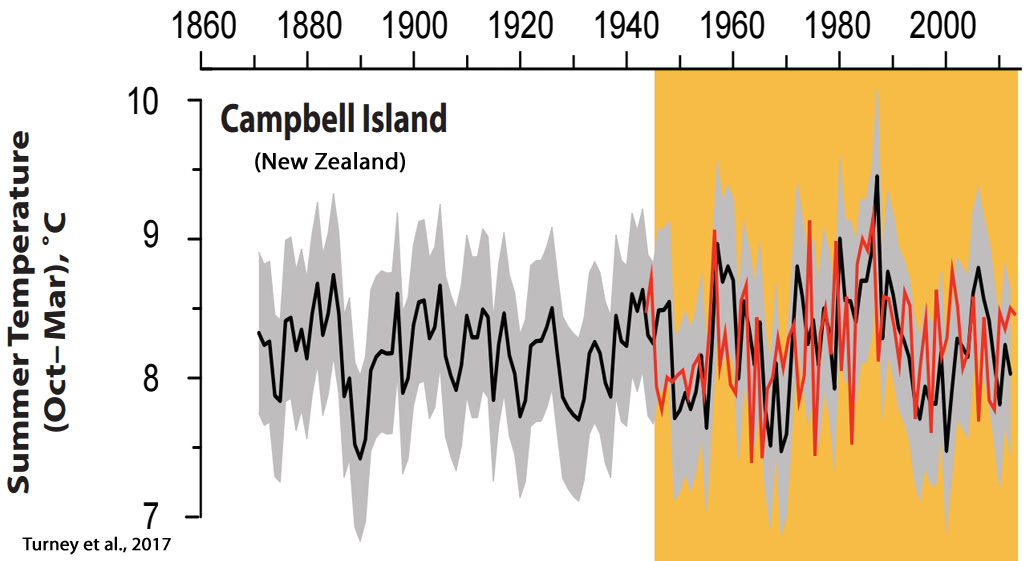
Rydval et al., 2017
“[T]he recent summer-time warming in Scotland is likely not unique when compared to multi-decadal warm periods observed in the 1300s, 1500s, and 1730s“
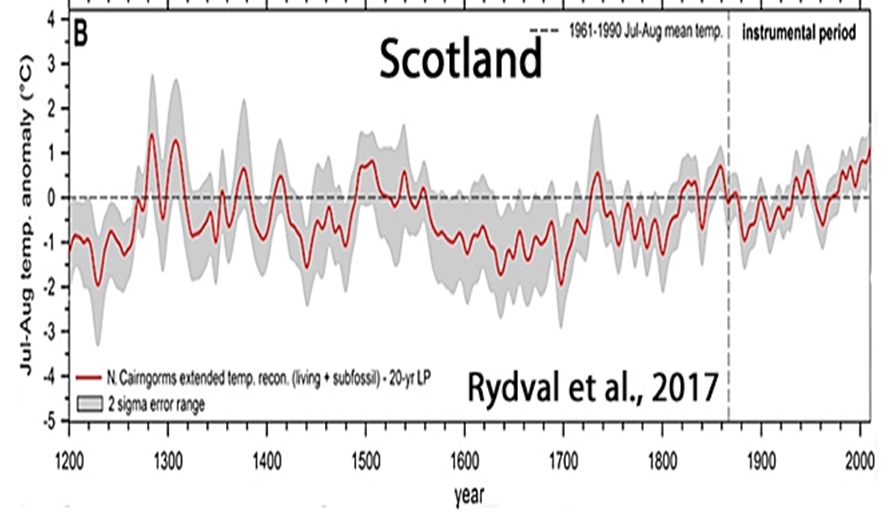
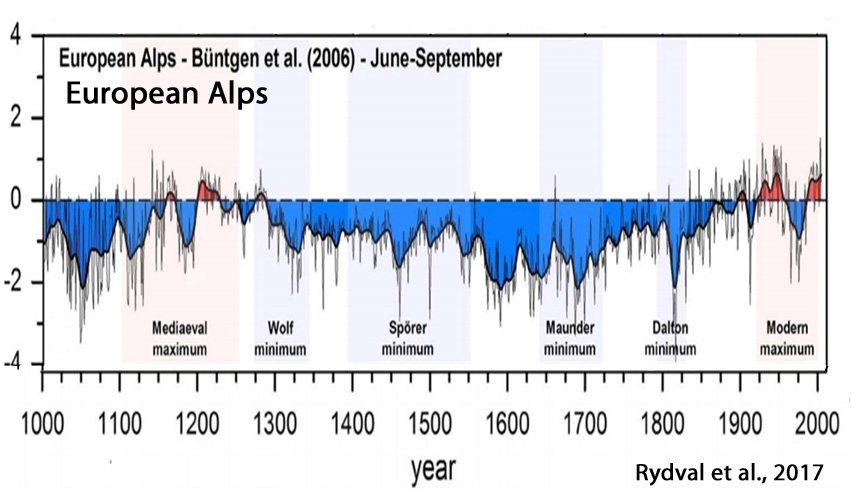
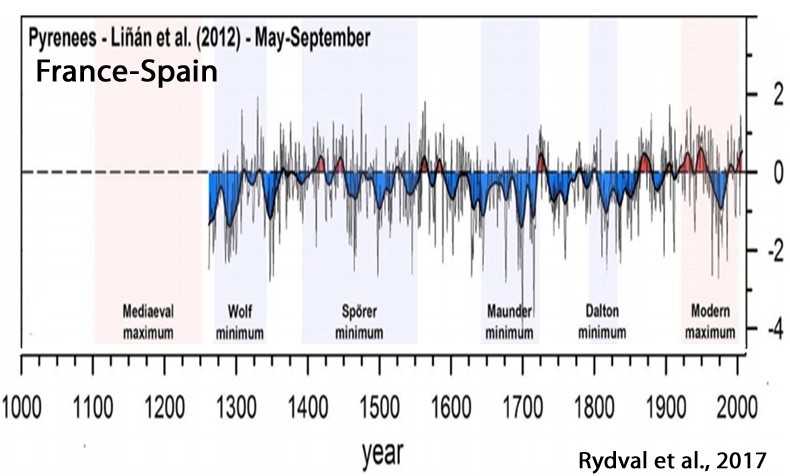

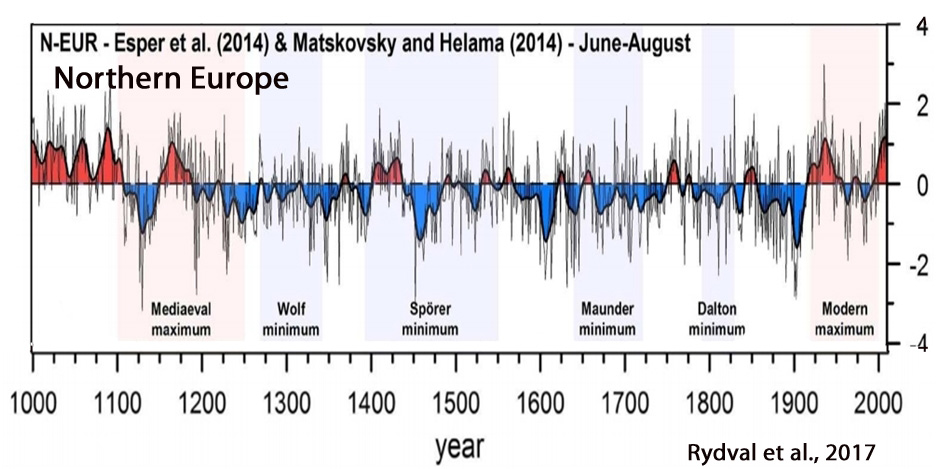
Yeager and Robson, 2017
“[W]hile the late twentieth century Atlantic was dominated by NAO-driven THC [thermohaline circulation] variability, other mechanisms may dominate in other time periods. … More recently, the SPNA [sub polar North Atlantic] upper ocean has again been cooling, which is also thought to be related to a slowdown in the THC. A continued near-term cooling of the SPNA has been forecast by a number of prediction systems, with implications for pan-Atlantic climate.”
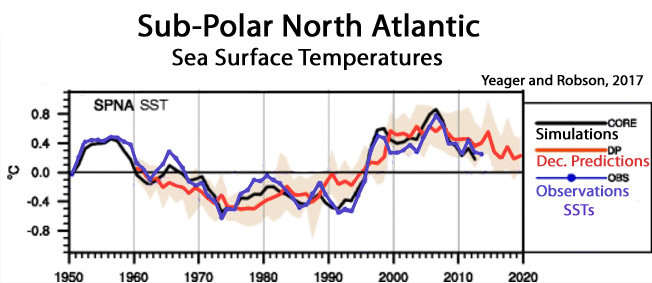
Li, 2017
“In the Southern Ocean, the increasing trend of the total OHC [ocean heat content] slowed down and started to decrease from 1980, and it started to increase again after 1995. In the warming context over the whole period [1970-2009], the Pacific was losing heat, especially in the deep water below 1000 m and in the upper layer above 300 m, excluding the surface 20 m layer in which the OHC kept increasing through the time.”
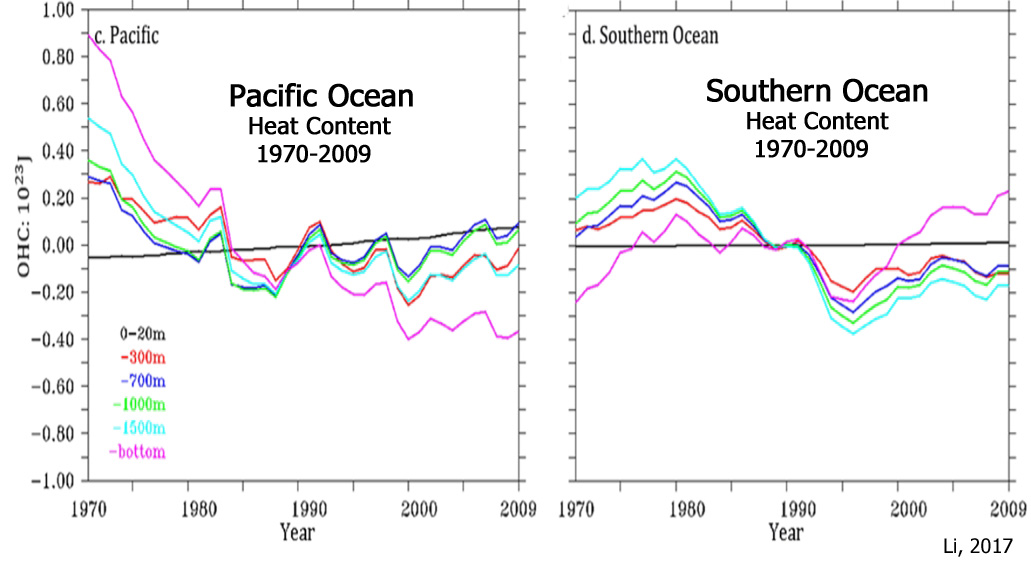
Piecuch et al., 2017
“In 2004–2005, SPNA [sub-polar North Atlantic] decadal upper ocean and sea-surface temperature trends reversed from warming during 1994–2004 to cooling over 2005–2015.”
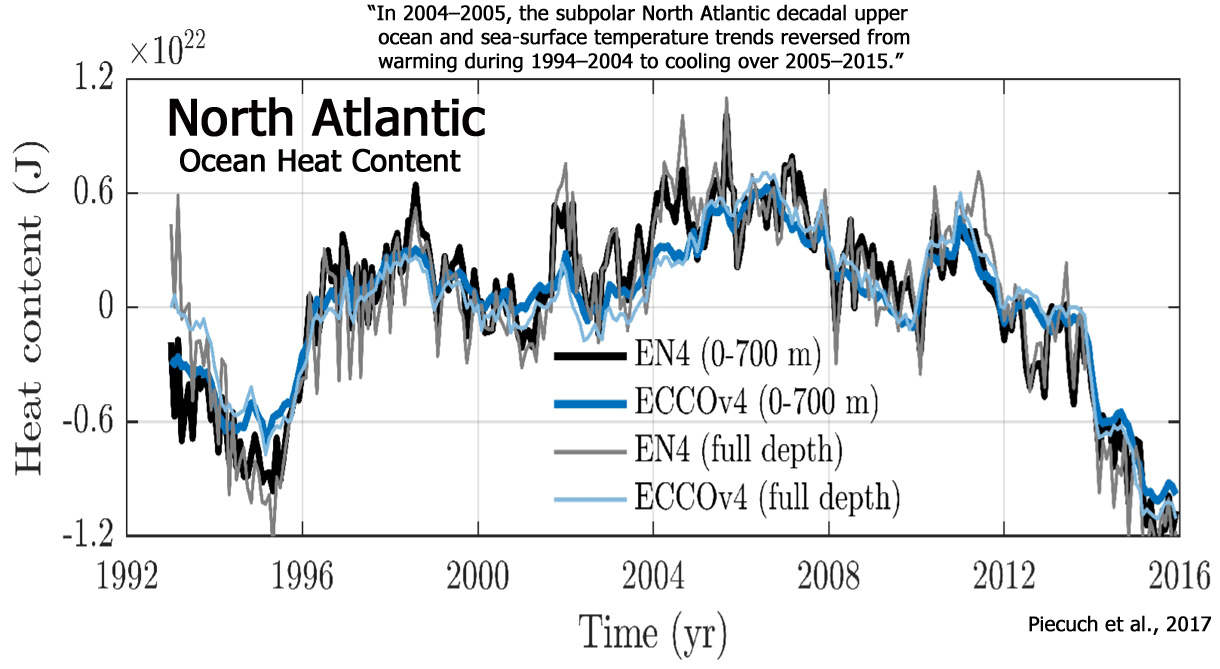
Li et al., 2017
“We suggest that solar activity may play a key role in driving the climatic fluctuations in NC [North China] during the last 22 centuries, with its quasi ∼100, 50, 23, or 22-year periodicity clearly identified in our climatic reconstructions. … It has been widely suggested from both climate modeling and observation data that solar activity plays a key role in driving late Holocene climatic fluctuations by triggering global temperature variability and atmospheric dynamical circulation“
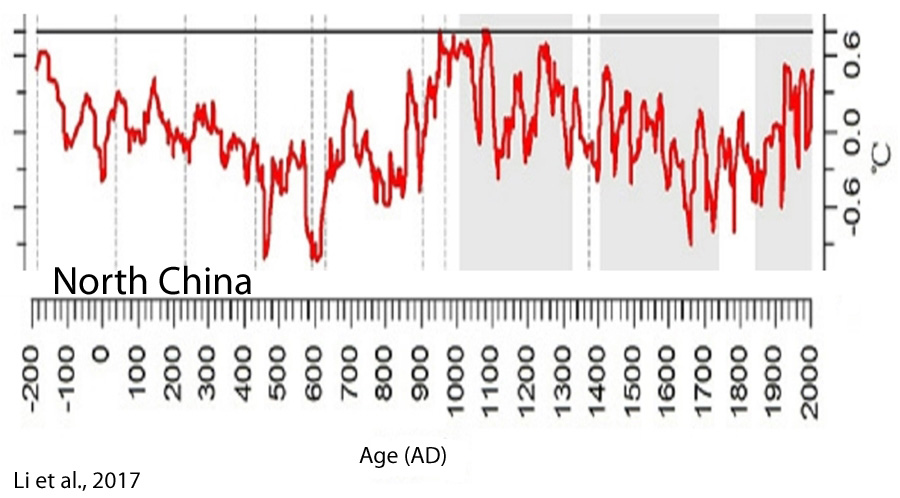
Guillet et al., 2017

Goursaud et al., 2017
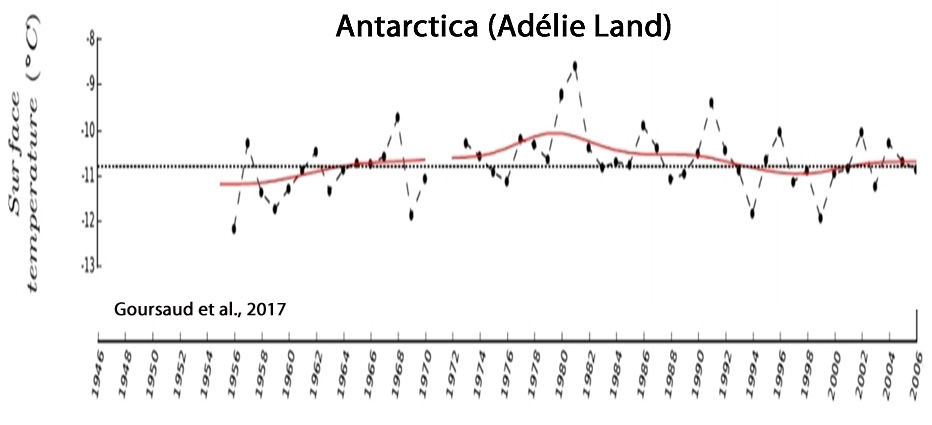
Wilson et al., 2017

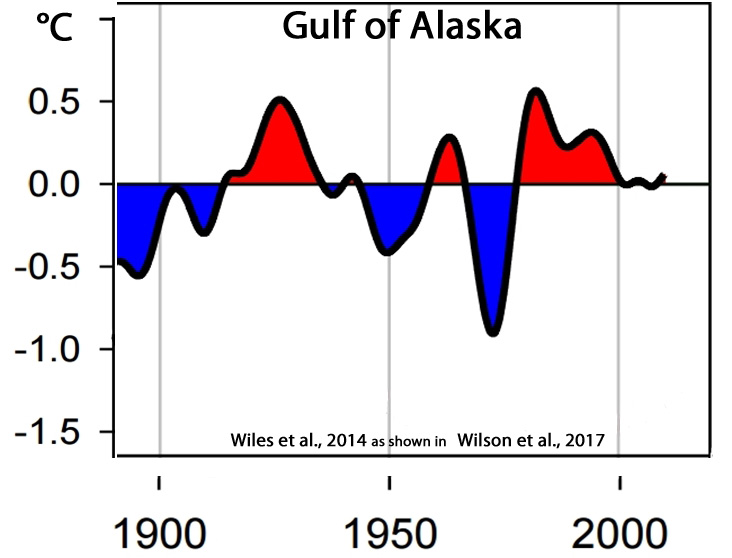
Tegzes et al., 2017
“Our sortable-silt time series show prominent multi-decadal to multi-centennial variability, but no clear long-term trend over the past 4200 years. … [O]ur findings indicate that variations in the strength of the main branch of the Atlantic Inflow may not necessarily translate into proportional changes in northward oceanic heat transport in the eastern Nordic Seas.”
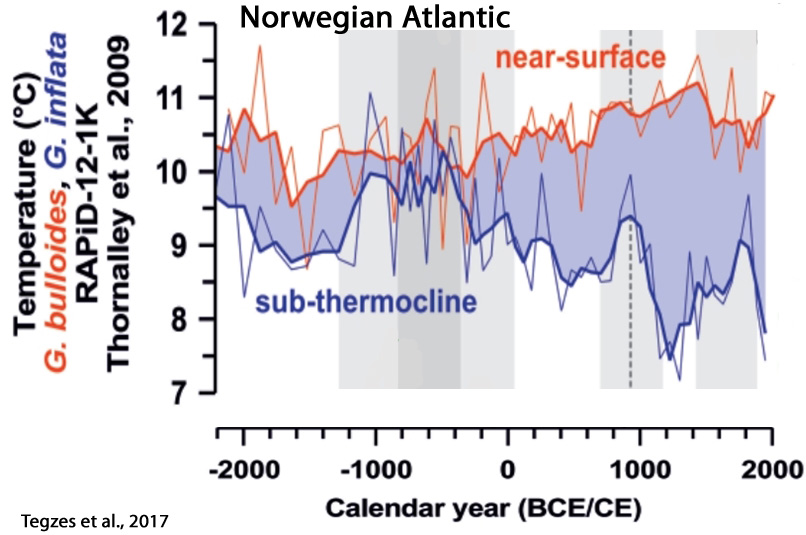
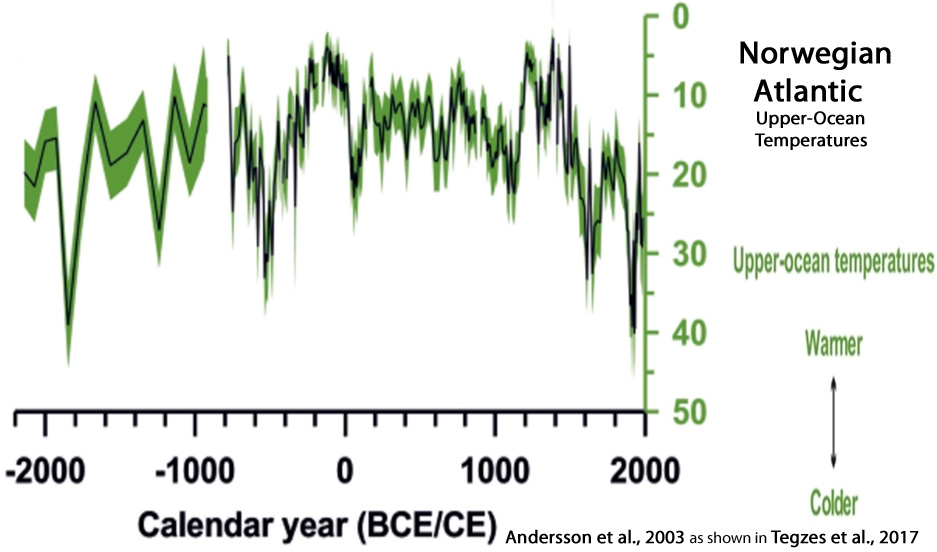
Tejedor et al., 2017

Fernández-Fernández et al., 2017

Cai and Liu et al., 2017
“2003– 2009 was the warmest period in the reconstruction. 1970– 2000 was colder than the last stage of the Little Ice Age (LIA).”
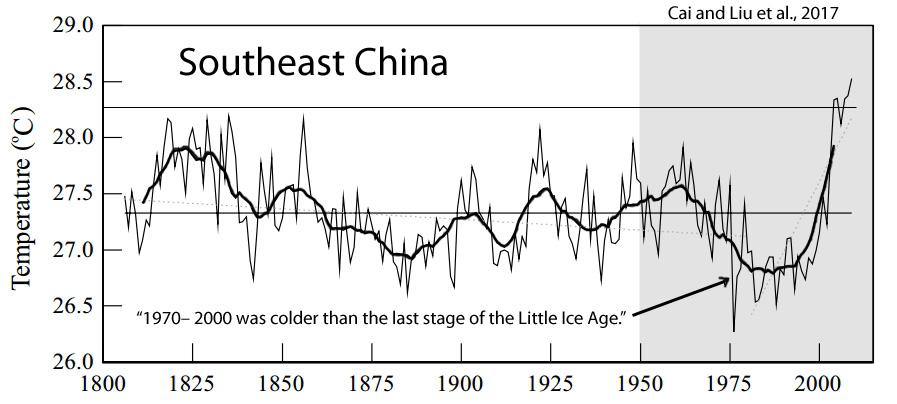
Bi et al., 2017
“[T]he MWT [minimum winter temperature] values and rate of warming over the past seven decades [southwest China] did not exceed those found in the reconstructed temperature data for the past 211 years. … Larger scale climate oscillations of the Western Pacific and Northern Indian Ocean as well as the North Atlantic Oscillation probably influenced the region’s temperature in the past.”
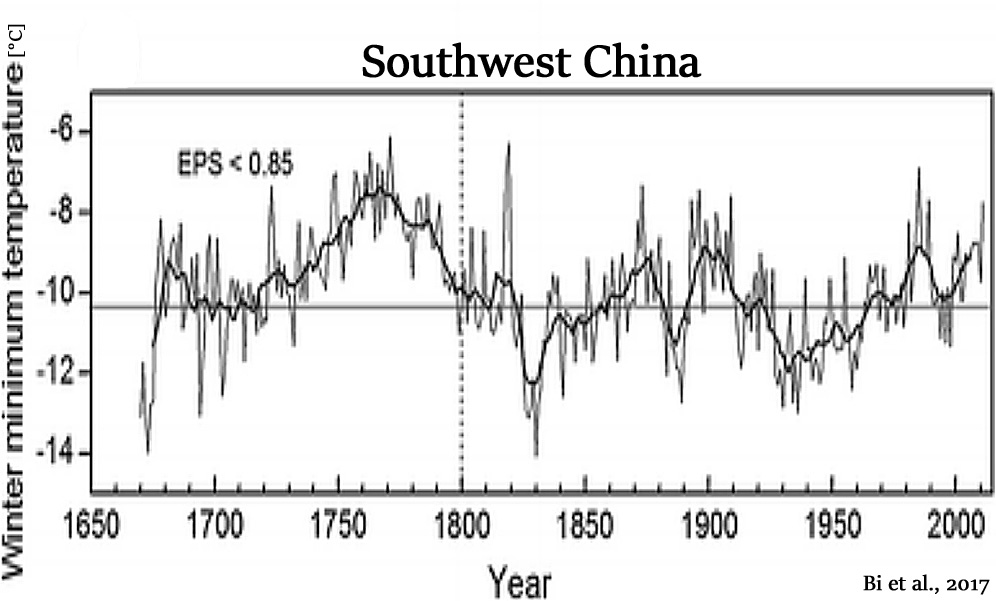
Köse et al., 2017
“The reconstruction is punctuated by a temperature increase during the 20th century; yet extreme cold and warm events during the 19th century seem to eclipse conditions during the 20th century. We found significant correlations between our March–April spring temperature reconstruction and existing gridded spring temperature reconstructions for Europe over Turkey and southeastern Europe. … During the last 200 years, our reconstruction suggests that the coldest year was 1898 and the warmest year was 1873. The reconstructed extreme events also coincided with accounts from historical records. … Further, the warming trends seen in our record agrees with data presented by Turkes and Sumer (2004), of which they attributed [20th century warming] to increased urbanization in Turkey.”
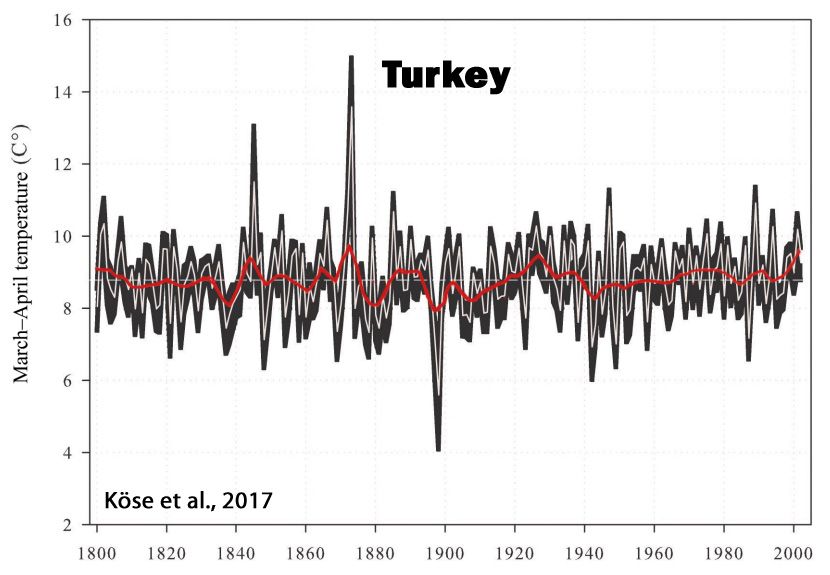
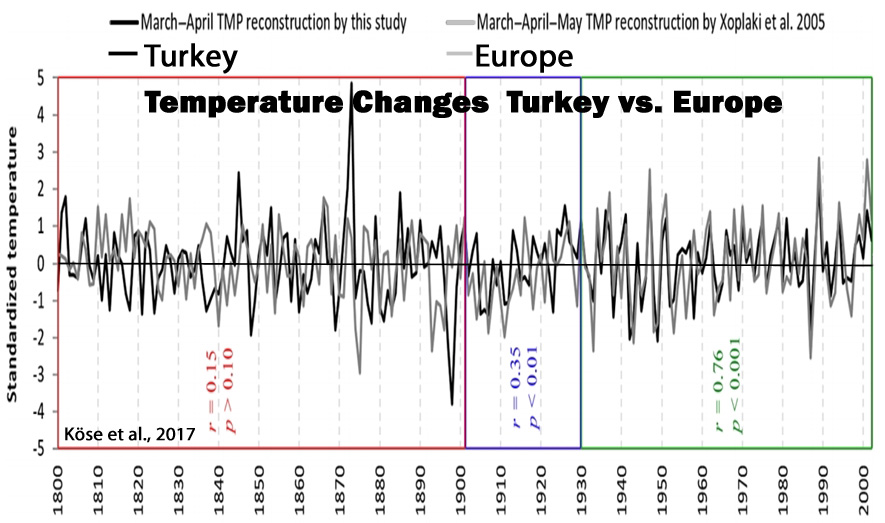
Alter et al., 2017
“From 1910- 1949 (pre-agricultural development, pre-DEV) to 1970-2009 (full agricultural development, full-DEV), the central United States experienced large-scale increases in rainfall of up to 35% and decreases in surface air temperature of up to 1°C during the boreal summer months of July and August … which conflicts with expectations from climate change projections for the end of the 21st century (i.e., warming and decreasing rainfall)(Melillo et al., 2014).”
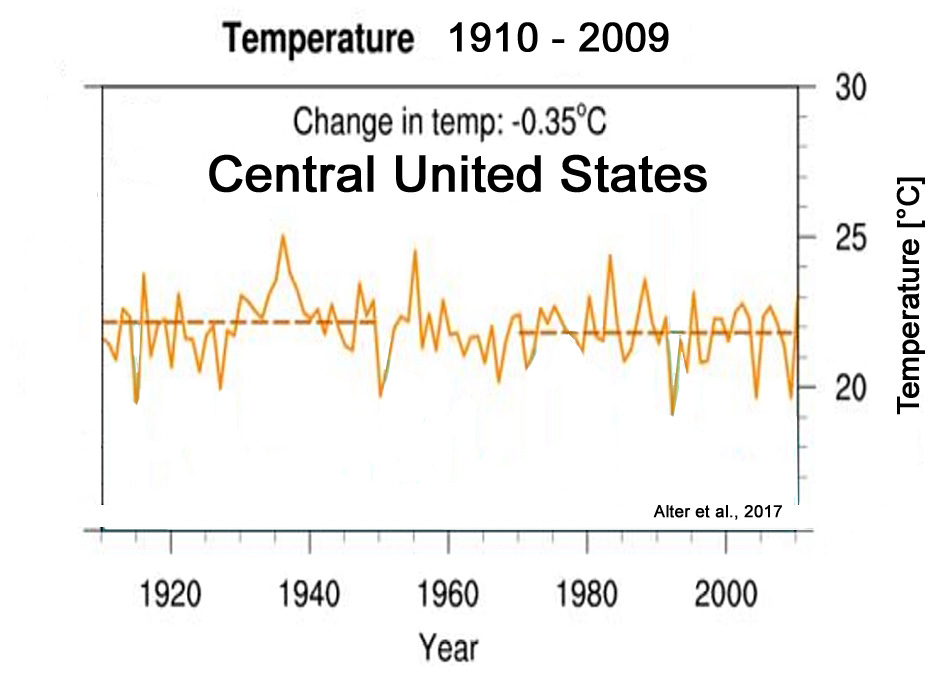
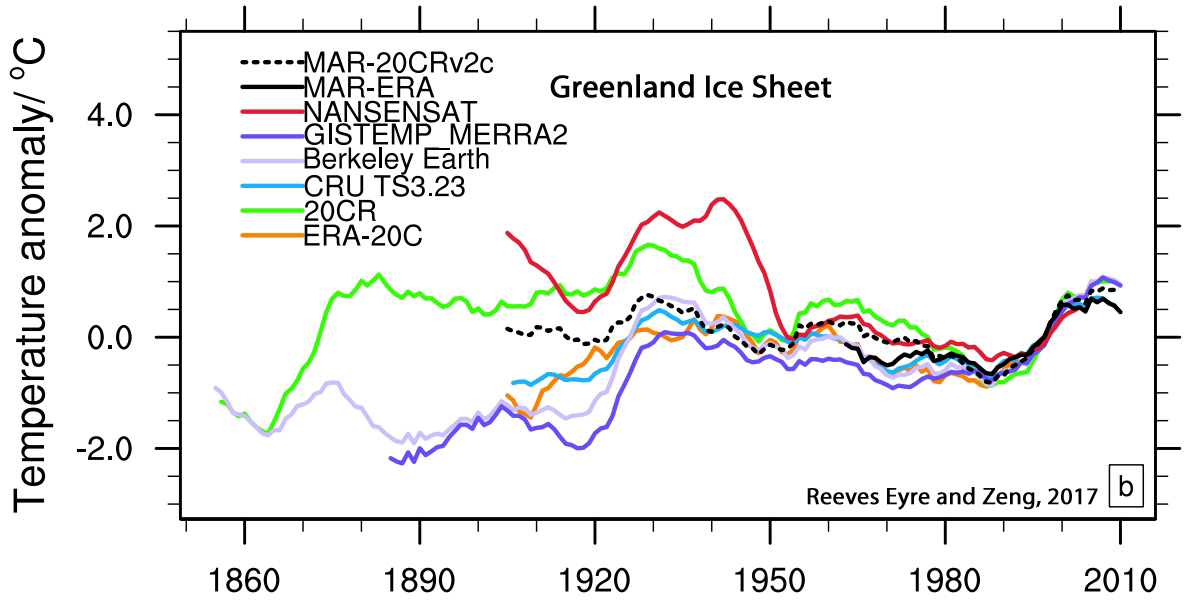
Flannery et al., 2017
“The early part of the reconstruction (1733–1850) coincides with the end of the Little Ice Age, and exhibits 3 of the 4 coolest decadal excursions in the record. However, the mean SST estimate from that interval during the LIA is not significantly different from the late 20th Century SST mean. The most prominent cooling event in the 20th Century is a decade centered around 1965. This corresponds to a basin-wide cooling in the North Atlantic and cool phase of the AMO.”

Bolton and Beaudoin, 2017
“Major late Holocene fluctuations include intervals of warmer (e.g. Medieval Warm Period) and cooler (e.g. Little Ice Age) climate. … The modern period [21st century] had temperature and precipitation values which were about 4% less than the Holocene average (Figure 6).”

Kim et al., 2017

He et al., 2017
“As pointed out by Cohen et al. (2014) that continental winter SAT [surface temperature] trends since 1990 exhibit cooling over the midlatitudes. The negative trends extend from Europe eastward to East Asia, with a center of maximum magnitude to the west of the Baikal. As reviewed above, the AO/NAO [Arctic Oscillation/North Atlantic Oscillation] shows an in-phase relationship with the SAT [surface temperatures] over Eurasia. … [T]he negative trend in the AO/NAO might explain the recent Eurasian winter cooling. … It is evident that a positive winter AO causes warmer winters over East Asia through enhancing Polar westerly jet which prevents cold Arctic air from invading low latitudes.”
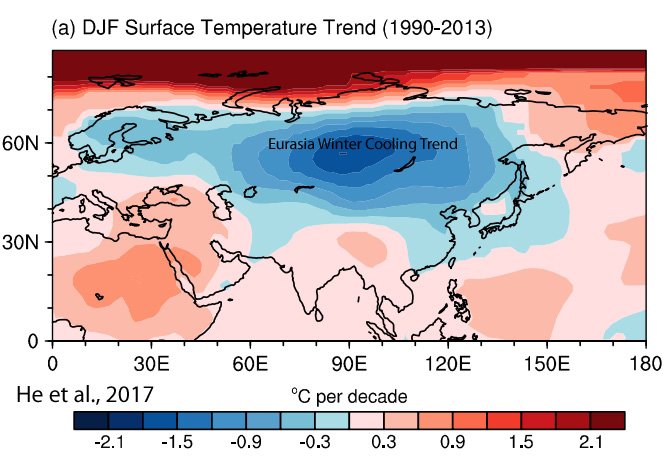
Robson et al., 2017
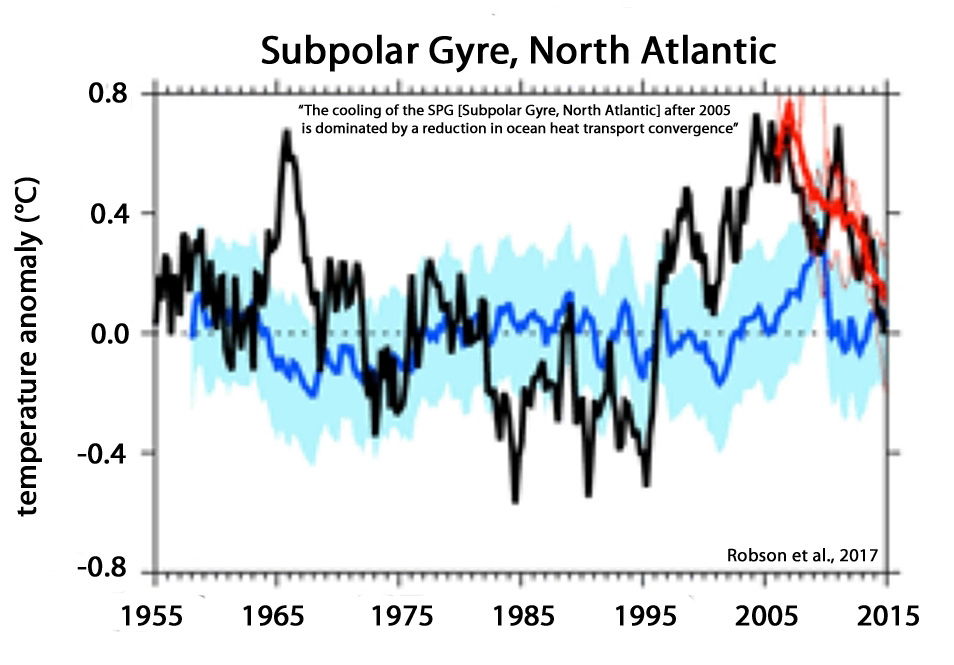
Robertson and Chilingar, 2017
“One can summarize our findings as follows: • The anthropogenic impact on the global atmospheric temperature is negligible, i.e., 5% (Matthews, 1998). • Changes in the solar irradiation (global temperature) precede the corresponding changes in the carbon dioxide concentration in the atmosphere. • Any attempt to mitigate undesirable climatic changes using restrictive regulations are condemned to failure, because global forces of nature are at least 4 orders of magnitude greater than the available human controls”
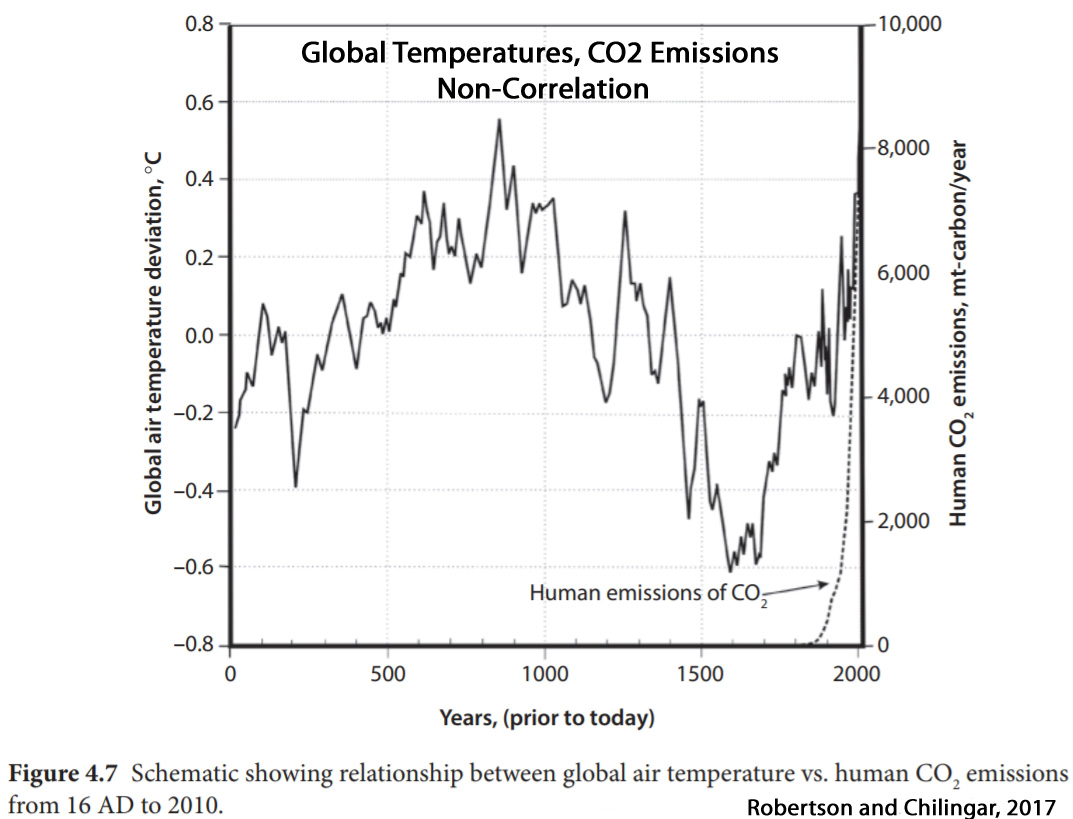
![]()
Simon et al., 2017
“The Holocene coldest temperatures were observed during the Early Holocene, but temperature followed a gradual rise (from ca. 11.7 to 8 kyr cal. BP) to reach its maximal value during the Holocene Thermal Maximum (from ca. 8 to 4.5 kyr cal. BP). Holocene Thermal Maximum was characterized by summer air temperatures about 2.5 °C degrees higher than present.”
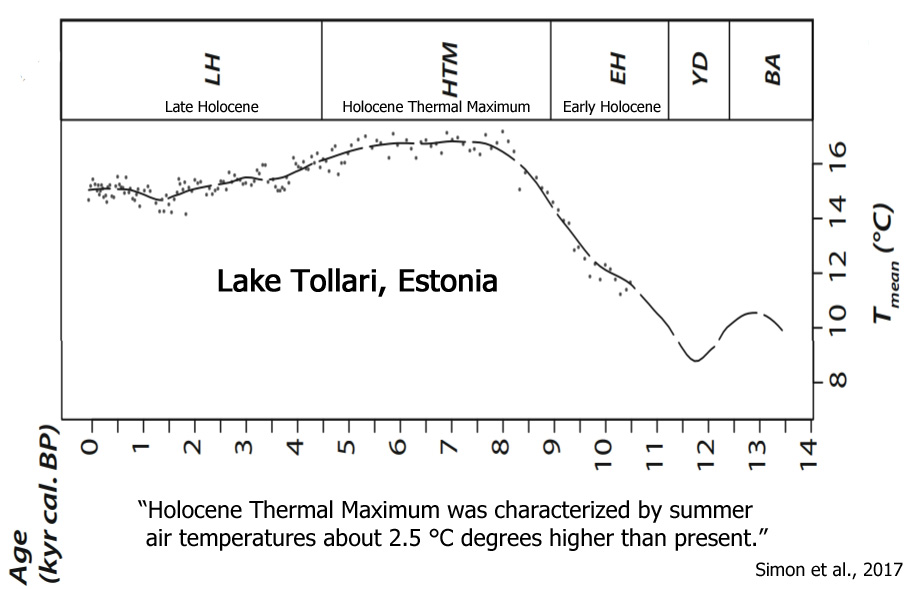
Kryk et al., 2017
“Our study aims to investigate the oceanographic changes in SW Greenland over the past four centuries (1600-2010) based on high-resolution diatom record using both, qualitative and quantitative methods. July SST during last 400 years varied only slightly from a minimum of 2,9 to a maximum of 4,7 °C and total average of 4°C. 4°C is a typical surface water temperature in SW Greenland during summer. … The average April SIC was low (c. 13%) [during the 20th century], however a strong peak of 56,5% was recorded at 1965. This peak was accompanied by a clear drop in salinity (33.2 PSU).”
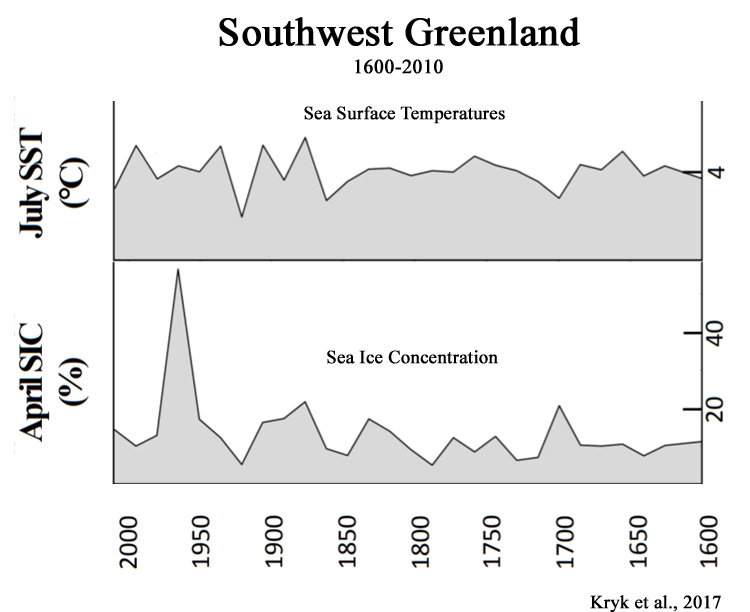
Zheng et al., 2017
“From 11.5 to 10.7 ka [11,500 to 10,700 years ago], corresponding to the Preboreal event, MAATpeat indicates even higher [temperature] values, from 7.0 to 12 °C. MAATpeat continued to vary during the Holocene. From 10.7 to 6.0 ka, temperatures rose stepwise, with 2 cool events at 10.6–10.2 and 8.6 ka, before reaching maximum values of ~11 °C during the early Holocene from 8.0 to 6.0 ka. Following the early Holocene, temperatures at Hani gradually decreased to values of ~5 °C, close to the observed temperature at Hani across the past 60 yr (4–7.5 °C).” [Modern temperatures are about 5-6°C colder than 6,000 to 8,000 years ago.]
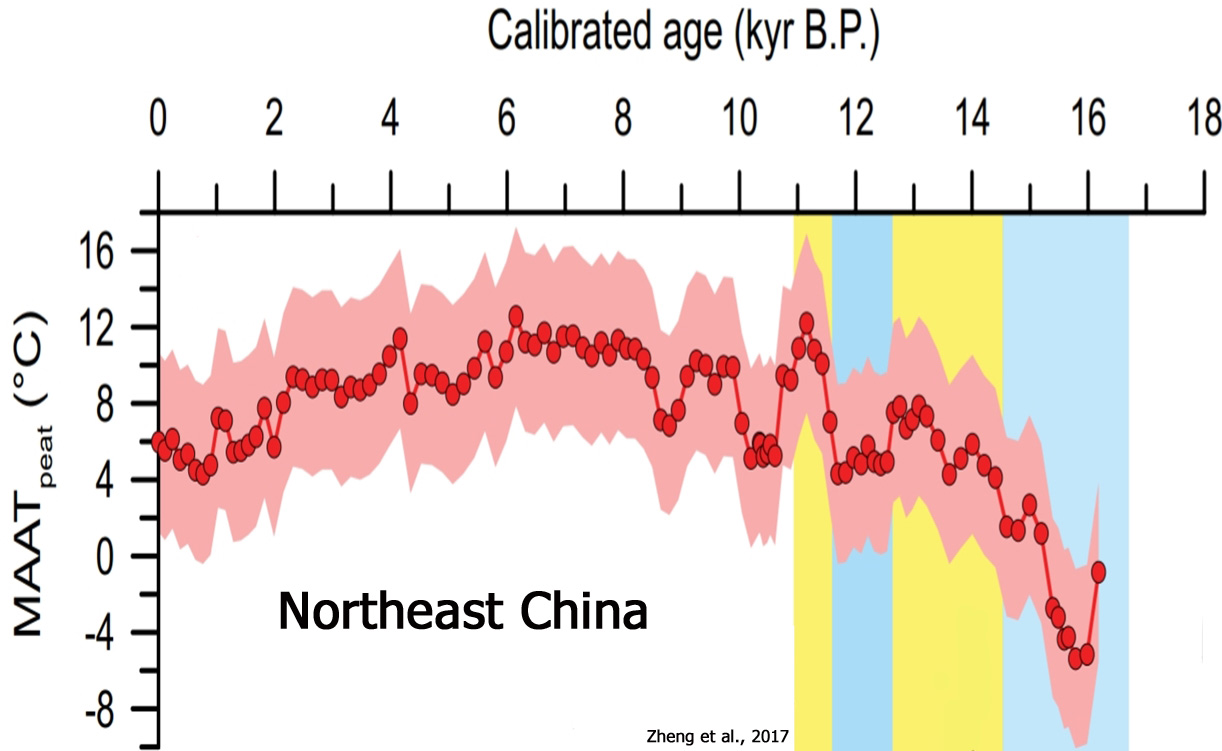
Bertrand et al., 2017
“During the last 4000 years, particularly low [sea surface temperature] values occur at 3500-3300 cal yr BP and during the most recent decades, and high values persisted between 2400 and 1600 cal yr BP. … [I]t is likely that the abrupt increases in SST around 3300-3200 and 2400-2200 cal yr BP participated in triggering the meltwater events at 3250-2700 and 2000-1200 cal yr BP, respectively. … [T]he marked cooling of the last ~800 years may have very little to do with meltwater input and may rather represent the regional decrease in ocean temperatures during the last ~900 years (Caniupan et al., 2014).”
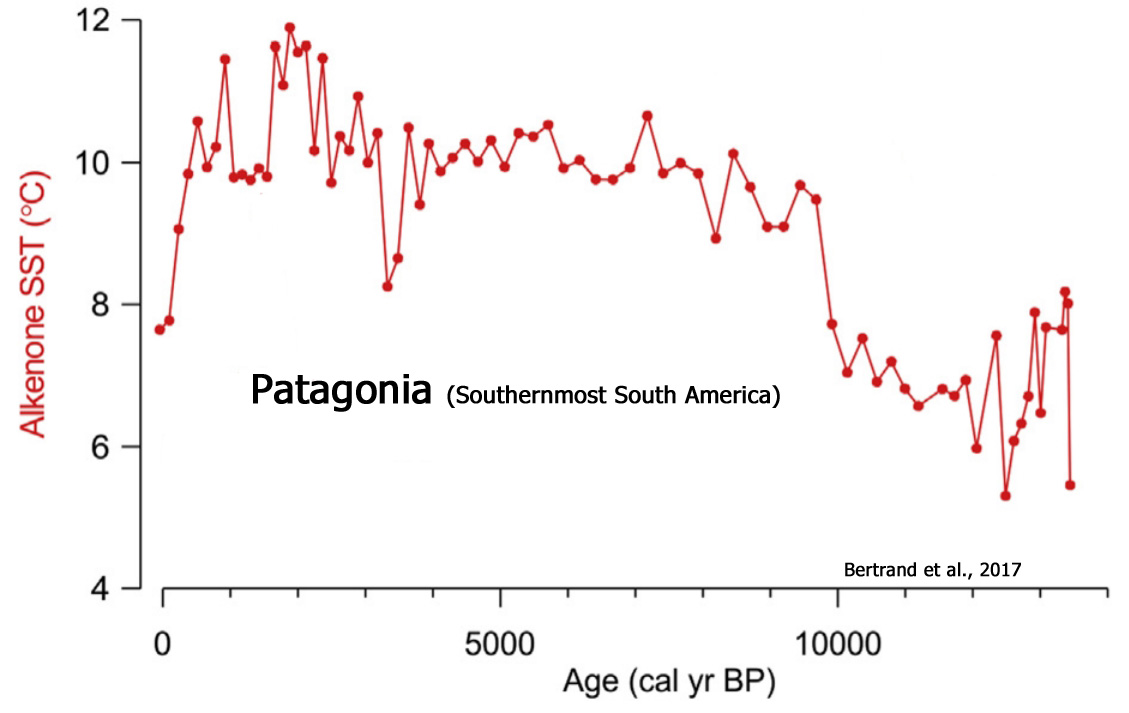
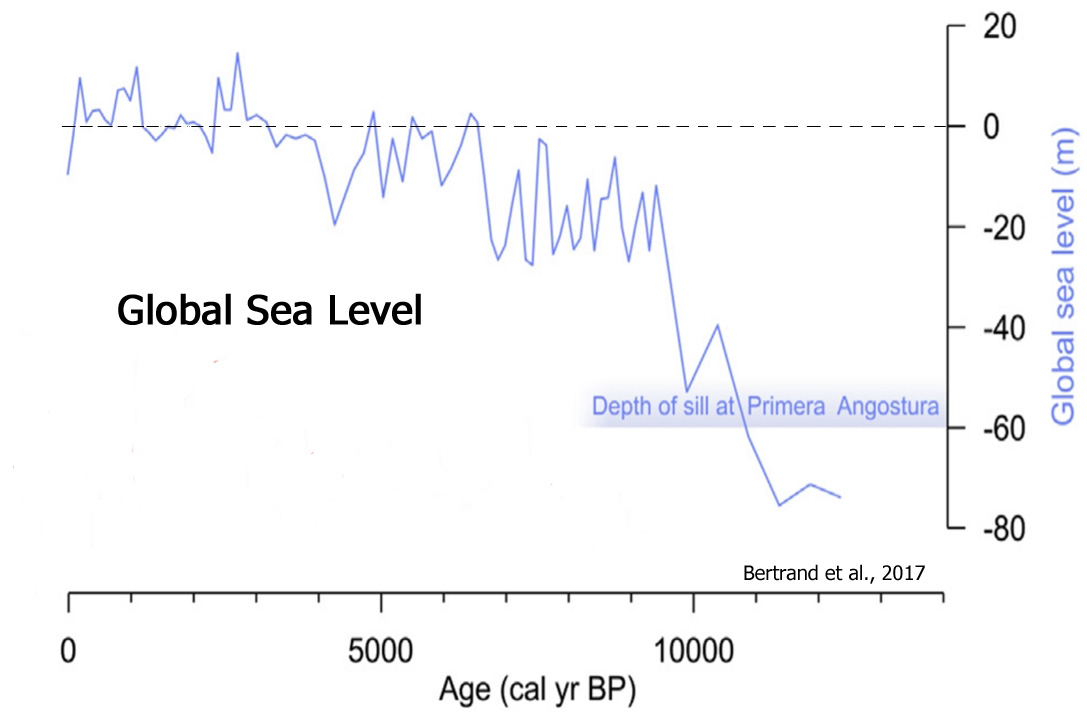
Nan et al., 2017
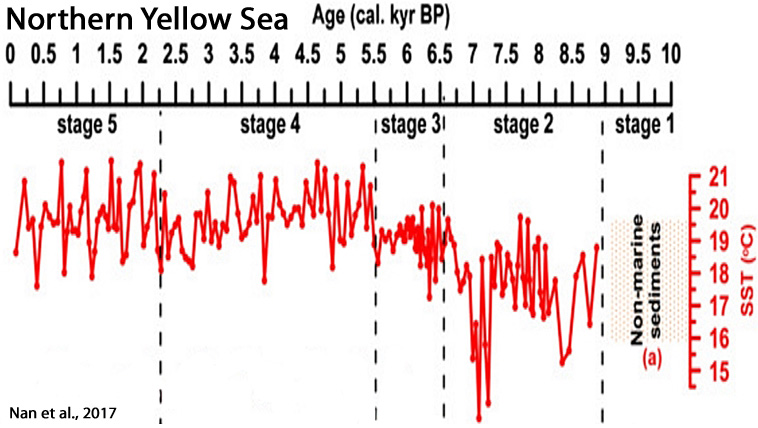 ‘
‘
Repschläger et al., 2017
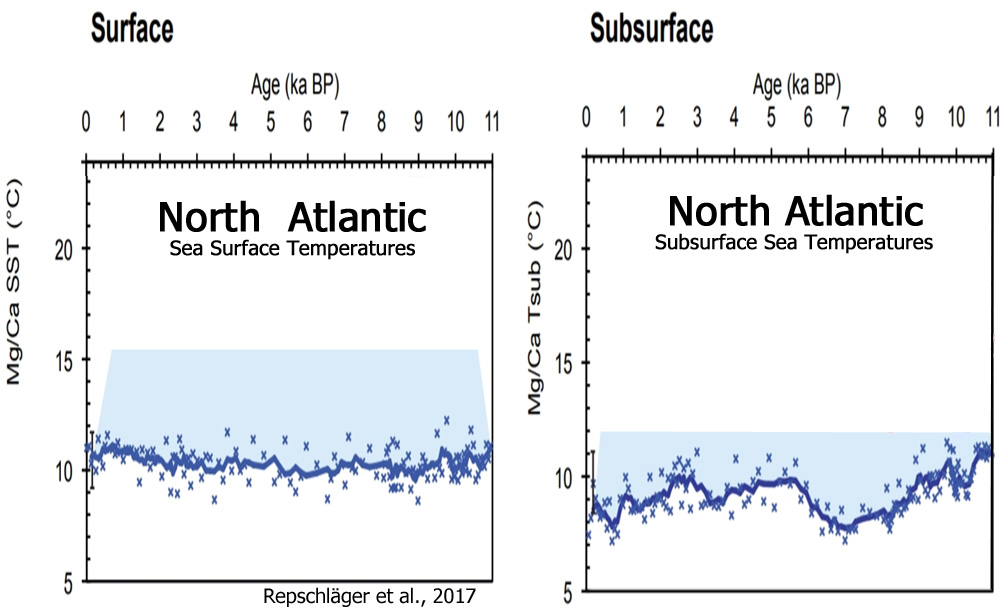
Lasher et al., 2017
“This paper presents a multi proxy lake record of NW Greenland Holocene climate. … Summer temperatures (2.5–4 °C warmer than present) persisted until ∼4 ka [4,000 years ago] … Continual cooling after 4 ka led to coldest temperatures after 1.2 ka, with temperature anomalies 2-3°C below present. Approximately 1000 km to the south, a 2-3°C July temperature anomaly(relative to [warmer than] present) between 6 and 5 ka was reported based upon chironomid assemblages near Illulisat and Jakobshavn (Axford et al., 2013). Across Baffin Bay on northeastern Baffin Island, HTM summer temperatures were an estimated ~5°C warmer than the pre-industrial late Holocene and 3.5°C warmer than present, based upon chironomid assemblages (Axford et al., 2009; Thomas et al., 2007). … Following deglaciation, the GrIS [Greenland Ice Sheet] retreated behind its present margins (by as much as 20-60 km in some parts of Greenland) during the HTM [Holocene Thermal Maximum] (Larsen et al., 2015; Young and Briner, 2015).”
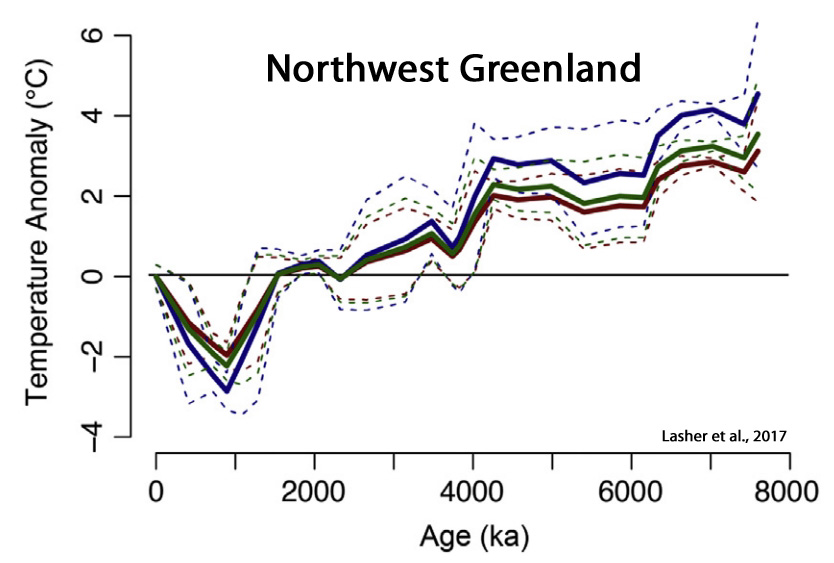
Li et al., 2017
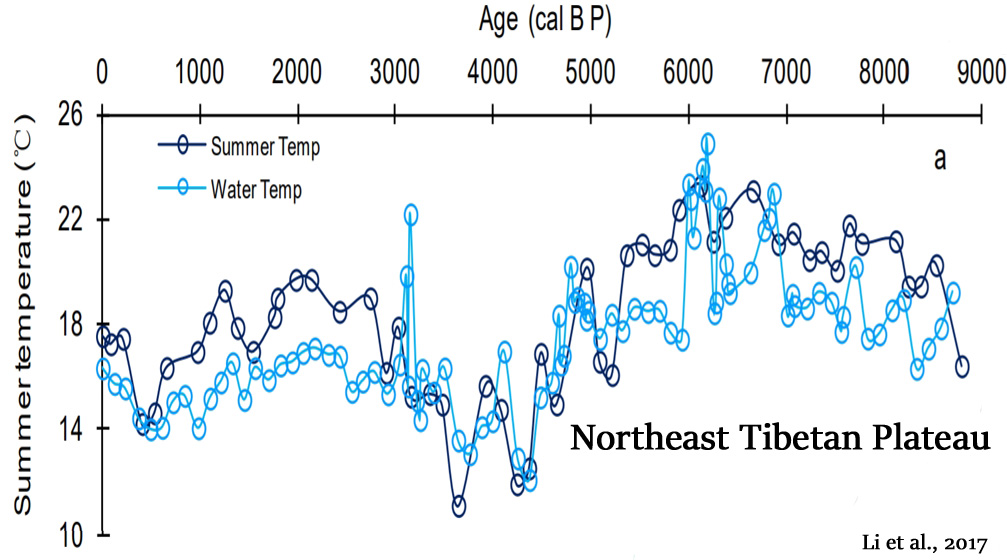
Chang et al., 2017
“The chironomid-based record from Heihai Lake shows a summer temperature fluctuation within 2.4°C in the last c. 5000 years from the south-east margin of the QTP [Qinghai–Tibetan Plateau]. … The summer temperature changes in this region respond primarily to the variation in the Asian Summer Monsoon. The variability of solar activity is likely an important driver of summer temperatures, either directly or by modifying the strength and intensity of the Indian Ocean Summer Monsoon. … We observed a relatively long-lasting summer cooling episode (c. 0.8°C lower than the 5000-year average) between c. 270 cal. BP and AD c. 1956. … The record shows cooling episodes occurred at c. 3100, 2600, 2100 and 1600 cal. BP. This is likely related to the period defined as the Northern Hemisphere Little Ice Age (LIA; c. AD 1350–1850, equivalent to 600–100 cal. BP). These possibly relate to the 500-year quasi-periodic solar cycle. Cooling stages between c. 270 and 100 cal. BP were also recorded and these are possibly linked to the LIA suggesting a hemisphere-wide forcing mechanism for this event.”
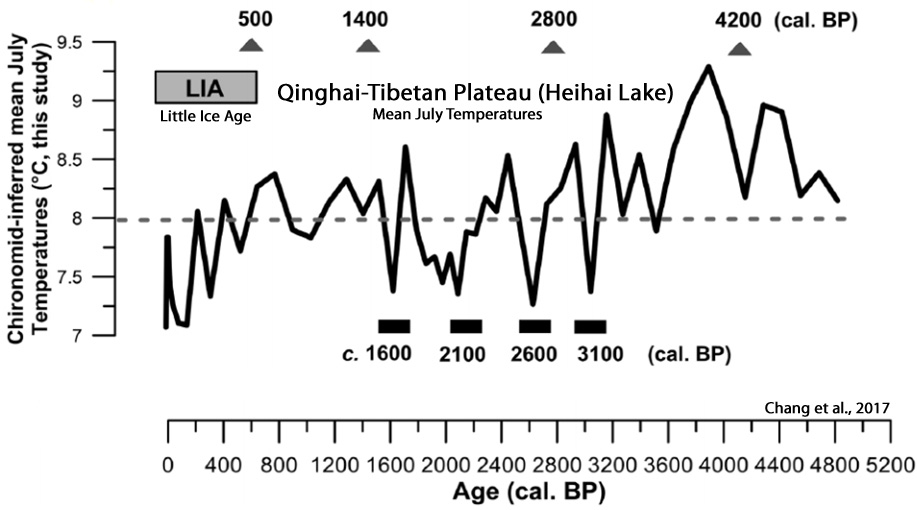
Lan et al., 2017
“The results show that the centennial HCA [High Central Asia] temperature changes not only significantly correlate with those in China (Yang et al., 2002a) and northwestern China (He et al., 2013), but also with those in Northern Hemisphere (Moberg et al., 2005; Ljungqvist, 2010), implying that the centennial HCA [High Central Asia] temperature changes may have similar driving forces with those in Northern Hemisphere at least over the past two millennia, like solar forcing (Bond et al., 2001; Gray et al., 2010; Moffa-Sanchez et al., 2014) and volcanic eruption (Schurer et al., 2014; Sigl et al., 2015; Stoffel et al., 2015), etc.”
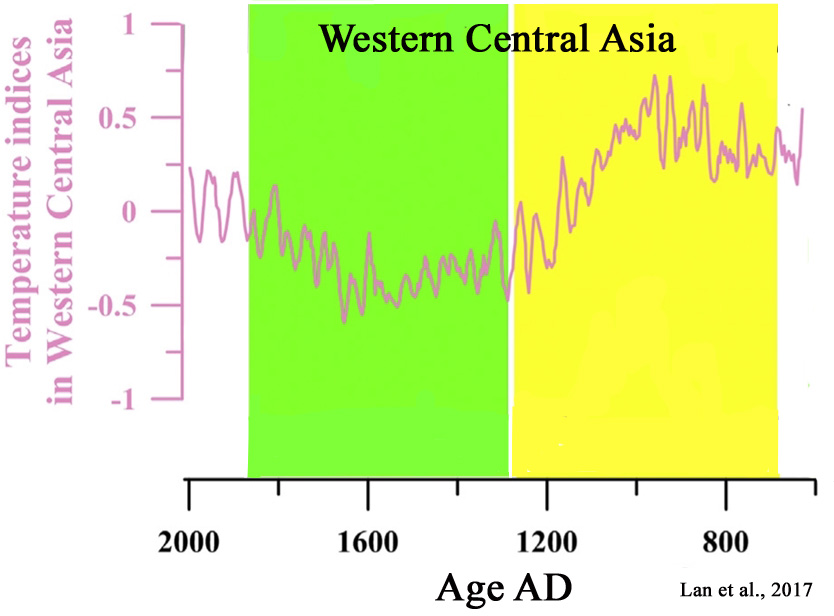
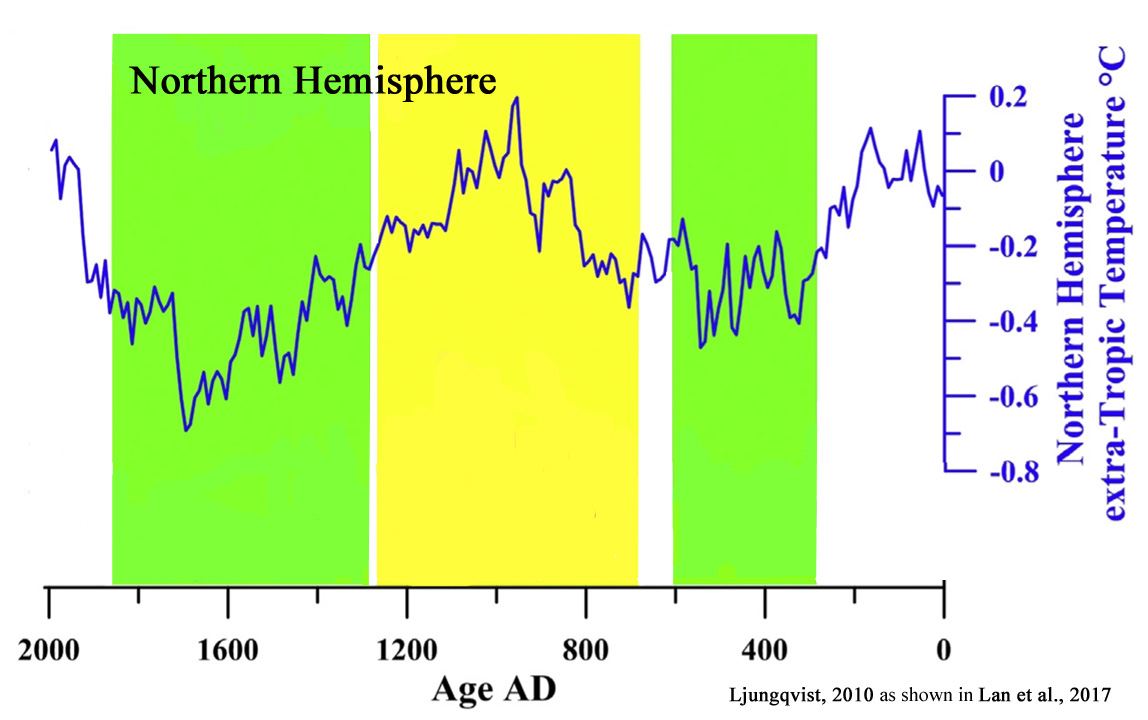
Oliveira et al., 2017
“The transient simulations under the combined effect of insolation and CO2 indicate that the interglacial vegetation and climate dynamics over SW Iberia have no apparent relationship to atmospheric CO2 concentration, as suggested by the pollen-based reconstructions (Fig. 8a, b). Although the direct impact of CO2 changes on the vegetation growth is not included in the model, a prominent example for this negligible CO2 forcing is given by its relatively high concentrations over the end of the interglacials, in particular for MIS 1 and MIS 11c, while the forest cover, annual temperature and annual precipitation achieved minimum values (Fig. 8a, b).”
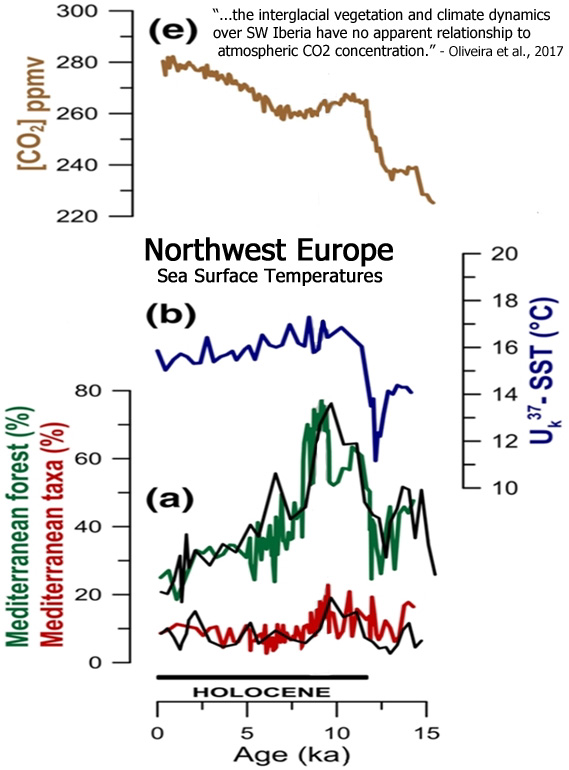
Krossa et al., 2017
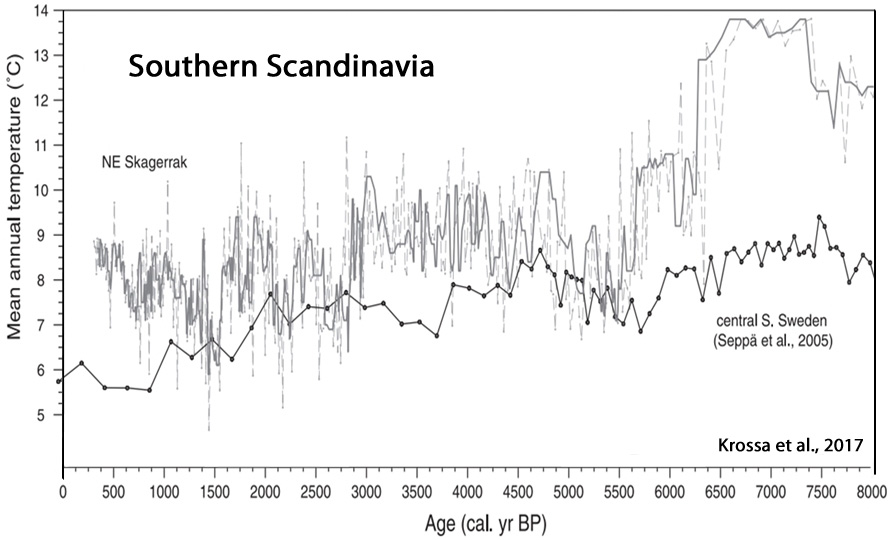
Xu et al., 2017
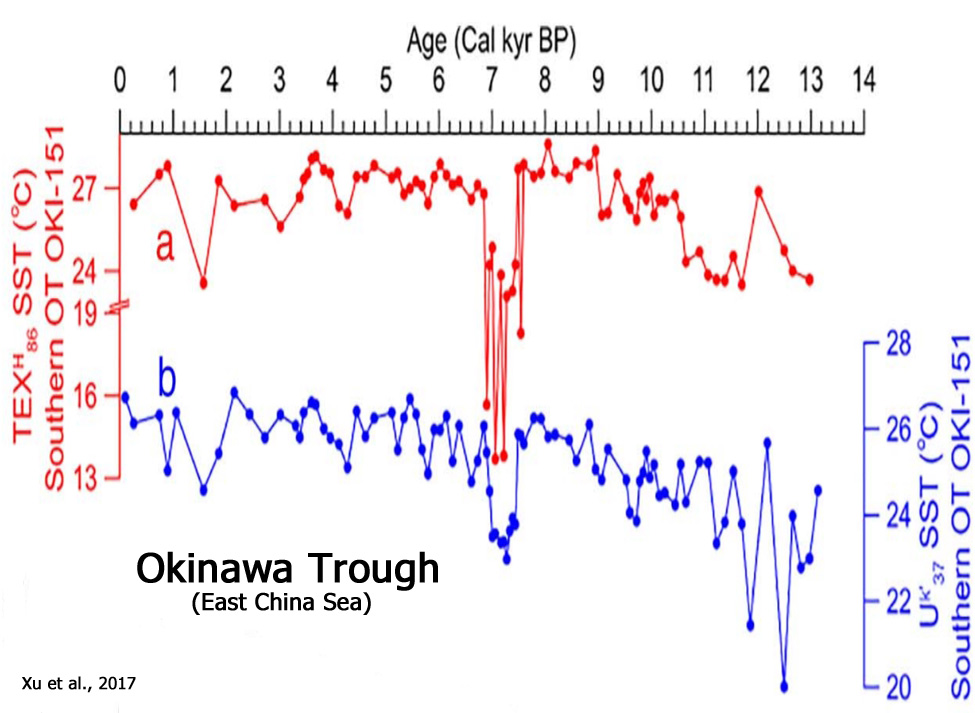
Albot, 2017
“Growing paleoclimatic evidence suggests that the climatic signals of Medieval Warm Period and the Little Ice Age events can be detected around the world (Mayewski et al., 2004; Bertler et al., 2011). … [T]he causes for these events are still debated between changes in solar output, increased volcanic activity, shifts in zonal wind distribution, and changes in the meridional overturning circulation (Crowley, 2000; Hunt, 2006).”
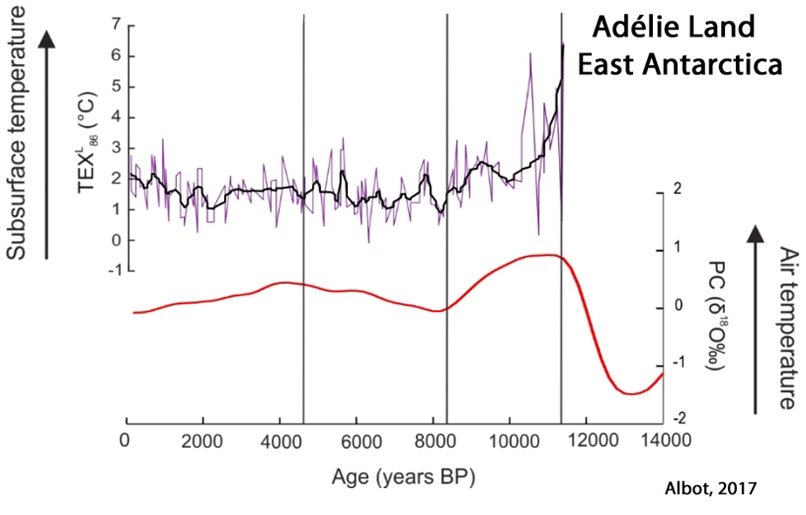
Ön et al., 2017
“[T]he abrupt decline in both precipitation and temperature around 3.5 ka, 2.8 ka and 1.8 ka BP, which were also documented in the seismic records (Eris¸ et al., submitted), may have been the result of a coincidence of the strengthening of the Siberian high pressure system during winters (Rohling et al., 2002; Çagatay et al., 2014), and the gradual decrease in solar irradiance, especially around 2.8 ka BP (Roth and Joos, 2013), in accordance with changes in the North Atlantic (Bond et al., 2001). For the Holocene, the most striking result is that the spikes in precipitation and temperature records appear to closely follow the North Atlantic Bond events, whereas the trends do not. If the cause of the Bond events is indeed solar forcing, as claimed by Bond et al. (2001), then we can also state that the climate oscillations in the region were also greatly influenced by solar forcing.”
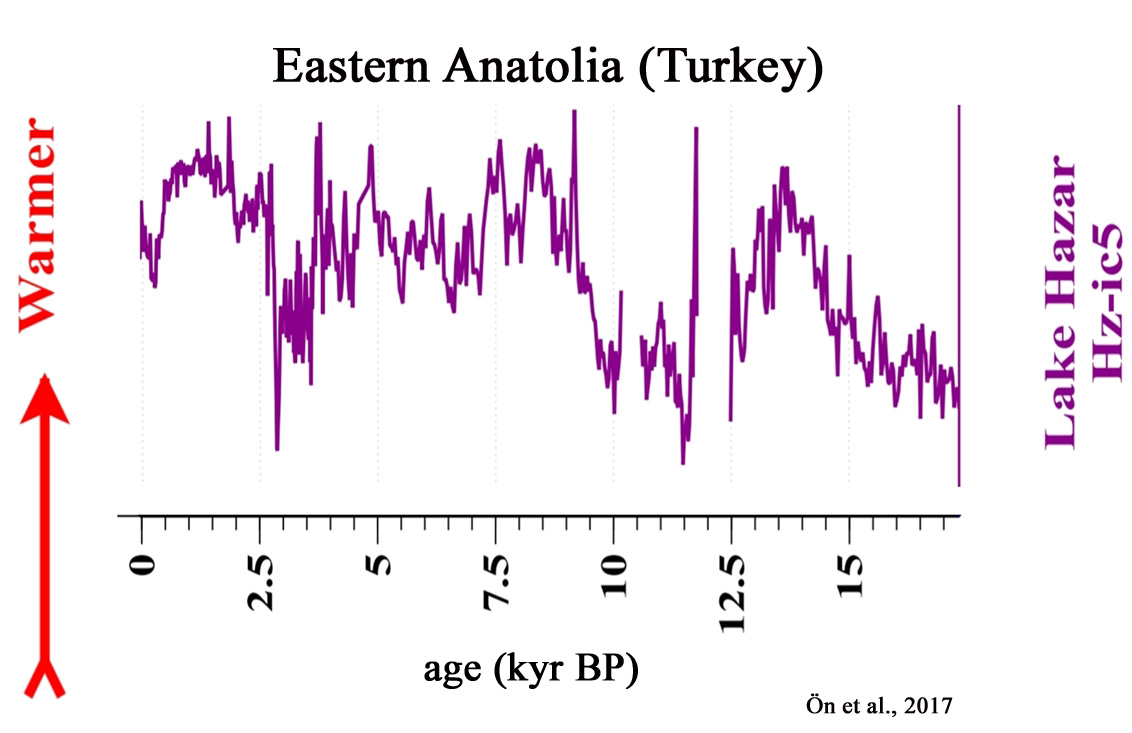
Chu et al., 2017
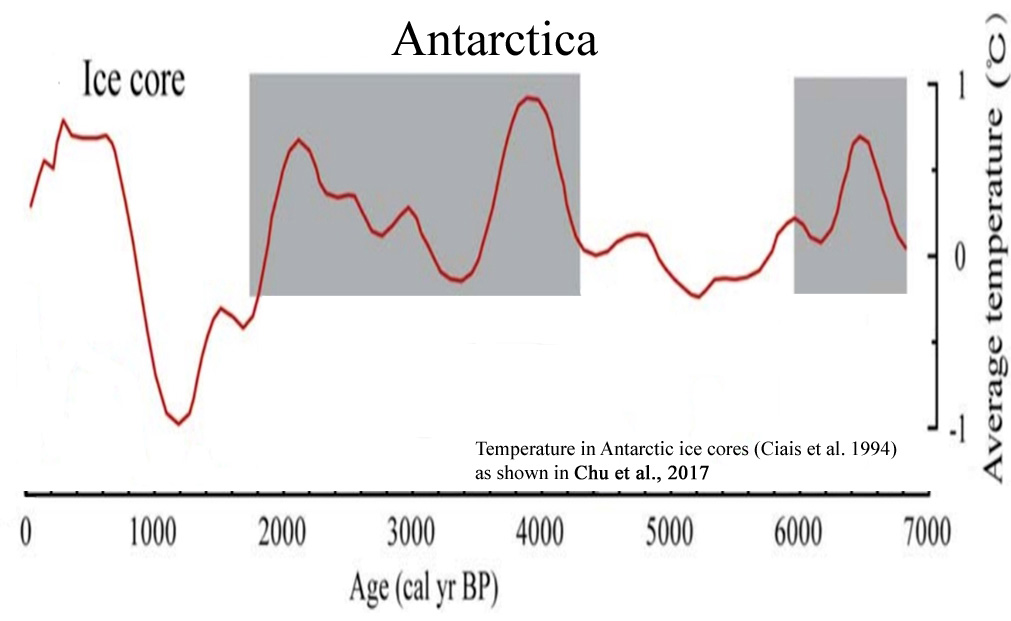
Zhang et al., 2017
“[S]ummer temperature variability at the QTP [Qinghai-Tibetan Plateau] responds rapidly to solar irradiance changes in the late Holocene”
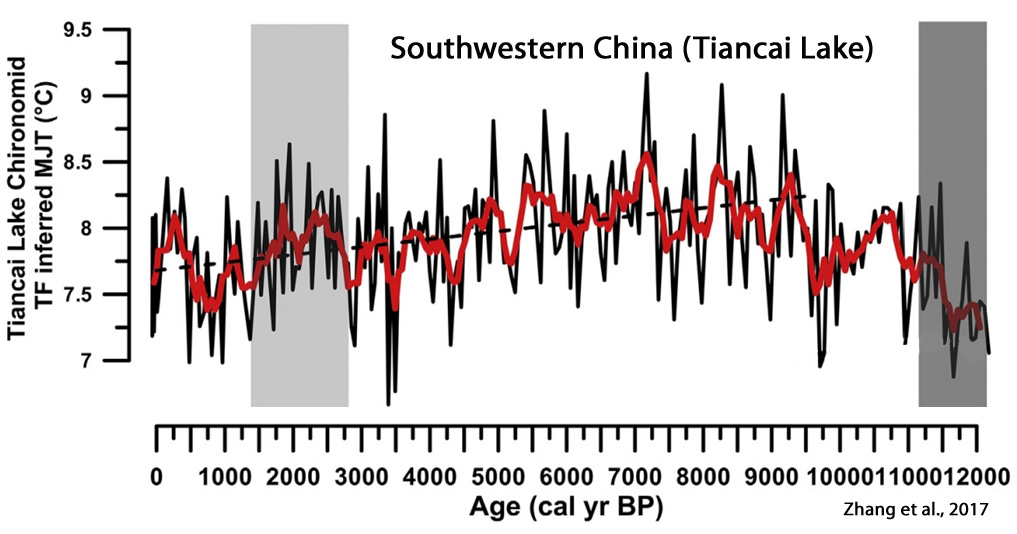
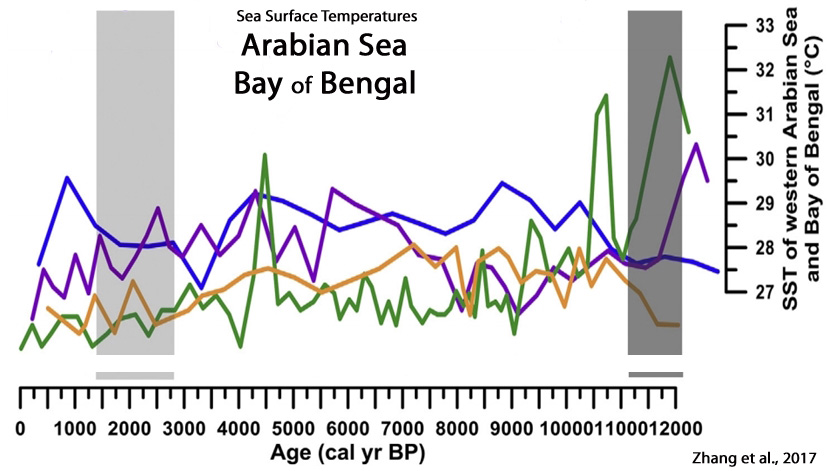
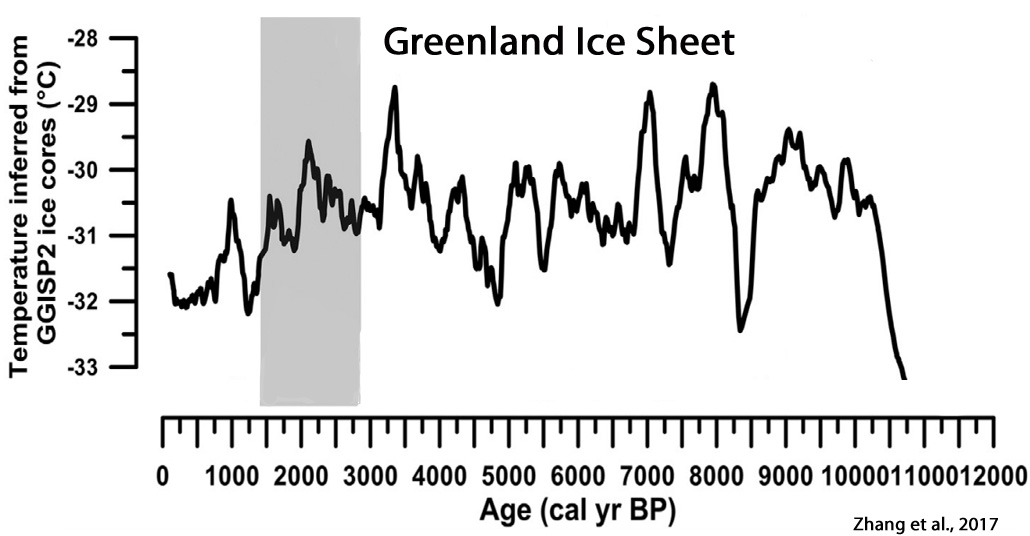
Kotthoff et al., 2017
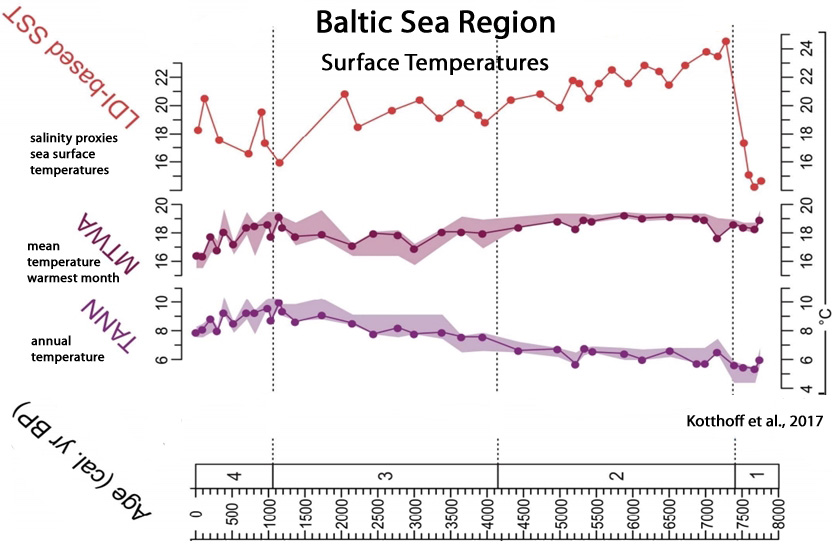
Yao et al., 2017
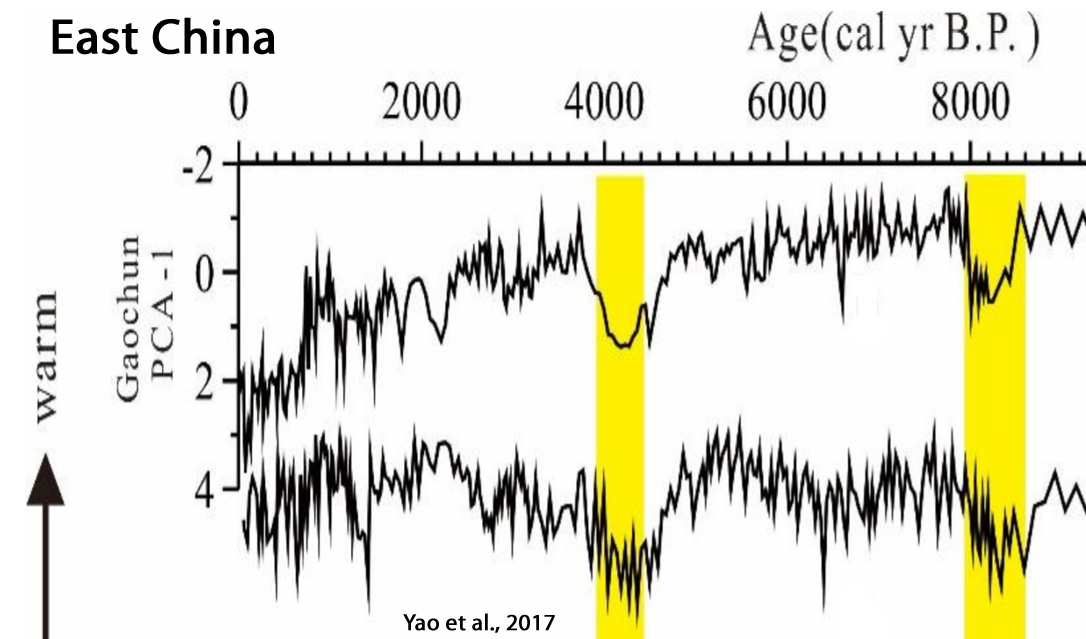
Jara et al., 2017
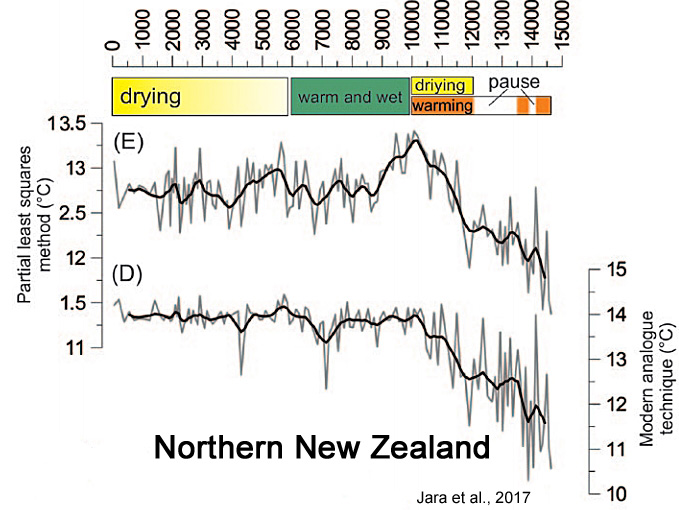
Li et al., 2017
“Overall, the strong linkage between solar variability and summer SSTs is not only of regional significance, but is also consistent over the entire North Atlantic region.”
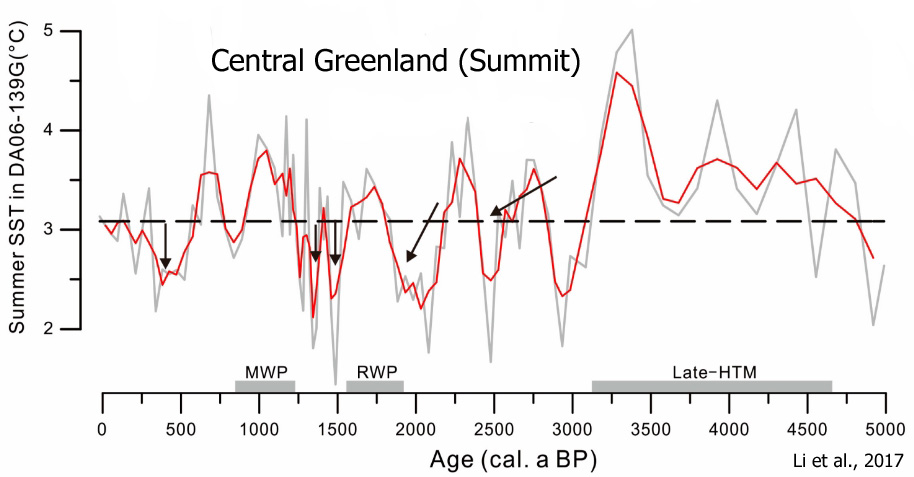
Jones et al., 2017
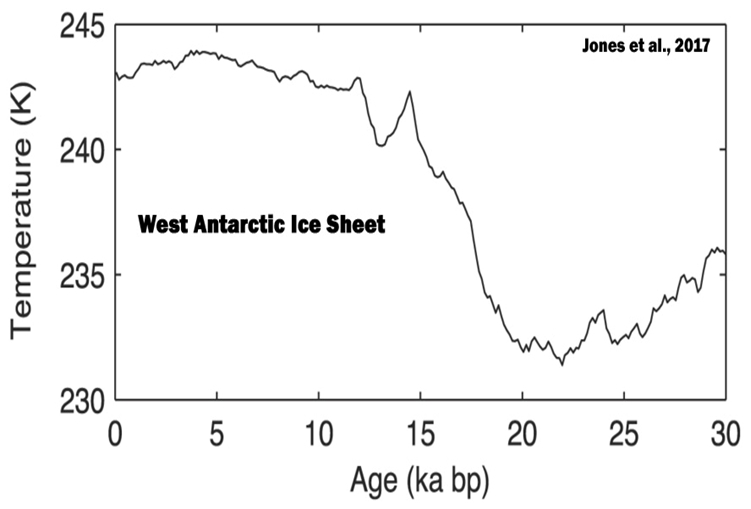
Zhang et al., 2017

Vachula et al., 2017
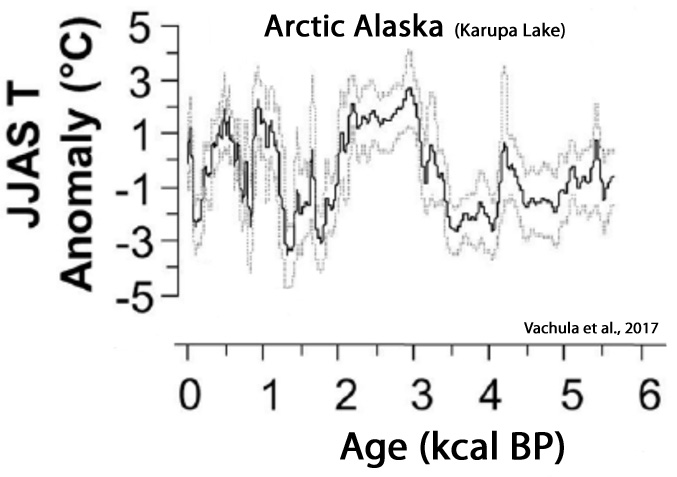
Fischel et al., 2017
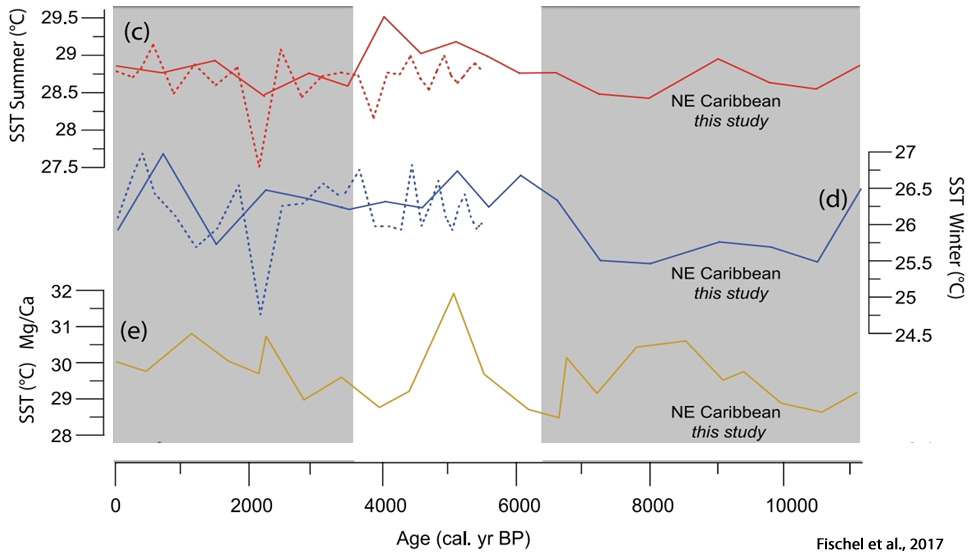
Li et al., 2017
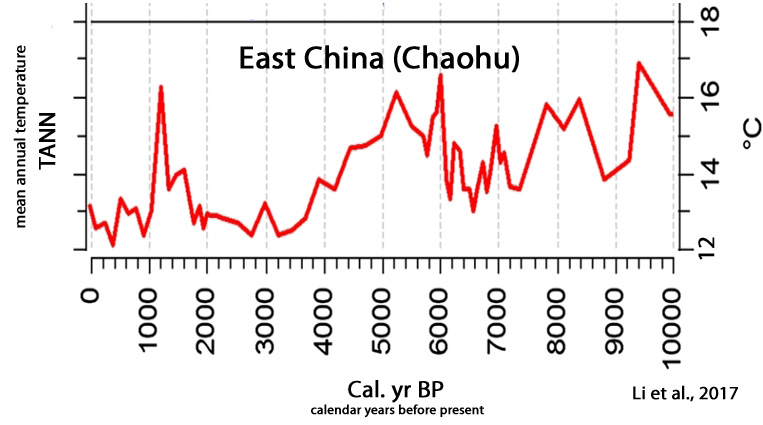
Anderson et al., 2017
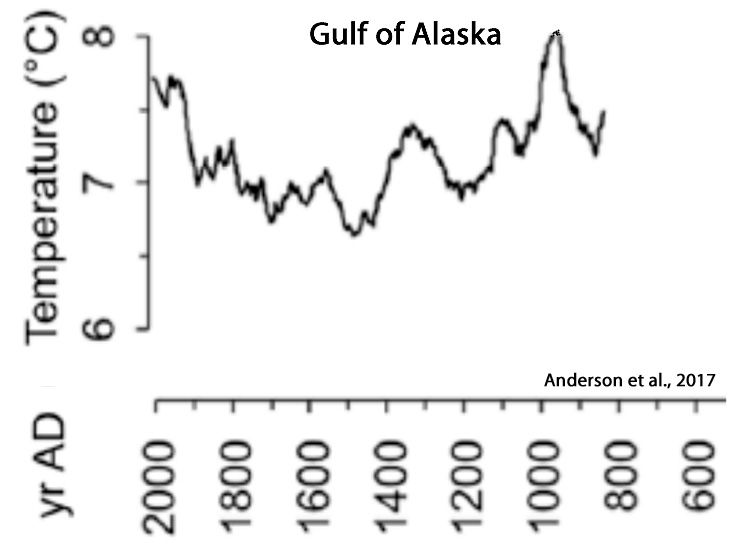
Woodson et al., 2017
“The last ca. 1000 years recorded the warmest SST averaging 28.5°C. We record, for the first time in this region, a cool interval, ca. 1000 years in duration, centered on 5000 cal years BP concomitant with a wet period recorded in Borneo. The record also reflects a warm interval from ca. 1000 to 500 cal years BP that may represent the Medieval Climate Anomaly. Variations in the East Asian Monsoon (EAM) and solar activity are considered as potential drivers of SST trends. However, hydrology changes related to the El Nino-Southern Oscillation (ENSO) variability, ~ shifts of the Western Pacific Warm Pool and migration of the Intertropical Convergence Zone are more likely to have impacted our SST temporal trend. … The SA [solar activity] trends (Steinhilber et al., 2012) are in general agreement with the regional cooling of SST (Linsley et al., 2010) and the SA [solar activity] oscillations are roughly coincident with the major excursions in our SST data.”
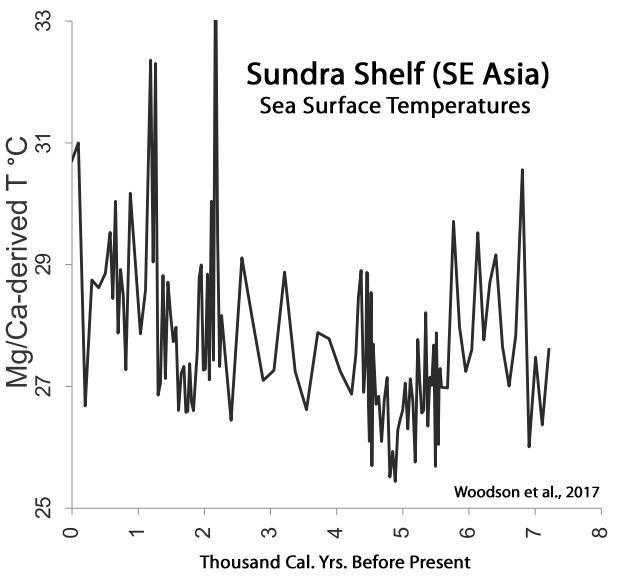
Koutsodendris et al., 2017
“Representing one of the strongest global climate instabilities during the Holocene, the Little Ice Age (LIA) is marked by a multicentennial-long cooling (14-19th centuries AD) that preceded the recent ‘global warming’ of the 20th century. The cooling has been predominantly attributed to reduced solar activity and was particularly pronounced during the 1645-1715 AD and 1790-1830 AD solar minima, which are known as Maunder and Dalton Minima, respectively.”

Browne et al., 2017
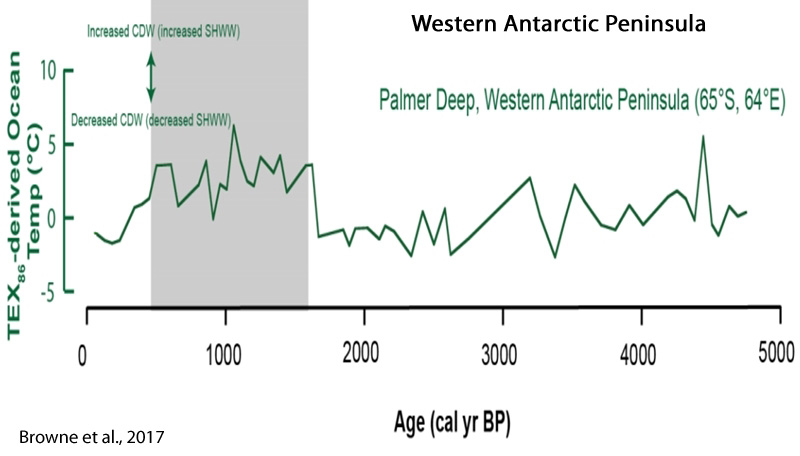
Perșoiu et al., 2017
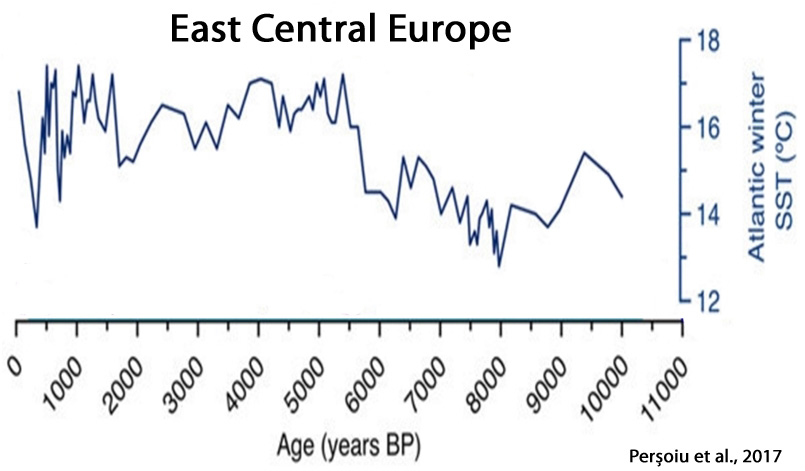
Kawahata et al., 2017
“The SST [sea surface temperature] shows a broad maximum (~17.3 °C) in the mid-Holocene (5-7 cal kyr BP), which corresponds to the Jomon transgression. … The SST maximum continued for only a century and then the SST [sea surface temperatures] dropped by 3.5 °C [15.1 to 11.6 °C] within two centuries. Several peaks fluctuate by 2°C over a few centuries.”
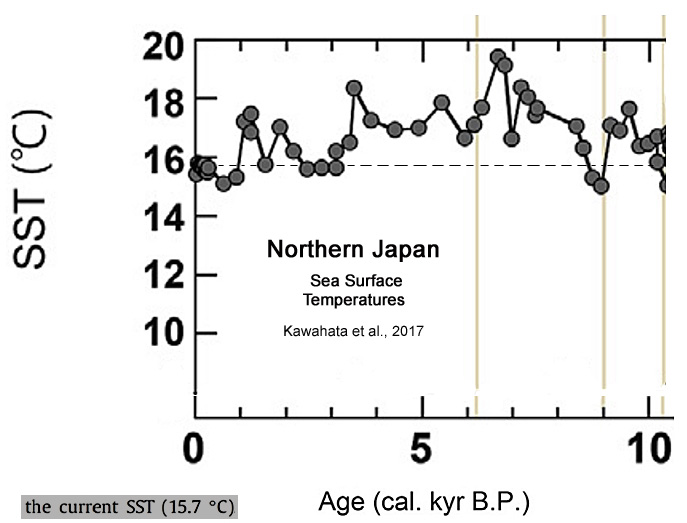
Saini et al., 2017
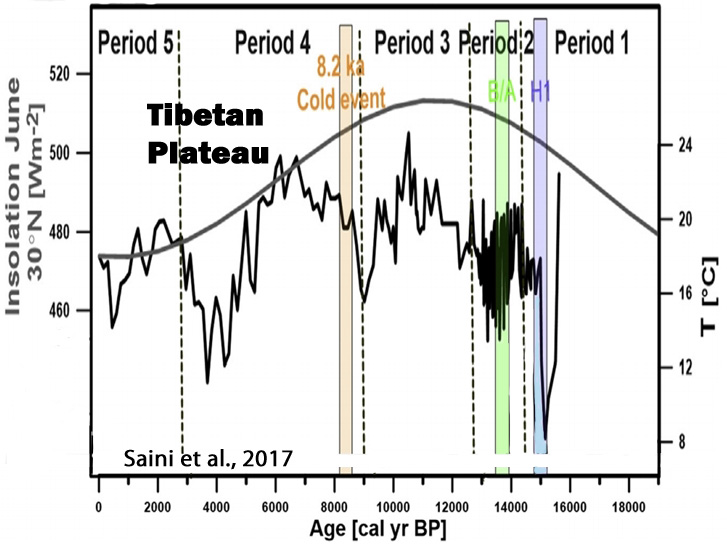
Dechnik et al., 2017
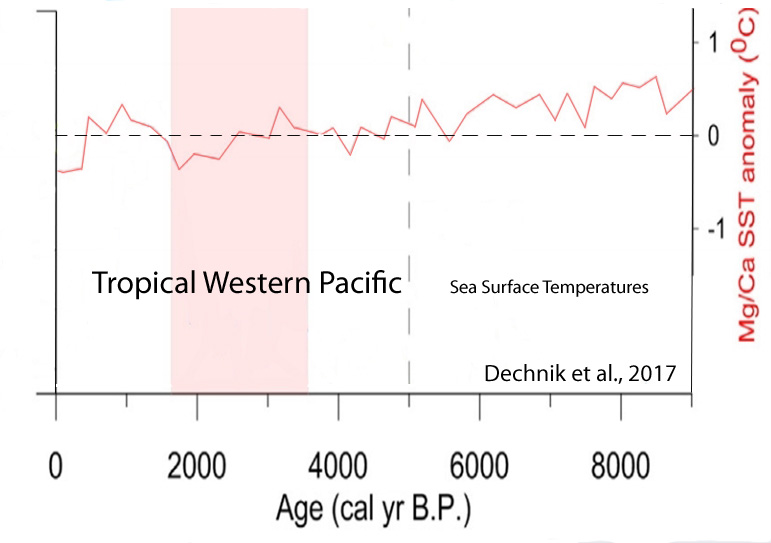
Wu et al., 2017

Sun et al., 2017
“Our findings are generally consistent with other records from the ISM [Indian Summer Monsoon] region, and suggest that the monsoon intensity is primarily controlled by solar irradiance on a centennial time scale. This external forcing may have been amplified by cooling events in the North Atlantic and by ENSO activity in the eastern tropical Pacific, which shifted the ITCZ further southwards.”

Wu et al., 2017
“The existence of depressed MAAT [mean annual temperatures] (1.3°C lower than the 3200-year average) between 1480 CE and 1860 CE (470–90 cal. yr BP) may reflect the manifestation of the ‘Little Ice Age’ (LIA) in southern Costa Rica. Evidence of low-latitude cooling and drought during the ‘LIA’ has been documented at several sites in the circum-Caribbean and from the tropical Andes, where ice cores suggest marked cooling between 1400 CE and 1900 CE. Lake and marine records recovered from study sites in the southern hemisphere also indicate the occurrence of ‘LIA’ cooling. High atmospheric aerosol concentrations, resulting from several large volcanic eruptions and sea-ice/ocean feedbacks, have been implicated as the drivers responsible for the ‘LIA’.”
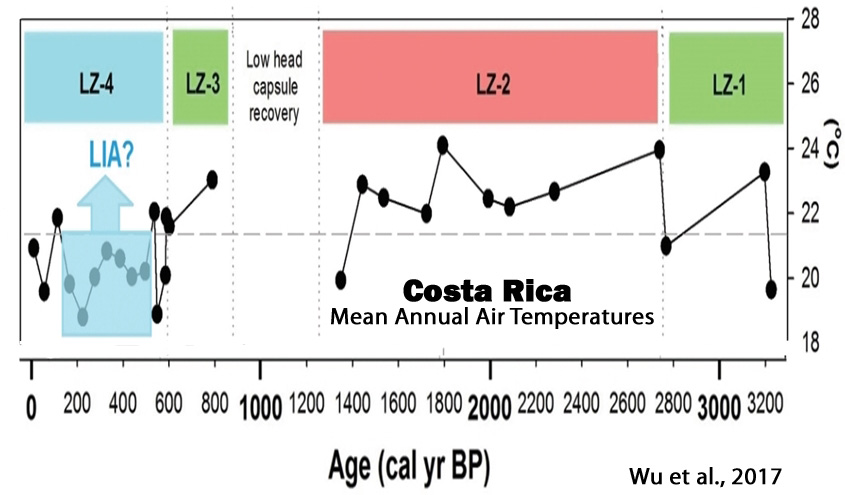
Park, 2017
“Late Holocene climate change in coastal East Asia was likely driven by ENSO variation. Our tree pollen index of warmness (TPIW) shows important late Holocene cold events associated with low sunspot periods such as Oort, Wolf, Spörer, and Maunder Minimum. Comparisons among standard Z-scores of filtered TPIW, ΔTSI, and other paleoclimate records from central and northeastern China, off the coast of northern Japan, southern Philippines, and Peru all demonstrate significant relationships [between solar activity and climate]. This suggests that solar activity drove Holocene variations in both East Asian Monsoon (EAM) and El Niño Southern Oscillation (ENSO).”
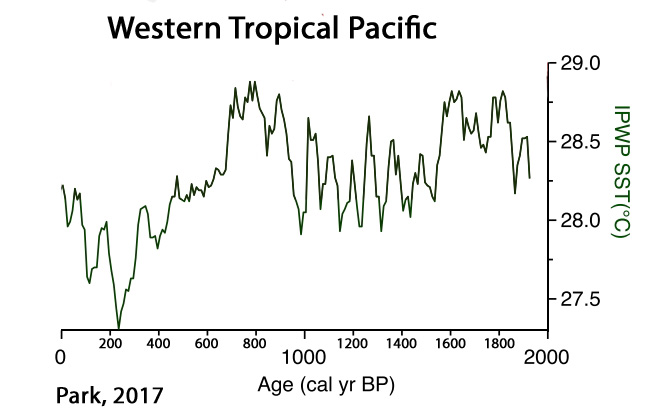
Dong et al., 2017
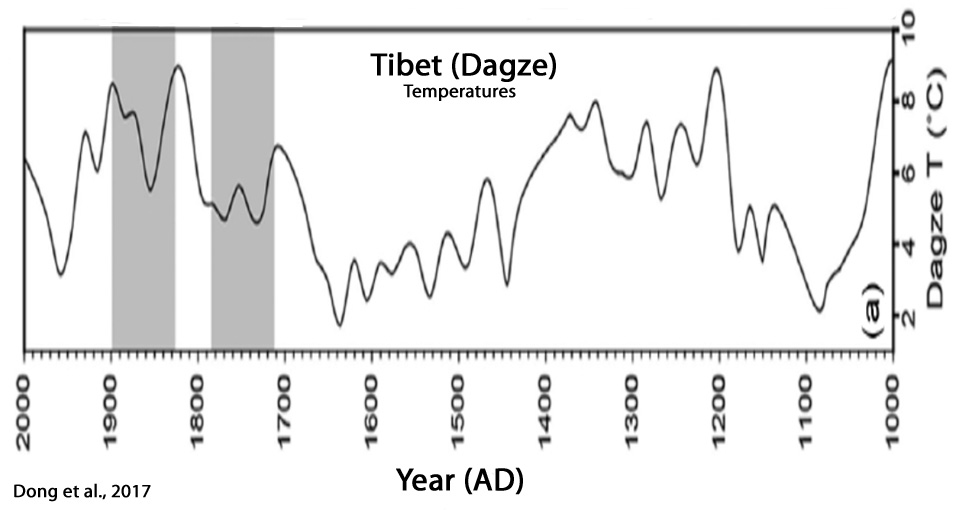
Nazarova et al., 2017
“The application of transfer functions resulted in reconstructed T July fluctuations of approximately 3 °C over the last 2800 years. Low temperatures (11.0-12.0 °C) were reconstructed for the periods between ca 1700 and 1500 cal yr BP (corresponding to the Kofun cold stage) and between ca 1200 and 150 cal yr BP (partly corresponding to the Little Ice Age [LIA]). Warm periods (modern T[emperatures] July or higher) were reconstructed for the periods between ca 2700 and 1800 cal yr BP, 1500 and 1300 cal yr BP and after 150 cal yr BP.”
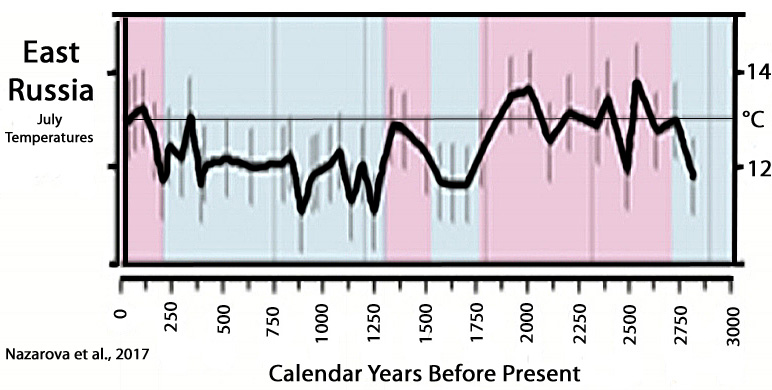
Samartin et al., 2017
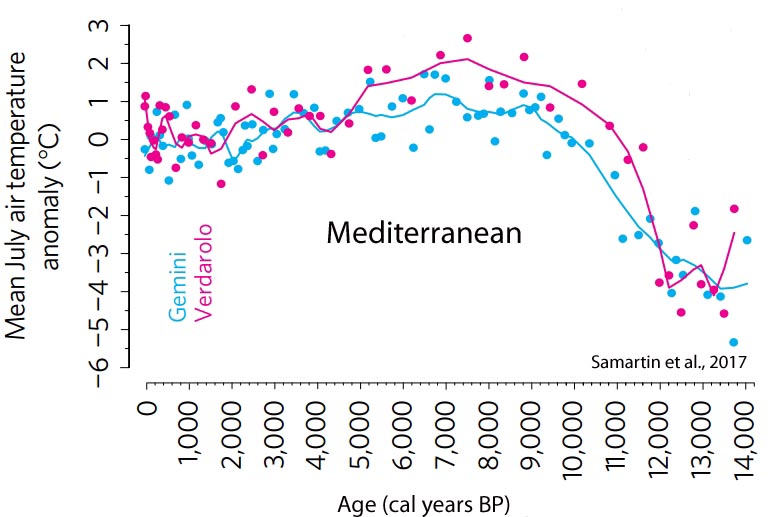
Thienemann et al., 2017
“[P]roxy-inferred annual MATs[annual mean air temperatures] show the lowest value at 11,510 yr BP (7.6°C). Subsequently, temperatures rise to 10.7°C at 9540 yr BP followed by an overall decline of about 2.5°C until present (8.3°C).”
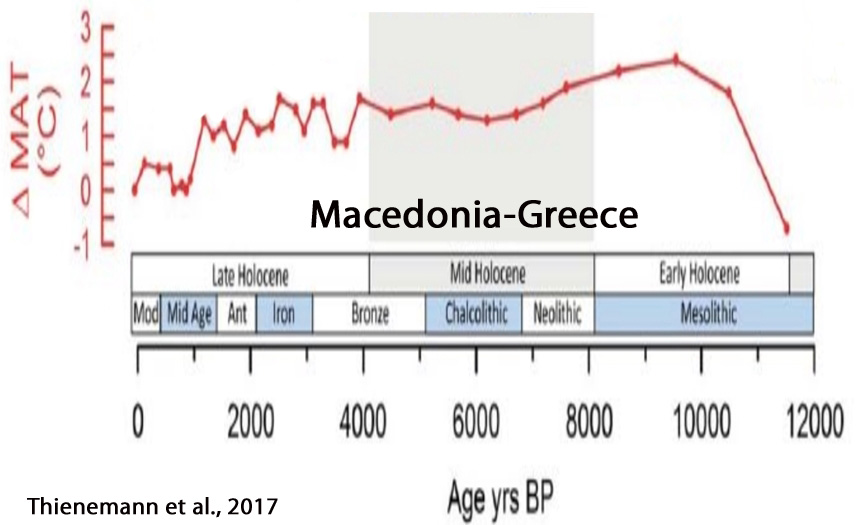
Li et al., 2017
“Contrary to the often-documented warming trend over the past few centuries, but consistent with temperature record from the northern Tibetan Plateau, our data show a gradual decreasing trend of 0.3 °C in mean annual air temperature from 1750 to 1970 CE. This result suggests a gradual cooling trend in some high altitude regions over this interval, which could provide a new explanation for the observed decreasing Asian summer monsoon. In addition, our data indicate an abruptly increased interannual-to decadal-scale temperature variations of 0.8 – 2.2 °C after 1970 CE, in terms of both magnitude and frequency, indicating that the climate system in high altitude regions would become more unstable under current global warming.”
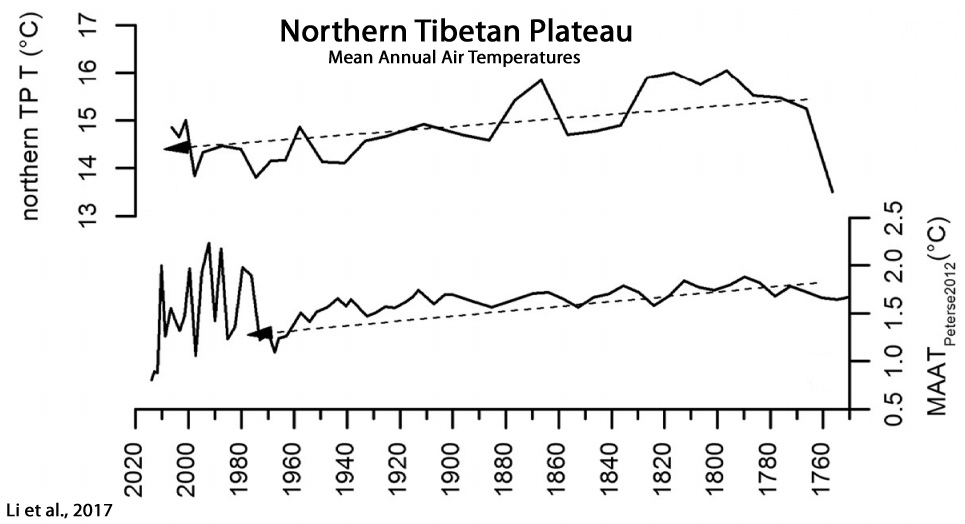
Krawczyk et al., 2017
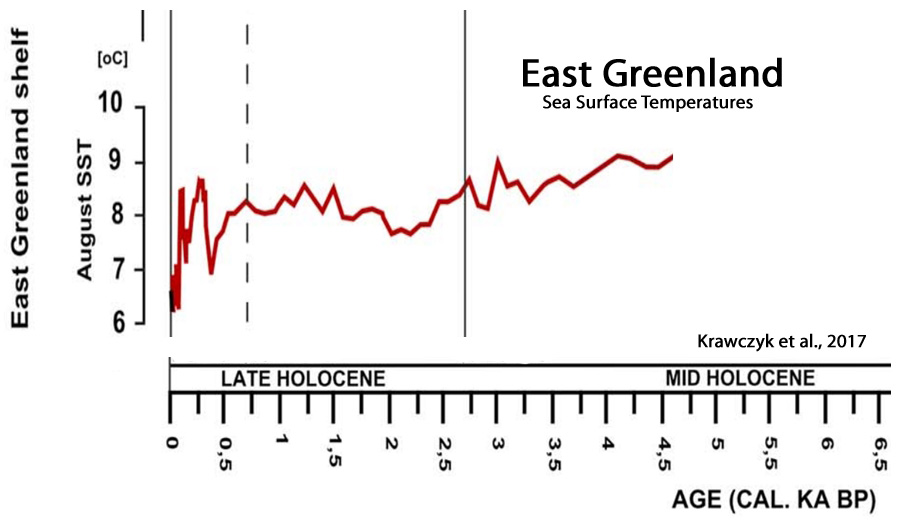
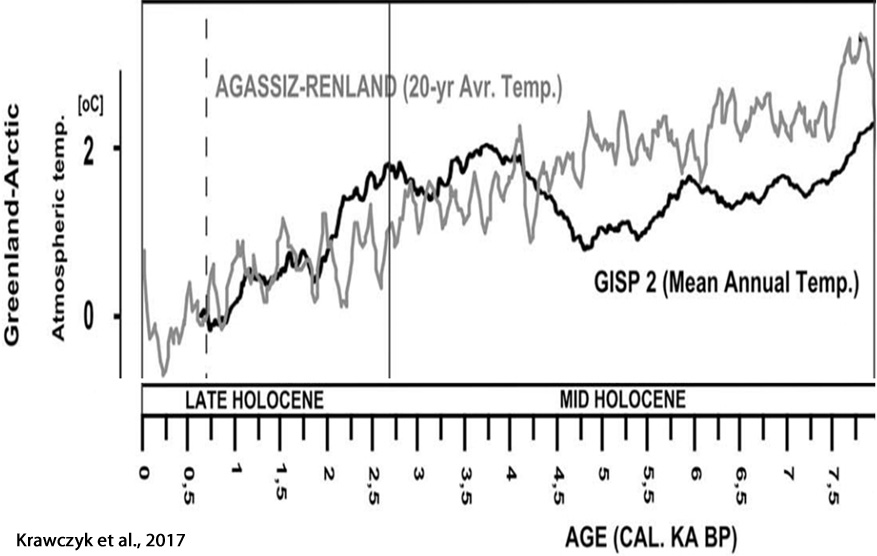
Markle et al., 2017
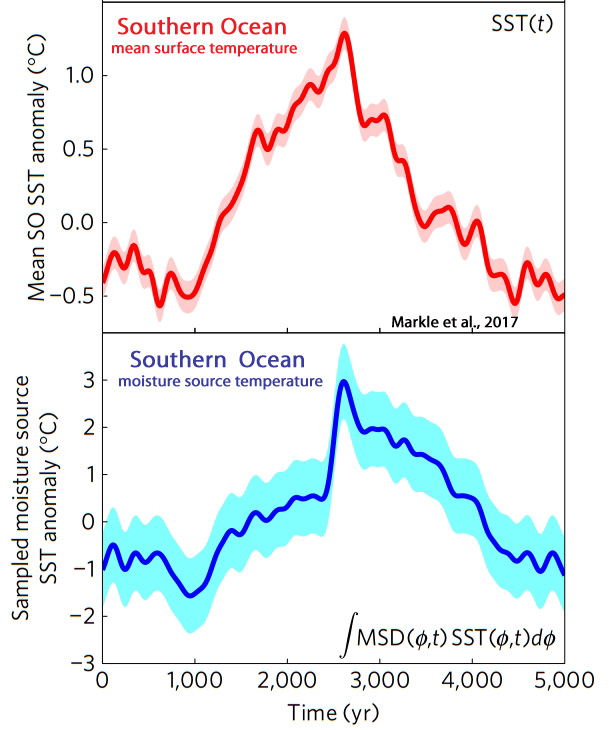
Bird et al., 2017
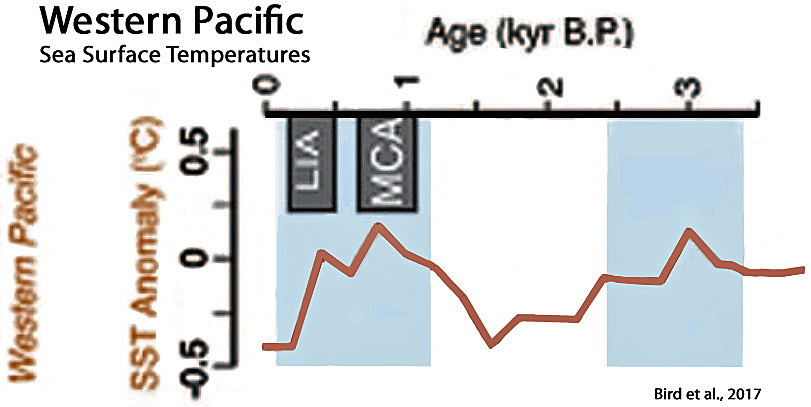
Dodrill et al., 2017
“These archaeological reconstructions of average palaeo-SST during the 1500–1100 cal BP time-period suggest that the nearshore environments of Palau were slightly warmer than those today by approximately 1–2°C.”


Recent Comments