160 Papers Find Extremely Low CO2 Climate Sensitivity
(a) Quantified Low Climate Sensitivity to Doubled CO2
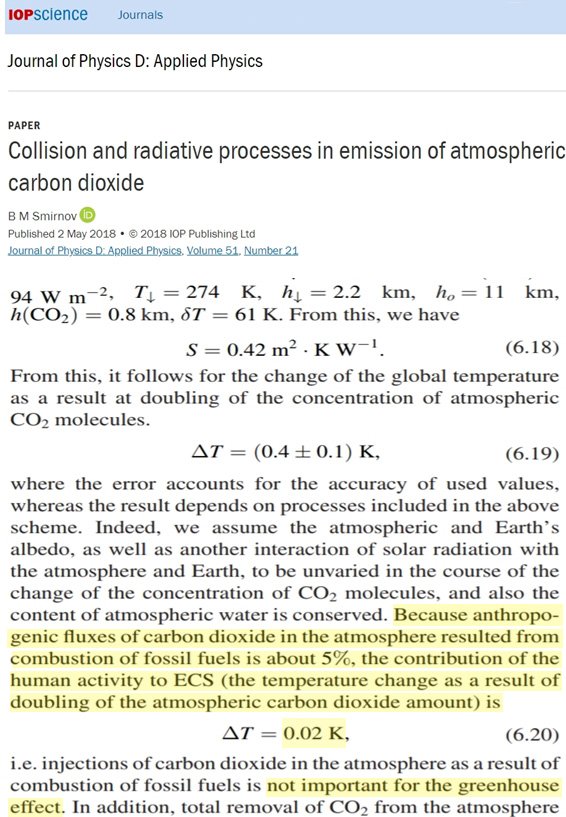
Smirnov, 2018 (2X CO2 = 0.4°C) (2X AnthroCO2 = 0.02°C)
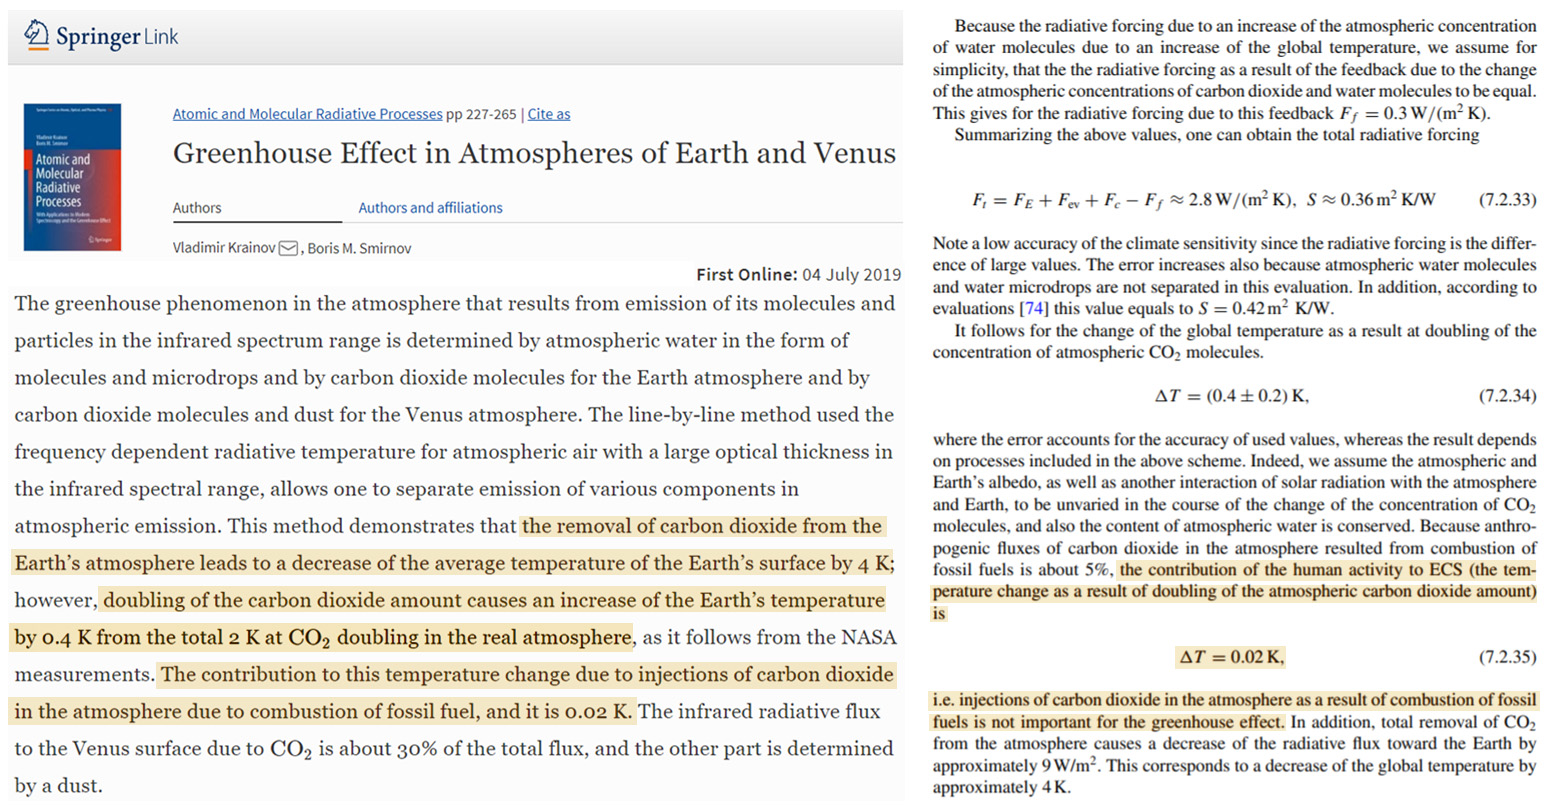
From this, it follows for the change of the global temperature as a result at doubling of the concentration of atmospheric CO2 molecules [is] ∆T = (0.4 ± 0.1) K, where the error accounts for the accuracy of used values, whereas the result depends on processes included in the above scheme. Indeed, we assume the atmospheric and Earth’s albedo, as well as another interaction of solar radiation with the atmosphere and Earth, to be unvaried in the course of the change of the concentration of CO2 molecules, and also the content of atmospheric water is conserved. Because anthropogenic fluxes of carbon dioxide in the atmosphere resulted from combustion of fossil fuels is about 5% [Kaufman, 2007], the contribution of the human activity to ECS (the temperature change as a result of doubling of the atmospheric carbon dioxide amount) is ∆T = 0.02 K, i.e. injections of carbon dioxide in the atmosphere as a result of combustion of fossil fuels is not important for the greenhouse effect.
Chen et al., 2023 (2X CO2 [380 to 760 ppm] = 2.26 W/m² TOA forcing, 0.72°C)
[Transmissivity ] in the CO2 band center is unchanged by increased CO2 as the absorption is already saturated…[T]he water vapor and CO2 overlapping at an absorbing band prevents absorption by additional CO2. … The [doubled CO2] forcing in polar regions is strongly hemispheric asymmetric and is negative in the Antarctic. … The water vapor usually damps the [doubled CO2] forcing by reducing the energy additional CO2 can absorb.
![]()
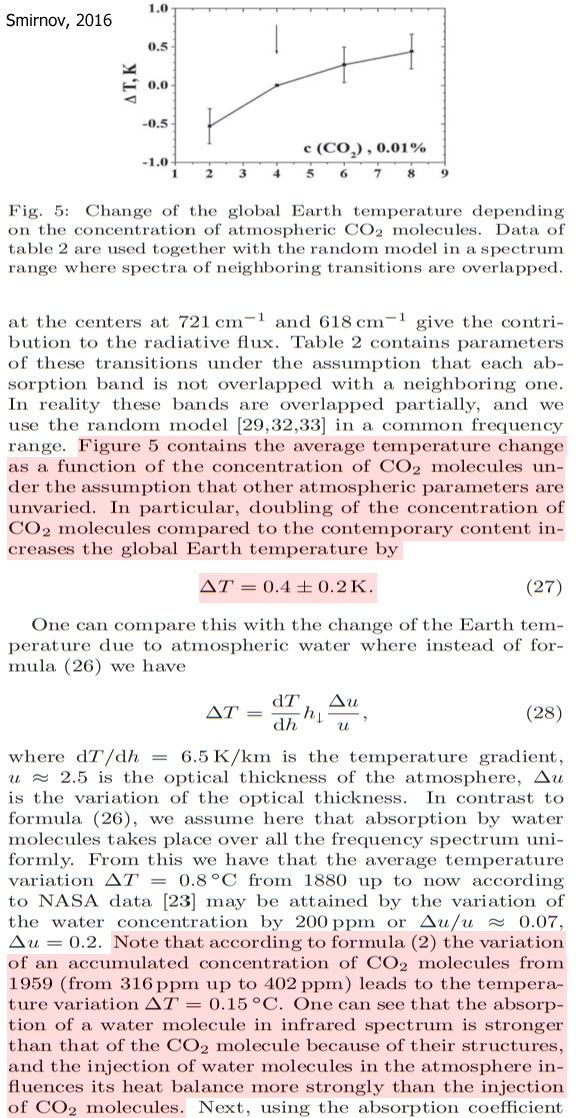
Smirnov, 2016 (2X CO2 = 0.4°C) (316-402 ppm = 0.15°C)
[W]e take into account that CO2 molecules give a small contribution to the heat Earth balance and, therefore, one can use the altitude distribution of the temperature for the standard atmosphere model [1], and a variation of the CO2 concentration does not influence this distribution. … [I]njection of CO2 molecules into the atmosphere leads to a decrease of the outgoing radiation flux that causes a decrease of the average Earth temperature. But this decrease is below 0.1K that is the accuracy of determination of this value. Thus, the presence of carbon dioxide in the atmosphere decreases the outgoing atmospheric radiative flux that leads to a decrease of the Earth temperature by approximately (1.8 ± 0.1) K. The change of the average temperature at the double of the concentration of atmospheric CO2 molecules is determined by the transition at 667cm−1 only and is lower than 0.1K.
In particular, doubling of the concentration of CO2 molecules compared to the contemporary content increases the global Earth temperature by ΔT = 0.4 ± 0.2K. … From this we have that the average temperature variation ΔT = 0.8 ◦C from 1880 up to now according to NASA data may be attained by the variation of the water concentration by 200ppm or Δu/u ≈ 0.07, Δu = 0.2. Note that according to formula (2) the variation of an accumulated concentration of CO2 molecules from 1959 (from 316ppm up to 402ppm) leads to the temperature variation ΔT = 0.15°C. One can see that the absorption of a water molecule in infrared spectrum is stronger than that of the CO2 molecule because of their structures, and the injection of water molecules in the atmosphere influences its heat balance more strongly than the injection of CO2 molecules.
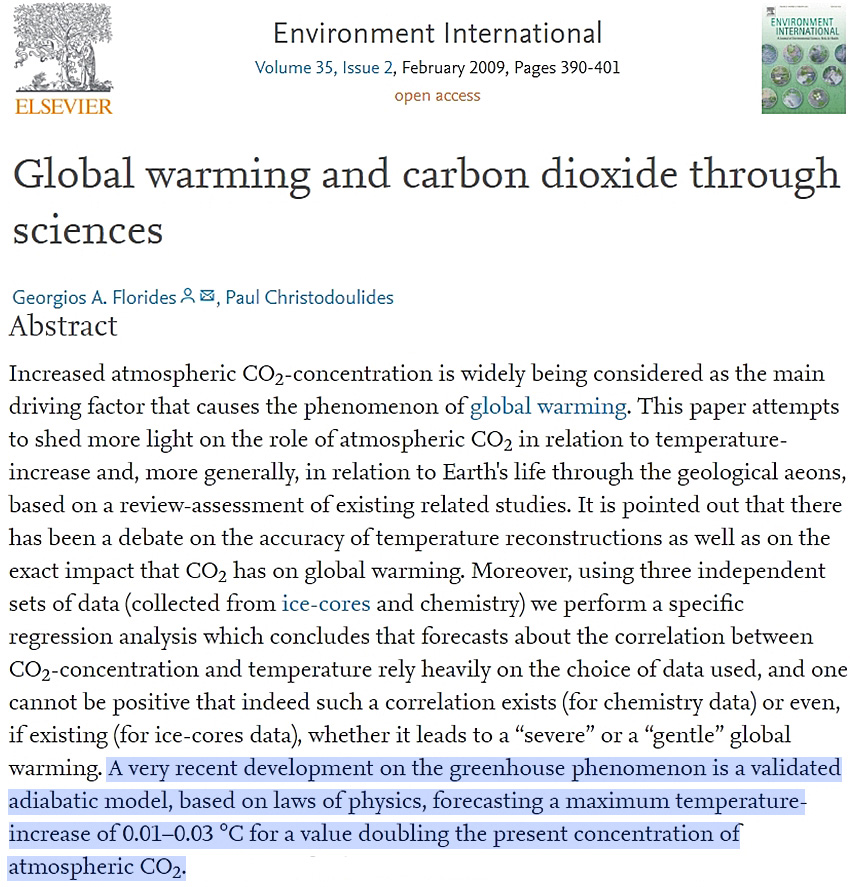
Florides and Christodoulides, 2009 (2X CO2 = ~0.02°C)
A very recent development on the greenhouse phenomenon is a validated adiabatic model, based on laws of physics, forecasting a maximum temperature-increase of 0.01–0.03 °C for a value doubling the present concentration of atmospheric CO2. Moreover, data from palaeoclimatology show that the CO2-content in the atmosphere is at a minimum in this geological aeon. Finally it is stressed that the understanding of the functioning of Earth’s complex climate system (especially for water, solar radiation and so forth) is still poor and, hence, scientific knowledge is not at a level to give definite and precise answers for the causes of global warming.
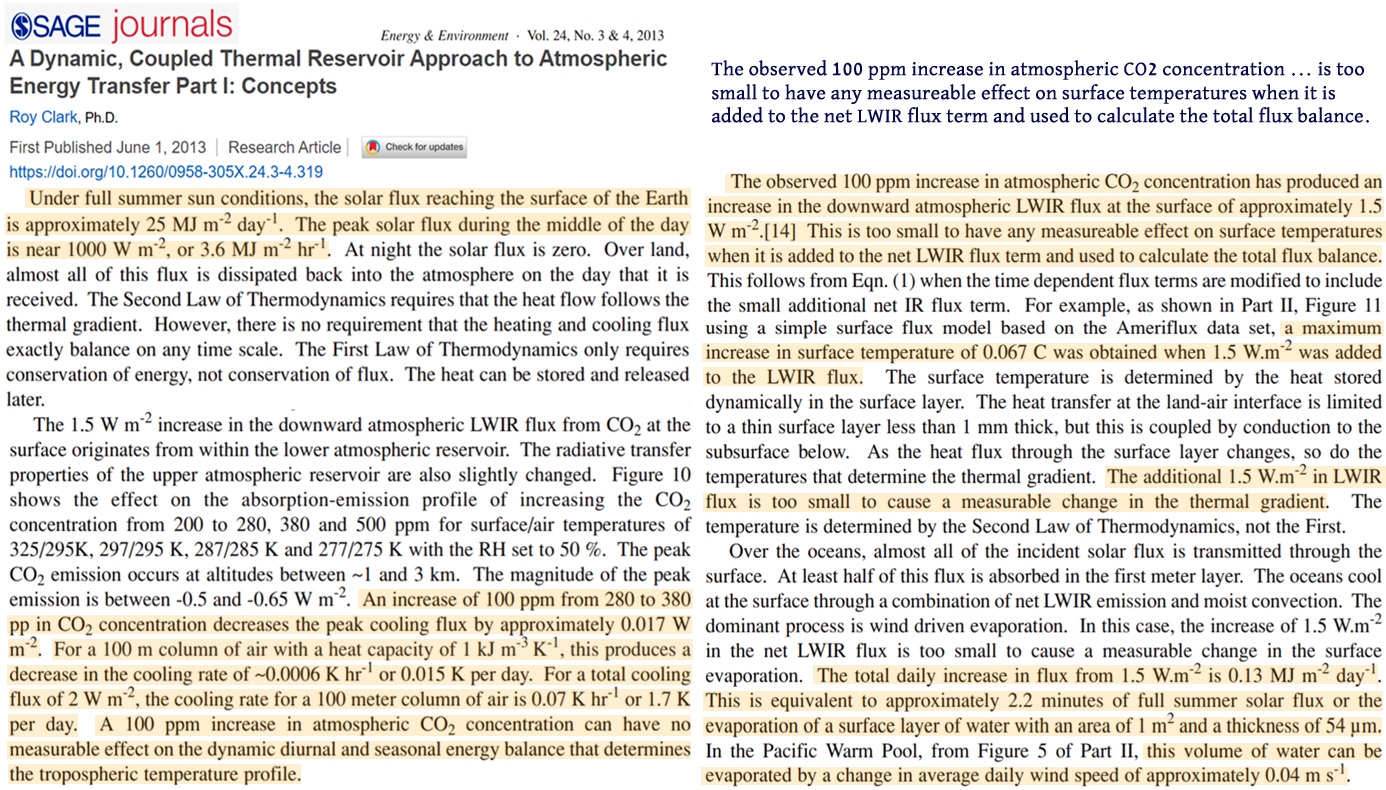
Clark, 2013 +100 ppm CO2 = 1.5 W/m² [0.067°C]
The observed 100 ppm increase in atmospheric CO2 concentration has produced an increase in the downward atmospheric LWIR flux at the surface increase of approximately 1.5 W m-2. This is too small to have any measureable effect on surface temperatures when it is added to the net LWIR flux term and used to calculate the total flux balance. … The observed 100 ppm increase in atmospheric CO2 concentration has produced an increase in the downward atmospheric LWIR flux at the surface of approximately 1.5 W/m². … [A] maximum increase in surface temperature of 0.067C was obtained when 1.5 W/m² was added to the LWIR flux.”
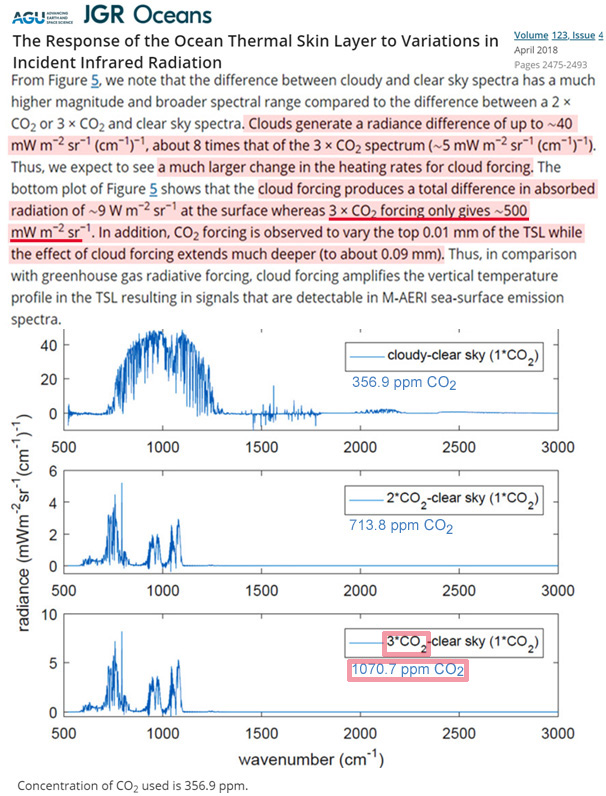
Wong and Minnett, 2018 3XCO2 [1,071 ppm] = 0.5 W/m² [0.022°C]
[C]loud forcing produces a total difference in absorbed radiation of ~9 W/m² sr−¹ at the surface whereas 3 x CO2 forcing [1,071 ppm] only gives ~500 mW/m² sr−¹ [0.5 W/m² sr−¹].
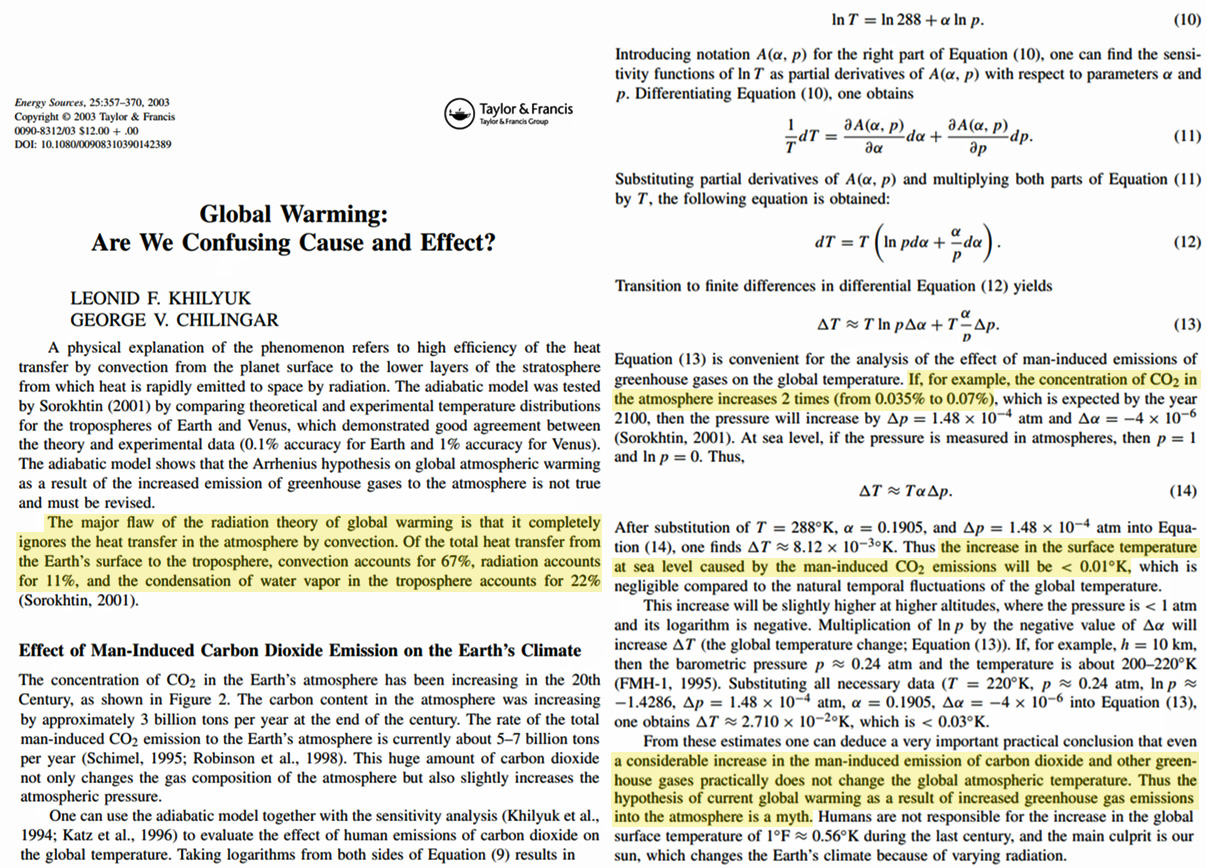
Khilyuk and Chilingar, 2003 (2XCO2 = <0.01°C)
Miskolczi, 2007 (2XCO2 = 0.24°C)
[A] hypothetical CO2 doubling will increase the optical depth (of the global average profile) by 0.0241, and the related increase in the surface temperature will be 0.24 K. The related change in the OLR corresponds to -0.3 K cooling. This may be compared to the 0.3 K and -1.2 K observed temperature changes of the surface and lower stratosphere between 1979 and 2004 in Karl et al., (2006). From the extrapolation of the ‘Keeling Curve’ the estimated increase in the average CO2 concentration during this time period is about 22%, (National Research Council of the National Academies, 2004). Comparing the magnitude of the expected change in the surface temperature we conclude, that the observed increase in the CO2 concentration must not be the primary reason of the global warming. … Since the world oceans are virtually unlimited sources and sinks of the atmospheric water vapor (optical depth), the system – depending on the time constant of the different energy reservoirs – has many ways to restore the equilibrium situation and maintain the steady state global climate. For example, in case the increased CO2 is compensated by reduced H2O, then the general circulation has to re-adjust itself to maintain the meridional energy flow with less water vapor available. This could increase the global average rain rate and speed up the global water cycle resulting in a more dynamical climate, but still the energy balance equations do not allow the average surface temperature to rise. … On local scale the regulatory role of the water vapor is apparent. On global scale, however, there can not be any direct water vapor feedback mechanism, working against the total energy balance requirement of the system. Runaway greenhouse theories contradict to the energy balance equations and therefore, can not work.
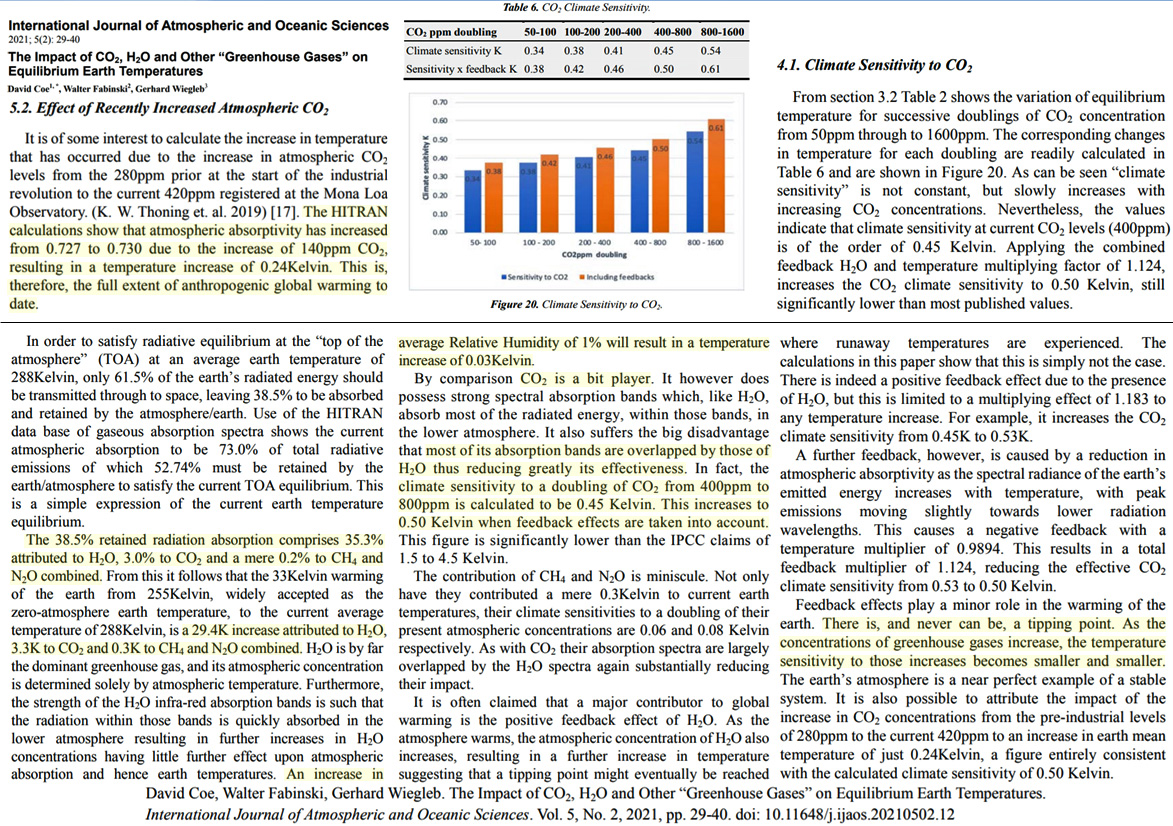
Coe et al., 2021 (2XCO2 [400 to 800 ppm] = 0.5°C)
The HITRAN database of gaseous absorption spectra enables the absorption of earth radiation at its current temperature of 288K to be accurately determined for each individual atmospheric constituent and also for the combined absorption of the atmosphere as a whole. From this data it is concluded that H2O is responsible for 29.4K of the 33K warming, with CO2 contributing 3.3K and CH4 and N2O combined just 0.3K. Climate sensitivity to future increases in CO2 concentration is calculated to be 0.50K, including the positive feedback effects of H2O, while climate sensitivities to CH4 and N2O are almost undetectable at 0.06K and 0.08K respectively. This result strongly suggests that increasing levels of CO2 will not lead to significant changes in earth temperature and that increases in CH4 and N2O will have very little discernable impact.
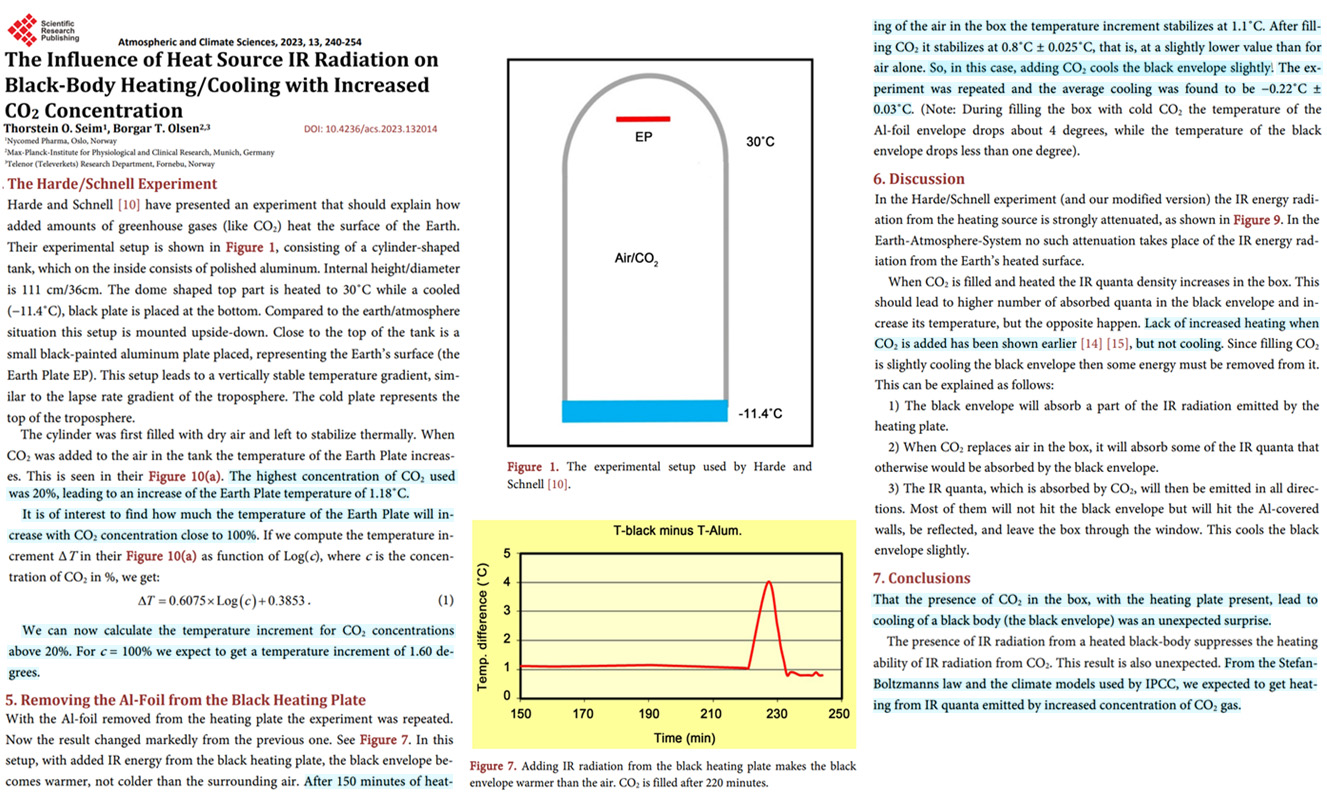
Siem and Olsen, 2023 (CO2 rising from 400 ppm to 1,000,000 ppm = -0.22°C cooling)
This study deals with interactions between thermal and radiative energy flow in experimental situations of varying complexity. Of special interest is how IR energy, re-emitted from CO2 gas, behaves in an earth/atmosphere simulated setup. Such an experiment was performed by Hermann Harde and Michael Schnell where they show that IR radiation emitted from CO2 can warm a small black-body metal plate. In a control experiment, we verified this result. However, in their experiment, the amount of IR radiation from the heating element was strongly attenuated. In a modified experiment, where IR emission from the heating source is present, no heating but a slight cooling [the average cooling was found to be -0.22°C±0.03°C] of a black object is found when air [0.04%] is replaced by CO2 [100%]. The modified experimental situation is also more like the earth/atmosphere situation.
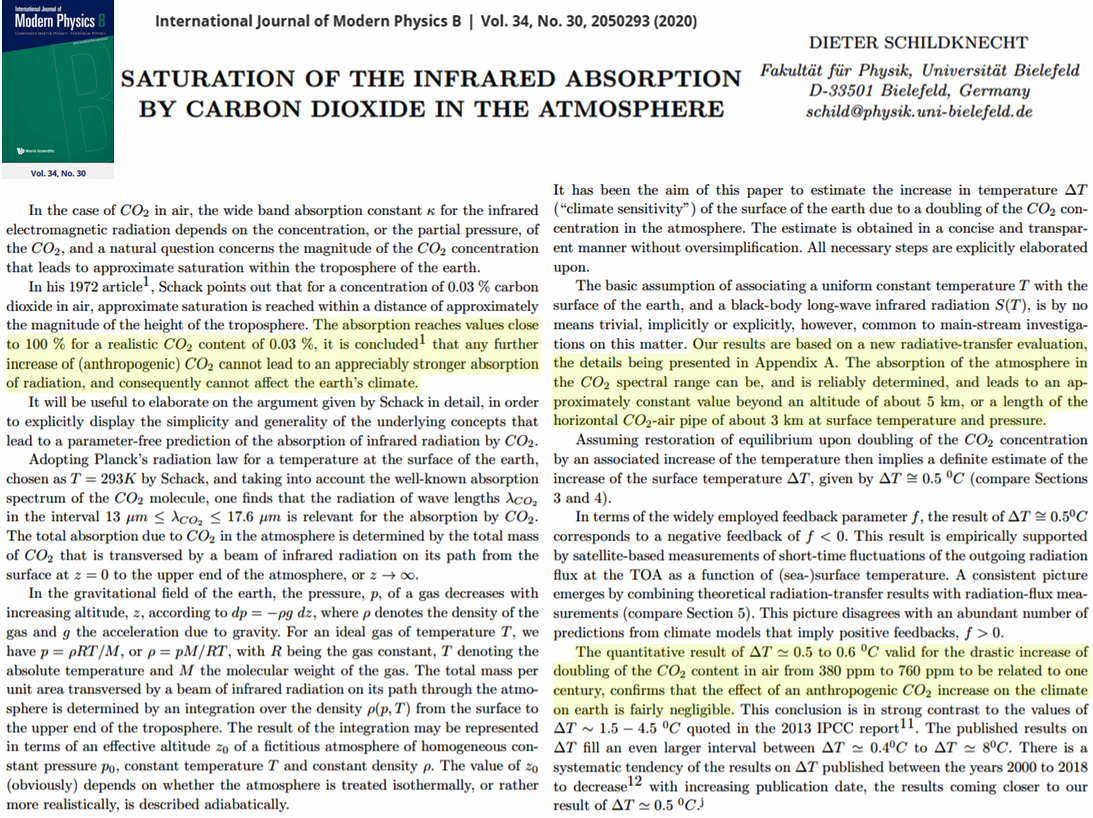
Schildknecht, 2020 (2XCO2 = 0.5°C)
Based on new radiative transfer numerical evaluations, we reconsider an argument presented by Schack in 1972 that says that saturation of the absorption of infrared radiation by carbon dioxide in the atmosphere sets in as soon as the relative concentration of carbon dioxide exceeds a lower limit of approximately 300 ppm. We provide a concise brief and explicit representation of the greenhouse effect of the earth’s atmosphere. We find an equilibrium climate sensitivity (temperature increase ∆T due to doubling of atmospheric CO2 concentration) of ∆T ≃ 0.5°C. We elaborate on the consistency of these results on ∆T with results observationally obtained by satellite-based measurements of short-time radiation-flux versus surface-temperature changes. … The absorption reaches values close to 100% for a realistic CO2 content of 0.03%, it is concluded that any further increase of (anthropogenic) CO2 cannot lead to an appreciably stronger absorption of radiation, and consequently cannot affect the earth’s climate. … [T]he effect of an anthropogenic CO2 increase on the climate on earth is fairly negligible.
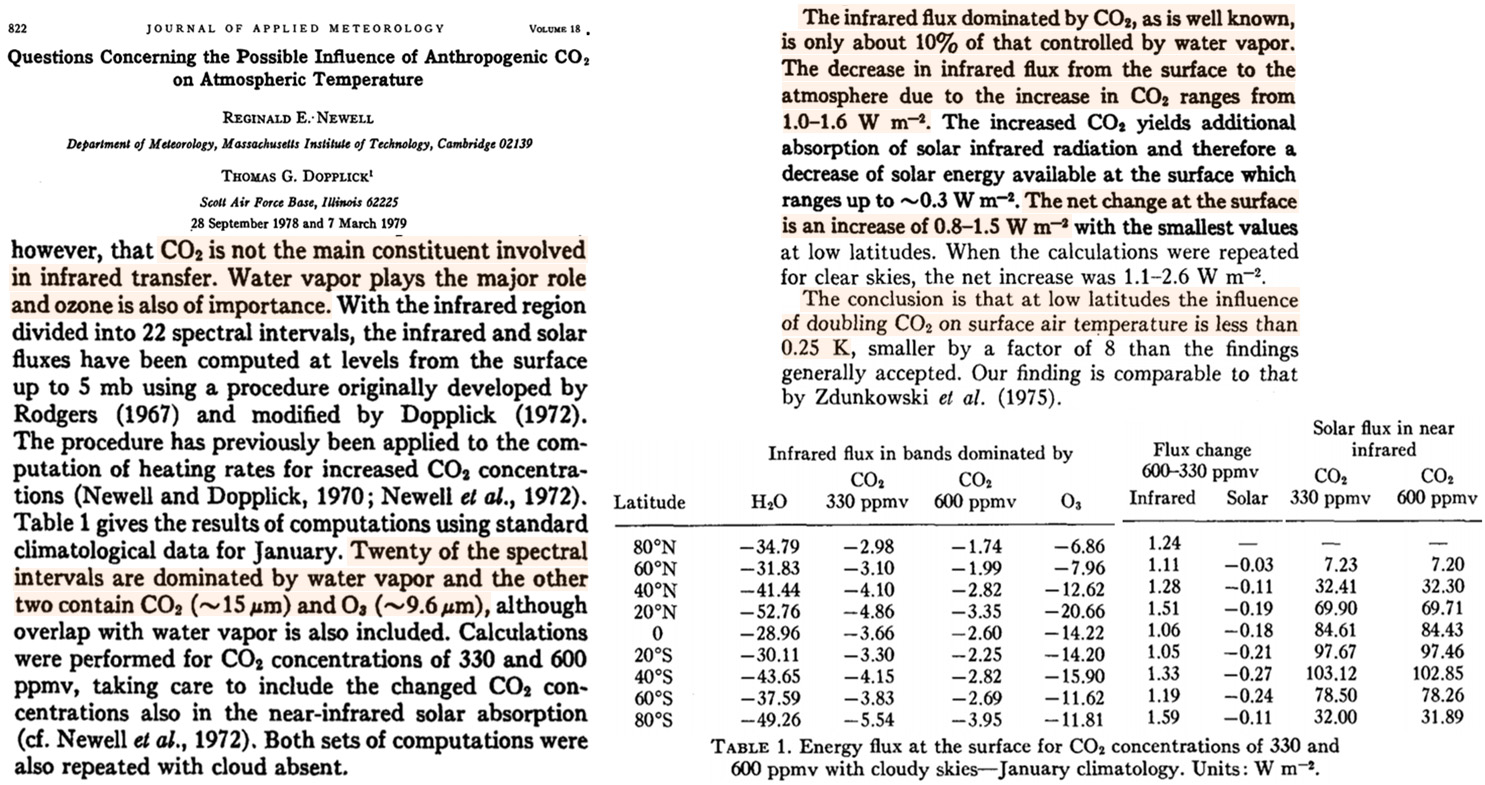
Newell and Dopplick, 1979 (2X CO2 = ~0.25°C )
Estimates of the atmospheric temperature changes due to a doubling of CO2 concentration have be with a standard radiative flux model. They yield temperature changes of >0.25 K. It appears that the much larger changes predicted by other models arise from additional water vapor evaporated into the atmosphere and not from the CO2 itself. … It is important to stress…that CO2 is not the main constituent involved in infrared transfer. Water vapor plays the major role and ozone is also of importance. With the infrared region divided into 22 spectral intervals, the infrared and solar fluxes have been computed at levels from the surface up to 5 mb using a procedure originally developed by Rodgers (1967) and modified by Dopplick (1972). The procedure has previously been applied to the computation of heating rates for increased CO2 concentrations (Newell and Dopplick, 1970; Newell et al., 1972). Table 1 gives the results of computations using standard climatological data for January. Twenty of the spectral intervals are dominated by water vapor and the other two contain CO2 (~15 µm) and O3 (~9.6 µm), although overlap with water vapor is also included. Calculations were performed for CO2 concentrations of 330 and 600 ppmv, taking care to include the changed CO2 concentrations also in the near-infrared solar absorption (cf. Newell et al., 1972). Both sets of computations were also repeated with cloud absent. The infrared flux dominated by CO2, as is well known, is only about 10% of that controlled by water vapor. The decrease in infrared flux from the surface to the atmosphere due to the increase in CO2 ranges from 1.0 – 1.6 W m-2. The increased CO2 yields additional absorption of solar infrared radiation and therefore a decrease of solar energy available at the surface which ranges up to ~0.3 W m-2. The net change at the surface is an increase of 0.8 – 1.5 W m-2 with the smallest values at low latitudes. … The fact that water vapor dominates CO2 in the radiation budget has been known and discussed for many years (see, e.g., Kondratiev and Niilisk, 1960; Möller, 1963; Zdunkowski et al., 1975) but it seems important to reemphasize when so much attention is being paid to CO2.
The conclusion is that at low latitudes the influence of doubling CO2 on surface temperatures is less than 0.25 K
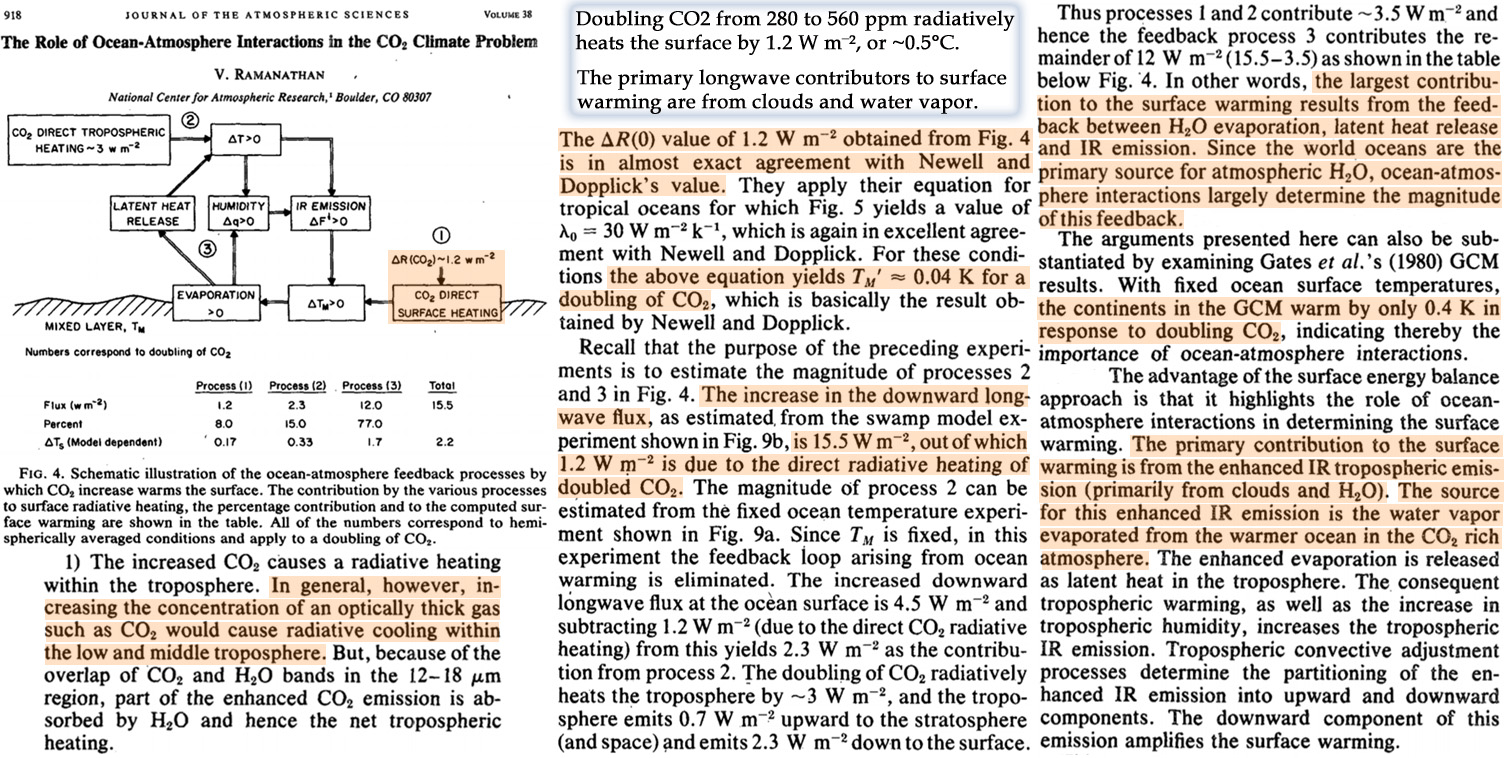
Ramanathan, 1981 (2X CO2 = ~0.5°C)
The increase in the downward longwave flux, as estimated from the swamp model experiment shown in Fig. 9b, is 15.5 W m-², out of which 1.2 W m-² is due to the direct radiative heating of doubled CO2.
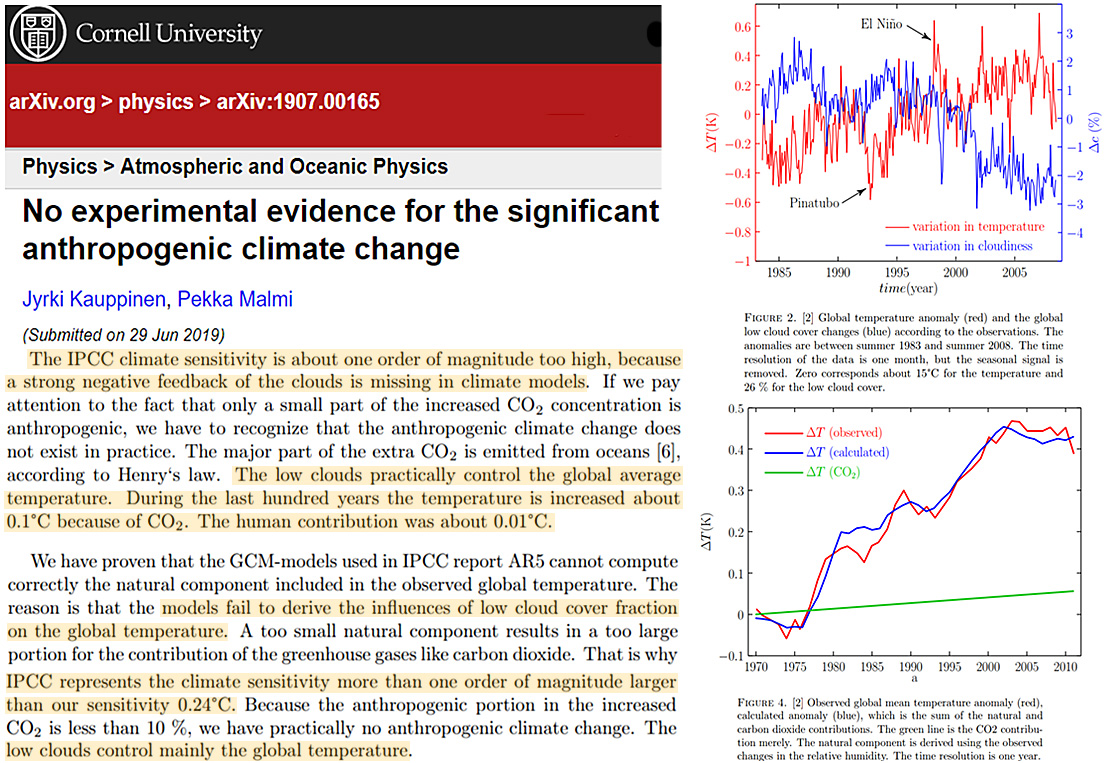
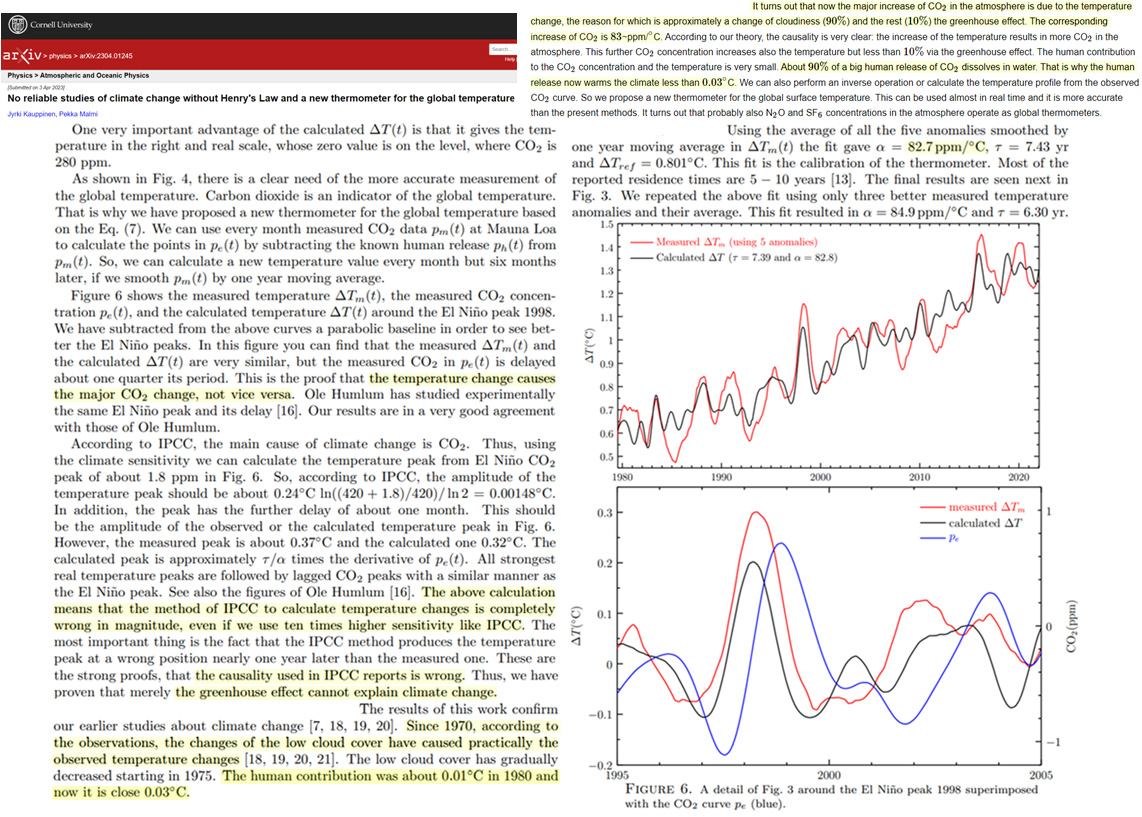
Kauppinen and Malmi, 2019 (2X CO2 = ~0.24°C, human contribution 0.01°C/century)
The IPCC climate sensitivity is about one order of magnitude too high, because a strong negative feedback of the clouds is missing in climate models. If we pay attention to the fact that only a small part of the increased CO2 concentration is anthropogenic, we have to recognize that the anthropogenic climate change does not exist in practice. The major part of the extra CO2 is emitted from oceans [6], according to Henry‘s law. The low clouds practically control the global average temperature. During the last hundred years the temperature is increased about 0.1°C because of CO2. The human contribution was about 0.01°C. … We have proven that the GCM-models used in IPCC report AR5 cannot compute correctly the natural component included in the observed global temperature. The reason is that the models fail to derive the influences of low cloud cover fraction on the global temperature. A too small natural component results in a too large portion for the contribution of the greenhouse gases like carbon dioxide. That is why IPCC represents the climate sensitivity more than one order of magnitude larger than our sensitivity 0.24°C. Because the anthropogenic portion in the increased CO2 is less than 10 %, we have practically no anthropogenic climate change. The low clouds control mainly the global temperature.
Idso, 1998 (2X CO2 = ~0.4°C)
Over the course of the past 2 decades, I have analyzed a number of natural phenomena that reveal how Earth’s near-surface air temperature responds to surface radiative perturbations. These studies all suggest that a 300 to 600 ppm doubling of the atmosphere’s CO2 concentration could raise the planet’s mean surface air temperature by only about 0.4°C. Even this modicum of warming may never be realized, however, for it could be negated by a number of planetary cooling forces that are intensified by warmer temperatures and by the strengthening of biological processes that are enhanced by the same rise in atmospheric CO2 concentration that drives the warming.
Krainov and Smirnov, 2019 (2X CO2 = 0.4°C, 2X anthroCO2 = 0.02°C)
The greenhouse phenomenon in the atmosphere that results from emission of its molecules and particles in the infrared spectrum range is determined by atmospheric water in the form of molecules and microdrops and by carbon dioxide molecules for the Earth atmosphere and by carbon dioxide molecules and dust for the Venus atmosphere. The line-by-line method used the frequency dependent radiative temperature for atmospheric air with a large optical thickness in the infrared spectral range, allows one to separate emission of various components in atmospheric emission. This method demonstrates that the removal of carbon dioxide from the Earth’s atmosphere leads to a decrease of the average temperature of the Earth’s surface by 4 K; however, doubling of the carbon dioxide amount causes an increase of the Earth’s temperature by 0.4 K from the total 2 K at CO2 doubling in the real atmosphere, as it follows from the NASA measurements. The contribution to this temperature change due to injections of carbon dioxide in the atmosphere due to combustion of fossil fuel, and it is 0.02 K. The infrared radiative flux to the Venus surface due to CO2 is about 30% of the total flux, and the other part is determined by a dust.
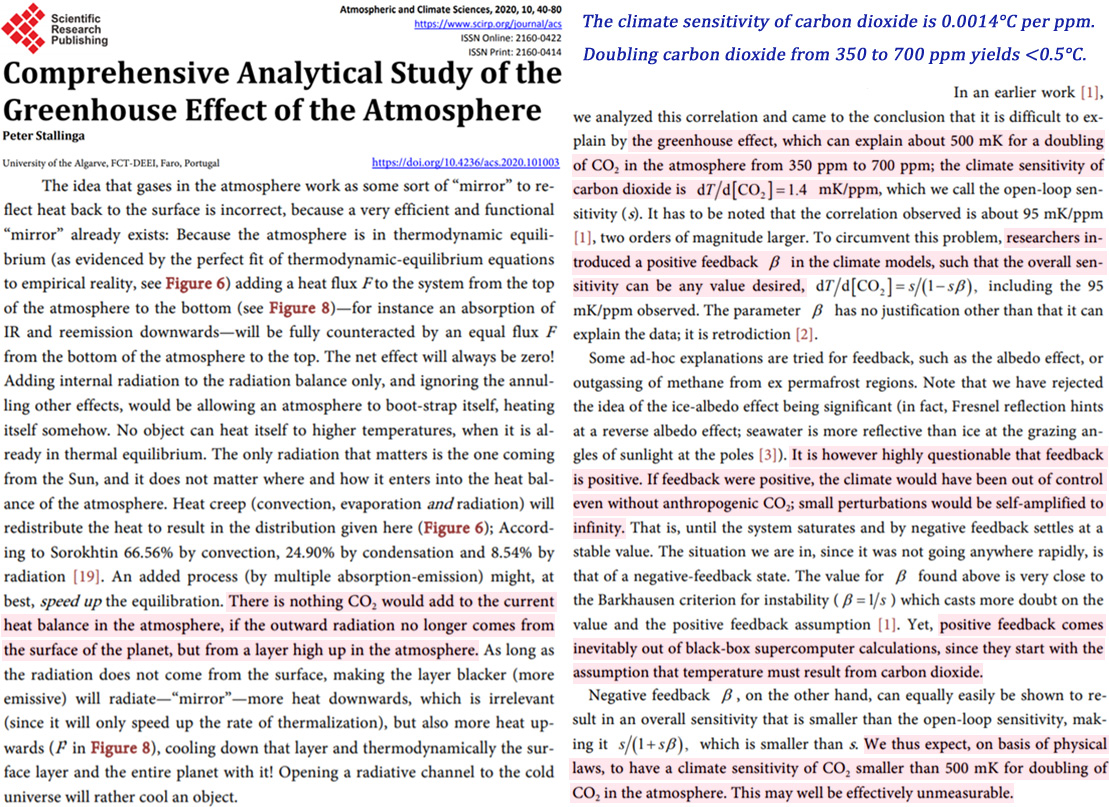
Stallinga, 2020 (2X CO2 = <0.5 °C)
[W]e analyzed this correlation and came to the conclusion that it is difficult to explain by the greenhouse effect, which can explain about 500 mK [0.5°C] for a doubling of CO2 in the atmosphere from 350 ppm to 700 ppm; the climate sensitivity of carbon dioxide is d d CO T [ 2 ] = 1.4 mK/ppm [], which we call the open-loop sensitivity (s). It has to be noted that the correlation observed is about 95 mK/ppm [1], two orders of magnitude larger. To circumvent this problem, researchers introduced a positive feedback β in the climate models, such that the overall sensitivity can be any value desired, d d CO 1 , T ss [ 2 ] = − ( β ) including the 95 mK/ppm observed. The parameter β has no justification other than that it can explain the data; it is retrodiction [2]. … We thus expect, on basis of physical laws, to have a climate sensitivity of CO2 smaller than 500 mK [0.5°C] for doubling of CO2 in the atmosphere. This may well be effectively unmeasurable.
Kauppinen and Malmi, 2023 CO2 increase of 90 ppm (1980-2022) adds 0.03°C
Since 1970, according to the observations, the changes of the low cloud cover have caused practically the observed temperature changes [18, 19, 20, 21]. The low cloud cover has gradually decreased starting in 1975. The human contribution was about 0.01◦C in 1980 and now it is close 0.03◦C.
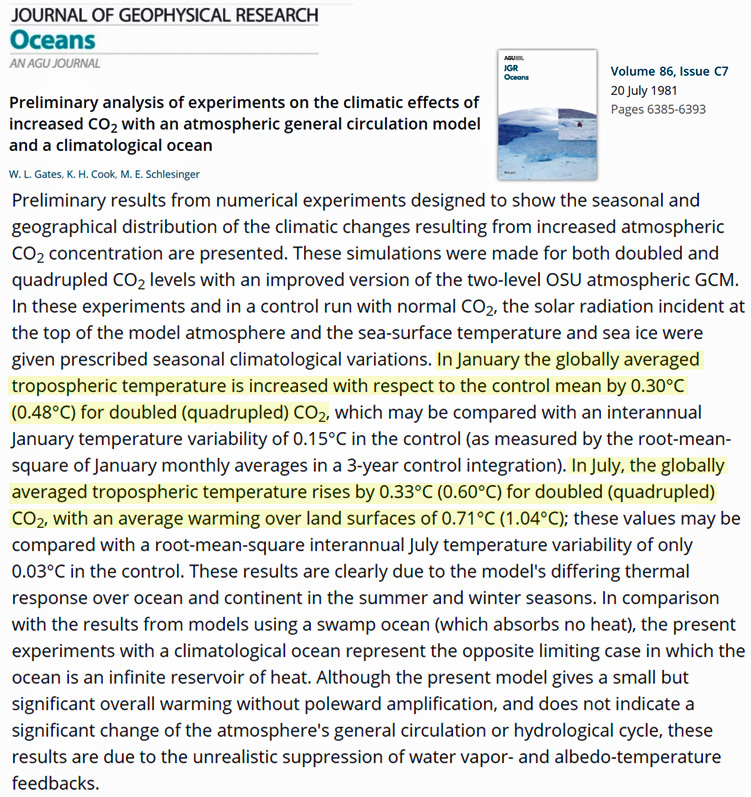
Gates et al., 1981 (2X CO2 = 0.3°C)
Preliminary analysis of experiments on the climatic effects of increased CO2 with an atmospheric general circulation model and a climatological ocean
Preliminary results from numerical experiments designed to show the seasonal and geographical distribution of the climatic changes resulting from increased atmospheric CO2 concentration are presented. These simulations were made for both doubled and quadrupled CO2 levels with an improved version of the two-level OSU atmospheric GCM. In these experiments and in a control run with normal CO2, the solar radiation incident at the top of the model atmosphere and the sea-surface temperature and sea ice were given prescribed seasonal climatological variations. In January the globally averaged tropospheric temperature is increased with respect to the control mean by 0.30°C (0.48°C) for doubled (quadrupled) CO2, which may be compared with an interannual January temperature variability of 0.15°C in the control (as measured by the root-mean-square of January monthly averages in a 3-year control integration)
Gray, 2009 (2X CO2 = ~0.4°C)
CO2 increases without positive water vapor feedback could only have been responsible for about 0.1 – 0.2 °C of the 0.6-0.7°C global mean surface temperature warming that has been observed since the early 20th century. Assuming a doubling of CO2 by the late 21st century (assuming no positive water vapor feedback), we should likely expect to see no more than about 0.3-0.5°C global surface warming and certainly not the 2-5°C warming that has been projected by the GCMs [global circulation models].
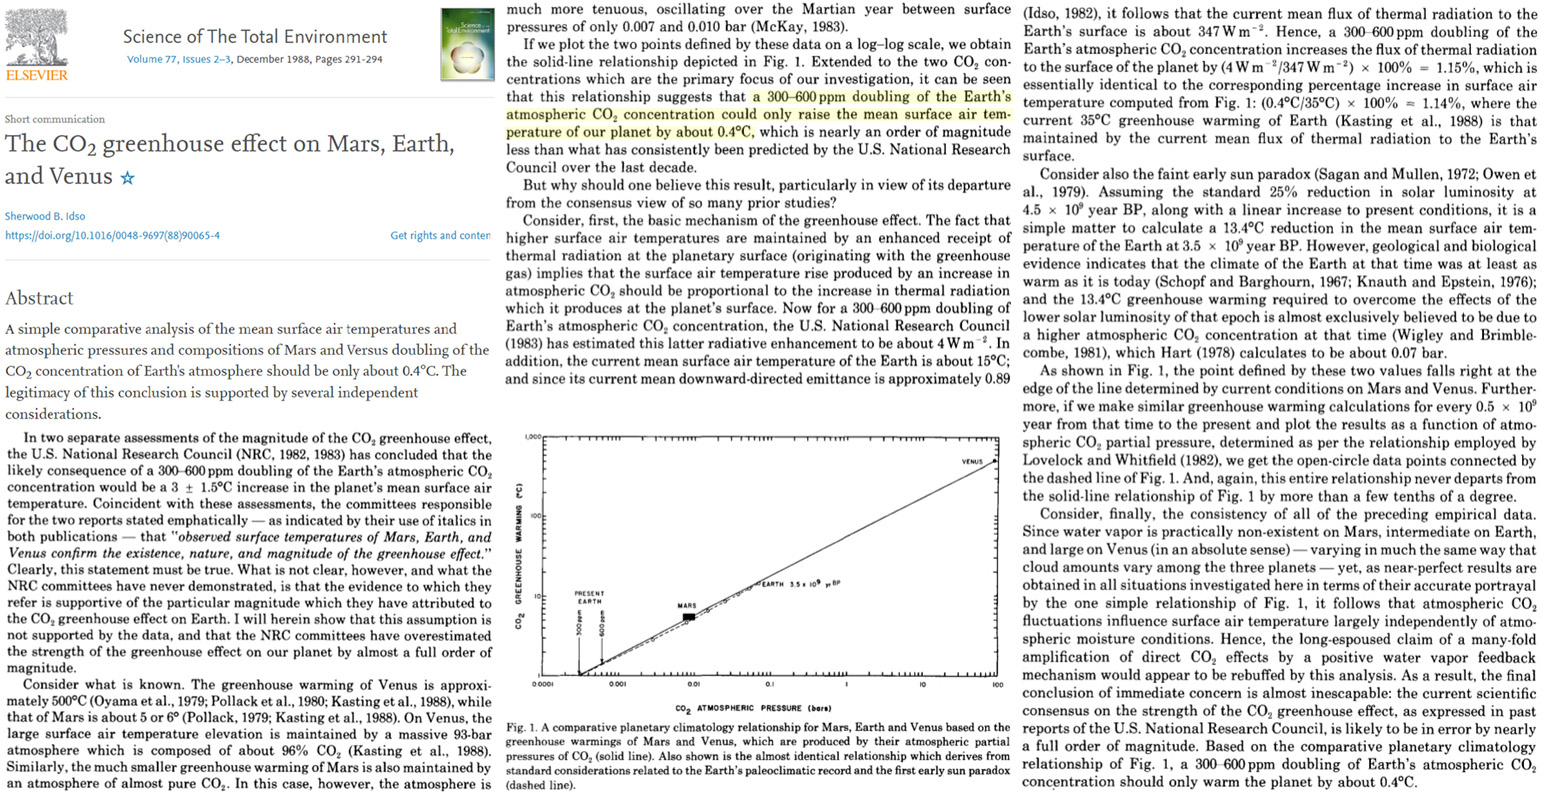
Idso, 1988 (2x CO2 = 0.4°C)
A simple comparative analysis of the mean surface air temperatures and atmospheric pressures and compositions of Mars and Versus doubling of the CO2 concentration of Earth’s atmosphere should be only about 0.4°C.
Harde, 2014 (2X CO2 = 0.6°C)
The short- and long-wave absorption of the most important greenhouse gases water vapour, carbon dioxide, methane and ozone are derived from line-by-line calculations based on the HITRAN08-databasis and are integrated in the model. Simulations including an increased solar activity over the last century give a CO2 initiated warming of 0.2°C and a solar influence of 0.54°C over this period, corresponding to a CO2 climate sensitivity of 0.6 °C (doubling of CO2) and a solar sensitivity of 0.5°C (0.1 % increase of the solar constant).
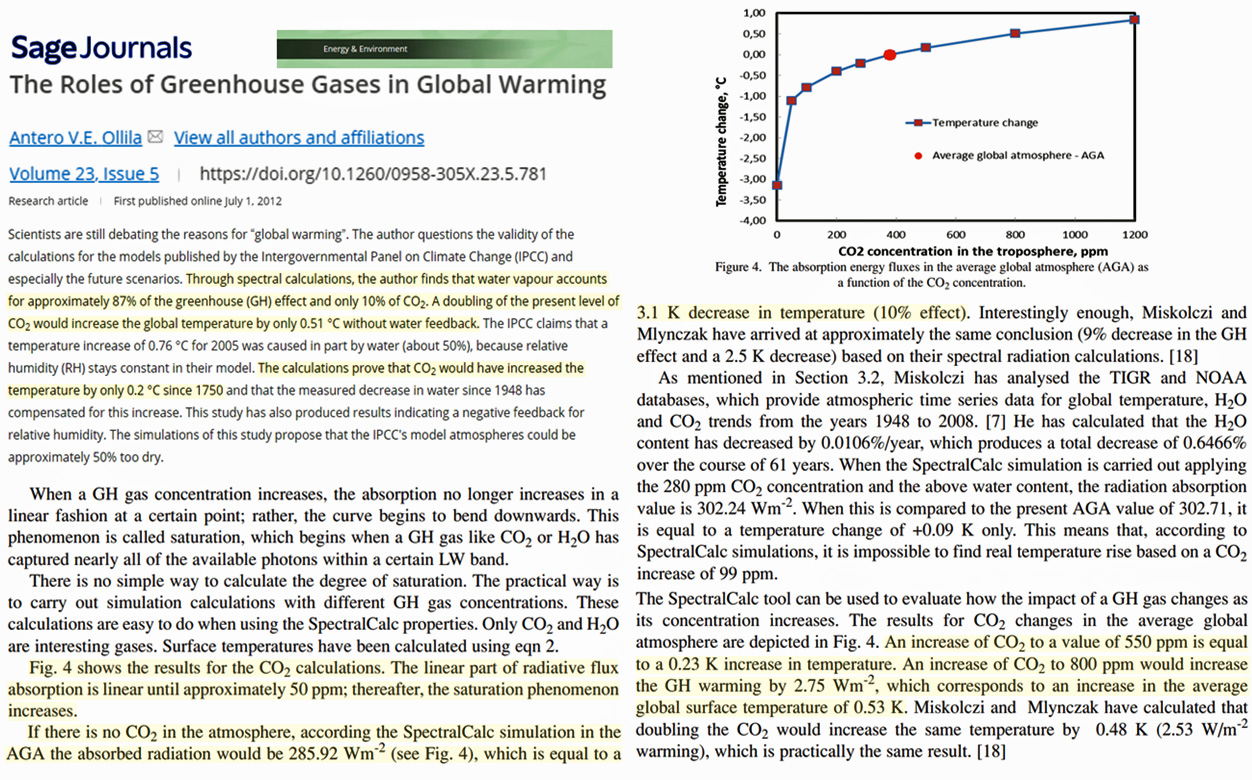
Ollila, 2012 (2X CO2 = 0.5 °C)
Scientists are still debating the reasons for “global warming”. The author questions the validity of the calculations for the models published by the Intergovernmental Panel on Climate Change (IPCC) and especially the future scenarios. Through spectral calculations, the author finds that water vapour accounts for approximately 87% of the greenhouse (GH) effect and only 10% of CO2. A doubling of the present level of CO2 would increase the global temperature by only 0.51 °C without water feedback.
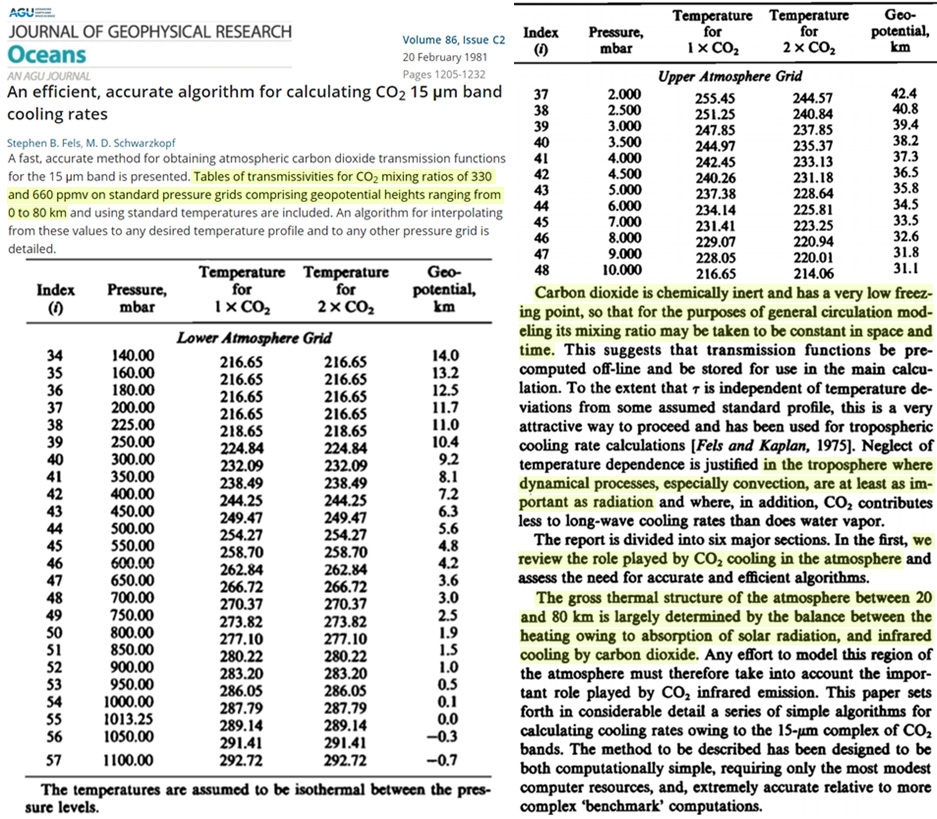
Feis and Schwarzkopf, 1981 (2X CO2 = 0.00°C)
[In calculating “the role played by CO2 cooling the atmosphere,” doubling CO2 from 330 to 660 ppm has literally no temperature effect at 0-14 km above Earth’s surface. Above 30 km 660 ppm CO2 produces 2-11°C colder temps.]
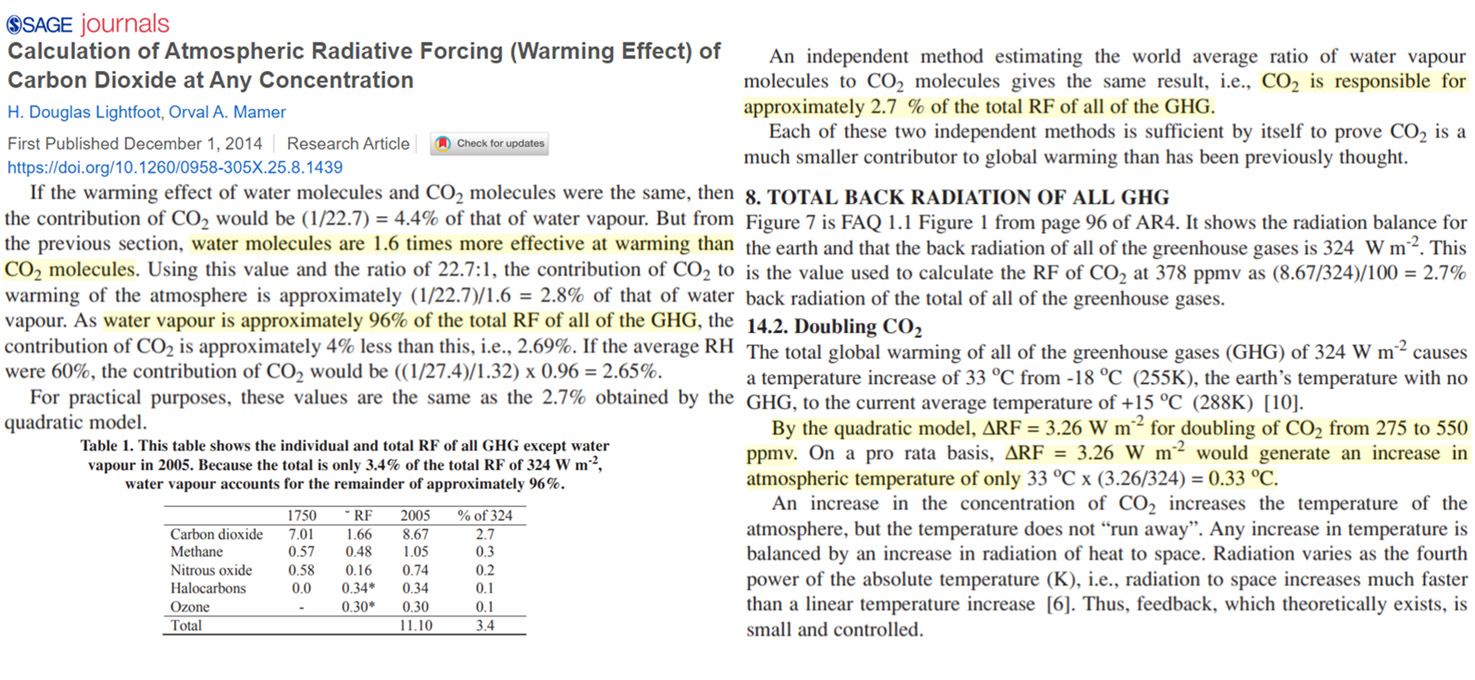
Lightfoot and Mamer, 2014 (2XCO2 = 0.33°C)
CO2 is responsible for approximately 2.7 % of the total [radiative forcing] of all the [greenhouse gases]. … By the quadratic model, ΔRF = 3.26 W/m² for doubling of CO2 from 275 to 550 ppmv. On a pro rate basis, ΔRF = 3.26 W/m² would generate an increase in atmospheric temperature of only 33°C x (3.26/324) = 0.33°C.
Zdunkowski et al., 1975 (2X CO2 = <0.5°C)
It is found that doubling the carbon dioxide concentration increases the temperature near the ground by approximately one-half of one degree [0.5°C] if clouds are absent. A sevenfold [700%] increase of the present normal carbon dioxide concentration increases the temperature near the ground by approximately one degree. Temperature profiles resulting from presently observed carbon dioxide concentration and convective cloudiness of 50% or less are compared with those resulting from doubled carbon dioxide concentrations and the same amounts of cloud cover. Again, it is found that a doubling [100% increase] of carbon dioxide increases the temperature in the lower boundary layer by about one-half of one degree.
Cederlöf, 2014 (2X CO2 = 0.35°C)
By using this climate model, it is possible to estimate the hemispheres temperature response to increased radiative forcing from greenhouse gases. When assuming that the seasonal energy exchange between the hemispheres is neglectable and a doubling of the carbon dioxide level would cause 3.7 W/m2 forcing, a climate sensitivity figure can be calculated. This climate sensitivity has in this case been calculated to about 0.5°C for NH and about 0.2°C for the SH if IPCC’s assumptions of efficacy is used.
Dunbar, 1976 (CO2 rise of 80 ppm adds 0.1°C warming)
[T]he measured increase in carbon dioxide in the atmosphere, according to the most recent computations, would not be enough to have any measurable climatic effect. Rasool and Schneider (1971) conclude that an increase in the carbon dioxide content of eight times the present level would produce an increase in surface temperature of less than 2°C, and that if the concentration were to increase from the present level of 320 parts per million to about 400 by the year 2000, the predicted increase in surface global temperature would be about 0.1°C.
Idso, 1980 (2X CO2 = ≤ 0.26°C )
The mean global increase in thermal radiation received at the surface of the earth as a consequence of a doubling of the atmospheric carbon dioxide content is calculated to be 2.28 watts per square meter. Multiplying this forcing function by the atmosphere’s surface air temperature response function, which has recently been determined by three independent experimental analyses to have a mean global value of 0.113 K per watt per square meter, yields a value of ≤ 0.26 K for the resultant change in the mean global surface air temperature. This result is about one order of magnitude less than those obtained from most theoretical numerical models, but it is virtually identical to the result of a fourth experimental approach to the problem described by Newell and Dopplick. There thus appears to be a major discrepancy between current theory and experiment relative to the effects of carbon dioxide on climate. Until this discrepancy is resolved, we should not be too quick to limit our options in the selection of future energy alternatives.
Harde, 2017 (2XCO2 = 0.7°C )
These calculations are used to assess the CO2 global warming by means of an advanced two-layer climate model and to disclose some larger discrepancies in calculating the climate sensitivity. Including solar and cloud effects as well as all relevant feedback processes our simulations give an equilibrium climate sensitivity of = 0.7°C (temperature increase at doubled CO2) … many of the consulted analyses and also the AR5 itself do not better and clearly distinguish between an anthropogenic emission of CO2 and a naturally generated part, where the latter [natural CO2 generation] even contributes more than 95% to the overall emission, and its generation rate and the respective absorption rate sensitively respond on global temperature variations.
Khmelinskii and Woodcock, 2023 2XCO2 = 0.015°C
The greenhouse gas hypothesis is based upon conjectures regarding the molecular spectroscopic properties of the CO2 molecule that may have never been validated. Here, we summarise some essential experimental facts regarding molecular physics of CO2 spectroscopy. The rate of emission of the photonic energy from the Earth’s surface as black body radiation by Stefan-Boltzmann law in the absorption bands of CO2 is limited compared to the [CO2] concentration capacity to absorb it [16,17]. In the IR spectra of CO2, the lines in the rotational structure of CO2 vibrational bands efficiently absorb about 10% of all IR in the specific IR bands where these lines appear, letting through the remaining 90%, and evidently absorbing absolutely nothing at all other IR wavelengths. Therefore, CO2 can affect no more than 10% of the surface-emitted IR radiation, and this absorption is already strongly saturated, as the absorption length does not exceed 300 meters for the relevant lines considered, whereas the troposphere, that determines climates, is 10 km thick. … [W]e should expect only very small effects due to increased atmospheric CO2. Indeed, doubling of atmospheric CO2 would reduce absorption length to 150 meters, which results in less than 1K at the surface assuming 6.5 K/km lapse rate – if everything is contained at this relatively weak line with long absorption length. The absorption length of the dominant line, however, is ~3 meters, so 1.5 meters would be equivalent to 0.015 K at the surface. This effect would not even be measurable.
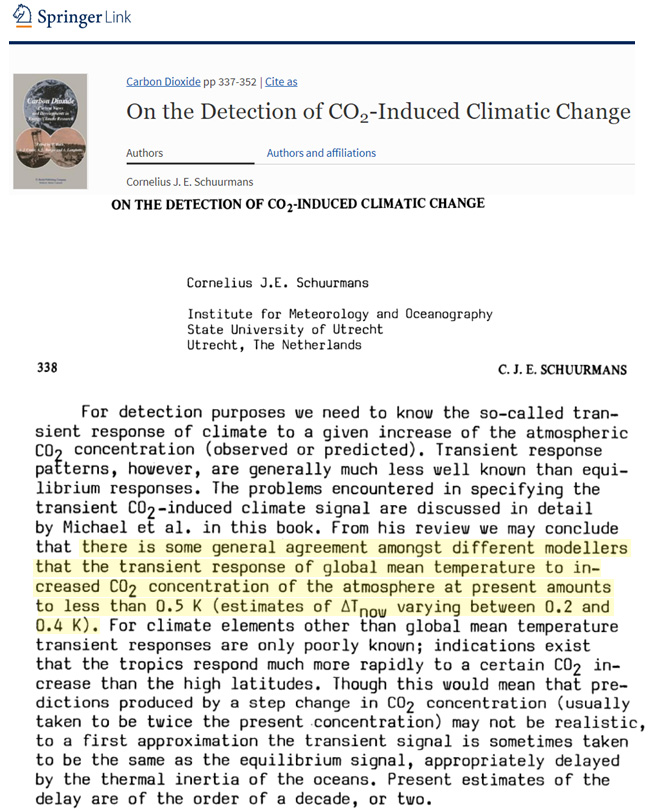
Schuurmans, 1983 (2XCO2 = ~0.3°C )
For detection purposes we need to know the so-called transient response of climate to a given increase of the atmospheric CO2 concentration (observed or predicted). Transient response patterns, however, are generally much less well known than equilibrium responses. The problems encountered in specifying the transient CO2-induced climate signal are discussed in detail by Michael et al. in his book. From his review we may conclude that there is some general agreement amongst different modellers that the transient response of global mean temperature to increased CO2 concentration of the atmosphere at present amounts to less than 0.5 K (estimates of [temperature response] now varying between 0.2 and 0.4 K).
Kissin, 2015 (2XCO2 = ~0.6°C)
[A] doubling the CO2 concentration in the Earth’s atmosphere would lead to an increase of the surface temperature by about +0.5 to 0.7 °C, hardly an effect calling for immediate drastic changes in the planet’s energy policies. An increase in the absolute air humidity caused by doubling the CO2 concentration and the resulting decrease of the outgoing IR flux would produce a relatively small additional effect due to a strong overlap of IR spectral bands of CO2 and H2O, the two compounds primarily responsible for the greenhouse properties of the atmosphere.
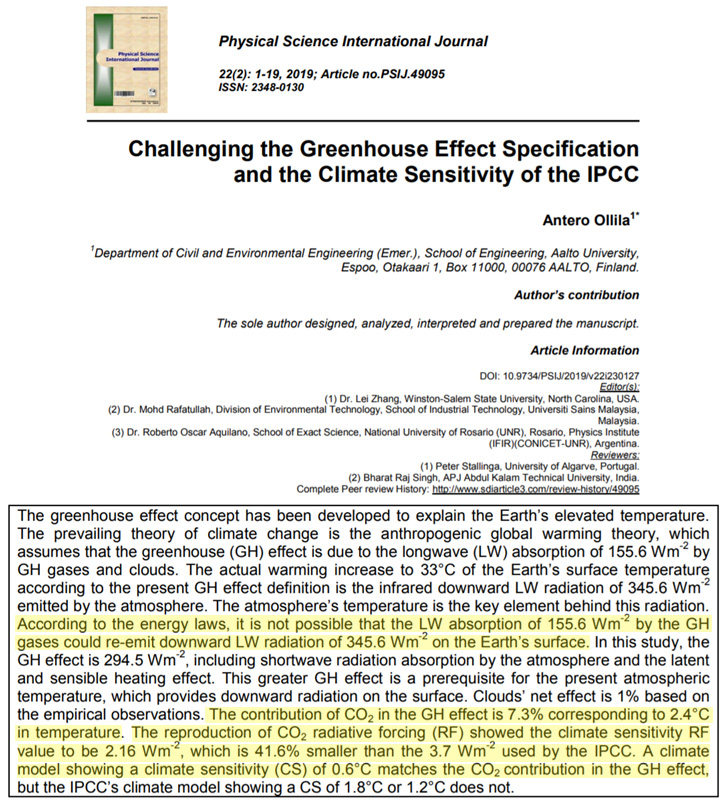
Ollila (2019) (2XCO2 = ~0.6°C)
The contribution of CO2 in the GH effect is 7.3% corresponding to 2.4°C in temperature. The reproduction of CO2 radiative forcing (RF) showed the climate sensitivity RF value to be 2.16 Wm-2, which is 41.6% smaller than the 3.7 Wm-2 used by the IPCC. A climate model showing a climate sensitivity (CS) of 0.6°C matches the CO2 contribution in the GH effect, but the IPCC’s climate model showing a CS of 1.8°C or 1.2°C does not.
Holmes, 2018 (2XCO2 = -0.03°C)
Calculate for a doubling of CO2 from the pre-industrial level of 0.03% [300 ppm]: [formula found in text] Calculated temperature after doubling of CO2 to 0.06% [600 ppm] ≈ 288.11 K. Climate sensitivity to CO2 is ≈ 288.14 – 288.11 ≈ – 0.03 K.
The change would in fact be extremely small and difficult to estimate exactly, but would be of the order -0.03°C. That is, a hundred times smaller than the ‘likely’ climate sensitivity of 3°C cited in the IPCC’s reports, and also probably of the opposite sign [cooling]. Even that small number would likely be a maximum change, since if fossil fuels are burned to create the emitted CO2, then atmospheric O2 will also be consumed, reducing that gas in the atmosphere – and offsetting any temperature change generated by the extra CO2. This climate sensitivity is already so low that it would be impossible to detect or measure in the real atmosphere, even before any allowance is made for the consumption of atmospheric O2.
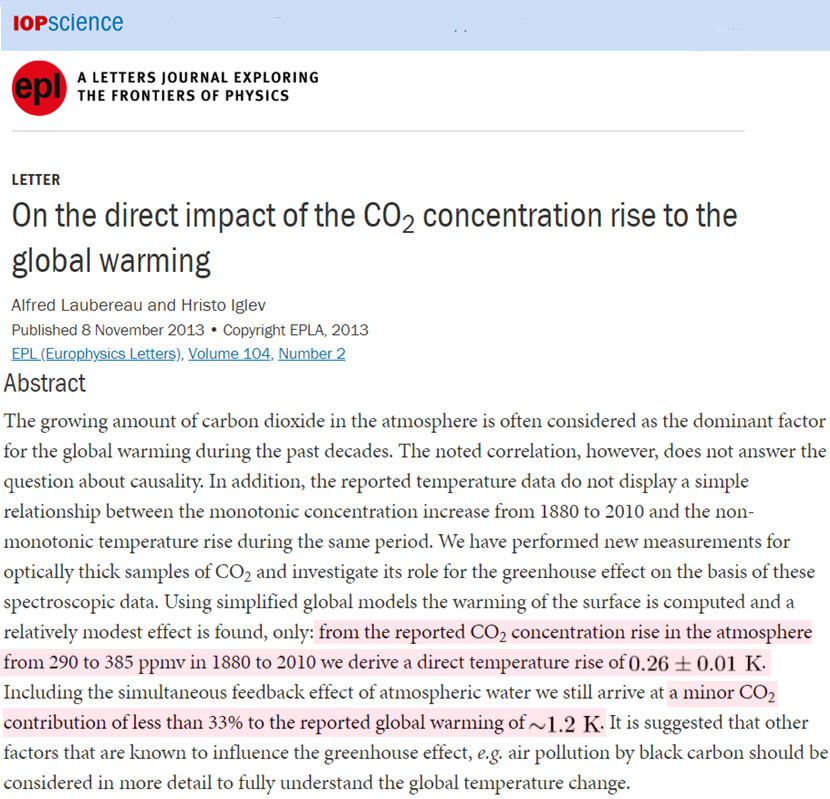
Laubereau and Iglev, 2013 (+95 ppm CO2 = 0.26°C)
The growing amount of carbon dioxide in the atmosphere is often considered as the dominant factor for the global warming during the past decades. The noted correlation, however, does not answer the question about causality. In addition, the reported temperature data do not display a simple relationship between the monotonic concentration increase from 1880 to 2010 and the non-monotonic temperature rise during the same period. We have performed new measurements for optically thick samples of CO2 and investigate its role for the greenhouse effect on the basis of these spectroscopic data. Using simplified global models the warming of the surface is computed and a relatively modest effect is found, only: from the reported CO2 concentration rise in the atmosphere from 290 to 385 ppmv in 1880 to 2010 we derive a direct temperature rise of 0.26 ± 0.01 K. Including the simultaneous feedback effect of atmospheric water we still arrive at a minor CO2 contribution of less than 33% to the reported global warming of 1.2 K. It is suggested that other factors that are known to influence the greenhouse effect, e.g. air pollution by black carbon should be considered in more detail to fully understand the global temperature change.
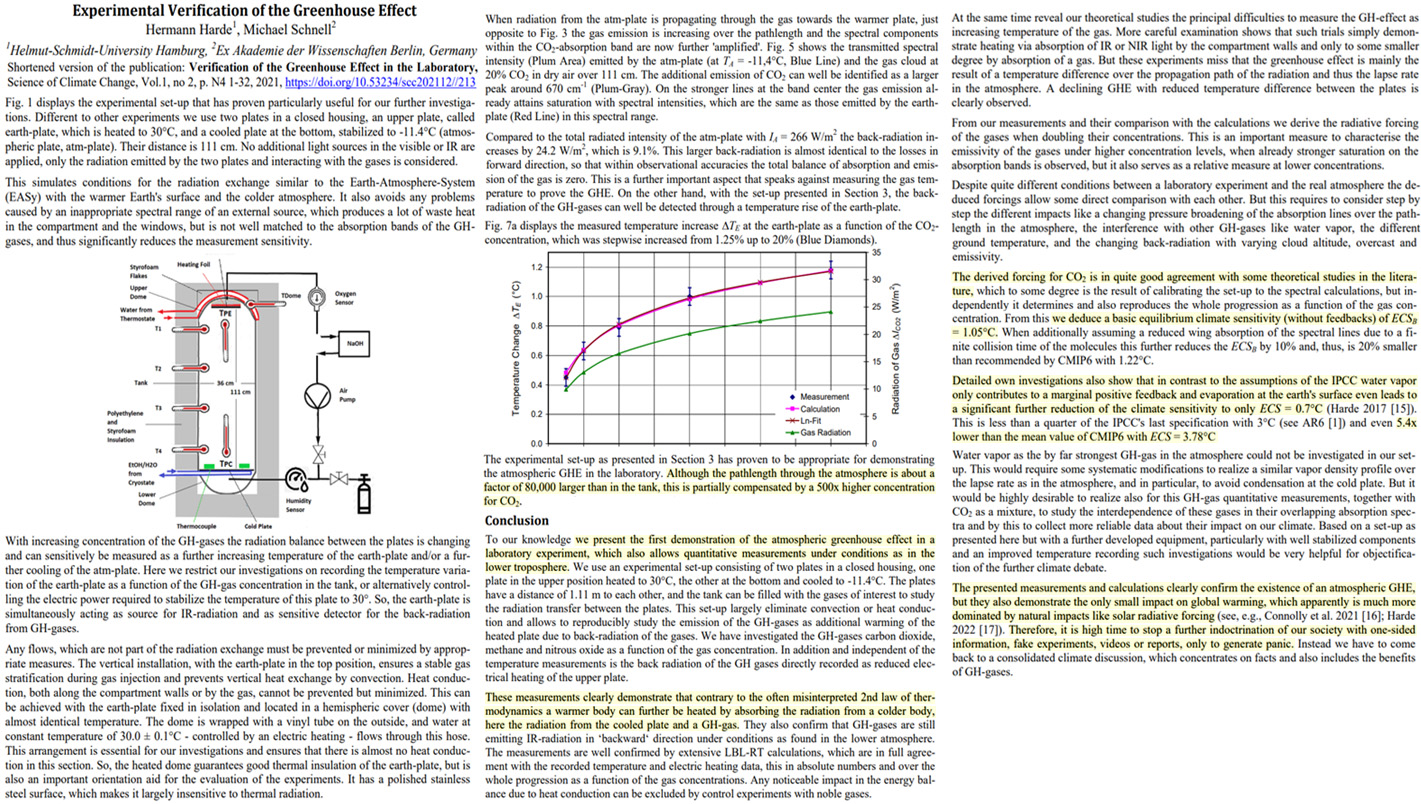
Harde and Schnell, 2022 (2XCO2 = 0.7°C)
The derived forcing for CO2 is in quite good agreement with some theoretical studies in the literature, which to some degree is the result of calibrating the set-up to the spectral calculations, but independently it determines and also reproduces the whole progression as a function of the gas concentration. From this we deduce a basic equilibrium climate sensitivity (without feedbacks) of ECSB = 1.05°C. When additionally assuming a reduced wing absorption of the spectral lines due to a finite collision time of the molecules this further reduces the ECSB by 10% and, thus, is 20% smaller than recommended by CMIP6 with 1.22°C. … Detailed own investigations also show that in contrast to the assumptions of the IPCC water vapor only contributes to a marginal positive feedback and evaporation at the earth’s surface even leads to a significant further reduction of the climate sensitivity to only ECS = 0.7°C (Harde 2017 [15]). This is less than a quarter of the IPCC’s last specification with 3°C (see AR6 [1]) and even 5.4x lower than the mean value of CMIP6 with ECS = 3.78°C. The presented measurements and calculations clearly confirm the existence of an atmospheric GHE, but they also demonstrate the only small impact on global warming, which apparently is much more dominated by natural impacts like solar radiative forcing (see, e.g., Connolly et al. 2021 [16]; Harde 2022 [17]).
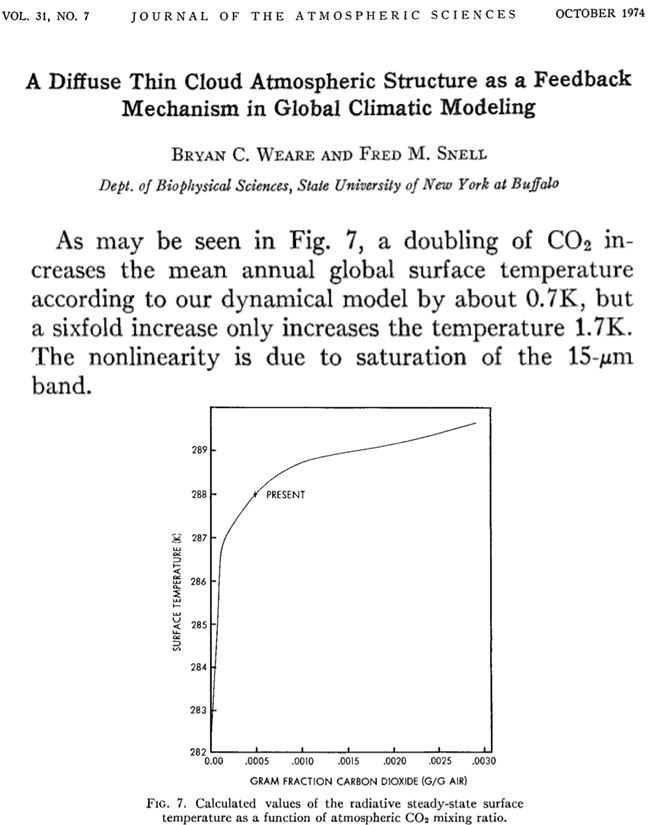
Weare and Snell, 1974 (2X CO2 = 0.7°C, 6XCO2 = 1.7°C)
Introduction: There has been in recent years a growing concern over possible inadvertent climate alteration by man’s activity (SMI, 1971; Matthews et al., 1971). As a result, there has been considerable effort devoted to developing predictive global climatic models (Budyko, 1969, 1972; Sellers, 1969, 1973), or to otherwise assessing the climatic effect of atmospheric pollutants (see, e.g., Manabe, 1971; Lamb, 1970; Rasool and Schneider, 1971; Bryson, 1972; Mitchell, 1970). This effort has been useful in providing tentative predictions and has certainly stimulated more interest and even controversy. However, the climatic models have relied heavily on simplified empirical parameterizations and, in general, none of the assessments have been very inclusive of many of the earth-atmosphere dynamic feedback mechanisms. For instance, one of the most important factors potentially affecting the radiation balance of the earth-atmosphere system is clouds because of their high reflectivity in the visible spectrum and absorption-emission in the infrared.
In Fig. 6 we present the results of altering atmospheric aerosol from the assumed present day-day value of about 0.1 optical depth units. … A doubling produces a 1K decrease in mean annual global surface temperature, whereas a fourfold increase produces somewhat more than a 3K decrease. … As may be seen in Fig. 7, a doubling of CO2 increase the mean annual global surface temperature according to our dynamical model by about 0.7K, but a sixfold increase only increases the temperature 1.7K. The nonlinearity is due to saturation of the 15 µm band.
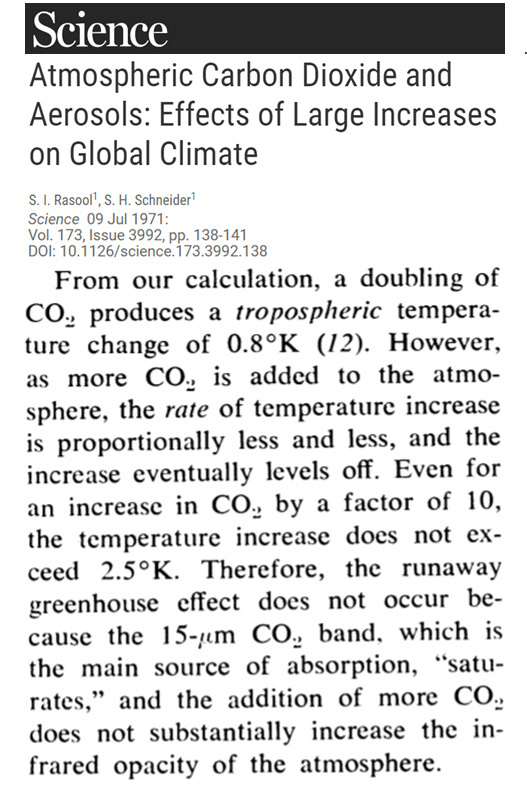
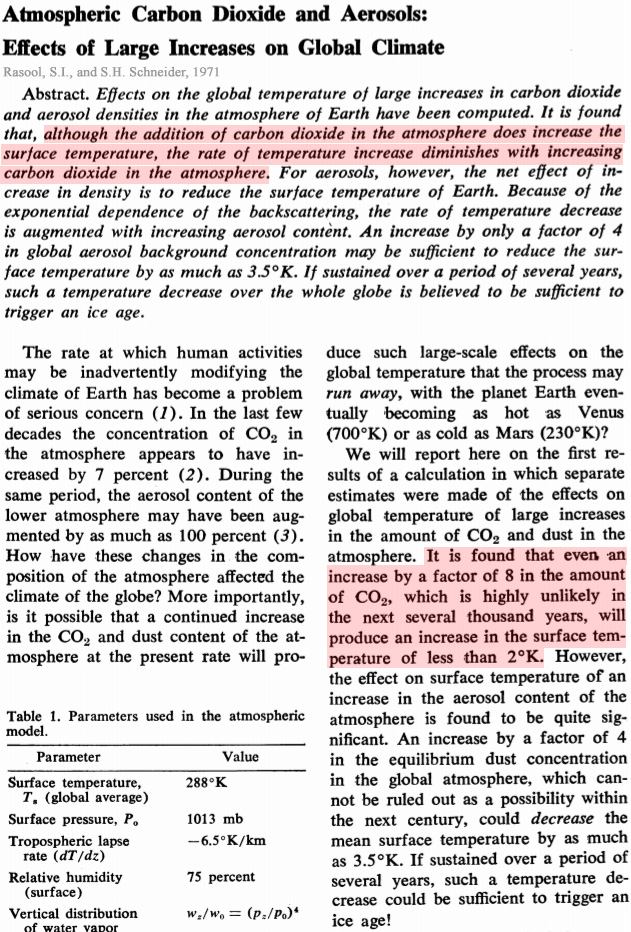
Rasool and Schneider, 1971 2XCO2 = 0.8°C, 8xCO2 = <2°C
It is found that, although the addition of carbon dioxide in the atmosphere does increase the surface temperature, the rate of temperature increase diminishes with increasing carbon dioxide in the atmosphere. … It is found that even an increase by a factor of 8 in the amount of CO2, which is highly unlikely in the next several thousand years, will produce an increase in the surface temperature of less than 2°K.
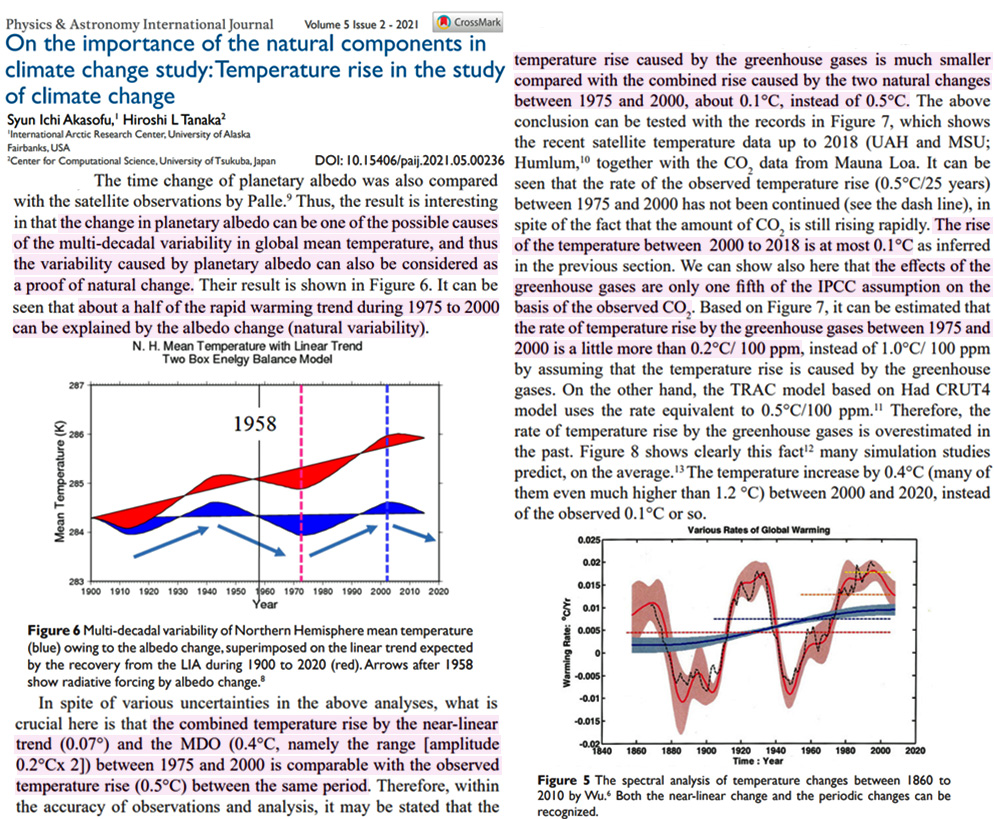
Akasofu and Tanaka, 2022 (100 ppm CO2 = 0.2°C)
In spite of various uncertainties in the above analyses, what is crucial here is that the combined temperature rise by the near-linear trend (0.07°) and the MDO (0.4°C, namely the range [amplitude 0.2°Cx 2]) between 1975 and 2000 is comparable with the observed temperature rise (0.5°C) between the same period. Therefore, within the accuracy of observations and analysis, it may be stated that the temperature rise caused by the greenhouse gases is much smaller compared with the combined rise caused by the two natural changes between 1975 and 2000, about 0.1°C, instead of 0.5°C. The above conclusion can be tested with the records in Figure 7, which shows the recent satellite temperature data up to 2018 (UAH and MSU; Humlum,10 together with the CO2 data from Mauna Loa. It can be seen that the rate of the observed temperature rise (0.5°C/25 years) between 1975 and 2000 has not been continued (see the dash line), in spite of the fact that the amount of CO2 is still rising rapidly. The rise of the temperature between 2000 to 2018 is at most 0.1°C as inferred in the previous section. We can show also here that the effects of the greenhouse gases are only one fifth of the IPCC assumption on the basis of the observed CO2. Based on Figure 7, it can be estimated that the rate of temperature rise by the greenhouse gases between 1975 and 2000 is a little more than 0.2°C/ 100 ppm, instead of 1.0°C/ 100 ppm by assuming that the temperature rise is caused by the greenhouse gases. On the other hand, the TRAC model based on Had CRUT4 model uses the rate equivalent to 0.5°C/100 ppm. Therefore, the rate of temperature rise by the greenhouse gases is overestimated in the past. Figure 8 shows clearly this fact many simulation studies predict, on the average. The temperature increase by 0.4°C (many of them even much higher than 1.2 °C) between 2000 and 2020, instead of the observed 0.1°C or so.
Smirnov, 2022 (2XCO2 = 0.6°C)
Climatological models…pretend on a long-term description of the atmosphere…ignoring physical laws in climatology…the Kirchoff law is neglected in climatological models. This leads to a large mistake in prediction of the global temperature change. … [D]oubling the concentration of atmospheric CO2 molecules leads to the following change of the global temperature T = (0.6 ± 0.3) °C
Lindzen and Choi, 2011 (2X CO2 = 0.7°C)
As a result, the climate sensitivity for a doubling of CO2 is estimated to be 0.7K (with the confidence interval 0.5K – 1.3K at 99% levels). This observational result shows that model sensitivities indicated by the IPCC AR4 are likely greater than the possibilities estimated from the observations.
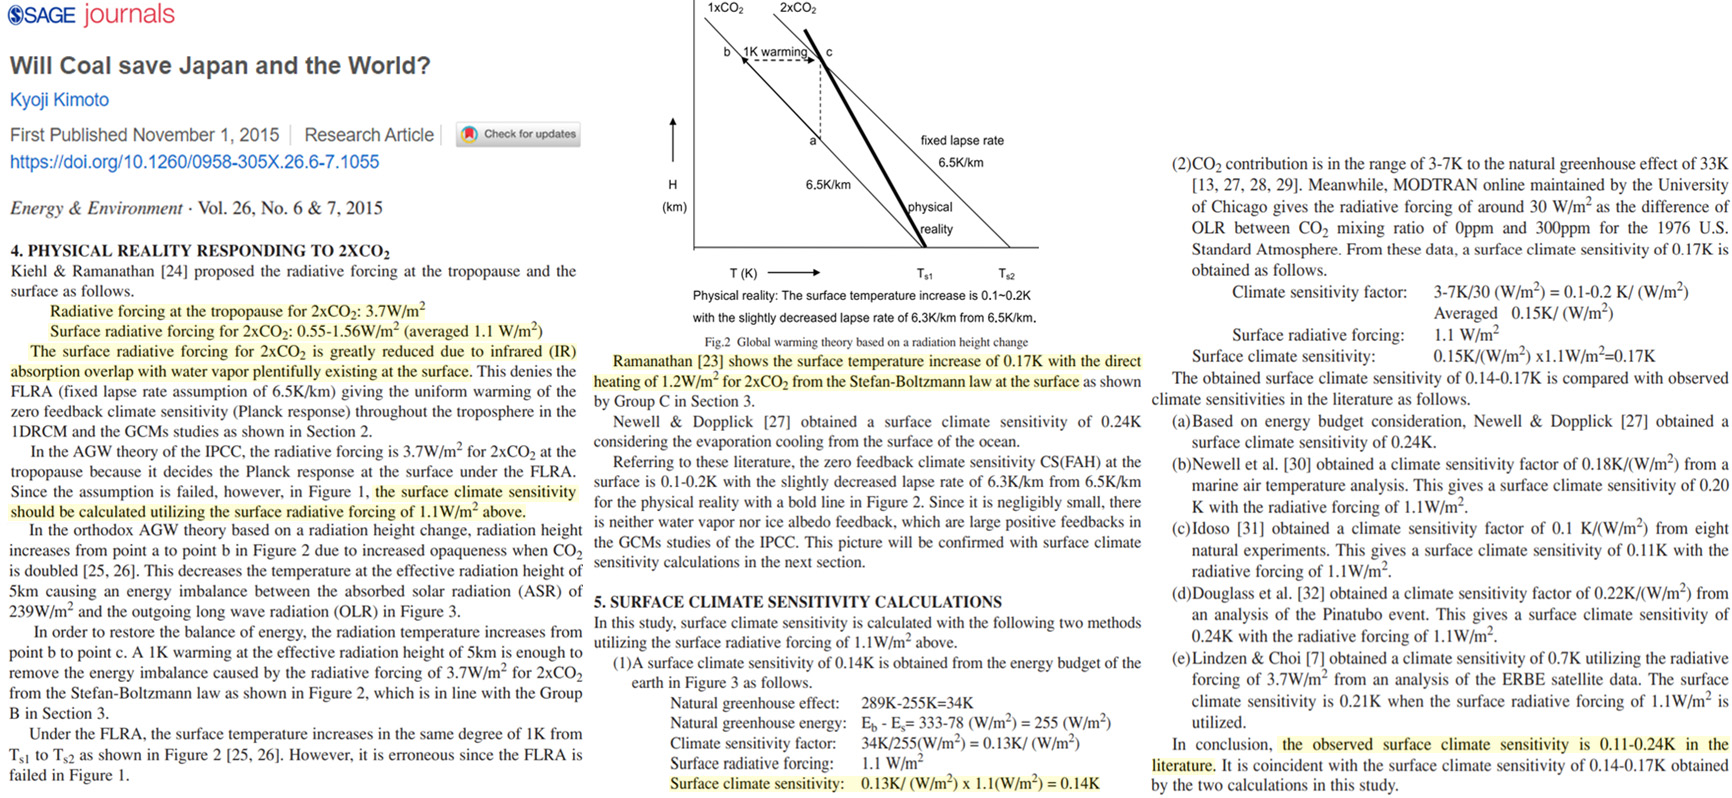
Kimoto, 2015 [full] (2X CO2= ~0.16°C)
The central dogma is critically evaluated in the anthropogenic global warming (AGW) theory of the IPCC, claiming the Planck response is 1.2K when CO2 is doubled. The first basis of it is one dimensional model studies with the fixed lapse rate assumption of 6.5K/km. It is failed from the lack of the parameter sensitivity analysis of the lapse rate for CO2 doubling. The second basis is the Planck response calculation by Cess in 1976 having a mathematical error. Therefore, the AGW theory is collapsed along with the canonical climate sensitivity of 3K utilizing the radiative forcing of 3.7W/m2 for CO2 doubling. The surface climate sensitivity is 0.14 – 0.17 K in this study with the surface radiative forcing of 1.1 W/m2.
Ollila, 2014 (2X CO2 = ~ 0.6°C)
The Potency of Carbon Dioxide as a Greenhouse Gas
According to this study the commonly applied radiative forcing (RF) value of 3.7 Wm-2 for CO2 concentration of 560 ppm includes water feedback. The same value without water feedback is 2.16 Wm-2 which is 41.6 % smaller. Spectral analyses show that the contribution of CO2 in the greenhouse (GH) phenomenon is about 11 % and water’s strength in the present climate in comparison to CO2 is 15.2. The author has analyzed the value of the climate sensitivity (CS) and the climate sensitivity parameter (l)using three different calculation bases. These methods include energy balance calculations, infrared radiation absorption in the atmosphere, and the changes in outgoing longwave radiation at the top of the atmosphere. According to the analyzed results, the equilibrium CS (ECS) is at maximum 0.6 °C and the best estimate of l is 0.268 K/(Wm-2 ) without any feedback mechanisms.
Harde, 2016 (2X CO2 = 0.7°C)
Including solar and cloud effects as well as all relevant feedback processes our simulations give an equilibrium climate sensitivity of CS = 0.7 °C (temperature increase at doubled CO2) and a solar sensitivity of SS = 0.17 °C (at 0.1 % increase of the total solar irradiance). Then CO2 contributes 40 % and the Sun 60 % to global warming over the last century.
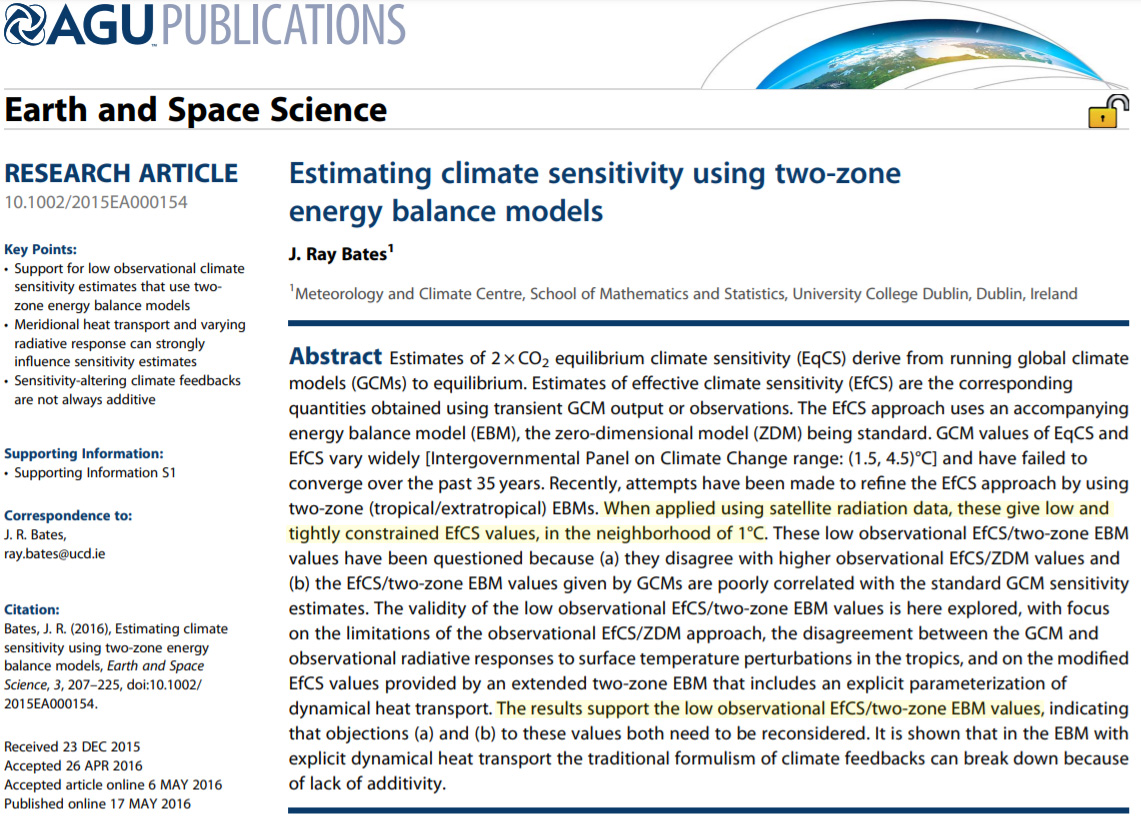
Bates, 2016 (2X CO2 = ~1°C)
Estimates of 2xCO2 equilibrium climate sensitivity (EqCS) derive from running global climate models (GCMs) to equilibrium. Estimates of effective climate sensitivity (EfCS) are the corresponding quantities obtained using transient GCM output or observations. The EfCS approach uses an accompanying energy balance model (EBM), the zero-dimensional model (ZDM) being standard. GCM values of EqCS and EfCS vary widely [IPCC range: (1.5, 4.5)°C] and have failed to converge over the past 35 years. Recently, attempts have been made to refine the EfCS approach by using two-zone (tropical/extratropical) EBMs. When applied using satellite radiation data, these give low and tightly-constrained EfCS values, in the neighbourhood of 1°C. … The central conclusion of this study is that to disregard the low values of effective climate sensitivity (≈1°C) given by observations on the grounds that they do not agree with the larger values of equilibrium, or effective, climate sensitivity given by GCMs, while the GCMs themselves do not properly represent the observed value of the tropical radiative response coefficient, is a standpoint that needs to be reconsidered.
Evans, 2016 (2X CO2 = <0.5°C)
The conventional basic climate model applies “basic physics” to climate, estimating sensitivity to CO2. However, it has two serious architectural errors. It only allows feedbacks in response to surface warming, so it omits the driver-specific feedbacks. It treats extra-absorbed sunlight, which heats the surface and increases outgoing long-wave radiation (OLR), the same as extra CO2, which reduces OLR from carbon dioxide in the upper atmosphere but does not increase the total OLR. The rerouting feedback is proposed. An increasing CO2 concentration warms the upper troposphere, heating the water vapor emissions layer and some cloud tops, which emit more OLR and descend to lower and warmer altitudes. This feedback resolves the nonobservation of the “hotspot.” An alternative model is developed, whose architecture fixes the errors. By summing the (surface) warmings due to climate drivers, rather than their forcings, it allows driver-specific forcings and allows a separate CO2 response (the conventional model applies the same response, the solar response, to all forcings). It also applies a radiation balance, estimating OLR from properties of the emission layers. Fitting the climate data to the alternative model, we find that the equilibrium climate sensitivity is most likely less than 0.5°C, increasing CO2 most likely caused less than 20% of the global warming from the 1970s, and the CO2 response is less than one-third as strong as the solar response. The conventional model overestimates the potency of CO2 because it applies the strong solar response instead of the weak CO2response to the CO2 forcing.
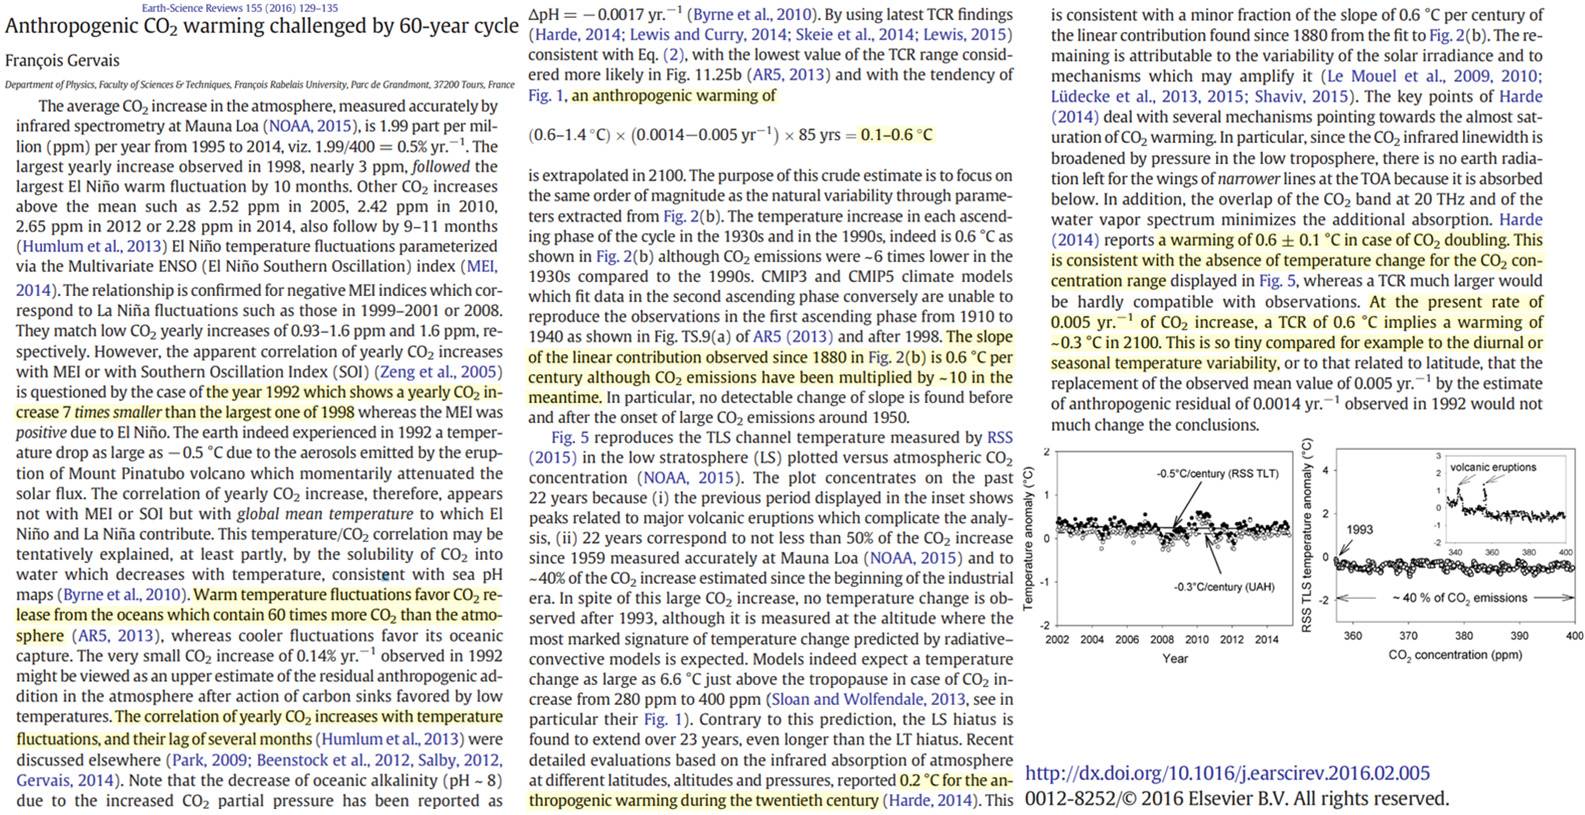
Gervais, 2016 [full] (2X CO2 = <0.6°C)
Conclusion: Dangerous anthropogenic warming is questioned (i) upon recognition of the large amplitude of the natural 60–year cyclic component and (ii) upon revision downwards of the transient climate response consistent with latest tendencies shown in Fig. 1, here found to be at most 0.6 °C once the natural component has been removed, consistent with latest infrared studies (Harde, 2014). Anthropogenic warming well below the potentially dangerous range were reported in older and recent studies (Idso, 1998; Miskolczi, 2007; Paltridge et al., 2009; Gerlich and Tscheuschner, 2009; Lindzen and Choi, 2009, 2011; Spencer and Braswell, 2010; Clark, 2010; Kramm and Dlugi, 2011; Lewis and Curry, 2014; Skeie et al., 2014; Lewis, 2015; Volokin and ReLlez, 2015). On inspection of a risk of anthropogenic warming thus toned down, a change of paradigm which highlights a benefit for mankind related to the increase of plant feeding and crops yields by enhanced CO2 photosynthesis is suggested.
Soon, Connolly, and Connolly, 2015 [full] (2X [400 ppm] CO2 = 0.44°C)
Nonetheless, let us ignore the negative relationship with greenhouse gas (GHG) radiative forcing, and assume the carbon dioxide (CO2) relationship is valid. If atmospheric carbon dioxide concentrations have risen by ~110 ppmv since 1881 (i.e., 290→400 ppmv), this would imply that carbon dioxide (CO2) is responsible for a warming of at most 0.0011 × 110 = 0.12°C over the 1881-2014 period, where 0.0011 is the slope of the line in Figure 29(a). We can use this relationship to calculate the so-called “climate sensitivity” to carbon dioxide, i.e., the temperature response to a doubling of atmospheric carbon dioxide. According to this model, if atmospheric carbon dioxide concentrations were to increase by ~400 ppmv, this would contribute to at most 0.0011 × 400 = 0.44°C warming. That is, the climate sensitivity to atmospheric carbon dioxide is at most 0.44°C.
Reinhart, 2017 (2X [400 ppm] CO2 = 0.24°C)
Our results permit to conclude that CO2 is a very weak greenhouse gas and cannot be accepted as the main driver of climate change. … The assumption of a constant temperature and black body radiation definitely violates reality and even the principles of thermodynamics. … [W]e conclude that the temperature increases predicted by the IPCC AR5 lack robust scientific justification. … A doubling [to 800 ppm] of the present level of CO2 [400 ppm] results in [temperature change] < 0.24 K. … [T]he scientific community must look for causes of climate change that can be solidly based on physics and chemistry. … The observed temperature increase since pre-industrial times is close to an order of magnitude higher than that attributable to CO2.
Balling Jr, 1994 (2XCO2 = <1.0°C)
Close examination of the global temperature record, together with other factors, does not support the global warming models’ predictions – the thermal response to a doubling of CO2 is likely to be ‘remarkably small’.
An additional problem of linking the observed changes in surface temperature to the build-up of greenhouse gases involves the timing of the warming. The problem here is simple. The amount of warming from 1893 to 1992 shown in Figure 1 is well-established at 0.45°C. However, the amount of warming in the first half of the record (from 1893 to 1942) is 0.32°C; this result clearly shows that nearly three-quarters of the linear warming of this century had occurred before the time of the most rapid build-up of greenhouse gases.
As we have seen, the surface air temperature records show a linear increase of 0.45°C pver the past 100 years. However, urban heat islands may cause a 0.05°C reduction, overgrazing and desertification may lower the trend by the same amount as the urban heat island effect, and stratospheric aerosol variations may lower the trend by 0.15°C. And if we include the statistical association between sunspot cycle length and global temperature, the trend is almost eliminated. Even without considering the possible role of solar output, at least half of the warming of the past century can be explained by non-greenhouse phenomena, and most of that warming occurred in the first part of the record.
[T]he temperature record of the past century suggests that a doubling of carbon dioxide will produce a global temperature response at the lowest end of the model predictions – probably not more than 1.0°C.
Smirnov, 2020 (2XCO2 = <0.6°C)
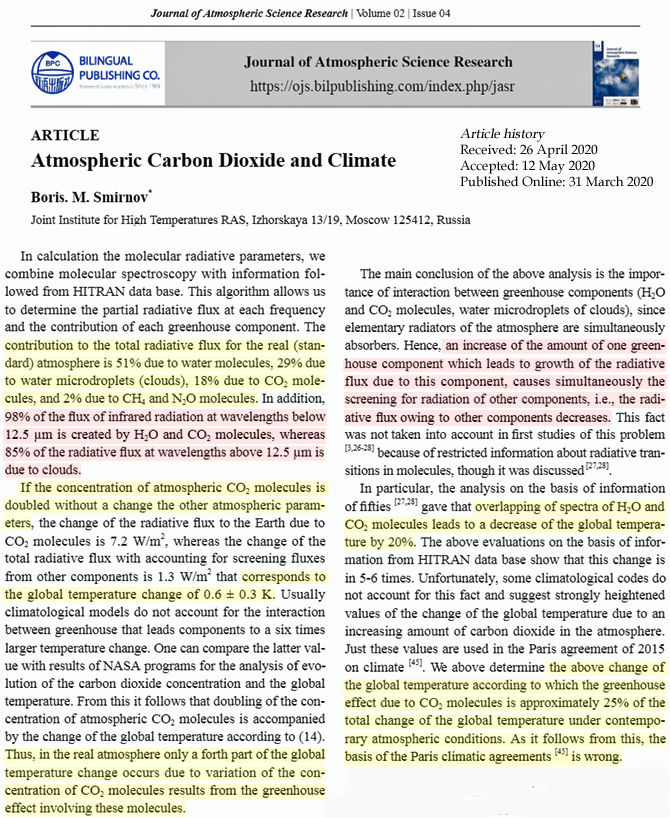
The contribution to the total radiative flux for the real (standard) atmosphere is 51% due to water molecules, 29% due to water microdroplets (clouds), 18% due to CO2 molecules, and 2% due to CH4 and N2O molecules. In addition, 98% of the flux of infrared radiation at wavelengths below 12.5 µm is created by H2O and CO2 molecules, whereas 85% of the radiative flux at wavelengths above 12.5 µm is due to clouds. If the concentration of atmospheric CO2 molecules is doubled without a change the other atmospheric param-eters, the change of the radiative flux to the Earth due to CO2 molecules is 7.2 W/m2, whereas the change of the total radiative flux with accounting for screening fluxes from other components is 1.3 W/m2 that corresponds to the global temperature change of 0.6 ± 0.3 K. Usually climatological models do not account for the interaction between greenhouse that leads components to a six times larger temperature change. One can compare the latter value with results of NASA programs for the analysis of evolution of the carbon dioxide concentration and the global temperature. From this it follows that doubling of the concentration of atmospheric CO2 molecules is accompanied by the change of the global temperature according to (14). Thus, in the real atmosphere only a forth part of the global temperature change occurs due to variation of the concentration of CO2 molecules results from the greenhouse effect involving these molecules.
Bellamy and Barrett, 2007 (2XCO2= <1.0°C)
This paper demonstrates that the widely prophesied doubling of atmospheric carbon dioxide levels from natural, pre-industrial values will enhance the so-called ‘greenhouse effect’ but will amount to less than 1°C of global warming. It also points out that such a scenario is unlikely to arise given our limited reserves of fossil fuels—certainly not before the end of this century.
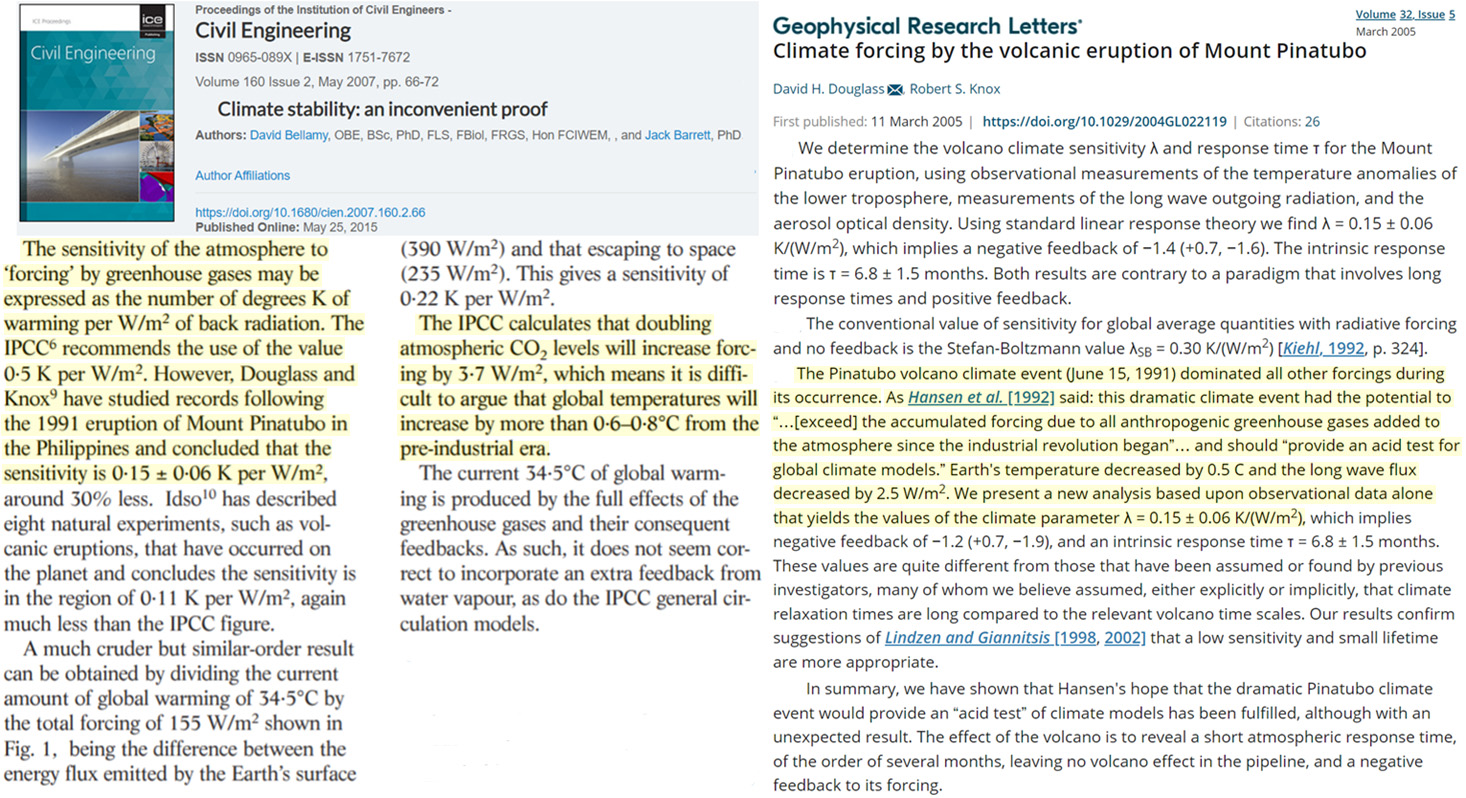
Image Source: Douglass and Knox, 2005
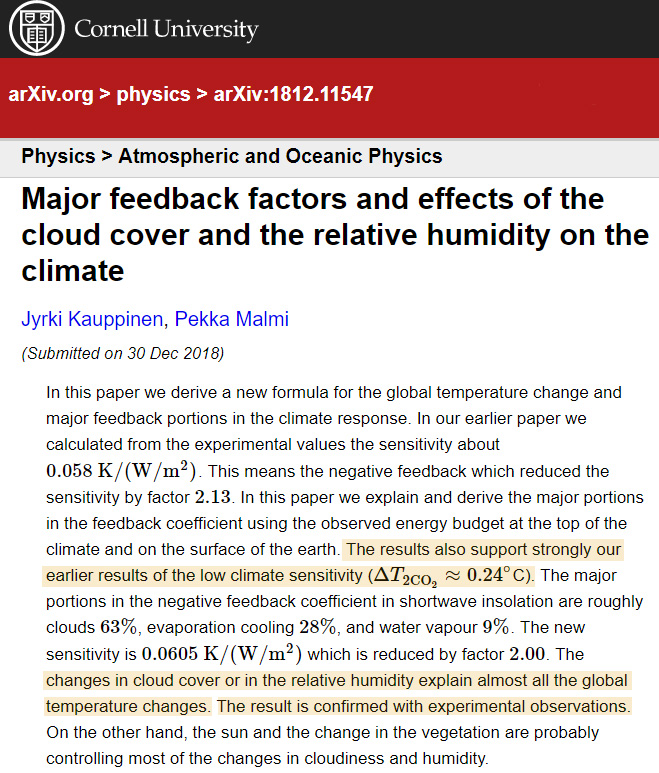
Kauppinen and Malmi, 2019 (2X CO2 ≈ 0.24°C)
In this paper we explain and derive the major portions in the feedback coefficient using the observed energy budget at the top of the climate and on the surface of the earth. The results also support strongly our earlier results of the low climate sensitivity (ΔT2CO2≈0.24°C). The major portions in the negative feedback coefficient in shortwave insolation are roughly clouds 63%, evaporation cooling 28%, and water vapour 9%. The new sensitivity is 0.0605 K/(W/m2) which is reduced by factor 2.00. The changes in cloud cover or in the relative humidity explain almost all the global temperature changes. The result is confirmed with experimental observations.
Ollila, 2019 (2XCO2= 0.6°C)
If a climate model using the positive water feedback were applied to the GH effect magnitude of this study, it would fail worse than a model showing a TCS value of 1.2°C. If there were a positive water feedback mechanism in the atmosphere, there is no scientific grounding to assume that this mechanism would start to work only if the CO2 concentration exceeds 280 ppm, and actually, the IPCC does not claim so. The absolute humidity and temperature observations show that there is no positive water feedback mechanism in the atmosphere during the longer time periods. … The contribution of CO2 in the GH effect is 7.3% corresponding to 2.4°C in temperature. The reproduction of CO2 radiative forcing (RF) showed the climate sensitivity RF value to be 2.16 Wm-2, which is 41.6% smaller than the 3.7 Wm-2 used by the IPCC. A climate model showing a climate sensitivity (CS) of 0.6°C matches the CO2 contribution in the GH effect, but the IPCC’s climate model showing a CS of 1.8°C or 1.2°C does not.
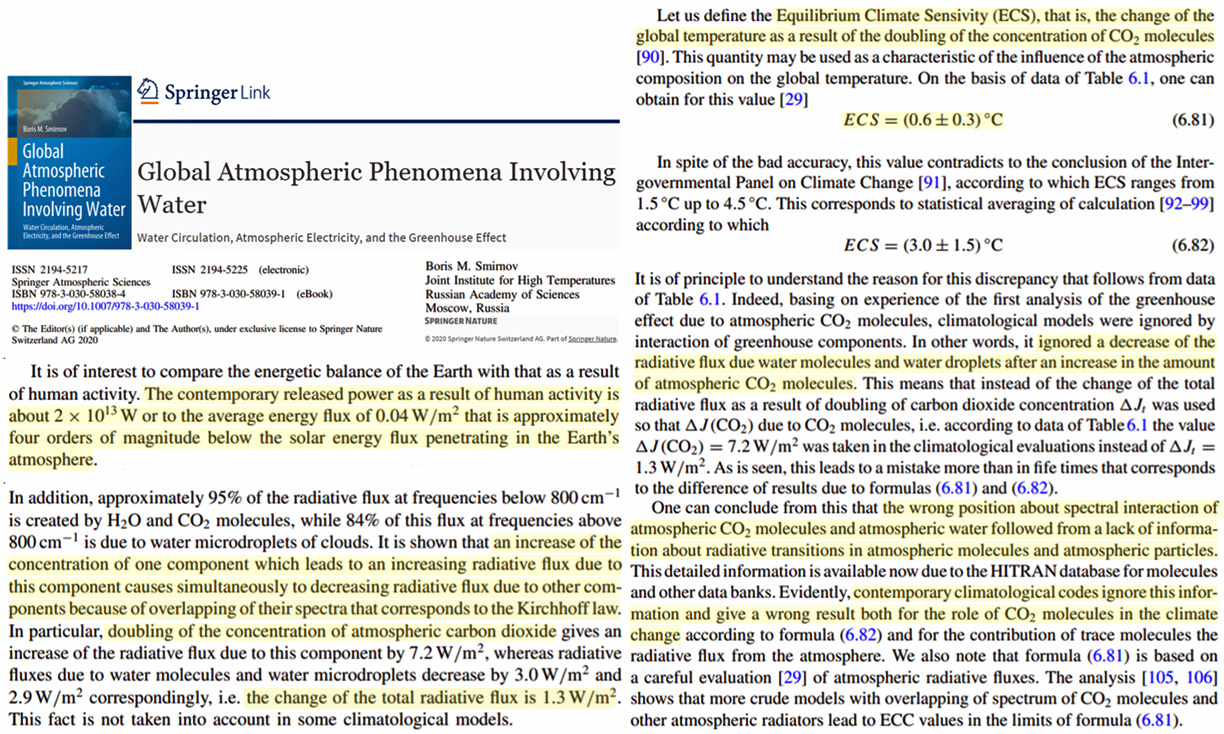
Smirnov, 2020 (2XCO2= 0.6°C)
It is of interest to compare the energetic balance of the Earth with that as a result of human activity. The contemporary released power as a result of human activity is about 2 × 10¹³ W or to the average energy flux of 0.04 W/m2 that is approximately four orders of magnitude below the solar energy flux penetrating in the Earth’s atmosphere. … Let us define the Equilibrium Climate Sensivity (ECS), that is, the change of the global temperature as a result of the doubling of the concentration of CO2 molecules[90]. This quantity may be used as a characteristic of the influence of the atmospheric composition on the global temperature. On the basis of data of Table 6.1, one can obtain for this value [29] ECS = (0.6 ± 0.3) °C.
Abbot and Marohasy, 2017 (2XCO2= <0.6°C)
The largest deviation between the ANN [artificial neural network] projections and measured temperatures for six geographically distinct regions was approximately 0.2 °C, and from this an Equilibrium Climate Sensitivity (ECS) of approximately 0.6 °C [for a doubling of CO2 from 280 ppm to 560 ppm plus feedbacks] was estimated. This is considerably less than estimates from the General Circulation Models (GCMs) used by the Intergovernmental Panel on Climate Change (IPCC), and similar to estimates from spectroscopic methods.
The proxy measurements suggest New Zealand’s climate has fluctuated within a band of approximately 2°C since at least 900 AD, as shown in Figure 2. The warming of nearly 1°C since 1940 falls within this band. The discrepancy between the orange and blue lines in recent decades as shown in Figure 3, suggests that the anthropogenic contribution to this warming could be in the order of approximately 0.2°C. [80% of the warming since 1940 may be due natural factors].
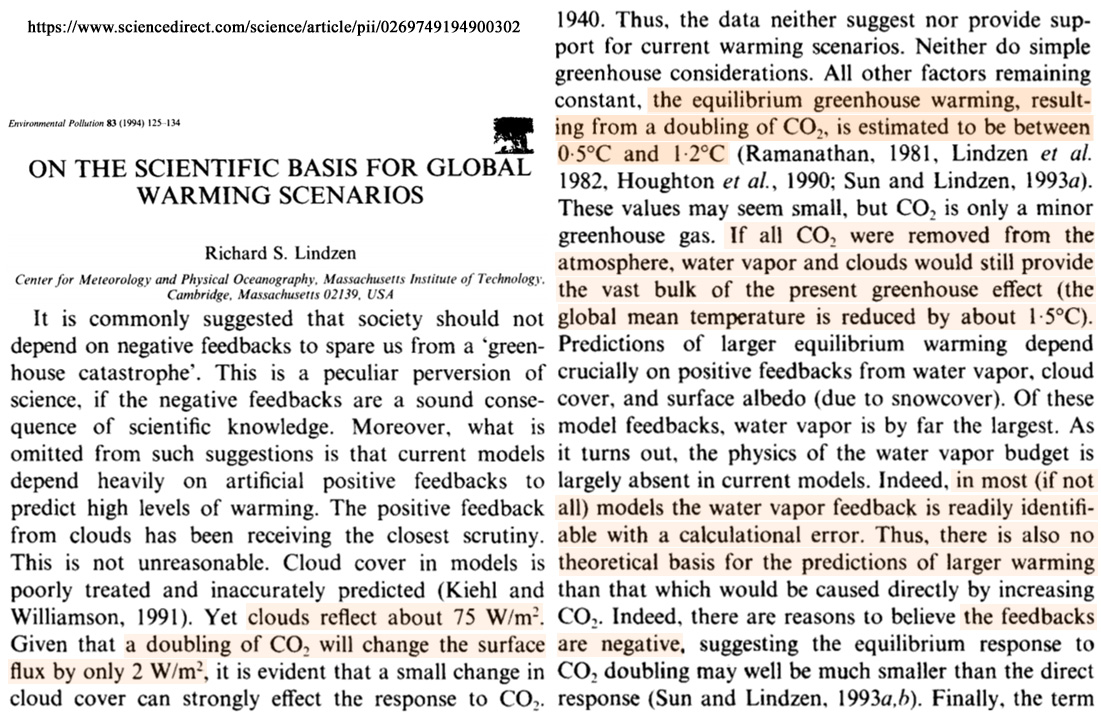
Lindzen, 1994 (2XCO2= 0.5-1.2°C, negative feedback from water vapor, cloud)
All other factors remaining constant, the equilibrium greenhouse warming, resulting from a doubling of CO2, is estimated to be between 0.5°C and 1.2°C (Ramanathan, 1981, Lindzen et al. 1982, Houghton et al., 1990; Sun and Lindzen, 1993a). These values may seem small, but CO2 is only a minor greenhouse gas. If all CO2 were removed from the atmosphere, water vapor and clouds would still provide the vast bulk of the present greenhouse effect (the global mean temperature is reduced by about 1.5°C). … [I]t is noted that the predicted forcing is, in fact, small (2 W m 2 at the surface for a doubling of C02, or less than 1% of the absorbed solar flux). With respect to the latter, it is noted that predictions of significant warming are dependent on the presence of large positive feedbacks serving to amplify the response. The largest of these feedbacks in current models involves water vapor at upper levels in the troposphere. This feedback appears to be largely a model artijact, and evidence is presented that models may even have the wrong sign for this feedback.
Scafetta et al., 2017 (2XCO2= <1.0°C)
A millennial climatic oscillation would suggest that a significant percentage of the warming observed since 1850 could simply be a recovery from the Little Ice Age of the 14th – 18th centuries and that throughout the 20th century the climate naturally returned to a warm phase as it happened during the Roman and the Medieval warm periods. … We critically analyze the year 2015-2016, which has been famed as the hottest year on record. We show that this anomaly is simply due to a strong El-Niño event that has induced a sudden increase of the global surface temperature by 0.6 °C. This event is unrelated to anthropogenic emissions. … Herein, the authors have studied the post 2000 standstill global temperature records. It has been shown that once the ENSO signature is removed from the data, the serious divergence between the observations and the CMIP5 GCM projections becomes evident. … Since 2000 there has been a systematic tendency to find lower climate sensitivity values. The most recent studies suggest a transient climate response (TCR) of about 1.0 °C, an ECS less than 2.0 °C and an effective climate sensitivity (EfCS) in the neighborhood of 1.0 °C. …Thus, all evidences suggest that the IPCC GCMs at least increase twofold or even triple the real anthropogenic warming. The GHG theory might even require a deep re-examination.
Smirnov, 2017 (2X CO2 = 0.4°C )
It is shown that infrared emission of the atmosphere is determined mostly by atmospheric water. One can separate the flux of outgoing infrared radiation of the atmosphere from that towards the Earth. The fluxes due to rotation-vibration transitions of atmospheric CO2 molecules are evaluated. Doubling of the concentration of CO2 molecules in the atmosphere that is expected over 130 years leads to an increase of the average Earth temperature by (0.4±0.2) K mostly due to the flux towards the Earth if other atmospheric parameters are not varied.
Gray, 2018 (2XCO2 = 0.5°C)
[T]he globe’s annual surface solar absorption of 171 Wm-2 is balanced by about half going to evaporation (85 Wm-2) and the other half (86 Wm-2) going to surface to atmosphere upward IR (59 Wm-2) flux and surface to air upward flux by sensible heat transfer (27 Wm-2). Assuming that the imposed extra CO2 doubling IR blockage of 3.7 Wm-2 is taken up and balanced by the earth’s surface as the solar absorption is taken up and balanced, we should expect a direct warming of only ~ 0.5°C for a doubling of the CO2. The 1°C expected warming that is commonly accepted incorrectly assumes that all the absorbed IR goes to balancing outward radiation (through E = σT4- e.g., the Stefan-Boltzmann law) with no energy going to evaporation. … This analysis shows that the influence of doubling atmospheric CO2 by itself (without invoking any assumed water vapor positive feedback) leads to only small amounts of global warming which are much less than predicted by GCMs.
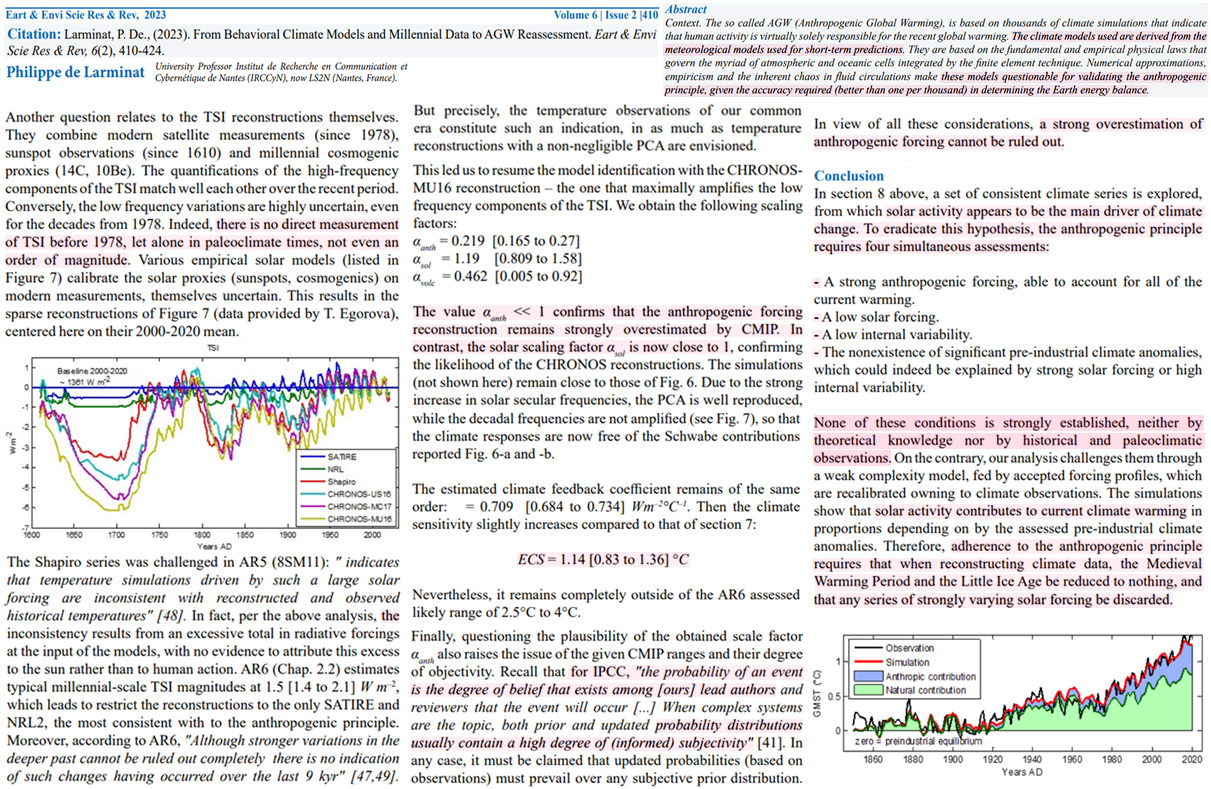
de Larminat, 2023 (2XCO2 = 1.14°C)
The estimated climate feedback coefficient remains of the same order: = 0.709 [0.684 to 0.734] Wm–2°C–1. Then the climate sensitivity [to doubled CO2] slightly increases compared to that of section 7: ECS = 1.14 [0.83 to 1.36] °C. Nevertheless, it remains completely outside of the AR6 assessed likely range of 2.5°C to 4°C.
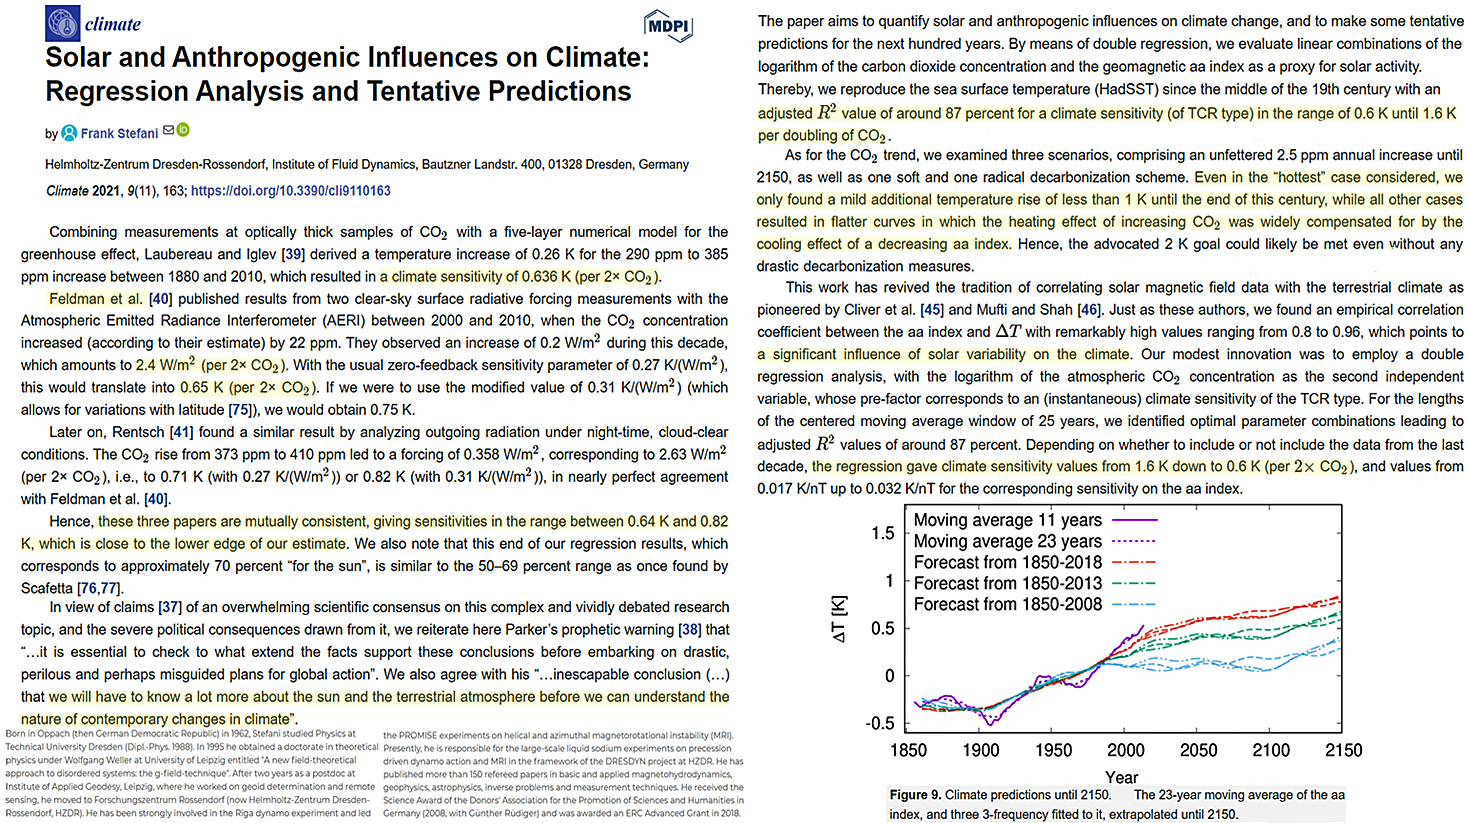
Stefani et al., 2021 (2xCO2 = 0.6 to 1.6°C)
The paper aims to quantify solar and anthropogenic influences on climate change, and to make some tentative predictions for the next hundred years. By means of double regression, we evaluate linear combinations of the logarithm of the carbon dioxide concentration and the geomagnetic aa index as a proxy for solar activity. Thereby, we reproduce the sea surface temperature (HadSST) since the middle of the 19th century with an adjusted R2 value of around 87 percent for a climate sensitivity (of TCR type) in the range of 0.6 K until 1.6 K per doubling of CO2. The solution of the double regression is quite sensitive: when including data from the last decade, the simultaneous occurrence of a strong El Niño and of low aa values leads to a preponderance of solutions with relatively high climate sensitivities around 1.6 K. If these later data are excluded, the regression delivers a significantly higher weight of the aa index and, correspondingly, a lower climate sensitivity going down to 0.6 K. The plausibility of such low values is discussed in view of recent experimental and satellite-borne measurements. We argue that a further decade of data collection will be needed to allow for a reliable distinction between low and high sensitivity values. In the second part, which builds on recent ideas about a quasi-deterministic planetary synchronization of the solar dynamo, we make a first attempt to predict the aa index and the resulting temperature anomaly for various typical CO2 scenarios. Even for the highest climate sensitivities, and an unabated linear CO2 increase, we predict only a mild additional temperature rise of around 1 K until the end of the century, while for the lower values an imminent temperature drop in the near future, followed by a rather flat temperature curve, is prognosticated.
(b) Non-Quantified ‘Practically No Effect’, ‘Close To Zero’ CO2 Climate Sensitivity
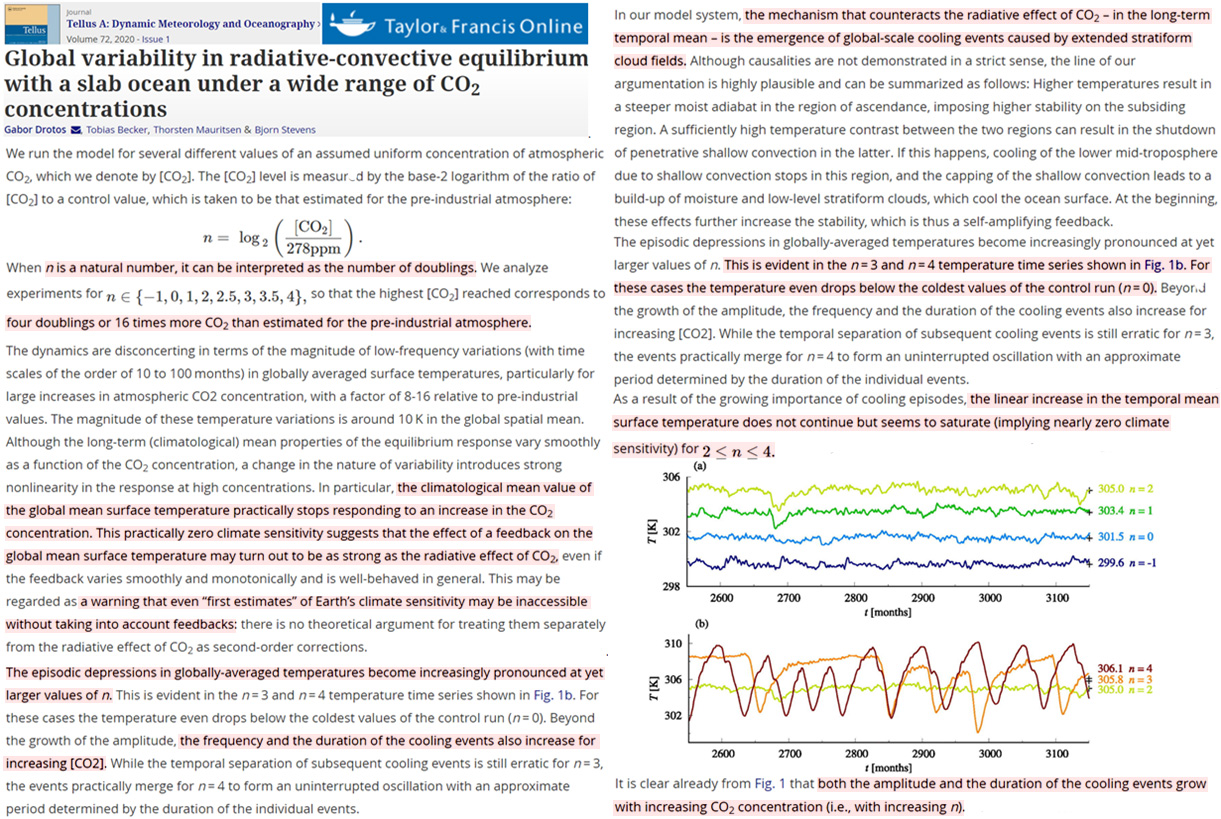
Drotos et al., 2020
Although the long-term (climatological) mean properties of the equilibrium response vary smoothly as a function of the CO2 concentration, a change in the nature of variability introduces strong nonlinearity in the response at high concentrations. In particular, the climatological mean value of the global mean surface temperature practically stops responding to an increase in the CO2 concentration. This practically zero climate sensitivity suggests that the effect of a feedback on the global mean surface temperature may turn out to be as strong as the radiative effect of CO2, even if the feedback varies smoothly and monotonically and is well-behaved in general. This may be regarded as a warning that even “first estimates” of Earth’s climate sensitivity may be inaccessible without taking into account feedbacks: there is no theoretical argument for treating them separately from the radiative effect of CO2 as second-order corrections. … At CO2 concentrations beyond four times the preindustrial value, the climate sensitivity decreases to nearly zero as a result of episodic global cooling events as large as 10 K.
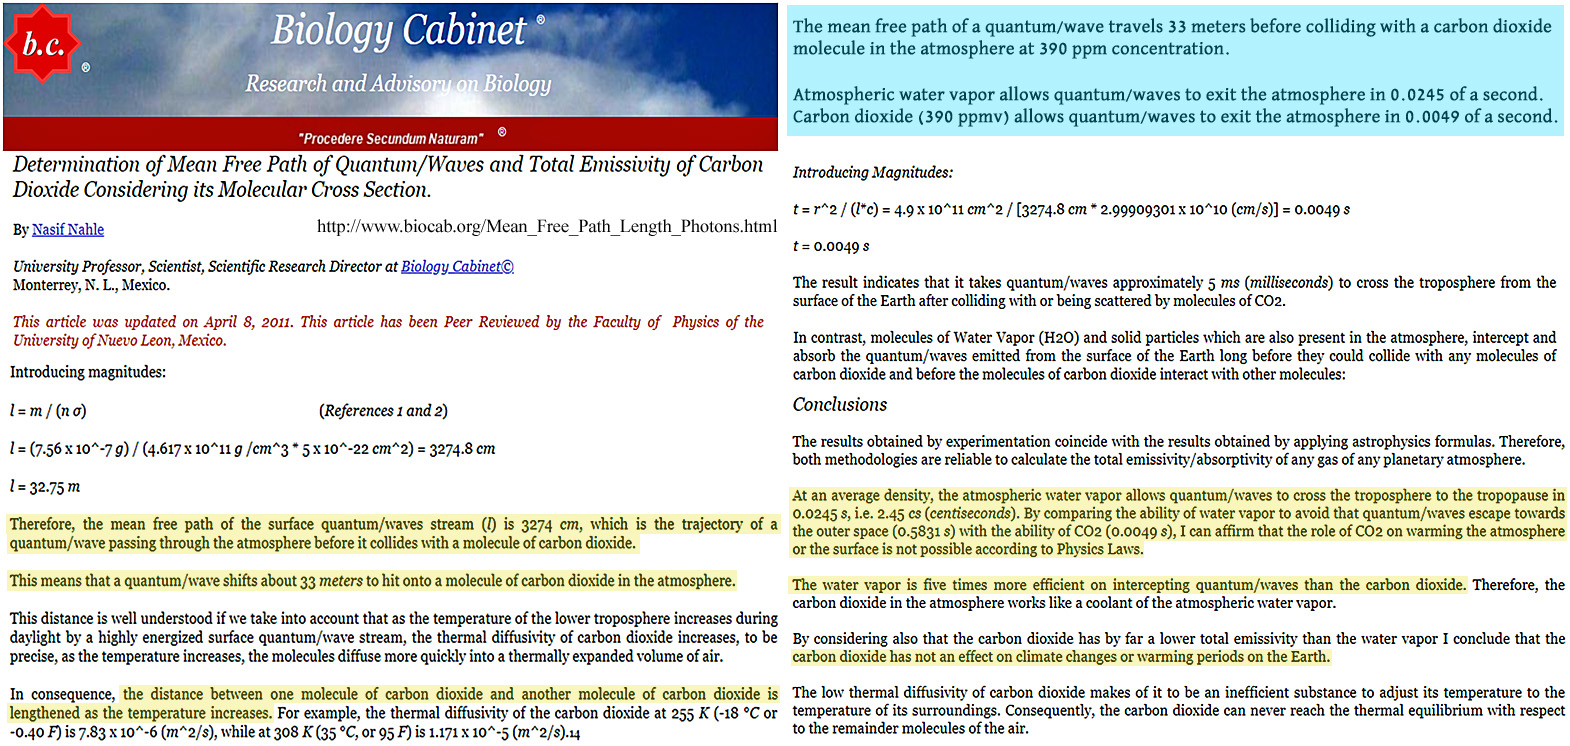
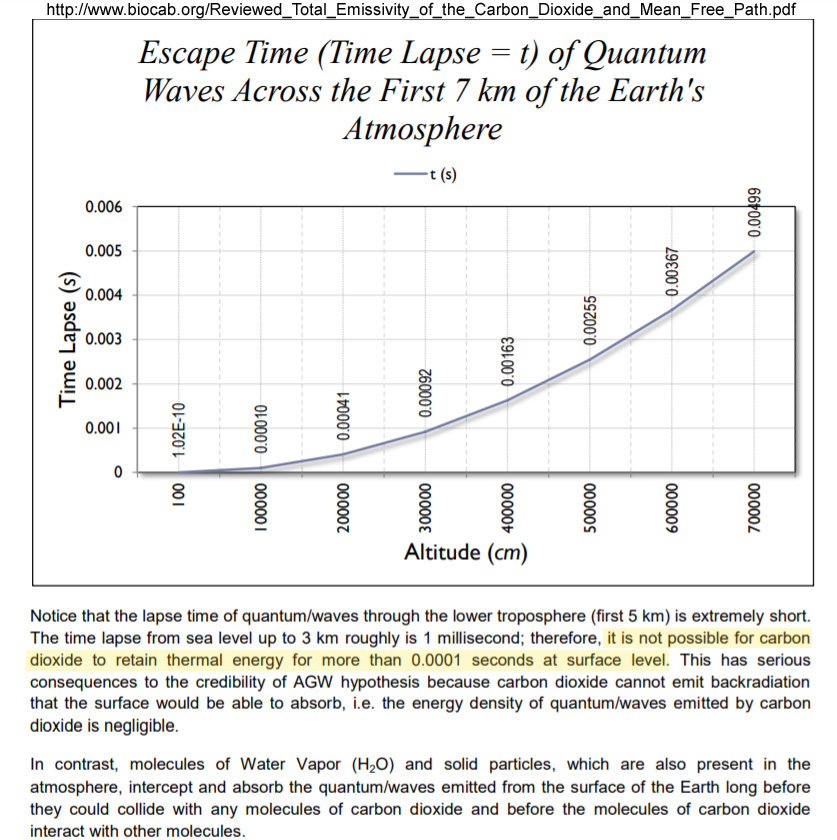
Nahle, 2011
At an average density, the atmospheric water vapor allows quantum/waves to cross the troposphere to the tropopause in 0.0245 s, i.e. 2.45 cs (centiseconds). By comparing the ability of water vapor to avoid that quantum/waves escape towards the outer space (0.5831 s) with the ability of CO2 (0.0049 s), I can affirm that the role of CO2 on warming the atmosphere or the surface is not possible according to Physics Laws. … The water vapor is five times more efficient on intercepting quantum/waves than the carbon dioxide. Therefore, the carbon dioxide in the atmosphere works like a coolant of the atmospheric water vapor. … By considering also that the carbon dioxide has by far a lower total emissivity than the water vapor I conclude that the carbon dioxide has not an effect on climate changes or warming periods on the Earth.
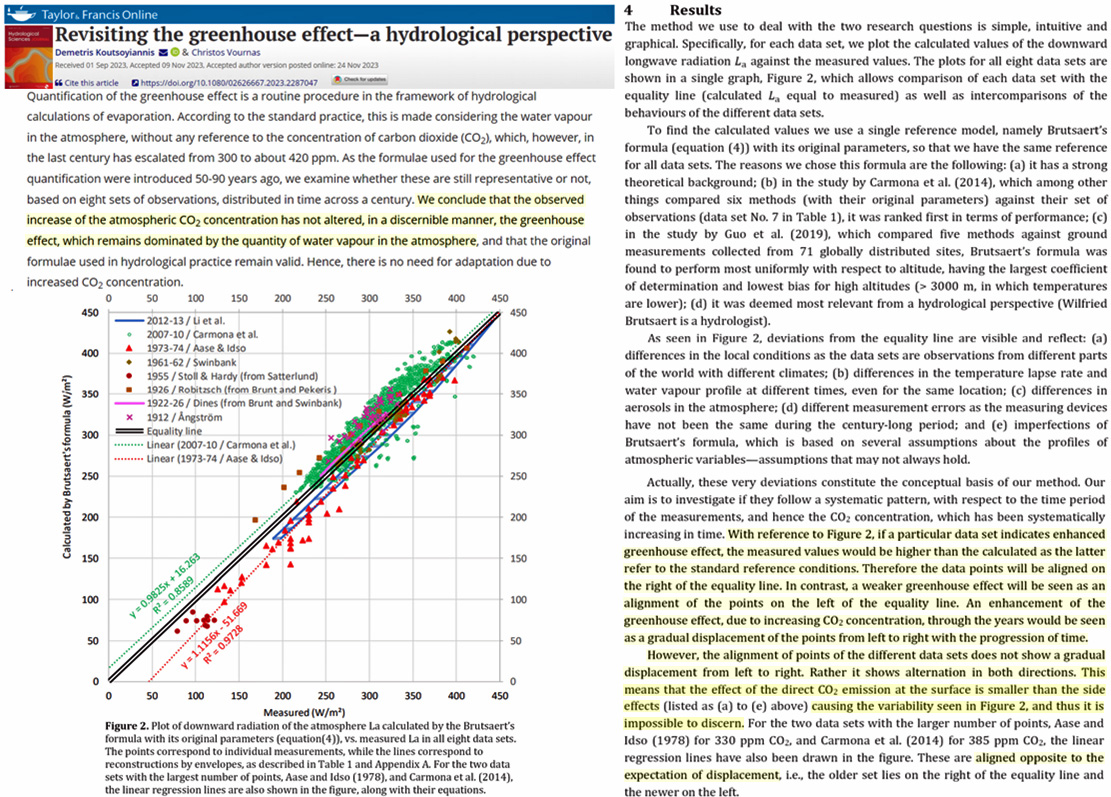
Koutsoyiannis and Vournas, 2023
An enhancement of the greenhouse effect, due to increasing CO2 concentration, through the years would be seen as a gradual displacement of the points from left to right with the progression of time. However, the alignment of the points of the different data sets does not show a gradual displacement from left to right. This means that the effect of the direct CO2 emission at the surface is smaller than the side effects…causing the variability in Figure 2, and thus it is impossible to discern. … Quantification of the greenhouse effect is a routine procedure in the framework of hydrological calculations of evaporation. According to the standard practice, this is made considering the water vapour in the atmosphere, without any reference to the concentration of carbon dioxide (CO2), which, however, in the last century has escalated from 300 to about 420 ppm. As the formulae used for the greenhouse effect quantification were introduced 50-90 years ago, we examine whether these are still representative or not, based on eight sets of observations, distributed in time across a century. We conclude that the observed increase of the atmospheric CO2 concentration has not altered, in a discernible manner, the greenhouse effect, which remains dominated by the quantity of water vapour in the atmosphere, and that the original formulae used in hydrological practice remain valid. Hence, there is no need for adaptation due to increased CO2 concentration.
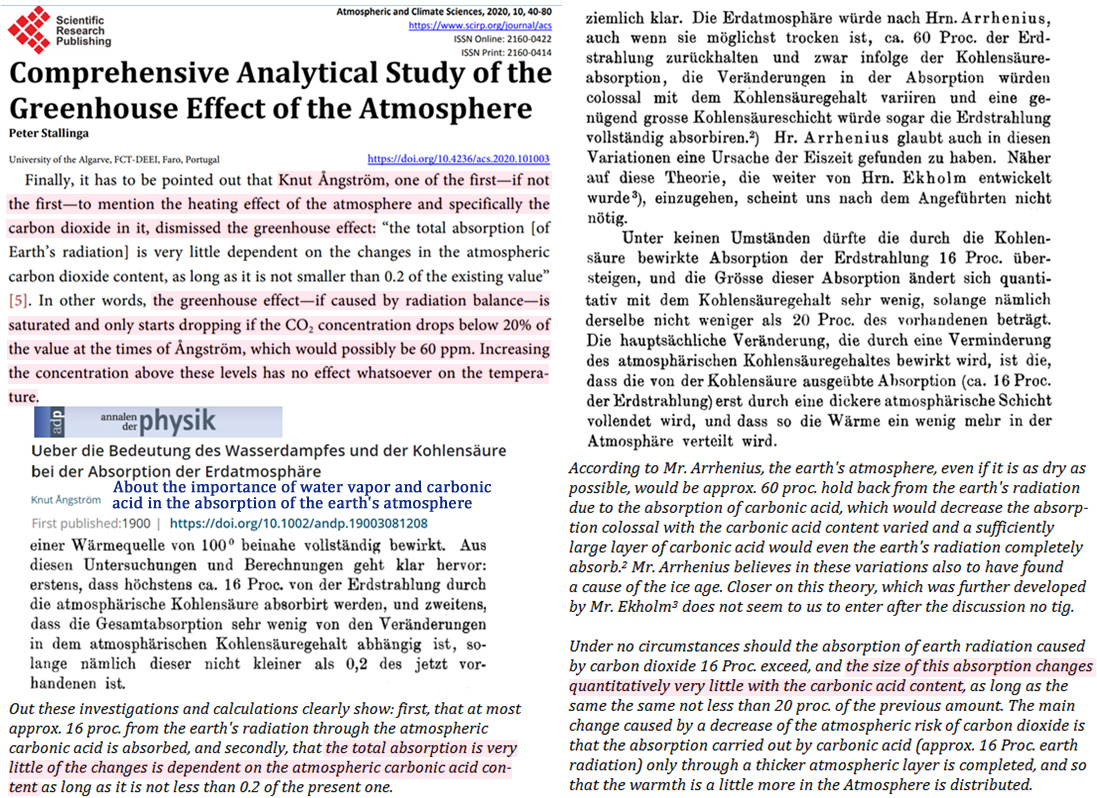
Ångström, 1900 as translated/interpreted in Stallinga, 2020
[T]he total absorption [of Earth’s radiation] is very little dependent on the changes in the atmospheric carbon dioxide content, as long as it is not smaller than 0.2 of the existing value.
Chillingar et al., 2009
Conventional theory of global warming states that heating of atmosphere occurs as a result of accumulation of CO2 and CH4 in atmosphere. The writers show that rising concentration of CO2should result in the cooling of climate. The methane accumulation has no essential effect on the Earth’s climate. Even significant releases of the anthropogenic carbon dioxide into the atmosphere do not change average parameters of the Earth’s heat regime and the atmospheric greenhouse effect. Moreover, CO2 concentration increase in the atmosphere results in rising agricultural productivity and improves the conditions for reforestation. Thus, accumulation of small additional amounts of carbon dioxide and methane in the atmosphere as a result of anthropogenic activities has practically no effect on the Earth’s climate.
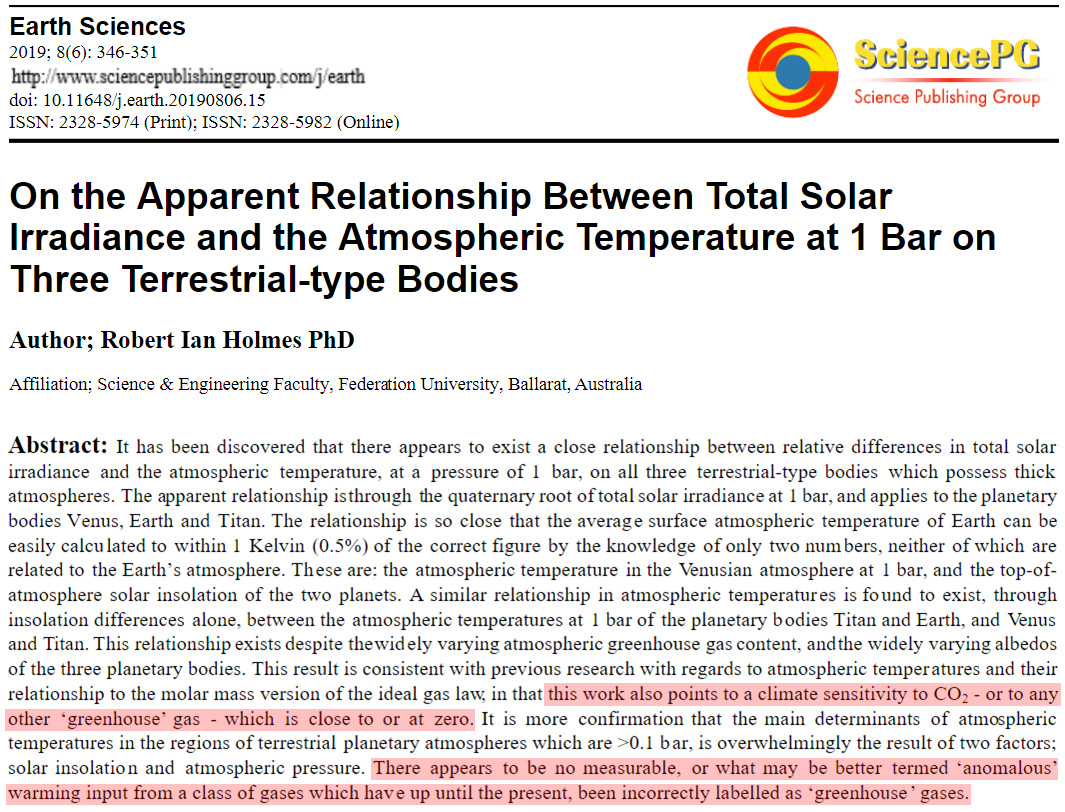
Holmes, 2019
The temperature at 1atm on Venus, divided by the fourth-root of the insolation difference to Earth, results in 289K – a value very close to Earth’s average surface temperature of 288K at 1atm. Yet Venus has a 96.5% ‘greenhouse gas’ atmosphere, compared to Earth’s at just 2.5%. It’s hard to imagine atmospheres with such a differing ‘greenhouse gas’ content, yet there still remain very strong similarities in the rate of the tropospheric thermal gradient and as seen here, in the relative insolation-adjusted temperatures at 1atm. These measurements, relationships and the similarity of the thermal gradients point strongly towards the existence of a universal physical law which governs planetary atmospheric temperatures – and one which does not take into account the relative ‘greenhouse gas’ contents; instead, this law clearly operates as if ‘greenhouse gases’ are not special. … If this relationship between TSI alone and planetary temperatures at 1 bar proves to be an enduring physical feature of atmospheric physics, it will have important implications for the very existence of the so-called ‘greenhouse effect’ as it has been proposed by the IPCC (intergovernmental panel on climate change) and others [15,19,21,22]. The data shows that the ‘greenhouse gas’ concentration varies widely from the low 2.7% and 2.5% [5,9,10,11] for Titan and Earth respectively, to the very high 96.5% for Venus; the implication must be that there cannot be any special warming effect from the so-called ‘greenhouse’ gases. This result adds and contributes to considerable other evidence [2,3,4,14,17,18,24,25,26,27,28,29], that there is no sign of any ‘greenhouse effect’ from ‘greenhouse’ gases on any of these three bodies.
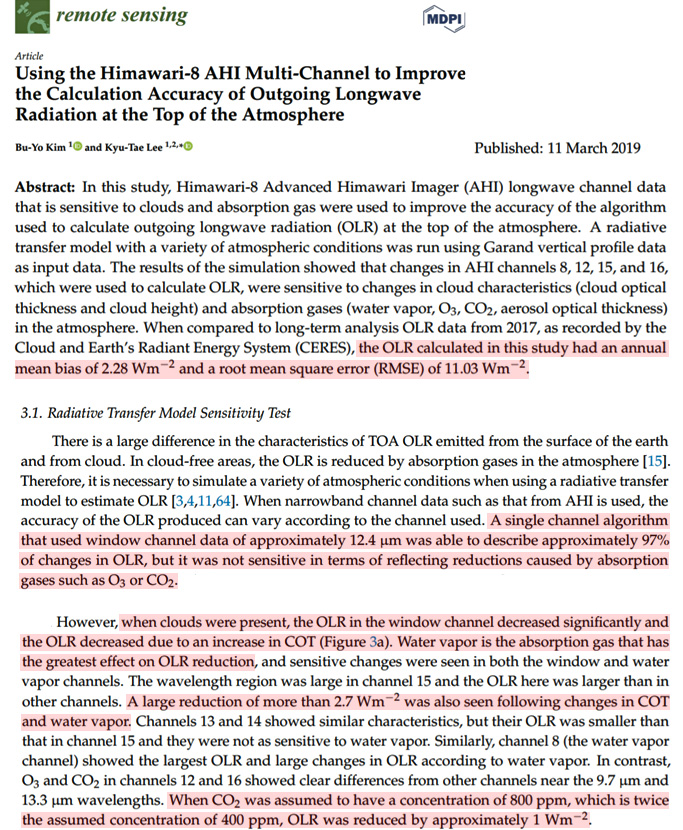
Kim and Lee, 2019
When compared to long-term analysis OLR [outgoing longwave radiation] data from 2017, as recorded by the Cloud and Earth’s Radiant Energy System (CERES), the OLR calculated in this study had an annual mean bias of 2.28 Wm−2 and a root mean square error (RMSE) of 11.03 Wm−2. … A single channel algorithm that used window channel data of approximately 12.4 µm was able to describe approximately 97% of changes in OLR, but it was not sensitive in terms of reflecting reductions caused by absorption gases such as O3 or CO2. … OLR increases in proportion to the earth’s surface and the atmospheric temperature in the overall longwave area. However, when clouds were present, the OLR in the window channel decreased significantly and the OLR decreased due to an increase in COT [cloud optical thickness] (Figure 3a). Water vapor is the absorption gas that has the greatest effect on OLR reduction, and sensitive changes were seen in both the window and water vapor channels. The wavelength region was large in channel 15 and the OLR here was larger than in other channels. A large reduction of more than 2.7 Wm−2 was also seen following changes in COT [cloud optical thickness] and water vapor. Channels 13 and 14 showed similar characteristics, but their OLR was smaller than that in channel 15 and they were not as sensitive to water vapor. Similarly, channel 8 (the water vapor channel) showed the largest OLR and large changes in OLR according to water vapor. In contrast, O3 and CO2 in channels 12 and 16 showed clear differences from other channels near the 9.7 µm and 13.3 µm wavelengths. When CO2 was assumed to have a concentration of 800 ppm, which is twice the assumed concentration of 400 ppm, OLR [outgoing longwave radiation] was reduced by approximately 1 Wm−2.
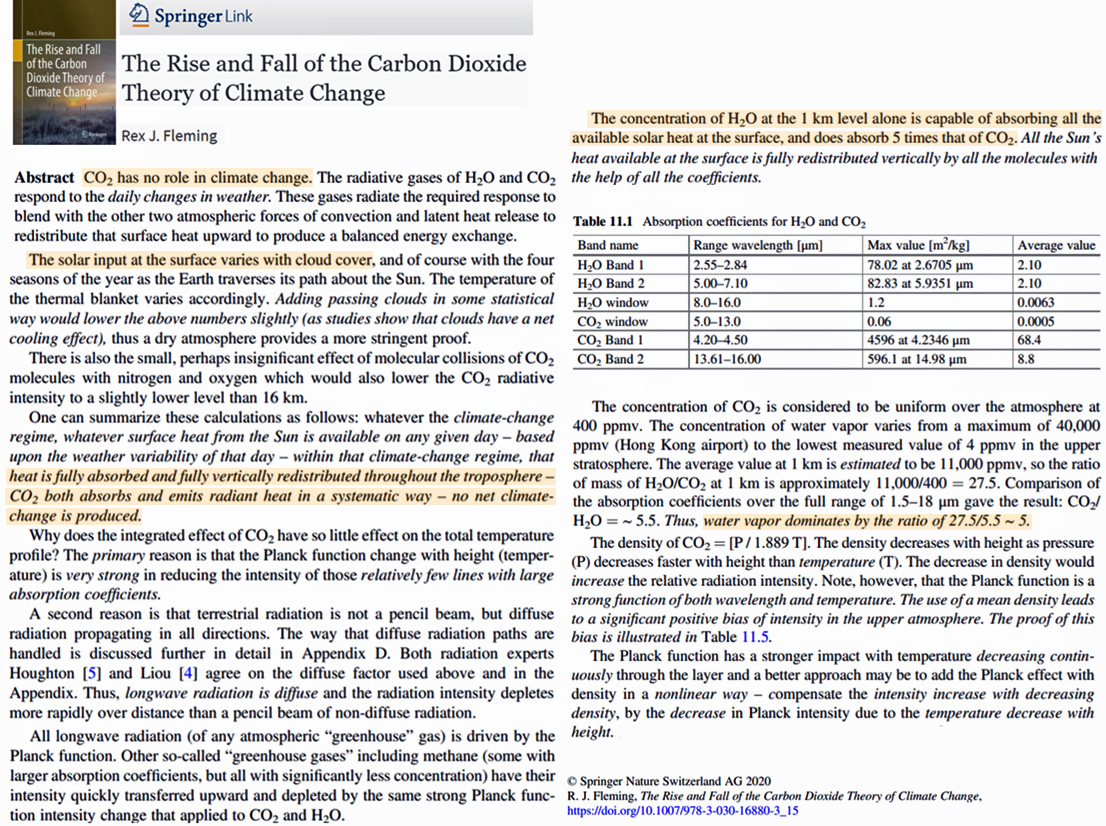
Fleming, 2019
CO2 has no role in climate change. The radiative gases of H2O and CO2 respond to the daily changes in weather. These gases radiate the required response to blend with the other two atmospheric forces of convection and latent heat release to redistribute that surface heat upward to produce a balanced energy exchange. … The summary of the observational evidence for CO2 causing climate-change has been performed for every observing period from geological historical records from 850 million years ago to modern measurements from balloons and satellites. The evidence shows that there was no correlation of CO2 values with temperature either in cold or warm climate-change regimes. The apparent correlation with the rise of CO2 during the Modern Warming was, in reality, a correlation with the Sun’s magnetic field/cosmic ray connection with the Modern Warming … One can summarize these calculations as follows: whatever the climate-change regime, whatever surface heat from the Sun is available on any given day – based upon the weather variability of that day – within that climate-change regime, that heat is fully absorbed and fully vertically redistributed throughout the troposphere – CO2 both absorbs and emits radiant heat in a systematic way – no net climate change is produced. Why does the integrated effect of CO2 have so little effect on the total temperature profile? The primary reason is that the Planck function change with height (temperature) is very strong in reducing the intensity of those relatively few lines with large absorption coefficients.
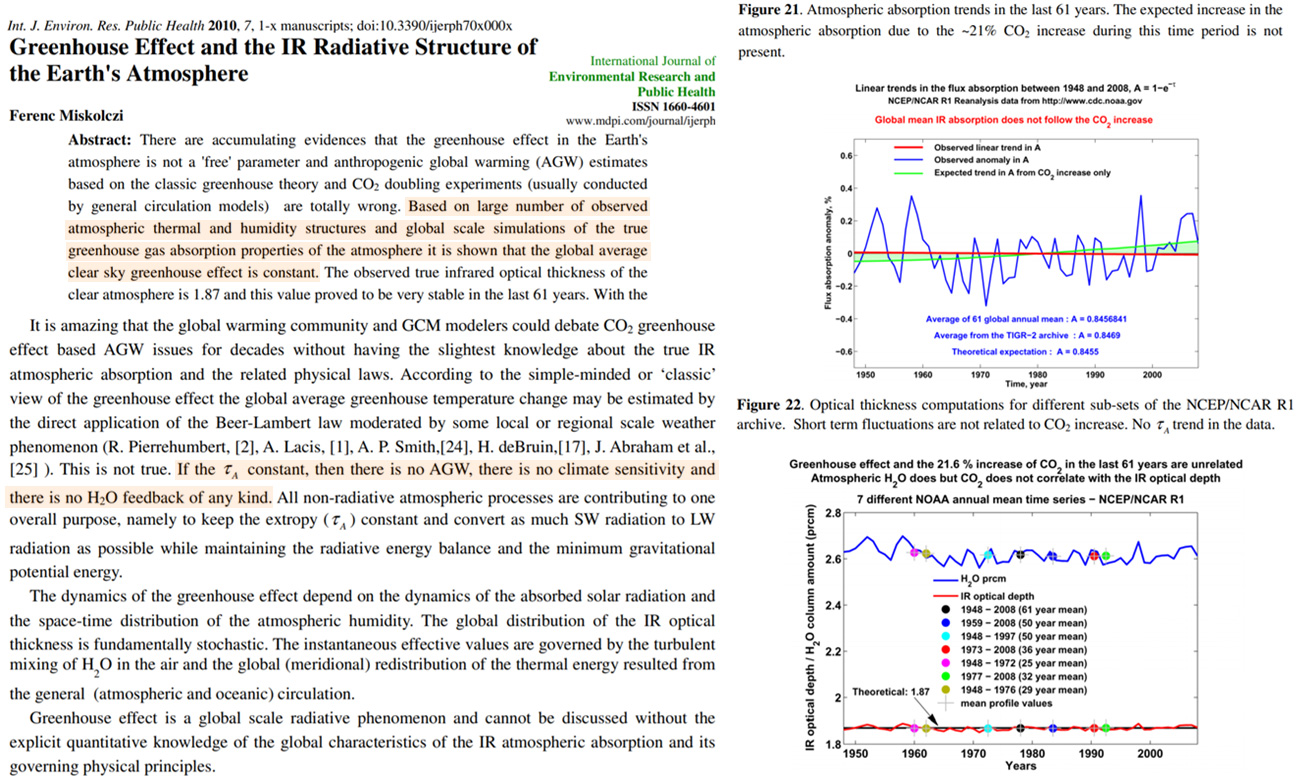
Miskolczi, 2010
There are accumulating evidences that the greenhouse effect in the Earth’s atmosphere is not a ‘free’ parameter and anthropogenic global warming (AGW) estimates based on the classic greenhouse theory and CO2 doubling experiments (usually conducted by general circulation models) are totally wrong. Based on large number of observed atmospheric thermal and humidity structures and global scale simulations of the true greenhouse gas absorption properties of the atmosphere it is shown that the global average clear sky greenhouse effect is constant. The observed true infrared optical thickness of the clear atmosphere is 1.87 and this value proved to be very stable in the last 61 years. With the help of the observed relationships among the radiative flux components and the association of those relationships with known fundamental physical laws new structural equations of the global radiation field were established. The theoretically predicted IR optical thickness is fully consistent with, and supporting the observed value of 1.87.
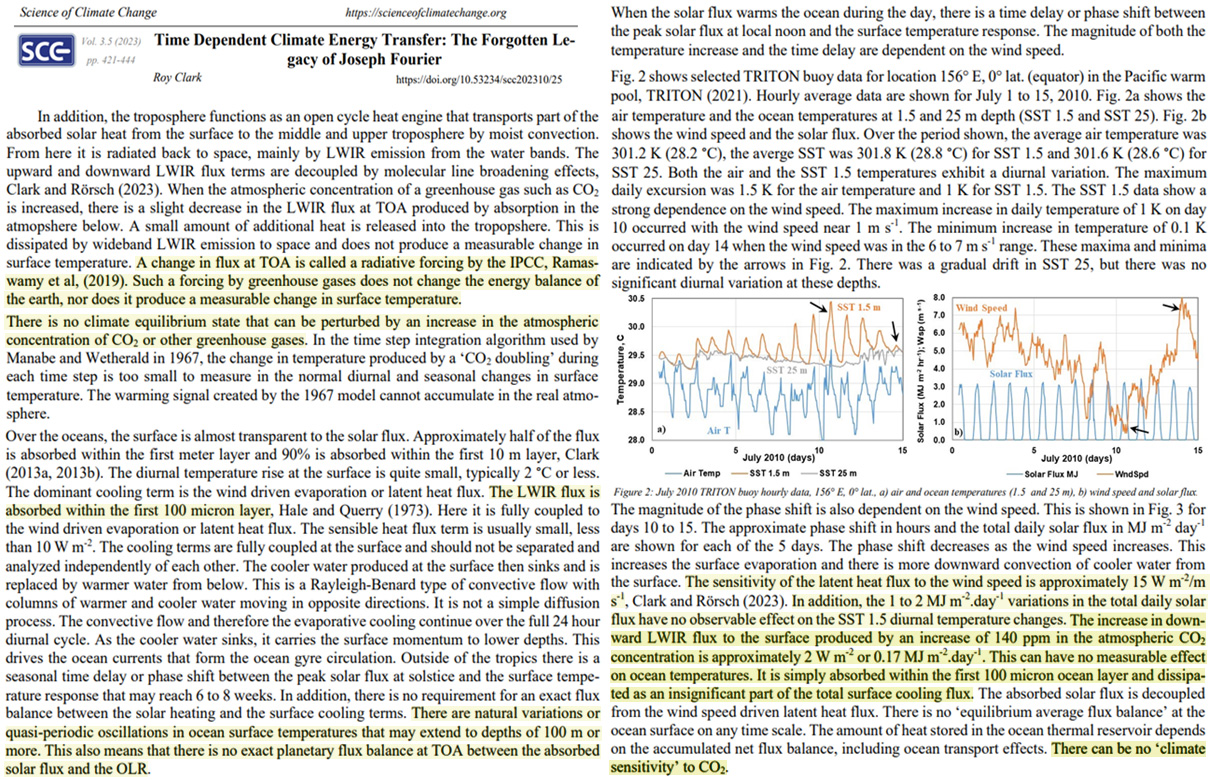
Clark, 2023
The increase in downward LWIR flux to the surface produced by an increase of 140 ppm in the atmospheric CO2 concentration is approximately 2 W m-2 or 0.17 MJ m-2 day-1. This can have no measurable effect on ocean temperatures. It is simply absorbed within the first 100 micron ocean layer and dissipated as an insignificant part of the total surface cooling flux. The absorbed solar flux is decoupled from the wind speed driven latent heat flux. There is no ‘equilibrium average flux balance’ at the ocean surface on any time scale. The amount of heat stored in the ocean thermal reservoir depends on the accumulated net flux balance, including ocean transport effects. … There can be no ‘climate sensitivity’ to CO2. … There can be no climate equilibrium state that can be perturbed by an increase in the atmospheric concentration of CO2 … CO2 can have no measurable effect on ocean temperatures.
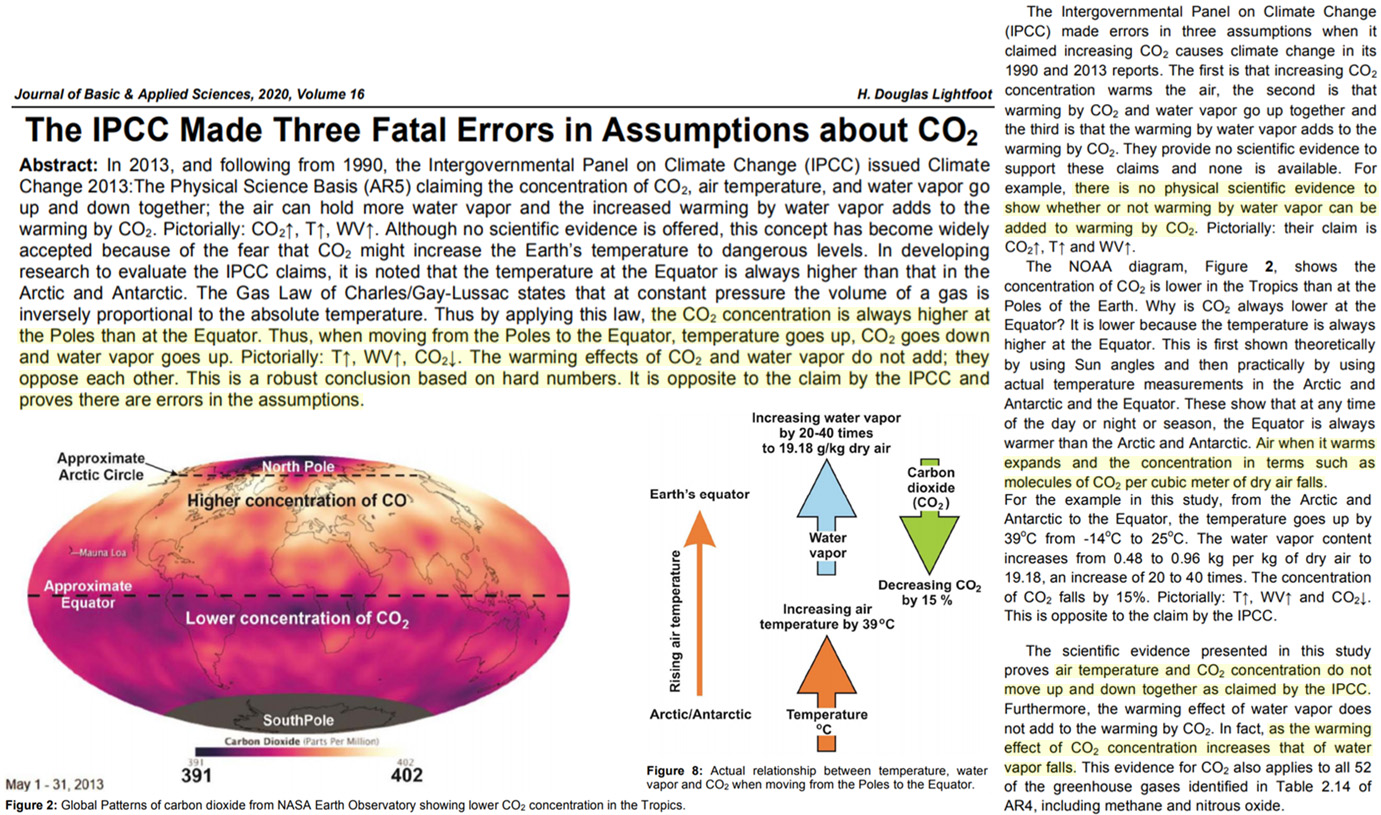
Lightfoot, 2020
In 2013, and following from 1990, the Intergovernmental Panel on Climate Change (IPCC) issued Climate Change 2013:The Physical Science Basis (AR5) claiming the concentration of CO2, air temperature, and water vapor go up and down together; the air can hold more water vapor and the increased warming by water vapor adds to the warming by CO2. Pictorially: CO2↑, T↑, WV↑. Although no scientific evidence is offered, this concept has become widely accepted because of the fear that CO2 might increase the Earth’s temperature to dangerous levels. In developing research to evaluate the IPCC claims, it is noted that the temperature at the Equator is always higher than that in the Arctic and Antarctic. The Gas Law of Charles/Gay-Lussac states that at constant pressure the volume of a gas is inversely proportional to the absolute temperature. Thus by applying this law, the CO2 concentration is always higher at the Poles than at the Equator. Thus, when moving from the Poles to the Equator, temperature goes up, CO2 goes down and water vapor goes up. Pictorially: T↑, WV↑, CO2↓. The warming effects of CO2 and water vapor do not add; they oppose each other. This is a robust conclusion based on hard numbers. It is opposite to the claim by the IPCC and proves there are errors in the assumptions.
Van Brunt, 2020
When compared to the average annual global temperature record from 1880, no published climate model posited on the assumption that the increasing concentration of atmospheric carbon dioxide is the driver of climate change can accurately replicate the significant variability in the annual temperature record. Therefore, new principles of atmospheric physics are developed for determining changes in the average annual global temperature based on changes in the average atmospheric concentration of water vapor. These new principles prove that: 1) Changes in average global temperature are not driven by changes in the concentration of carbon dioxide; 2) Instead, autonomous changes in the concentration of water vapor, ∆TPW, drive changes in water vapor heating, thus, the average global temperature, ∆TAvg, in accordance with this principle, Avg ∆ =∆ T 0.4 TPW the average accuracy of which is ±0.14%, when compared to the variable annual, 1880-2019, temperature record.
Kramm et al., 2017
The planetary radiation balance plays a prominent role in quantifying the effect of the terrestrial atmosphere (spuriously called the atmospheric greenhouse effect). Based on this planetary radiation balance, the effective radiation temperature of the Earth in the absence of its atmosphere of Te ≅ 255 K is estimated. This temperature value is subtracted from the globally averaged near-surface temperature of about ⟨Tns⟩ ≅ 288 K resulting in ⟨Tns⟩ − Te ≅ 33 K. This temperature difference commonly serves to quantify the atmospheric effect. The temperature difference is said to be bridged by optically active gaseous gases, namely H2O (20.6 K); CO2 (7.2 K); N2O (1.4 K);CH4 (0.8 K); O3 (2.4 K); NH3+freons+NO2+CCl4+O2+N2NH3+freons+NO2+CCl4+O2+N2 (0.8 K) (e.g. Kondratyev and Moskalenko, 1984).
(Equation 1.4) [the 288 K – 255 K = 33 K so-called greenhouse effect] is based on physically irrelevant assumptions and its results considerably disagree with observations. Consequently, the difference of ΔTae ≅ 33 K [the alleged planetary temperature difference with the greenhouse effect] lacks adequate physical meaning as do any contributions from optically active gaseous components calculated thereby.
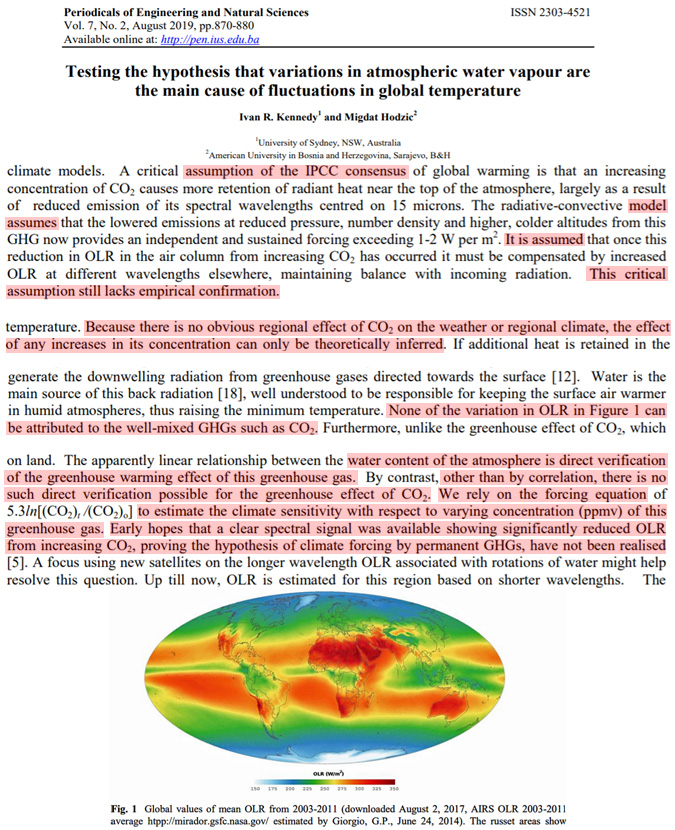
Kennedy and Hodzic, 2019
A critical assumption of the IPCC consensus of global warming is that an increasing concentration of CO2 causes more retention of radiant heat near the top of the atmosphere, largely as a result of reduced emission of its spectral wavelengths centred on 15 microns. The radiative-convective model assumes that the lowered emissions at reduced pressure, number density and higher, colder altitudes from this GHG now provides an independent and sustained forcing exceeding 1-2 W per m2. It is assumed that once this reduction in OLR in the air column from increasing CO2 has occurred it must be compensated by increased OLR at different wavelengths elsewhere, maintaining balance with incoming radiation. This critical assumption still lacks empirical confirmation. … Water is the main source of this back radiation [18], well understood to be responsible for keeping the surface air warmer in humid atmospheres, thus raising the minimum temperature. None of the variation in OLR in Figure 1 can be attributed to the well-mixed GHGs such as CO2. Furthermore, unlike the greenhouse effect of CO2, which is regarded as increasing only in in a logarithmic manner as its concentration rises, the greenhouse effect of water on retaining heat in the atmosphere should vary more linearly, even in the case of absorption of surface radiation, as its vapour spreads into dryer atmospheres. … Because there is no obvious regional effect of CO2 on the weather or regional climate, the effect of any increases in its concentration can only be theoretically inferred. … The apparently linear relationship between the water content of the atmosphere is direct verification of the greenhouse warming effect of this greenhouse gas. By contrast, other than by correlation, there is no such direct verification possible for the greenhouse effect of CO2. We rely on the forcing equation of 5.3ln[(CO2)t /(CO2)o] to estimate the climate sensitivity with respect to varying concentration (ppmv) of this greenhouse gas. Early hopes that a clear spectral signal was available showing significantly reduced OLR from increasing CO2, proving the hypothesis of climate forcing by permanent GHGs, have not been realised [5]. A focus using new satellites on the longer wavelength OLR associated with rotations of water might help resolve this question.
Gervais, 2014
The anthropogenic CO2 additional warming extrapolated in 2100 is found lower than 0.1°C in the absence of feedbacks. The global temperature data are fitted with an oscillation of period 60 years added to a linear contribution. The data which support the 60-year cycle are summarized, in particular sea surface temperatures and sea level rise measured either by tide gauge or by satellite altimetry. The tiny anthropogenic warming appears consistent with the absence of any detectable change of slope of the 130-year-long linear contribution to the temperature data before and after the onset of large CO2 emissions.
Manheimer, 2016
[T]he actual data show that up to now fears of imminent climate catastrophe are not supported by data, or else involve processes occurring since long before excess CO2 in the atmosphere became a concern. Based on actual measurements and reasonable extrapolation of them, there is no reason why the responsible use of fossil fuel cannot continue to support worldwide civilisation. The argument to greatly restrict fossil fuel rests entirely on the theoretical assertion that at some point in the near future there will be a sudden and dramatic change in the very nature of the data presented here. If implemented, these would be sufficient to greatly upset the lifestyle of billions of people, and to further impoverish the already most impoverished parts of the world. … [N]othing in the past suggests that future climate will be significantly different before mid century because of rising levels of CO2.
Soares, 2010
A weak dominance of temperature changes precedence, relative to CO2 changes, indicate that the main effect is the CO2 increase in the atmosphere due to temperature rising. Decreasing temperature is not followed by CO2 decrease, which indicates a different route for the CO2 capture by the oceans, not by gas re-absorption. Monthly changes have no correspondence as would be expected if the warming was an important absorption-radiation effect of the CO2 increase. The anthropogenic wasting of fossil fuel CO2 to the atmosphere shows no relation with the temperature changes even in an annual basis. The absence of immediate relation between CO2 and temperature is evidence that rising its mix ratio in the atmosphere will not imply more absorption and time residence of energy over the Earth surface. This is explained because band absorption is nearly all done with historic CO2 values.
Möller, 1963
The numerical value of a temperature change under the influence of a CO2 change as calculated by Plass is valid only for a dry atmosphere. Overlapping of the absorption bands of CO2 and H2O in the range around 15 μ essentially diminishes the temperature changes. New calculations give ΔT [temperature] = + 1.5° when the CO2 content increases from 300 to 600 ppm. Cloudiness diminishes the radiation effects but not the temperature changes because under cloudy skies larger temperature changes are needed in order to compensate for an equal change in the downward long-wave radiation. The increase in the water vapor content of the atmosphere with rising temperature causes a self-amplification effect which results in almost arbitrary temperature changes, e.g. for constant relative humidity ΔT = +10° in the above mentioned case. It is shown, however, that the changed radiation conditions are not necessarily compensated for by a temperature change. The effect of an increase in CO2 from 300 to 330 ppm can be compensated for completely by a change in the water vapor content of 3 per cent or by a change in the cloudiness of 1 per cent of its value without the occurrence of temperature changes at all. Thus the theory that climatic variations are affected by variations in the CO2 content becomes very questionable.
Lightfoot and Mamer, 2017
Robust scientific evidence shows the sun angle controls water vapour content of the atmosphere, the main component of back radiation, as it cycles annually. Water vapour content measured as the ratio of the number of water molecules to CO2 molecules varies from 1:1 near the Poles to 97:1 in the Tropics. The effect of back radiation [water vapour] on Earth’s atmosphere is up to 200 times larger than that of CO2 and works in the opposite direction. Thus, if CO2 has any effect on atmospheric temperature and climate change we show it is negligible. Consequently, current government policies to control atmospheric temperature by limiting consumption of fossil fuels will have negligible effect. Measured data reported in IPCC report Climate Change 2013: The Physical Science Basis (AR5) indicate increased water vapour content of the atmosphere is the cause of the 0.5℃ temperature increase from the mid-1970s to 2011.
Singer, 2006
Consistency or lack thereof between observed temperature trends and those predicted by Global Circulation Models (GCMs) are a contentious though important issue. The lack of consistency between observed and modeled temperature trends has frequently been used to argue against a significant human contribution to global warming – and vice versa. We present here additional and independent evidence that there is no agreement between observed and modeled warming trends in the tropical troposphere during the last two decades of the 20th century. This finding is shown to put constraints on surface trend and Climate Sensitivity, limiting them to values close to zero.
Willett, 1974
W.J. Humphreys, (1940, pp. 585-6), and outstanding meteorological physicist, after careful consideration of CO2 absorption and the water vapor absorption spectrum, concludes that “either doubling or halving the present amount of carbon dioxide could alter but little the total amount of radiation actually absorbed by the atmosphere, and, therefore, seemingly, could not appreciably change the average temperature of the earth, or be at all effective in the production of marked climatic changes.”
In view of the mere 7% observed increase of CO2, of the conclusion of Humphreys quoted above and of the work of the numerous authorities quoted by him, the author is convinced that recent increases of atmospheric carbon dioxide have contributed much less than 5% of the recent changes of atmospheric temperature, and will contribute no more than that in the foreseeable future. Furthermore, the carbon dioxide hypothesis for the upward trend of northern hemispheric temperature from 1920-50 does not at all account for the fact that this trend terminated in higher middle latitudes before it even started in subtropical latitudes, where it peaked long after it terminated in high latitudes.
Kubicki et al., 2020
[T]here is the conviction, that based on the formula (2) derived in paper [5], the increase of the concentration of absorbing gas in the air, regardless of its initial state, will cause strong increase of the absorption of the infrared radiation of continuous spectrum. Meanwhile, the experimental results obtained in this work, disprove this general theorem while it is the main basis for introducing restrictions on entities responsible for CO2 emissions. … [T]he most important conclusion is that, unlike during the measurements in the laboratory, the additional layer of CO2 with thickness of 50 cm at atmospheric pressure, placed on the Earth’s surface, does not noticeably reduce the infrared radiation flux from the Moon.
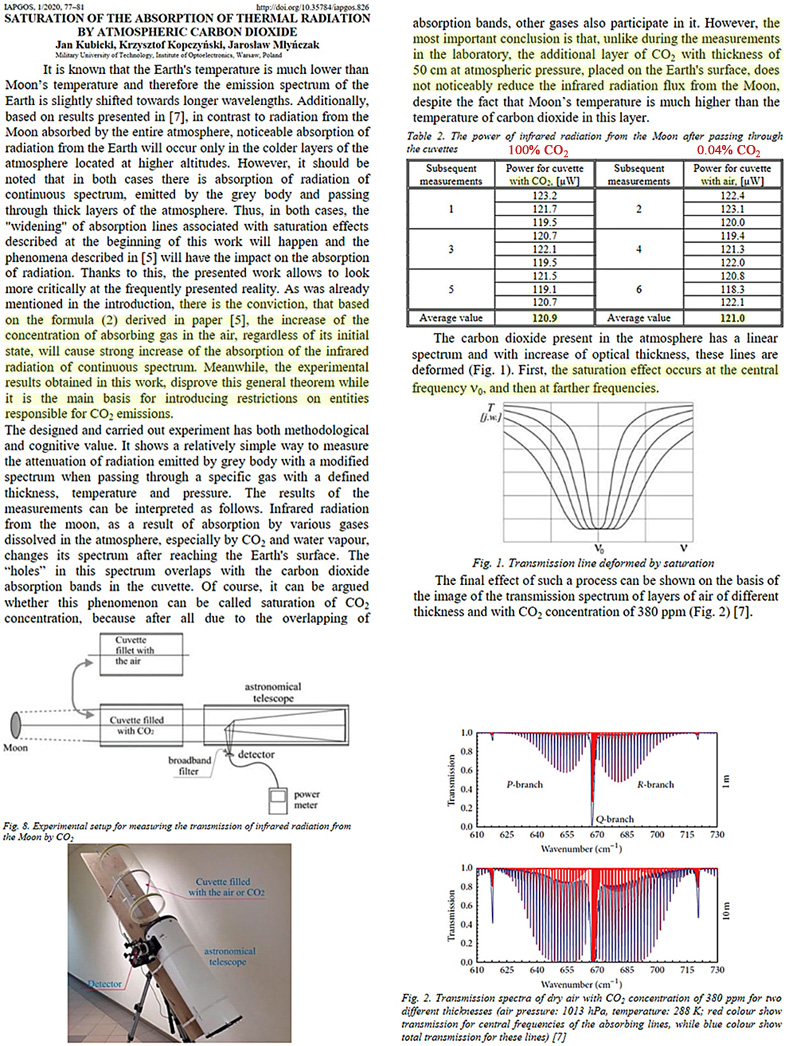
Kubicki et al., 2022
[T]he experiment described in articles [5] an [6] was carried out, where it was shown that thermal radiation from the hot surface of the Moon, after passing through the Earth’s atmosphere, is not absorbed in carbon dioxide. Thus, it was shown for this radiation there is a complete saturation of the process. … It can be seen that practically with the mass of carbon dioxide of about 1.5 kg/m², the process of absorption of thermal radiation goes into saturation… So, for the current concentration of 400 ppm for which the mass of CO2 in the atmosphere is ~6 kg/m², the limit is four times exceeded. … Thus, it can be presumed that the carbon dioxide additionally emitted into the atmosphere does not absorb thermal radiation and thus is not a greenhouse gas.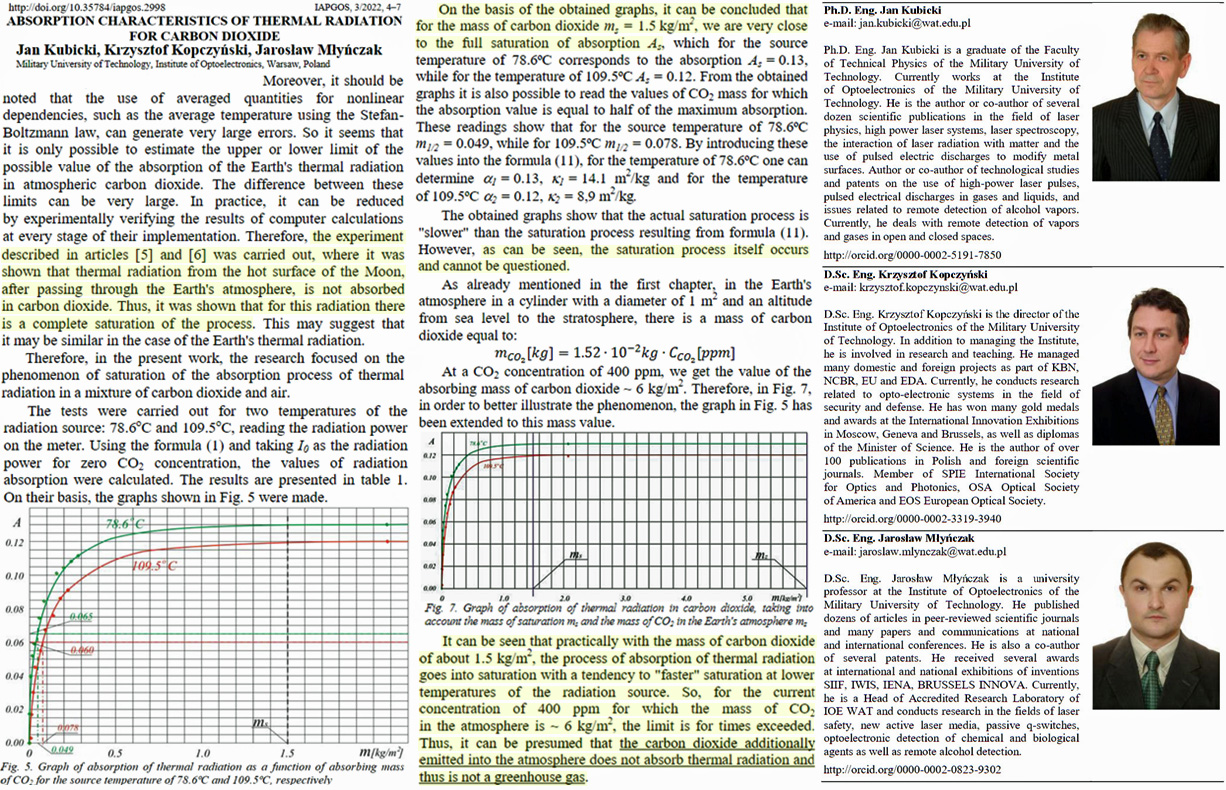
Kubicki et al., 2024
From the conducted considerations, it follows that both in Eq. (4) and Eq. (6), the value of absorption is limited. In the first case, it cannot exceed 1, and in the second case, it cannot exceed the value of ψ less than unity. Therefore, for a sufficiently large mass m, saturation must occur, and further increase in mass will result in a negligible increase in absorption. … Schack (1972)…demonstrated that for a concentration of 0.03% of carbon dioxide in the air, the absorption process in the troposphere is saturated. … This unequivocally suggests that the officially presented impact of anthropogenic CO2 increase on Earth’s climate is merely a hypothesis rather than a substantiated fact.
Miatello, 2012
In an isolated global atmospheric system as that of Earth, in hydrostatic equilibrium in the cosmic vacuum, heat is transmitted only in accordance with the laws of thermodynamics, the thermal and conductive properties of different components, such as ocean waters, soils, and atmospheric gases, and the atmospheric adiabatic gradient. The same conditions apply to planets having huge atmospheric masses, such as Venus, Jupiter, and Saturn, whose surfaces and/or cores are heated only by a Kelvin-Helmholtz mechanism, gravitational compression of gases, according to their mass/density, as well as the impedance of their opaque atmospheres to solar radiation. In the case of Earth’s atmosphere with relatively high rarefaction and transparency and an active water cycle, which does not exist on Venus, Saturn, or Jupiter, the main factors influencing heat transfer are irradiance related to solar cycles and the water cycle, including evaporation, rain, snow, and ice, that regulates alteration of the atmospheric gradient from dry to humid. Therefore, the so-called “greenhouse effect” and pseudo-mechanisms, such as “backradiation,” have no scientific basis and are contradicted by all laws of physics and thermodynamics, including calorimetry, yields of atmospheric gases’ thermodynamic cycles, entropy, heat flows to the Earth’s surface, wave mechanics, and the 1st and 2nd laws of thermodynamics.
Varotsos and Efstathiou, 2019
The enhancement of the atmospheric greenhouse effect due to the increase in the atmospheric greenhouse gases is often considered as responsible for global warming (known as greenhouse hypothesis of global warming). In this context, the temperature field of global troposphere and lower stratosphere over the period 12/1978–07/2018 is explored using the recent Version 6 of the UAH MSU/AMSU global satellite temperature dataset. Our analysis did not show a consistent warming with gradual increase from low to high latitudes in both hemispheres, as it should be from the global warming theory. … Based on these results and bearing in mind that the climate system is complicated and complex with the existing uncertainties in the climate predictions, it is not possible to reliably support the view of the presence of global warming in the sense of an enhanced greenhouse effect due to human activities.
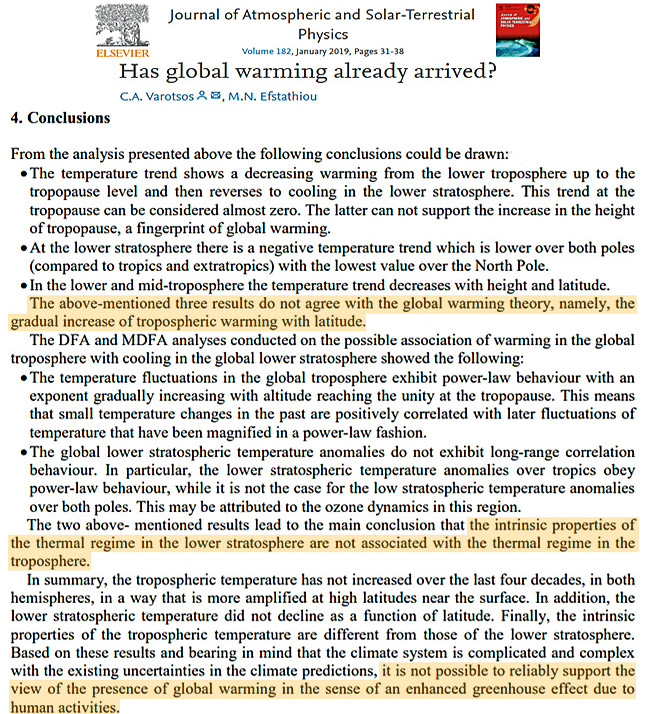
Sagan and Mullen, 1972
[W]e find a serious discrepancy between theory and observation. … A decline in the global temperature of Earth is likely to increase rather than decrease the albedo, but in any case the albedo decline required to explain the discrepancy appears to be out of the question. Indeed, detailed global climate models suggest that a relative increase in [albedo] of only 2 percent is enough to induce extensive glaciation on Earth, which implies that the present climate is extremely sensitive to albedo. This leaves changes in atmospheric composition as a possible explanation [for climate changes]. Major variations in the CO2 abundance will have only minor greenhouse effects because the strongest bands are nearly saturated. A change the present CO2 abundance by a factor of 2 will produce directly a 2° variation in surface temperature. The CO2 abundance is highly controlled by silicate-carbonate equilibria; by buffering with seawater, which contains about 100 times the atmospheric CO2; and by the respiration and photosynthesis feedback loop. The negative exponential dependence of the vapor pressure of water on reciprocal temperature implies that for a lower global temperature there is no likelihood of gaining more water vapor than the contemporary global average, about 1 g cm-2. The only surviving alternative appears to be that the atmosphere of Earth 1 or 2 aeons ago contained some constituent or constituents, not now present, with significant absorption in the middle infrared, in the vicinity of the Wien peak of Earth’s thermal emission.
Lightfoot and Mamer, 2018
Back radiation acts opposite to that of CO2, methane and the trace gases. On average, the latter account for 1.2% of back radiation and water vapor accounts for 98.8%. The effect of CO2, methane and the trace gases on atmospheric temperature and climate change is so small as to be negligible.
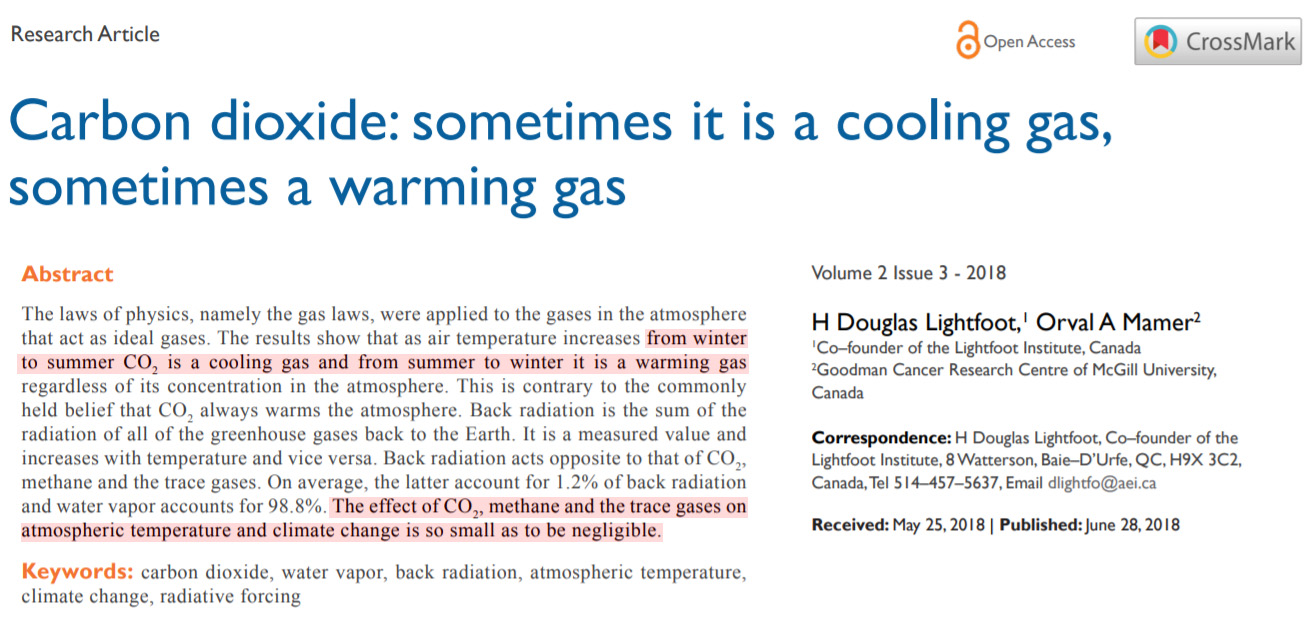
Robertson and Chilingar, 2017
The anthropogenic impact on global atmospheric temperatures is negligible, i.e., 5%. … From the above estimates, one can conclude that even significant releases of anthropogenic carbon dioxide into the Earth’s atmosphere practically do not change average parameters of the Earth’s heat regime.
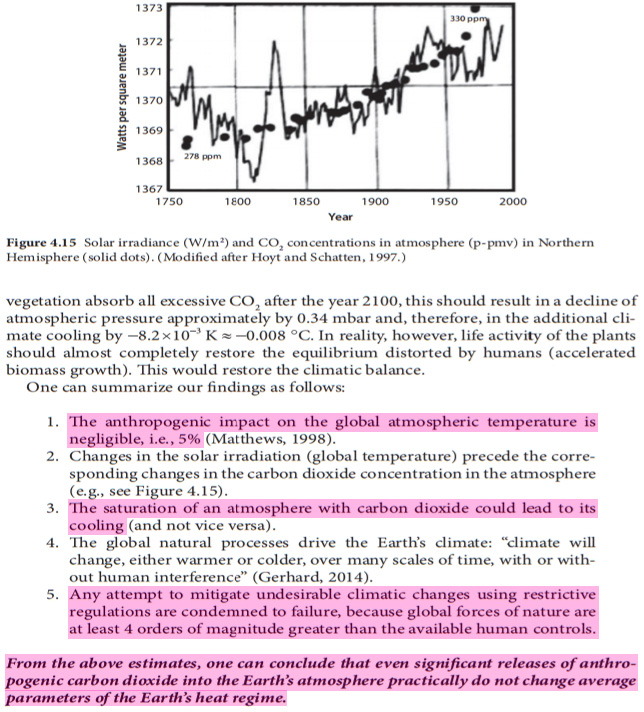
Stallinga, 2023
We study the concepts of residence time vs. adjustment time time for carbon dioxide in the atmosphere. The system is analyzed with a two-box first-order model. Using this model, we reach three important conclusions: (1) The adjustment time is never larger than the residence time and can, thus, not be longer than about 5 years. (2) The idea of the atmosphere being stable at 280 ppm in pre-industrial times is untenable. (3) Nearly 90% of all anthropogenic carbon dioxide has already been removed from the atmosphere. … [T]he residence time of carbon atoms in the atmosphere is of the order of 10 years. Such a short time would undermine the prime tenet of AGW, since a molecule of CO2 would not have the time to contribute to any greenhouse effect before it disappears to sinks where it cannot do any thermal harm. … [I]f the residence time is below 30 years (the climate window), injections of CO2 in the atmosphere would, just like water, not affect the climate.
Emrén, 2023
The observed correlation between global temperature and rate of growth in atmospheric CO2 concentration shows that the global warming is not caused by increased CO2 concentration. Rather the increase in CO2 concentration is caused by the global warming. This in turn means that neither the increase in CO2 concentration nor global warming can be stopped by reducing combustion. …the rate of change in CO2 concentration is controlled, not by emissions, but by the global temperature.
Hamilton, 2023
Incidents deemed examples of “climate change” such as forest fires, cyclones, floods, droughts, rising sea levels, coral bleaching, or variations polar ice coverage have no direct link with coal. They are all the result of variations in temperature. Coal is seen as a major contributor to the growth of carbon dioxide in the Earth’s atmosphere and, as carbon dioxide is a greenhouse gas which contributes to keeping the planet warm, the growing use of coal is blamed as a primary cause for the rise in global temperatures since the start of the Industrial Age around 1850. This chapter discusses various scientific facts which show that this supposed causal link between increasing levels of carbon dioxide and growing temperature is not correct at the current levels of atmospheric carbon dioxide. Furthermore, history has shown that the cyclic behavior in temperature over the past 170 years, over the past 10,000 years of the current Holocene interglacial, or over the millions of years of geological time, is not due to any such behavior of atmospheric carbon dioxide. The evidence shows that current rise in temperature is simply the result of a repeat of the millennial warm period cycle and thus has nothing to do with the use of coal.
Koutsoyiannis et al., 2023
The mainstream assumption of the causality direction [CO2] → T makes a compelling narrative, as everything is blamed on a single cause, the human CO2 emissions. Indeed, this has been the popular narrative for decades. However, popularity does not necessarily mean correctness, and here we have provided strong arguments against this assumption. … Clearly the results […] suggest a (mono-directional) potentially causal system with T as the cause and [CO₂] as the effect. Hence the common perception that increasing [CO₂] causes increased T can be excluded as it violates the necessary condition for this causality direction. … All evidence resulting from the analyses suggests a unidirectional, potentially causal link with T [temperature] as the cause and [CO₂] as the effect.
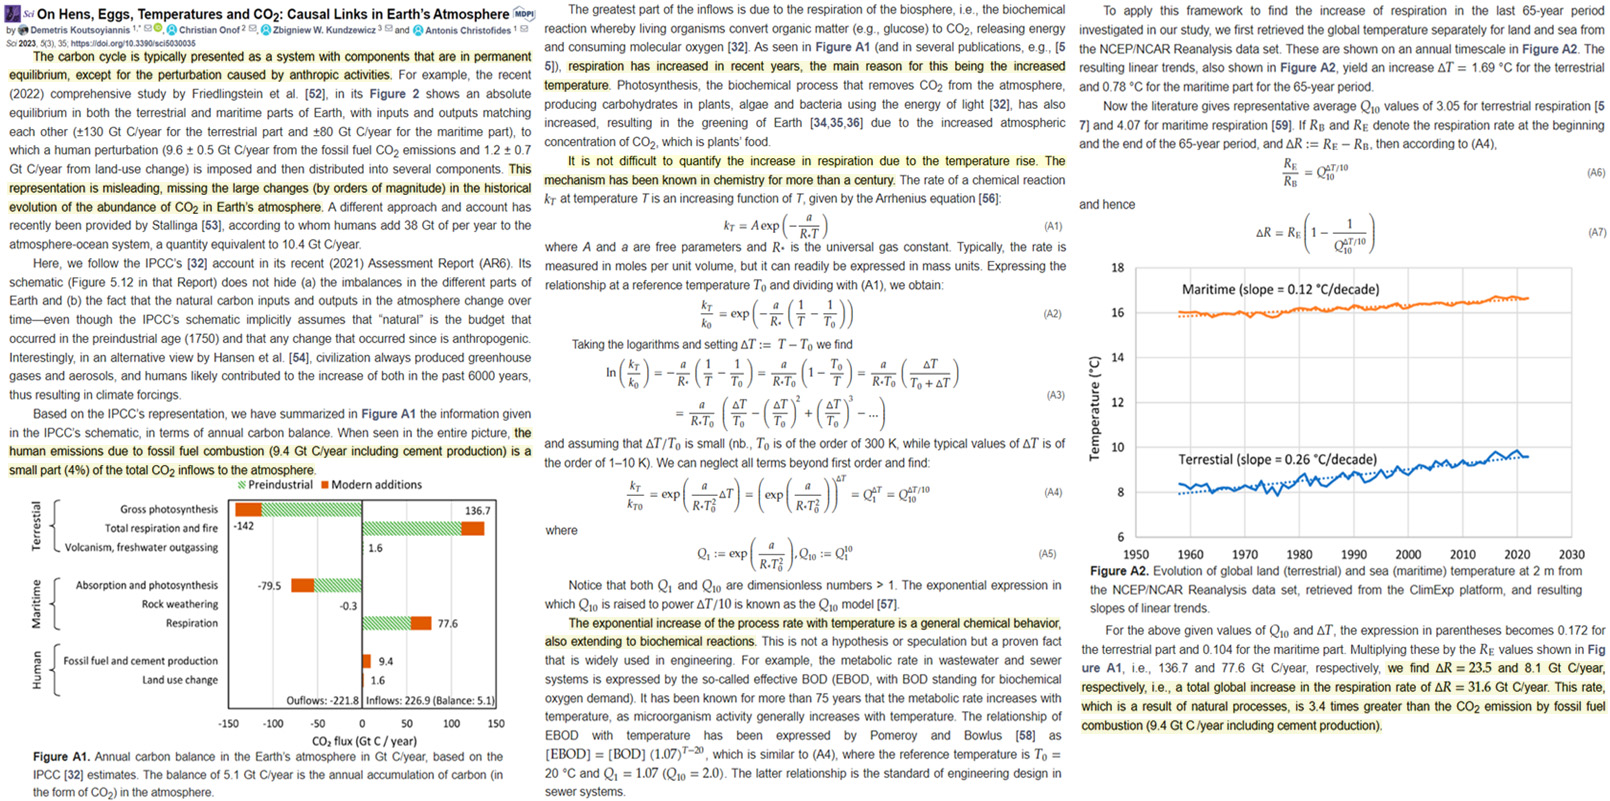
[M]ass extinctions occur on average 4.08 Myr following peaks in atmospheric CO2 concentration … These results collectively require rejection of the hypothesis that long-term (Myr timescale) global temperature change caused extinction of biodiversity across the most highly resolved portion of the fossil record, the last 210 Myr. Prior to the bolide impact that formed the Chicxulub crater ∼66 Mya, long-term global temperature increased monotonically by ∼3°C from 86 to 64 Mya (Figure 15). This increase in global temperature was accompanied by a decrease in the concentration of CO2 in the atmosphere, from a high of 772 ppmv to a low of 291 ppmv (Figure 15). Atmospheric CO2 and temperature appear negatively correlated over this time period, as reported previously for ∼10% of time segments of the Phanerozoic Eon (W. J. Davis, 2017) and as confirmed below. The apparent negative correlation between atmospheric CO2 concentration and global temperature (Figure 15) is confirmed by calculation of the corresponding Pearson correlation coefficient. To compute this correlation coefficient, temperature was interpolated between datapoints in the temperature curve (Figure 15) to the times of datapoints in the CO2 record. The correlation between atmospheric CO2 concentration and interpolated global temperature proxies is discernible and negative (r = −0.76, n = 8, p = 0.01).
Oliver, 1976
A period of several decades existed (~1915-1945) in which volcanic activity was unusually light and, as mentioned earlier, the temperatures were higher than the preceding [1880s to 1910s] or, in fact, the subsequent (current) [1960s-1970s] period. … Numerous possible causes of climate change have been discussed in the literature, including both anthropogenic and natural factors. Two principal anthropogenic sources are often considered: changes in atmospheric carbon dioxide and changes in tropospheric dust. … The possible effects due to changes in CO2 are perhaps most readily subject to analysis, for good data do exist on atmospheric CO2 and its increase over recent decades. Thus, according to Reitan (1971), based on calculations by Manabe and Wetherald (1967), the increase in CO2 between the 1880’s and the 1960’s could have caused a mean temperature increase of 0.3°C. Unfortunately, however, such computations are based on assumptions of constant cloudiness, and possible changes in cloud cover are exceedingly important. Manabe and Wetherland (1967) show, for example, that a 1% increase in low cloudiness would cause an 0.8°C decrease in mean temperature; thus, a 0.3° warming could be compensated by a change of about 0.4% in low cloudiness. A change of 0.4% in low cloudiness would obviously be exceedingly difficult to detect. … Mitchell (1975) concluded that neither tropospheric particulates [anthropogenic pollution] nor atmospheric CO2, in concert or separately, could have accounted for the major part of the observed temperature changes of the past century.
Vares et al., 2016
Quantification of the Diminishing Earth’s Magnetic Dipole Intensity and Geomagnetic Activity as the Causal Source for Global Warming within the Oceans and Atmosphere … Quantitative analyses of actual measurements rather than modeling have shown that “global warming” has been heterogeneous over the surface of the planet and temporally non-linear. Residual regression analyses by Soares (2010) indicated increments of increased temperature precede increments of CO2 increase. The remarkably strong negative correlation (r = -0.99) between the earth’s magnetic dipole moment values and global CO2-temperature indicators over the last ~30 years is sufficient to be considered causal if contributing energies were within the same order of magnitude. Quantitative convergence between the energies lost by the diminishing averaged geomagnetic field strength and energies gained within the ocean-atmosphere interface satisfy the measured values for increased global temperature and CO2 release from sea water. The pivotal variable is the optimal temporal unit employed to estimate the total energies available for physical-chemical reactions. The positive drift in averaged amplitude of geomagnetic activity over the last 100 years augmented this process. Contributions from annual CO2 from volcanism and shifts in averaged geomagnetic activity, lagged years before the measured global temperature-CO2 values, are moderating variables for smaller amplitude perturbations. These results indicated that the increase in CO2 and global temperatures are primarily caused by major geophysical factors, particularly the diminishing total geomagnetic field strength and increased geomagnetic activity, but not by human activities. Strategies for adapting to climate change because of these powerful variables may differ from those that assume exclusive anthropomorphic causes.
Davis et al., 2018
[T]he contemporary global warming increase of ~0.8 °C recorded since 1850 has been attributed widely to anthropogenic emissions of carbon dioxide (CO2) into the atmosphere. Recent research has shown, however, that the concentration of CO2 in the atmosphere has been decoupled from global temperature for the last 425 million years [Davis, 2017] owing to well-established diminishing returns in marginal radiative forcing (ΔRF) as atmospheric CO2 concentration increases. Marginal forcing of temperature from increasing CO2 emissions declined by half from 1850 to 1980, and by nearly two-thirds from 1850 to 1999 [Davis, 2017]. Changes in atmospheric CO2 therefore affect global temperature weakly at most.
Ollila, 2019
The temperature effects of the water and CO2 are based on spectral analysis calculations, which show that water is 11.8 times stronger a GH gas than CO2 in the present climate. … The variable labeled “Factor X” is also depicted in Figure 7; it is the difference between the measured 11 years average temperature and the warming effects of CO2, water and ENSO events. Factor X is needed to explain the observed warming. It is a combination of natural forces like the activity changes of the sun. It is easy to notice that the short-term temperature changes – mainly ENSO events – very closely correlate to the total precipitable water (TPW) changes. … There are essential features in the long-term trends of temperature and TPW, which are calculated and depicted as mean values 11 years running. The temperature has increased about 0.4°C since 1979 and has now paused at this level. The long-term trend of TPW [total precipitable water] effects shows that it has slightly decreased during the temperature-increasing period from 1979 to 2000. This means that the absolute water amount in the atmosphere does not follow the temperature increase, but is practically constant, reacting only very slightly to the long-term trends of temperature changes. The assumption that relative humidity is constant and that it amplifies the GH gas changes over the longer periods by doubling the warming effects finds no grounds based on the behavior of the TWP trend.The positive water feedback exists only during the short-term ENSO events (≤4 years).
Haine, 2016
Notably, the three studies [Jackson et al., 2016; Böning et al., 2016; Robson et al., 2016] report an absence of anthropogenic effects on the AMOC, at least so far: the directly observed AMOC weakening since 2004 is not consistent with the hypothesis that anthropogenic aerosols have affected North Atlantic ocean temperatures. The midlatitude North Atlantic temperature changes since 2005 have greater magnitude and opposite sign (cooling) than those attributed to ocean uptake of anthropogenic heat. The anthropogenic melt from the Greenland ice sheet is still too small to be detected.. And despite large changes in the freshwater budget of the Arctic, some of which are anthropogenic, there is no clear change in the delivery of Arctic freshwater to the North Atlantic due to human climate forcing.
Easterbrook, 2016
CO2 makes up only a tiny portion of the atmosphere (0.040%) and constitutes only 3.6% of the greenhouse effect. The atmospheric content of CO2 has increased only 0.008% since emissions began to soar after 1945. Such a tiny increment of increase in CO2 cannot cause the 10°F increase in temperature predicted by CO2 advocates. Computer climate modelers build into their models a high water vapor component, which they claim is due to increased atmospheric water vapor caused by very small warming from CO2, and since water vapor makes up 90–95% of the greenhouse effect, they claim the result will be warming. The problem is that atmospheric water vapor has actually declined since 1948, not increased as demanded by climate models. If CO2 causes global warming, then CO2 should always precede warming when the Earth’s climate warms up after an ice age. However, in all cases, CO2 lags warming by ∼800 years. Shorter time spans show the same thing—warming always precedes an increase in CO2 and therefore it cannot be the cause of the warming.
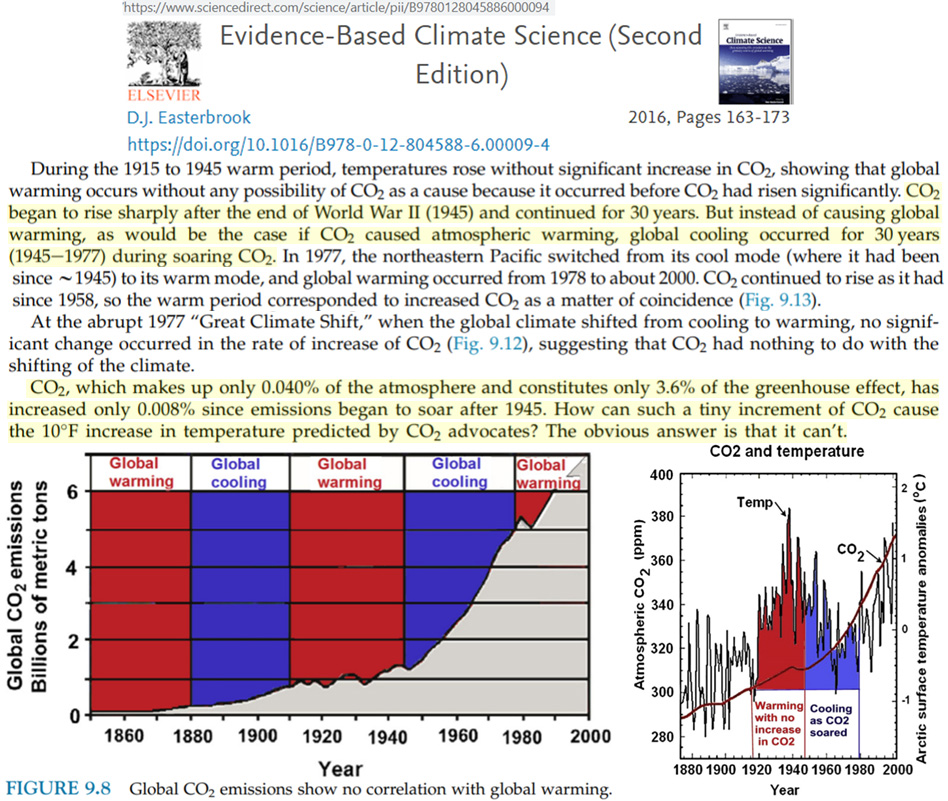
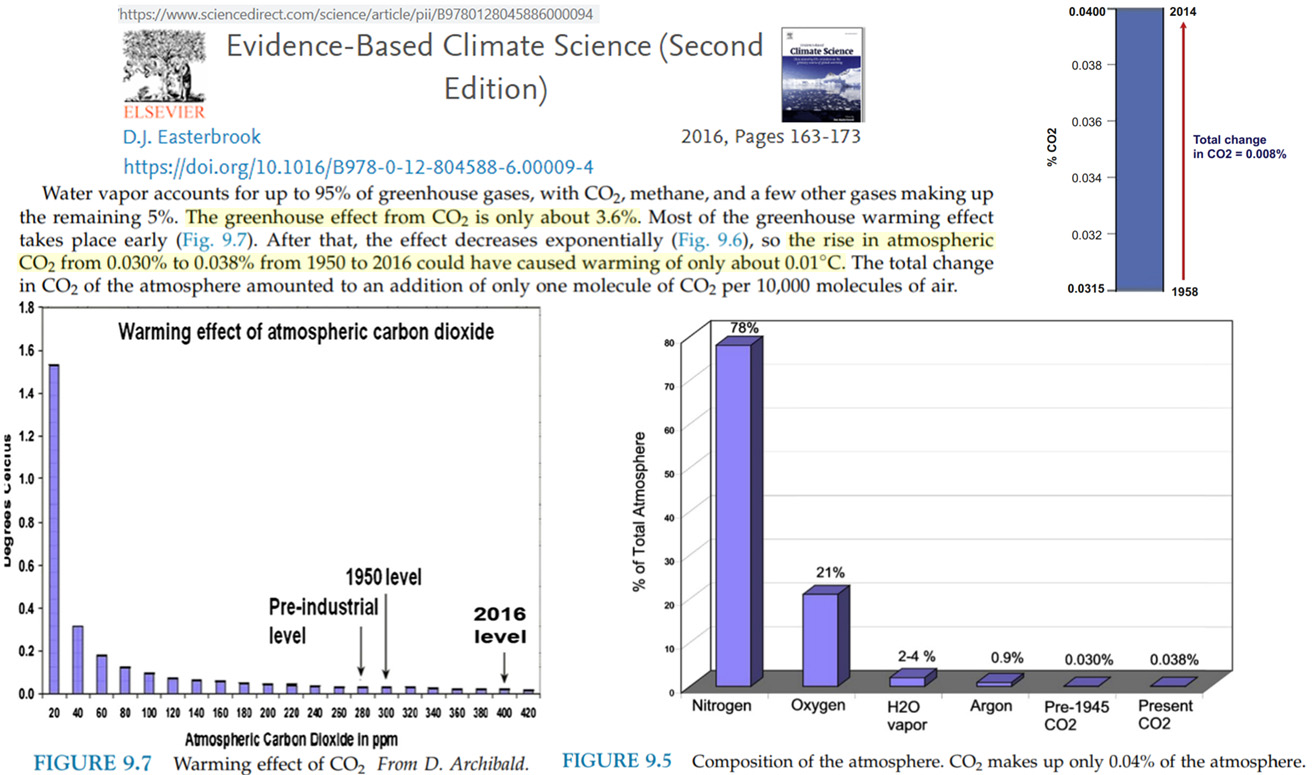
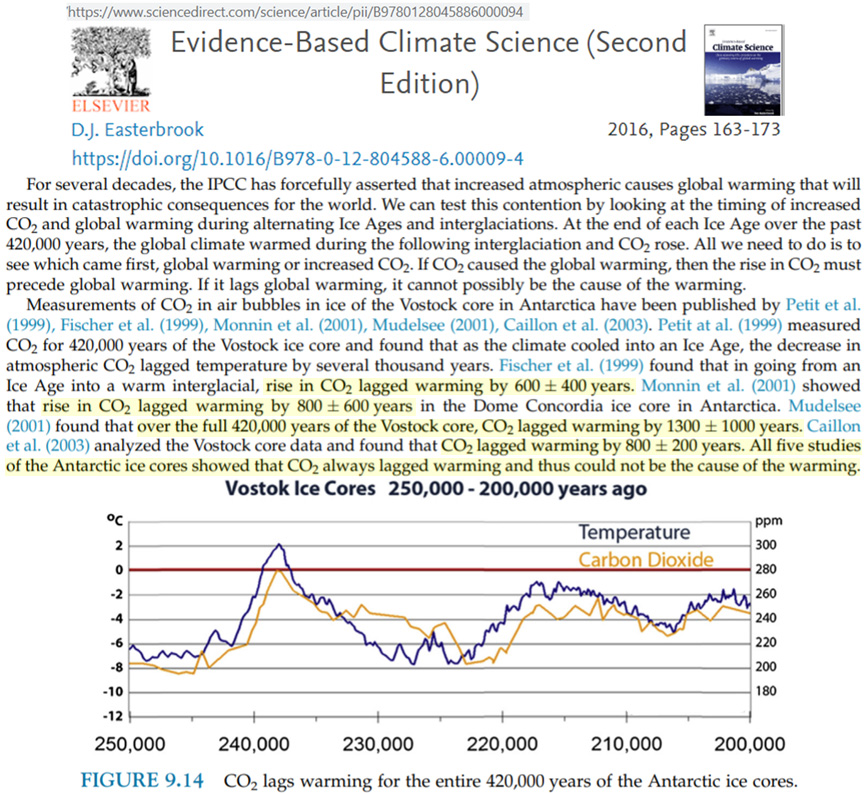
Koutsoyiannis et al., 2022
[T]he common perception that increasing CO2 causes increased T can be excluded because it violates the necessary condition for this causal direction […] in other words, it is the increase of temperature that caused increased CO2 concentration. Though this conclusion may sound counterintuitive at first glance, because it contradicts common perception […], in fact it is reasonable. The temperature increase began at the end of the Little Ice Period, in the early nineteenth century, when human CO2 emissions were negligible […] We believe that counterintuitive results, such as those about the causal link between temperature and CO2 concentration conveyed in this paper, can indeed open up avenues of research. However, these avenues of research might not resolve the issue in a way compatible with what intuition dictates. In the history of science, such avenues were often created when established ideas were overturned by new findings.
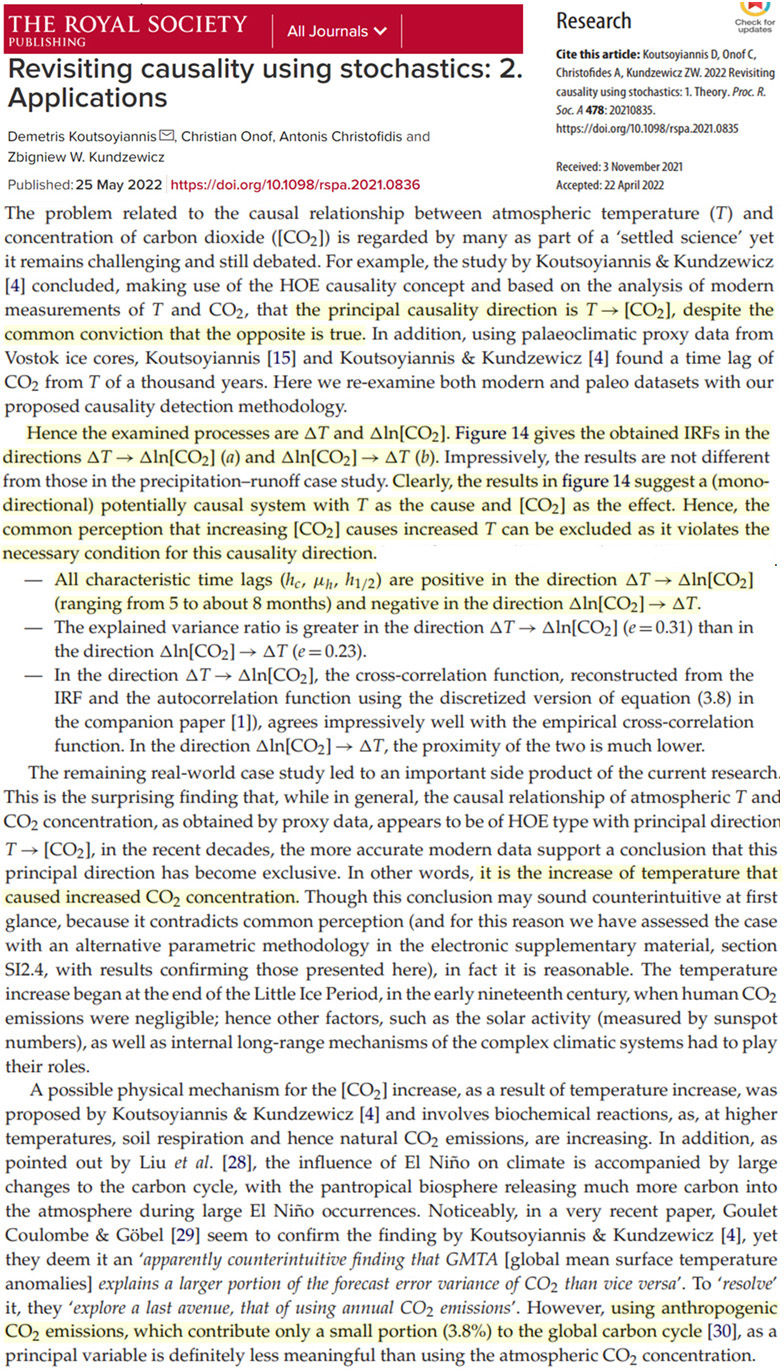
Manheimer, 2022
Multiple scientific theories and measurements show that there is no climate crisis. Radiation forcing calculations by both skeptics and believers show that the carbon dioxide radiation forcing is about 0.3% of the incident radiation, far less than other effects on climate. Over the period of human civilization, the temperature has oscillated between quite a few warm and cold periods, with many of the warm periods being warmer than today. During geological times, it and the carbon dioxide level have been all over the place with no correlation between them. … Unlike the claims of believers that there is nearly universal (i.e. 97%) agreement on the scientific basis for CO2 levels being a crucial dial which controls the earth’s temperature, this author finds that there is a vast literature, and vast amounts of data from extremely qualified scientists disputing this. If in fact ‘the science is settled’, it seems to be much more settled in the fact that there is no particular correlation between CO2 level and the earth’s temperature.
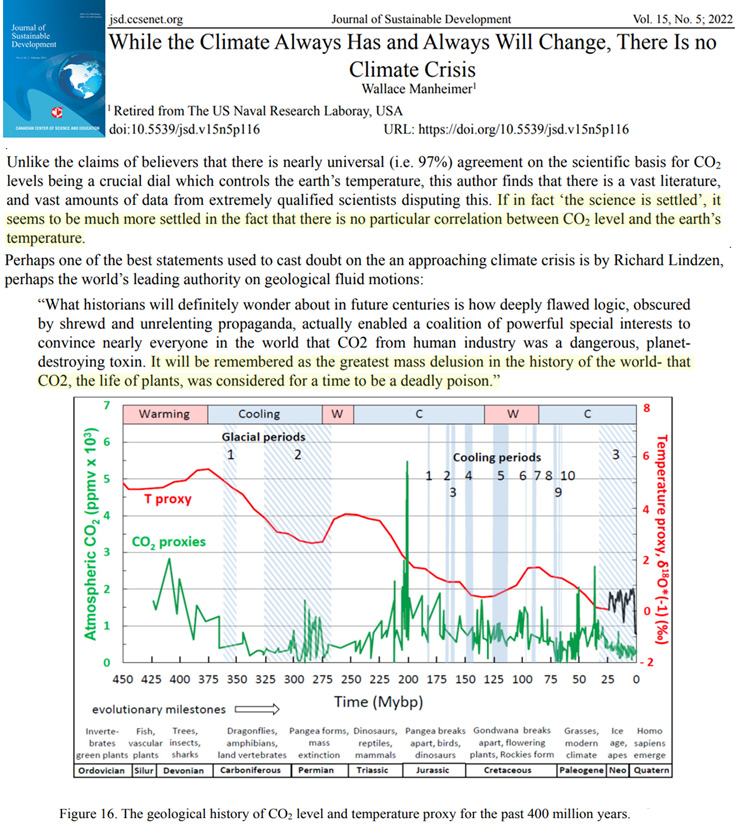
Smirnov, 2022
Changes in the Earth’s atmosphere that affect its energetics are analyzed. The results of NASA programs on carbon dioxide monitoring in the atmosphere and the evolution of the global temperature, as well as data on measurements of the evolution of local temperature in the past, are presented. Global power processes are analyzed on the basis of contemporary information both for: natural processes and those resulting from human activity. The channels of establishment of an equilibrium between the change in the mass of atmospheric carbon dioxide and that in global temperature are considered. They include decrease of the total rate of photosynthesis as a result of deforestation, combustion of fossil fuels and the greenhouse effect. Based on current information, it is shown that none of these channels explains the observed accumulation of carbon dioxide in the atmosphere. The inconsistency of climatological models of changes in the global temperature as a result of an increase in the concentration of carbon dioxide, which are the basis of the Paris Agreements on Climate, has been demonstrated. The use of these models is based on the assumption that the spectra of carbon dioxide and water molecules do not overlap, which contradicts both the data resulting from measurements with NASA programs and calculations based on the spectroscopic parameters of molecules from the HITRAN data bank. The Pauling concept, which is based on the thermodynamic equilibrium between free atmospheric CO2 molecules in the atmosphere and bound carbon at the Earth’s surface, is presented. Based on this concept, the different nature of the past and current equilibrium is shown. Thus, in the past, the slowest process of oxidation of the bound carbon at the Earth’s surface was the evaporation of carbon dioxide molecules dissolved in the ocean, while the limiting process at present is oxidation of carbonates in the oceans.
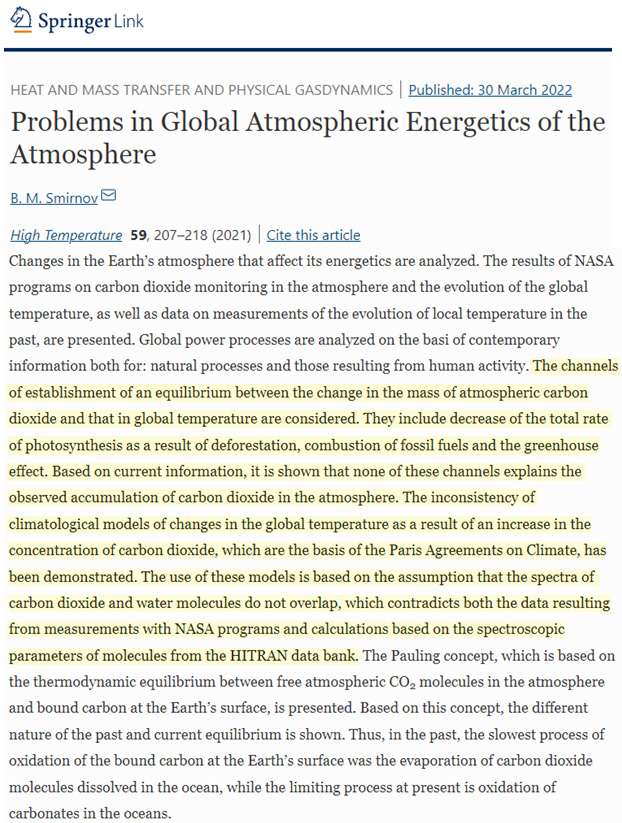
Skrable et al., 2022
These results negate claims that the increase in C(t) since 1800 has been dominated by the increase of the anthropogenic fossil component. We determined that in 2018, atmospheric anthropogenic fossil CO2 represented 23% of the total emissions since 1750 with the remaining 77% in the exchange reservoirs. Our results show that the percentage of the total CO2 due to the use of fossil fuels from 1750 to 2018 increased from 0% in 1750 to 12% in 2018, much too low to be the cause of global warming.
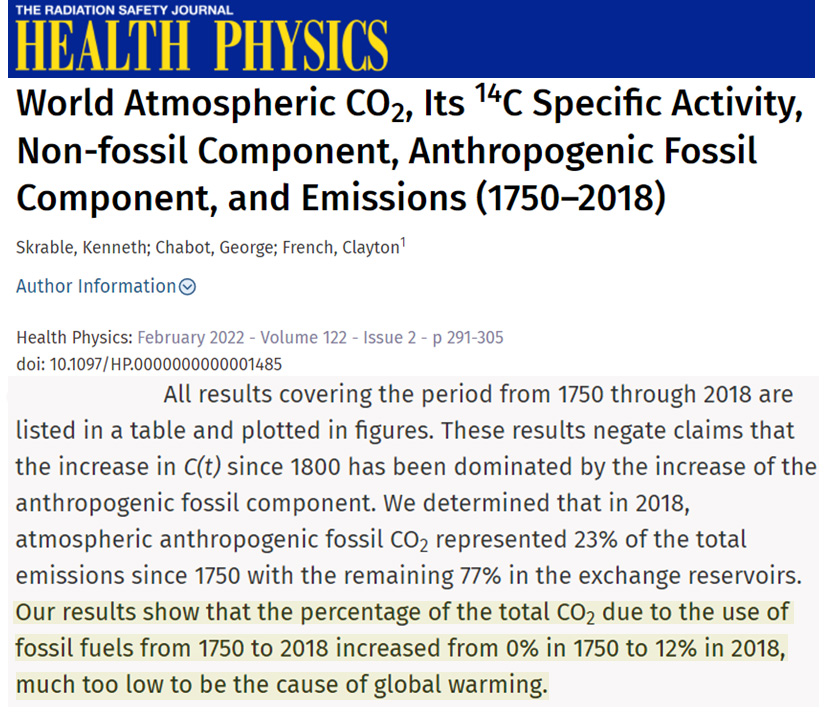
Jonas, 2022
The patterns of behaviour of clouds, both for cloud area and cloud optical thickness, are studied over the period of available data, 1983 to 2017. There was a decrease in cloud cover over the study period, while global surface temperatures increased. The patterns of clouds and temperature indicate that the cloud cover decrease could not have been caused by the increased surface temperature. The clear implication is that the decrease in global cloud area must have been caused by some other unspecified factor, and was not caused directly or indirectly by CO2. Evaluation of the changes in clouds and CO2 over the study period indicate that this unspecified factor had as much positive impact as the increase in CO2, with respect to the amount of radiation reaching the surface (radiative forcing), and possibly a much larger positive impact. The climate models, which have zero or negative cloud impact on radiative forcing independently from CO2, need to take this into account in order to avoid over-estimating the influence of CO2. … The implication is that the climate models and the IPCC over-estimate the effect of the atmospheric CO2 change over the study period on radiative forcing by a factor of about two or maybe much more, and their future projections of global warming caused by man-made CO2 are therefore likely to be much too high.
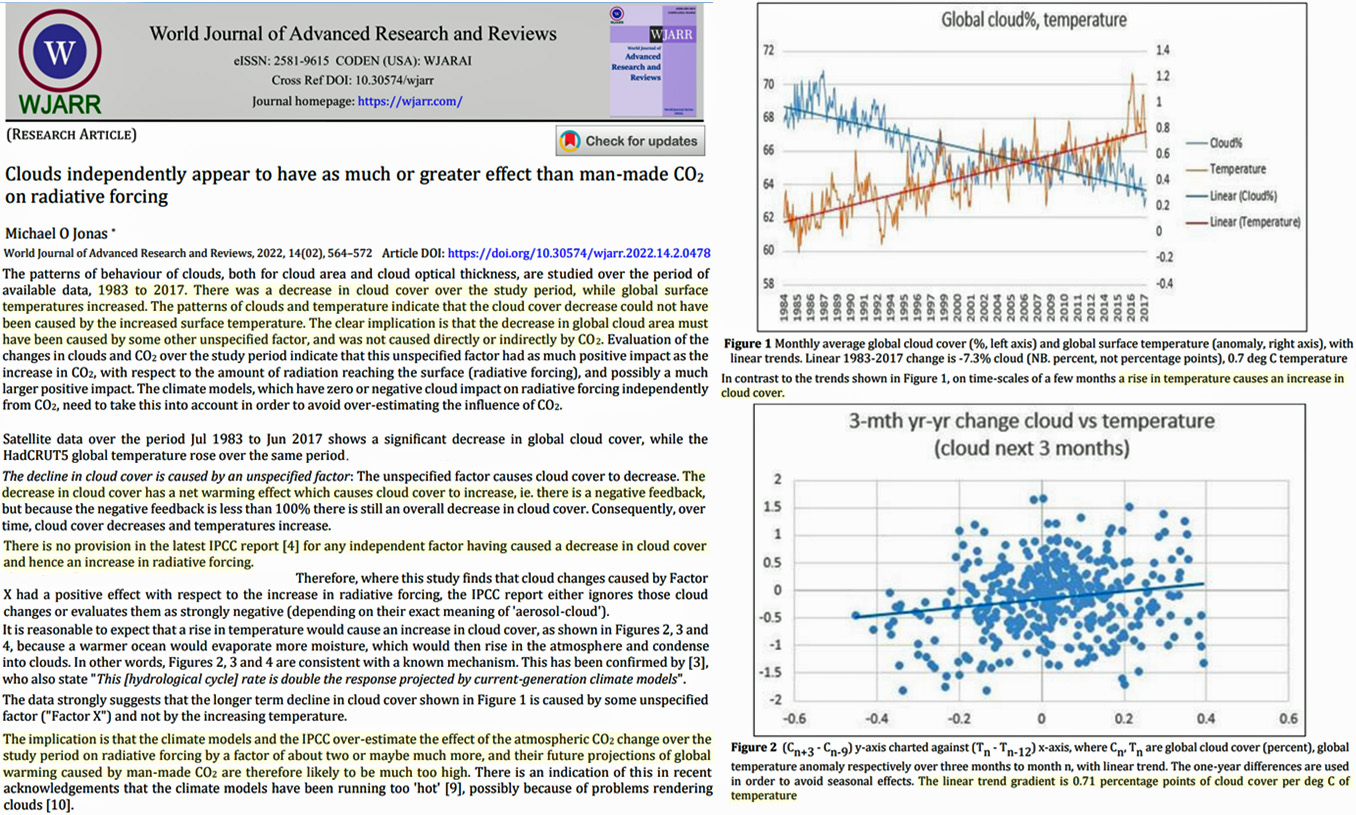
Lightfoot and Ratzer, 2022
The IPCC concept that increasing carbon dioxide in the atmosphere causes global warming is three decades out-of-date. Recent information proves it is obsolete and incorrect. … Over the 1979 to 2021 period, carbon dioxide (CO2) concentration increased by 78 ppm from 335 ppm to 413 ppm, i.e., 23%. Comparing graphs drawn on the same horizontal scale shows little, if any, correlation between the level of CO2 and the Earth’s temperature over the 42 years. This result is not surprising because CO2 is very close to its upper limit for warming the atmosphere, i.e., within approximately 1.5 Watts per square meter [6, 7]. … A solar minimum appears to have started around the beginning of sunspot cycle 25. During this current minimum, the Earth’s average temperature can fall as low as 1oC to 1.2oC below the current 1991 to 2020 average.
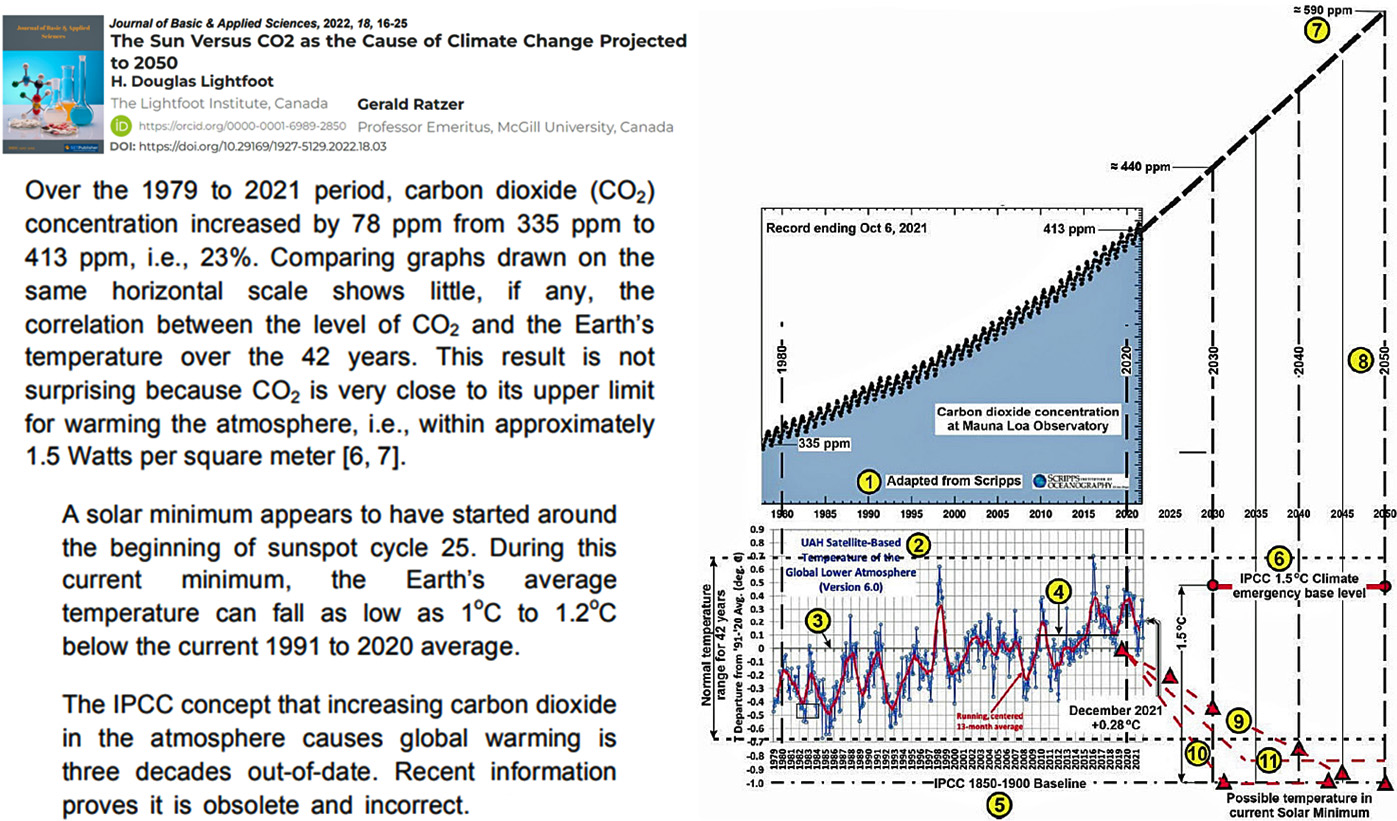
Koutsoyiannis, 2021
[T]he modern definitions of climate are seriously affected by the wrong perception of the previous two centuries that climate should regularly be constant, unless an external agent acts upon it. … [H]eat exchange by evaporation (and hence the latent heat transfer from the Earth’s surface to the atmosphere) is the Earth’s natural locomotive, with the total energy involved in the hydrological cycle being 1290 ZJ/year, corresponding to an energy flux density of 80 W/m2. Compared to human energy production (0.612 ZJ/year for 2014), the total energy of the natural locomotive is 2100 times higher than that of the human locomotive … Even though in the common perception it is carbon dioxide (CO2) that determines the greenhouse effect of the Earth, recent studies (Schmidt et al. [69]) attribute only 19% of the longwave radiation absorption to CO2 against 75% of water vapour and clouds, or a ratio of 1:4. … Another misconception, common in nonexperts, is that atmospheric CO2; is the product of human emissions, while in fact the latter contribute only 3.8% to the global carbon cycle. … [U]sing reliable instrumental measurements of global T and CO2 concentration covering the time interval 1980–2019, a recent study found that in the relationship of CO2 and temperature, the dominant causality direction is T → CO2, rather than the other way round, despite the latter being the common perception.
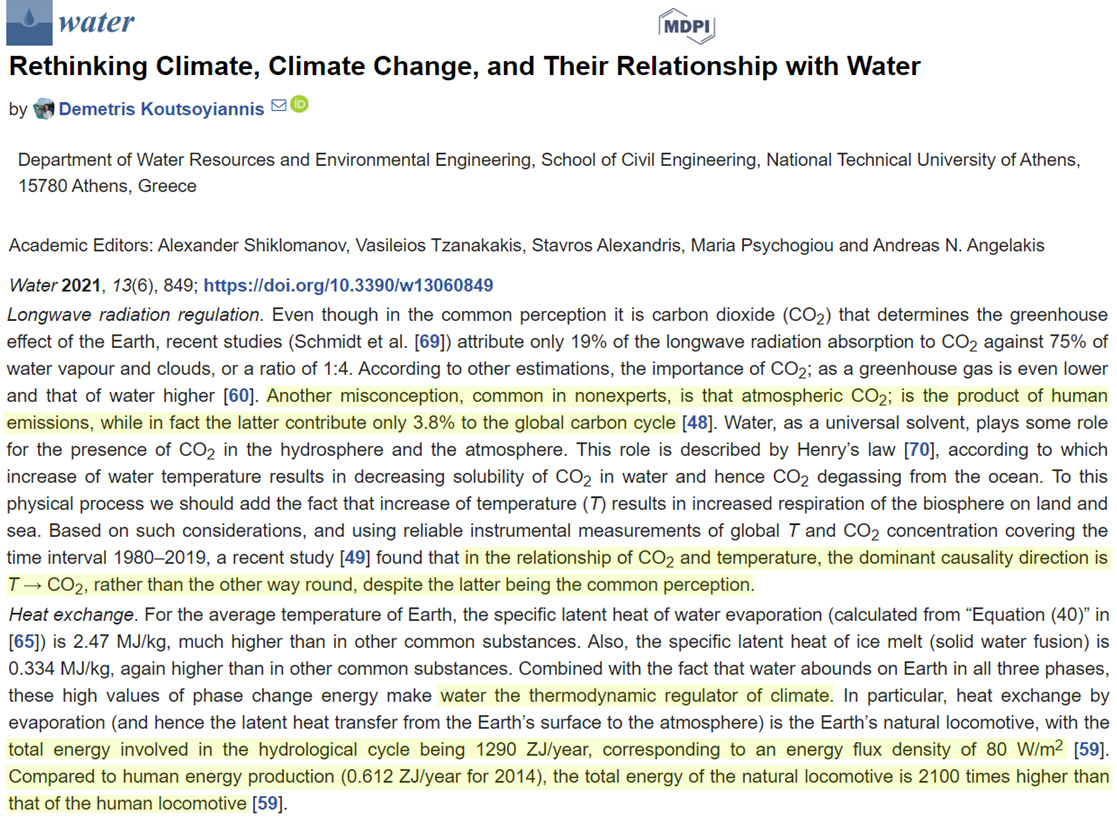
Jelbring, 2003
[T]he calculated values of AGW, accepted by many contemporary climate scientists, are thus irrelevant and probably quite insignificant (not detectable) in relation to natural processes causing climate change. … The GE [greenhouse effect] on Mars [953,00 ppm CO2] that has little atmosphere is around 0 K
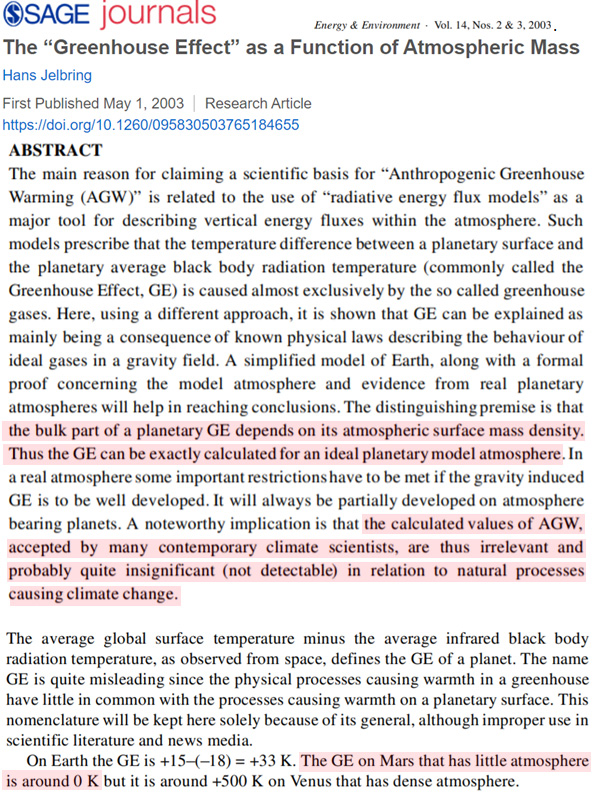
Clark, 2010 (full paper)
Energy transfer at the Earth’s surface is examined from first principles. The effects on surface temperature of small changes in the solar constant caused by the sunspot cycle and small increases in downward long wave infrared (LWIR) flux due to a 100 ppm increase in atmospheric CO2 concentration are considered in detail. The changes in the solar constant are sufficient to change ocean temperatures and alter the Earth’s climate. The surface temperature changes produced by an increase in downward LWIR flux are too small to be measured and cannot cause climate change. The assumptions underlying the use of radiative forcing in climate models are shown to be invalid. A null hypothesis for CO2 is proposed that it is impossible to show that changes in CO2 concentration have caused any climate change, at least since the current composition of the atmosphere was set by ocean photosynthesis about one billion years ago.
The ‘clear sky’ upper limit for the CO2 induced increase in evaporation is below the measurement uncertainty bounds. Long term averages of surface air temperatures are approximately 2 C below the corresponding ocean surface temperatures. This means that there is usually no direct heating of the ocean by the atmosphere, as required by the Second Law of Thermodynamics. As discussed below (Figure 15), any slight increase in atmospheric H2O vapor concentration will produce atmospheric cooling through increased upward LWIR emission under these conditions. Latent heat of evaporation is not released until the water condenses, which is generally at altitudes above 1 km. It is therefore impossible for an increase in downward atmospheric LWIR flux of 1.7 W.m−2 to heat the ocean.
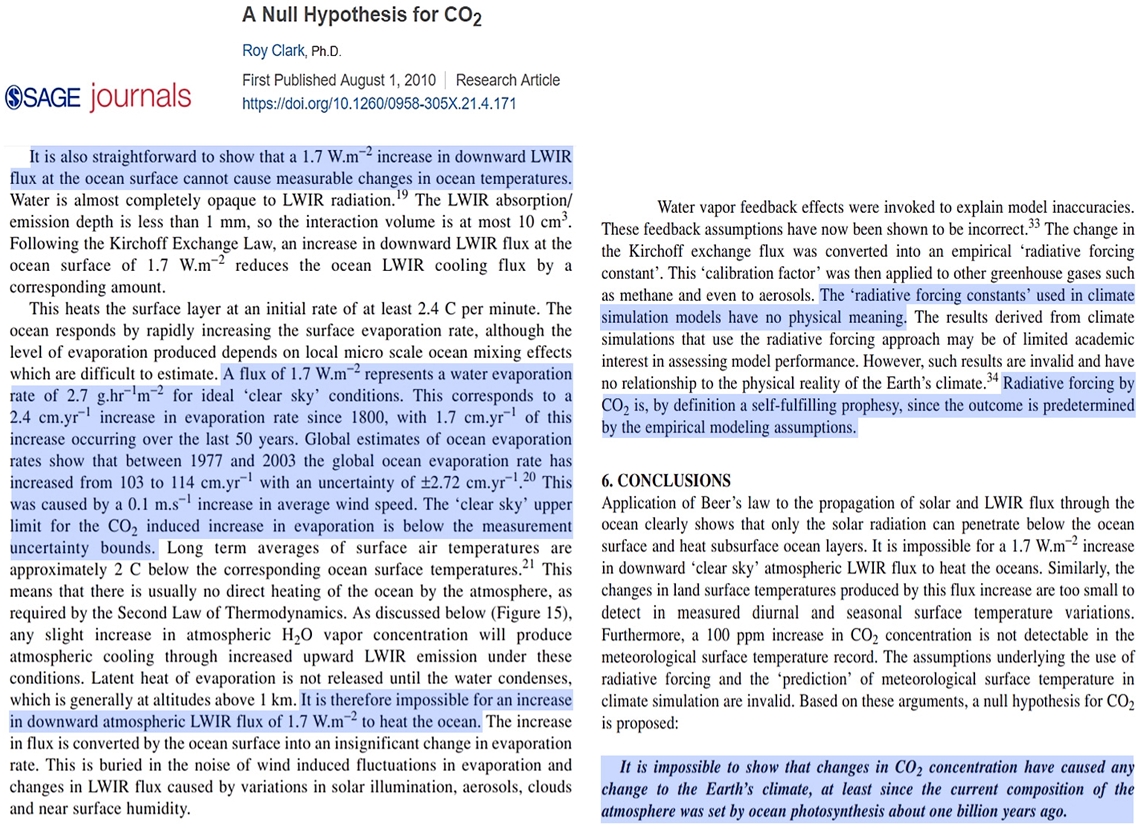
Ramanathan et al., 1989
Water vapour and cloud are the dominant regulators of the radiative heating of the planet. ..The greenhouse effect of clouds may be larger than that resulting from a hundredfold increase in the CO2 concentration of the atmosphere. … The size of the observed net cloud forcing is about four times as large as the expected value of radiative forcing from a doubling of CO2. The shortwave and longwave components of cloud forcing are about ten times as large as those for a CO2 doubling.
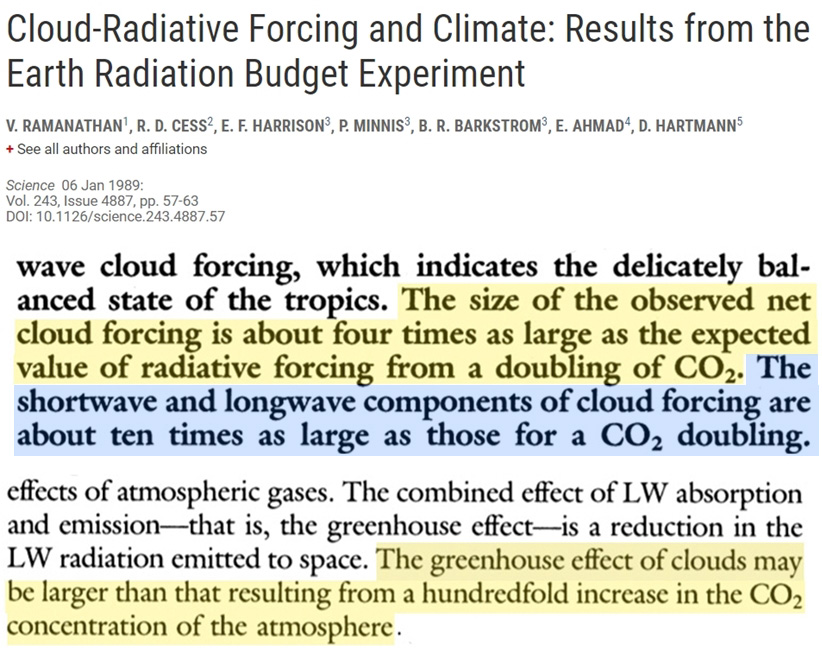
Stallinga, 2018
The best estimation for water is that it is responsible for 95% of the current greenhouse effect. CO2 has 3.6% contribution [4]. The linear effect of CO2 is thus estimated to be a factor 30 lower than the above estimate, namely dT/d[CO2] = 3 mK/ppm (doubling of [CO2] would cause about 1 degree warming). Moreover, it is highly dubious that the effect of CO2 is linear. That is because the greenhouse effect is governed by absorption of light, a process that is well studied and follows the Beer-Lambert Law of absorption that is sublinear.To put it in layman’s terms, placing a second curtain over a window that is already closed with a curtain will have as good as no effect. Absorption according to the Beer-Lambert Law is logarithmic and the IR window of the CO2-absorption spectrum is already as good as closed; most heat is radiated outwards in the window of 8 μm to 15 μm where CO2 has no absorption. The effect of CO2 is at around 20 μm [5] and is tiny. GHE theory: 1.4 mK ppm [0.0014 K/ppm], i.e., 500 mK [0.5 K] for a doubling of CO2 in the atmosphere that has moreover been confirmed by measurements [6]. That is a factor 70 below the observations.
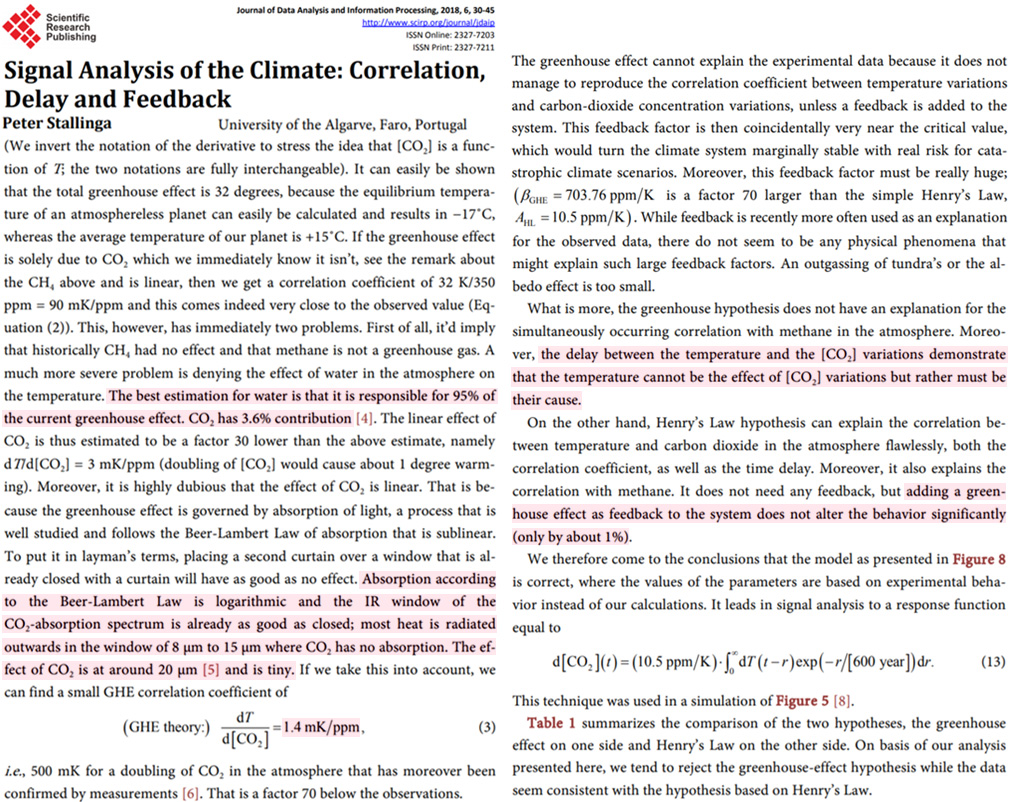
Davis, 2017
The correlation between ΔRFCO2 and linearly-detrended T across the Phanerozoic Eon is positive and discernible, but only 2.6% of variance in T is attributable to variance in ΔRFCO2. Of 68 correlation coefficients (half non-parametric) between ΔRFCO2 and T proxies encompassing all known major Phanerozoic climate transitions, 75.0% are non-discernible and 41.2% of discernible correlations are negative. Spectral analysis, auto- and cross-correlation show that proxies for T, atmospheric CO2 concentration and ΔRFCO2 oscillate across the Phanerozoic, and cycles of CO2 and ΔRFCO2 are antiphasic. A prominent 15 million-year CO2 cycle coincides closely with identified mass extinctions of the past, suggesting a pressing need for research on the relationship between CO2, biodiversity extinction, and related carbon policies. This study demonstrates that changes in atmospheric CO2 concentration did not cause temperature change in the ancient climate.
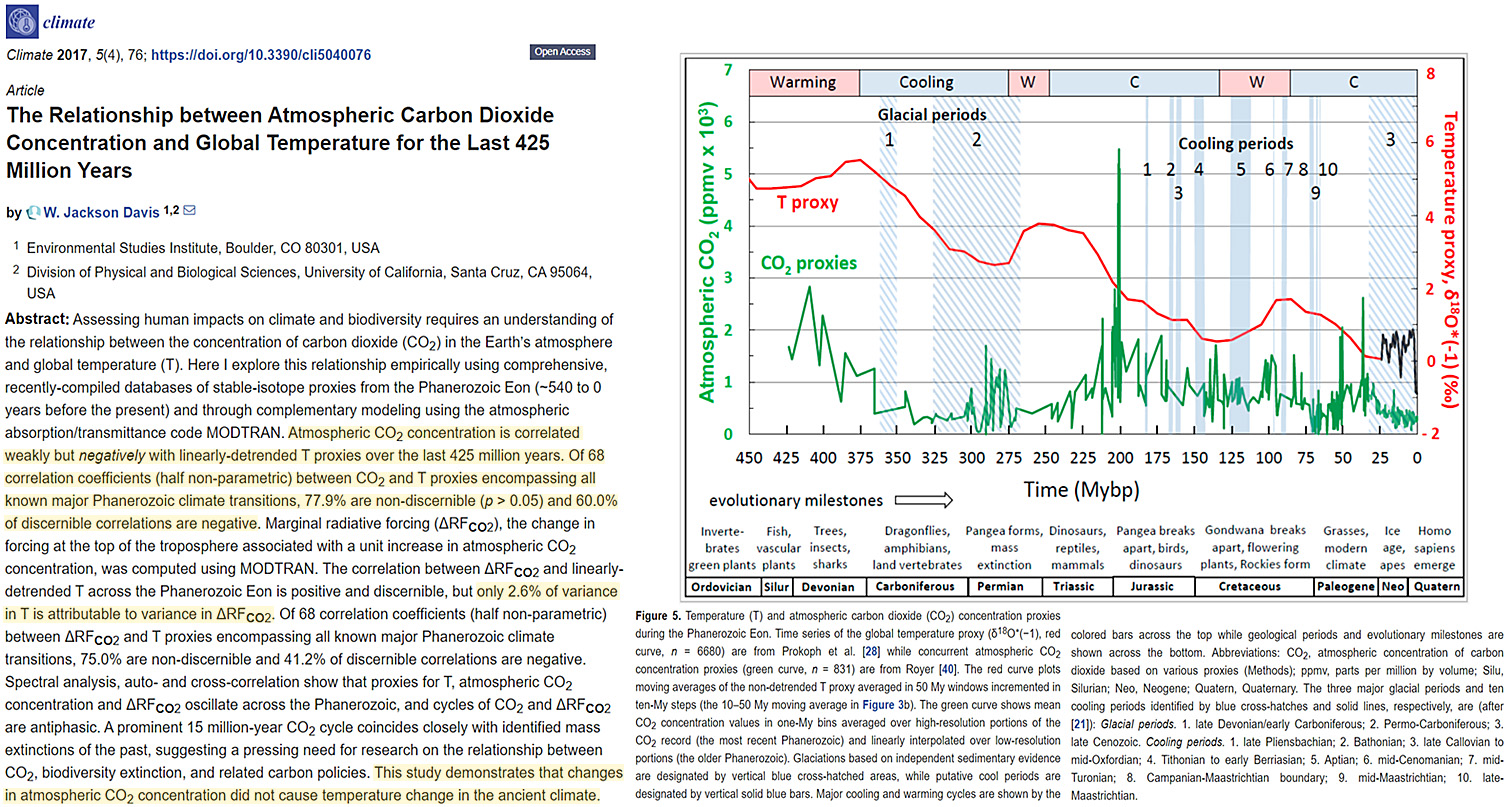
Khilyuk and Chilingar, 2006 (full)
The current global warming is most likely a combined effect of increased solar and tectonic activities and cannot be attributed to the increased anthropogenic impact on the atmosphere. Humans may be responsible for less than 0.01°C (of approximately 0.56°C (1°F) total average atmospheric heating during the last century … [G]lobal natural forces are at least 4–5 orders of magnitude greater than available human controls.
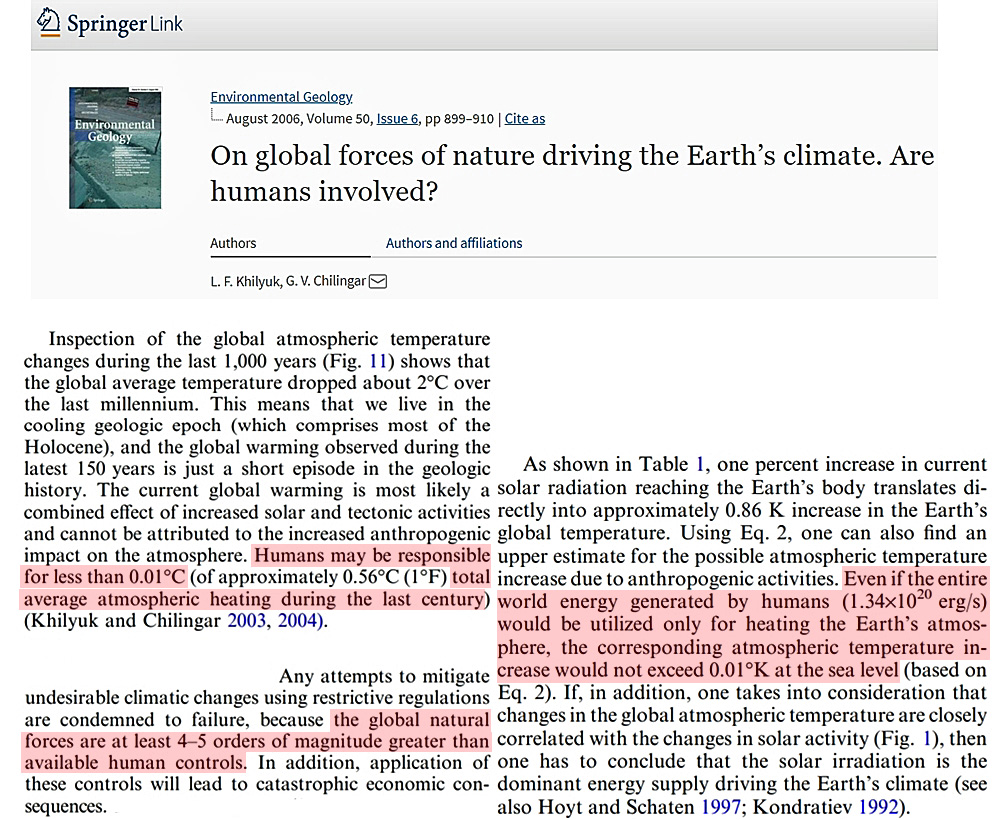
Newell and Dopplick, 1970
The greenhouse theory as usually discussed puts such a “heating” interpretation on the CO2 changes even though the actual effect of a CO2 increase is to diminish the cooling rate. It is well to stress that the conditions here are such that all other items are unchanged. The term greenhouse is of dubious applicability because the greenhouse glass leads to higher temperatures by reducing turbulent eddy heat losses, rather than by a radiative influence (Kondratyev, 1965). To place the CO2 contribution to temperature change in perspective it is compared with other radiative components at two levels in Table 2. Clear skies are assumed. Carbon dioxide is secondary to water vapor in the troposphere as noted by others (e.g., Rodgers and Walshaw, 1966) and dominant in the lower stratosphere under the conditions assumed here. When looking for a potential influence of global pollution on the tropospheric temperature it would be therefore wise to pay careful attention to the water cycle and its possible modification, particularly as it enters also through the effect of latent heat.
Smirnov and Zhilyaev, 2021
Because carbon dioxide molecules do not absorb in the additional spectrum range between 1200 cm−1 and 2600 cm−1, the radiative parameters due to CO2 molecules are close in these evaluations and in the previous one. In particular, the variation in radiative fluxes as a result of the change in the carbon dioxide amount in the atmosphere for these calculations are close. In this evaluation as well as previous evaluations, we have a contradiction with the results of climatological models in the analysis of the Earth’s greenhouse effect, according to which the increase in the global temperature differs by five times. [T]he large difference results from ignoring, in climatological models, the Kirchhoff law [50], according to which radiators are simultaneously the absorbers. In this case, we take the change in the radiative flux created by CO2 molecules as the change of the total radiative flux.
Note the restrictions by the frequency range up to 1200 cm−1 in the previous calculations [1]; we thus assume that the atmosphere is transparent for larger frequencies, and the emission at larger frequencies is determined by clouds. However, according to the HITRAN data bank, water molecules absorb effectively in the enlarged frequency range. [A]tmospheric CO2 molecules are not the main radiator of the atmosphere. From these evaluations, it follows that water molecules in the atmosphere may be responsible for the observed heating of the Earth.
Allmendinger, 2018
Knowledge about thermal radiation of the atmosphere is rich in hypotheses and theories but poor in empiric evidence. Thereby, the Stefan-Boltzmann relation is of central importance in atmosphere physics, and holds the status of a natural law. However, its empirical foundation is little, tracing back to experiments made by Dulong and Petit two hundred years ago. … For studying the pressure dependency, the experiments were carried out at locations with different altitudes. For the so-called atmospheric emission constant A an approximate value of 22 Wm−2 bar−1 K−0.5 was found. In the non-steady-state, the total thermal emission power of the soil is given by the difference between its blackbody radiation and the counter-radiation of the atmosphere. This relation explains to a considerable part the fact that on mountains the atmospheric temperature is lower than on lowlands, in spite of the enhanced sunlight intensity. Thereto, the so-called greenhouse gases such as carbon-dioxide do not have any influence. … While a theoretical calculation of such an absorption coefficient was not feasible, at least a principal explanation may be given: There is no good reason to assume that absorbed IR-radiation will be entirely transformed into heat. Instead, it is conceivable that a part of it is re-emitted, i.e. to say in all directions, before having induced a temperature enhancement. … This approach contradicts in many ways the conventional greenhouse theory: Firstly, the boundary processes at the Earth surface and at the lowest layer of the atmosphere are predominant, while the conventional greenhouse theory regards the whole atmosphere; and secondly—even more crucial—the radiation budget is solely determined by the air conditions of the atmosphere such as pressure and temperature while so-called “greenhouse gases” such as carbon-dioxide do not have the slightest influence on the climate. Besides, the atmosphere cannot really be compared to a greenhouse, not least due to the absence of a glass-roof which absorbs IR-radiation, and which inhibits considerable air convection.
Laubereau and Iglev, 2018
Using a simple 1-dimensional model the global warming of the surface is computed that is generated by the increase of GHG and the albedo change. A modest effect by the GHG of 0.08 K is calculated for the period 1880 to 1955 with a further increase by 0.18 K for 1955 to 2015. A larger contribution of 0.55 ± 0.05 K is estimated for the melting of polar sea ice (MSI) in the latter period, i.e. it notably exceeds that of the GHG and may be compared with the observed global temperature rise of 1.0 ± 0.1 K during the past 60 years. … In conclusion we wish to say that we have performed a study of the infrared properties of carbon dioxide, methane, dinitrogen-oxide and water to estimate their contribution to the global warming in 1880 – 2015. Our results suggest that the IR properties of the CO2 are responsible for ~ 20% of the mean temperature increase of the surface [during 1880-2015] and notably less for CH4 and N2O.
Manabe and Möller, 1961
The heating due to the absorption of solar radiation by carbon dioxide is still small compared with the effects of other processes. However around the tropopause, where the contributions of various radiative processes are at a minimum, it is not always negligible.
The long wave radiation by carbon dioxide has a strong tendency to destroy the existing latitudinal increase of the temperature. The net effect of these radiative processes could barely maintain the stratospheric temperature approximately constant with latitude and hardly explains the sharp latitudinal temperature increase observed in the stratosphere.
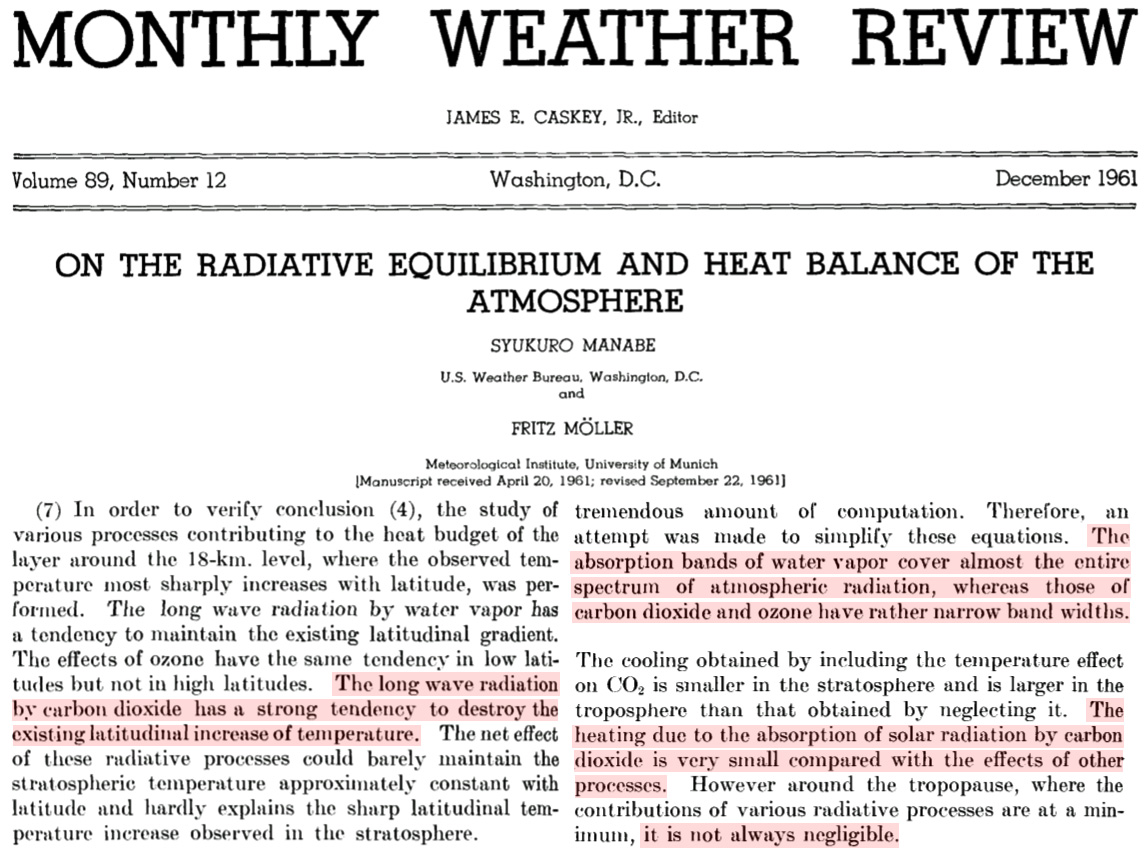
Libby, 1970
FIFTY ENVIRONMENTAL PROBLEMS OF TIMELY IMPORTANCE
WEATHER MODIFICATION BY CHANGING CO2 CONTENT OF ATMOSPHERE [p. 48]
Item: American Scientist, January-February 1970, p. 18, “Though dire effects on climate of an increase in CO2 have been predicted, they are far from being established. The cycle is not really understood; carbon dioxide may well prove to be the least objectionable or the only beneficial addition to the atmosphere from industrial sources … Atmospheric CO2 is the source of almost all the carbon of organic compounds in our bodies. It is likely that CO2 from industrial sources has actually increased the productivity of terrestrial vegetation since 1900, and that as fossil fuels are exhausted and industry goes to atomic power there will be a decrease, possibly ten percent, in agricultural yields….”
Berry, 2019
The United Nations Intergovernmental Panel on Climate Change (IPCC) agrees human CO2 is only 5 percent and natural CO2 is 95 percent of the CO2 inflow into the atmosphere. The ratio of human to natural CO2 in the atmosphere must equal the ratio of the inflows. Yet IPCC claims human CO2 has caused all the rise in atmospheric CO2 above 280 ppm, which is now 130 ppm or 32 percent of today’s atmospheric CO2. To cause the human 5 percent to become 32 percent in the atmosphere, the IPCC model treats human and natural CO2 differently, which is impossible because the molecules are identical. IPCC’s Bern model artificially traps human CO2 in the atmosphere while it lets natural CO2 flow freely out of the atmosphere. By contrast, a simple Physics Model treats all CO2 molecules the same, as it should, and shows how CO2 flows through the atmosphere and produces a balance level where outflow equals inflow. Thereafter, if inflow is constant, level remains constant. … The Physics Model shows how inflows of human and natural CO2 into the atmosphere set balance levels proportional to their inflows. Each balance level remains constant if its inflow remains constant. Continued constant CO2 emissions do not add more CO2 to the atmosphere. No CO2 accumulates in the atmosphere. Present human CO2 inflow produces a balance level of about 18 ppm. Present natural CO2 inflow produces a balance level of about 392 ppm. Human CO2 is insignificant to the increase of CO2 in the atmosphere. Increased natural CO2 inflow has increased the level of CO2 in the atmosphere.
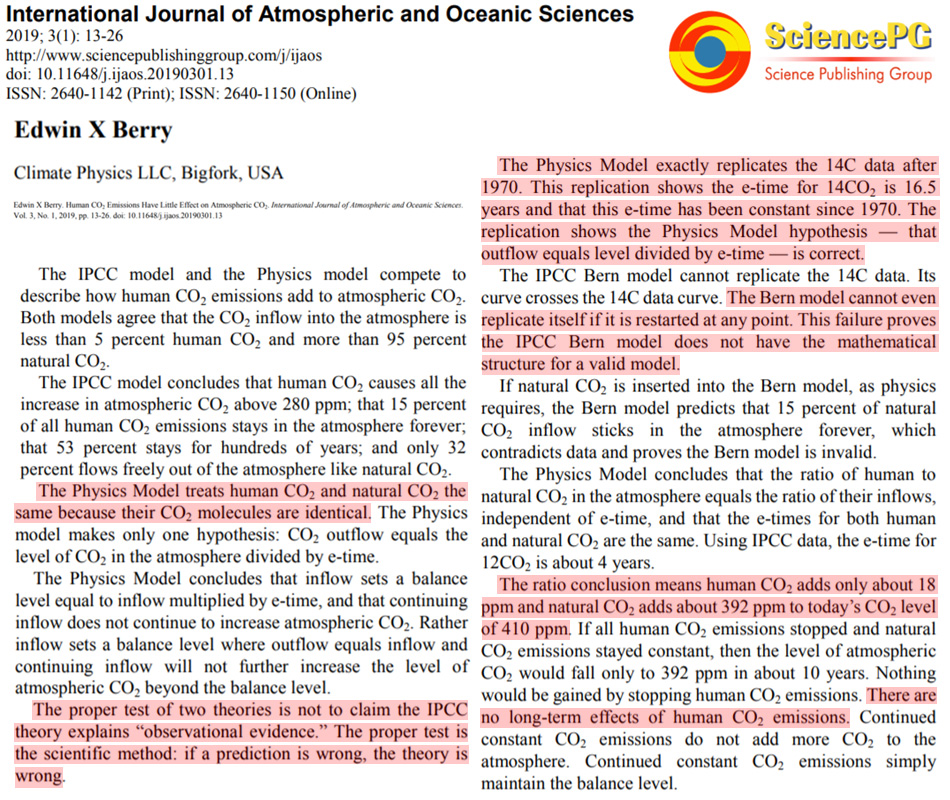
Chilingar et al., 2014
Even significant releases of anthropogenic carbon dioxide and methane into the atmosphere do not change average parameters of the Earth’s heat regime and have no essential effect on the Earth’s climate. Thus, petroleum production and other anthropogenic activities resulting in accumulation of additional amounts of methane and carbon dioxide in the atmosphere have practically no effect on the Earth’s climate.
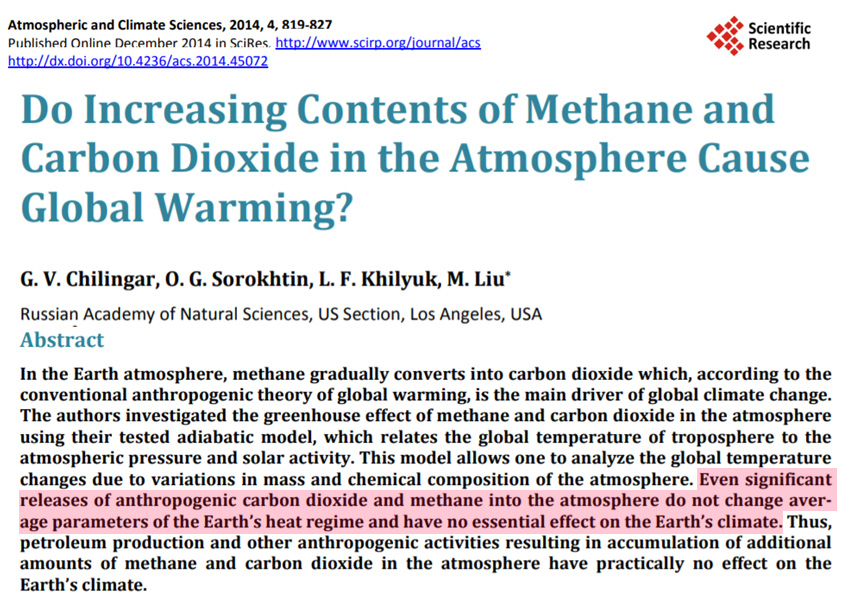
Liu and Chen, 2018
CO2 and temperature records at Mauna Loa, Hawaii, and other observation stations show that the correlation between CO2 and temperature is not significant. These stations are located away from big cities, and in various latitudes and hemispheres. But the correlation is significant in global mean data. Over the last five decades, CO2 has grown at an accelerating rate with no corresponding rise in temperature in the stations. This discrepancy indicates that CO2 probably is not the driving force of temperature change globally but only locally(mainly in big cities). We suggest that the Earth’s atmospheric concentration of CO2 is too low to drive global temperature change. … Our empirical perception of the global warming record is due to the urban heat island effect: temperature rises in areas with rising population density and rising industrial activity. This effect mainly occurs in the areas with high population and intense human activities, and is not representative of global warming. Regions far from cities, such as the Mauna Loa highland, show no evident warming trend. The global monthly mean temperature calculated by record data, widely used by academic researchers, shows R~2=0.765, a high degree of correlation with CO2. However, the R~2 shows much less significance (mean R~2=0.024) if calculated by each record for 188 selected stations over the world. This test suggests that the inflated high correlation between CO2 and temperature (mean R~2=0.765-0.024=0.741) used in reports from the Intergovernmental Panel on Climate Change (IPCC) was very likely produced during data correction and processing. This untrue global monthly mean temperature has created a picture: human emission drives global warming.
Ludwig et al., 1973
There have been a number of theoretical models developed in which the effect of the CO2 increase is linked with a mean global temperature increase. In general, these models have not been too successful because the end results were unreasonably sensitive to minor changes in some critical assumptions. For example, Manabe and Wetherald (ref. 7) calculate that the estimated increase in CO2 concentration by the year 2000 would raise the average atmospheric temperature by 0.5° C. Whether this temperature increase would really occur is open to question, since it could be counterbalanced by a 1% change in total average cloudiness (ref. 8). In addition, the apparent increase of global aerosol concentration (ref. 9) could have a similar counterbalancing effect.
Allmendinger, 2016
In contrast to the usual spectroscopic methods, the temperature of a gas embedded in a tube was measured here and not the intensity loss of the radiation. In order to minimize the interference by the tube, light-weight building materials were used, preferably Styrofoam, transparent plastic foils and aluminium foils. Sunlight as well as infrared (IR)-bulbs was employed as radiation sources, whereby near-IR is predominant and not medium-IR as it is usually assumed. Different gases were tested, not only air and carbon-dioxide but also the noble gases argon, helium and neon. In each case, a temperature increase was detected up to a limiting value. While the warming-up rate was independent of the gas type, the limiting temperature turned out to be gas-specific. Surprisingly and contrary to the expectation of the greenhouse theory, the limiting temperatures of air, pure carbon-dioxide and argon were nearly equal.
The primary experimental result was quite astonishing in many respects. Firstly, the content gases warmed within a few minutes by approximately 10°C up to a constant limiting temperature. This was surprising at least in the case of air, for no warming-up should occur since sunlight is colourless and allegedly not able to absorb any IR-light. However, the existence of a limiting temperature is conceivable since an emission of heat radiation has to be expected insofar as the temperature rises. Secondly, the limiting temperatures were more or less equal at any measuring point. This means that the intensity of the sun beam was virtually not affected by the heat absorption in the gas tube since the latter one was comparatively weak. And thirdly, between the two tubes no significant difference could be detected. Therefore, thanks to this simple experiment, a significant effect of carbon-dioxide on the direct sunlight absorption can already be excluded since it is unlikely that the minor carbon-dioxide concentration in the air of approximately 0.04% should have the same effect as pure carbon-dioxide.
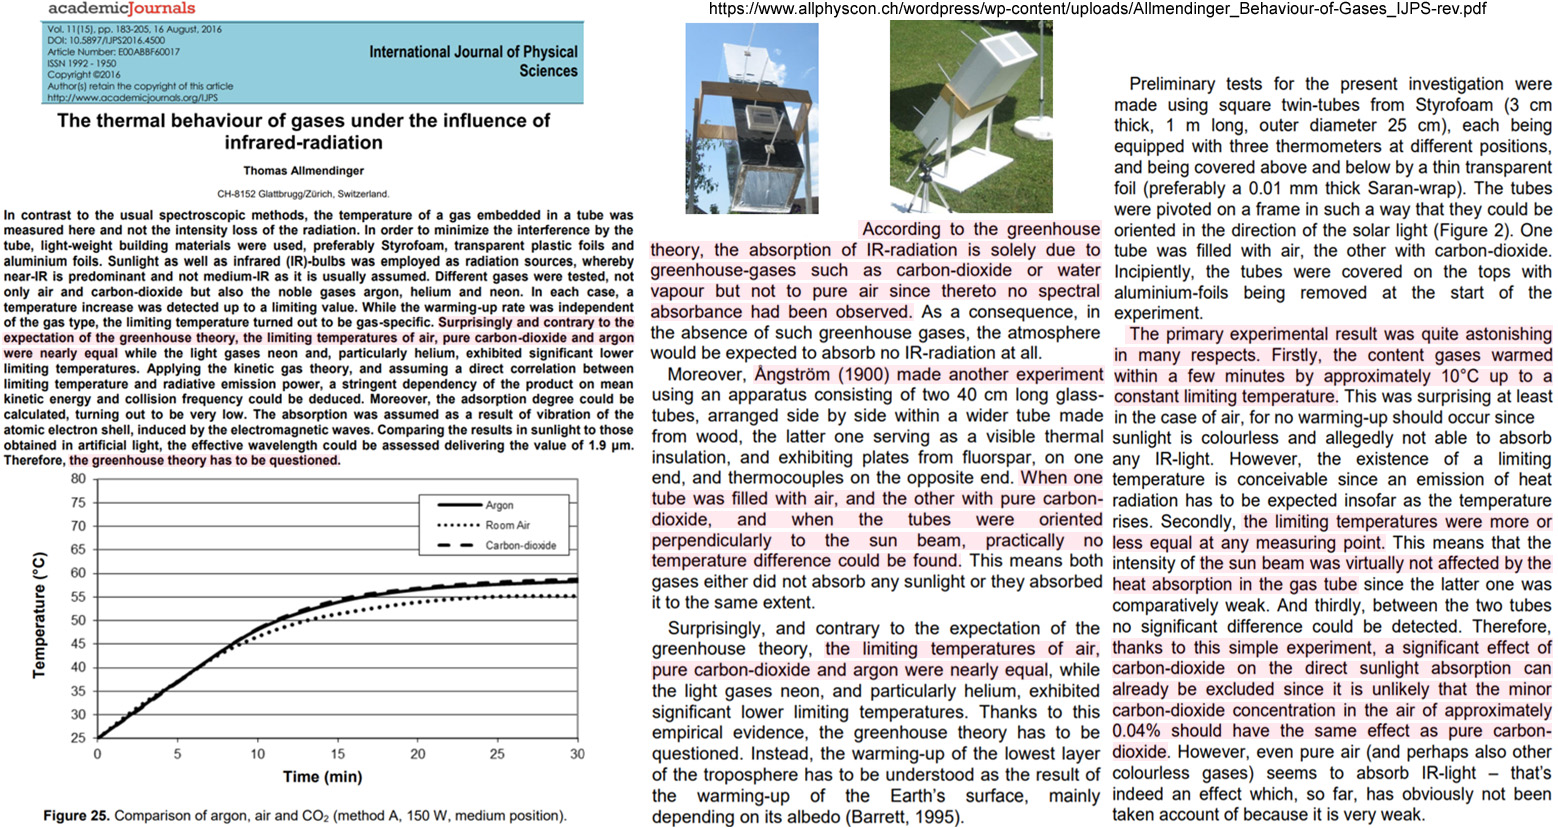
Singer, 1976
The distribution of the radiating gases is largely responsible for the layering of the Earth’s atmosphere. The troposphere extends from sea level up to approximately 12 km at which point the temperature has dropped to approximately -60°C. Water vapor is about 10 times more important than carbon dioxide, both for radiative heating by absorbing solar radiation and for radiative cooling. In the stratosphere, however, radiative heating by the absorption of solar radiation by ozone is dominant.
Kauppinen et al., 2014
We will show that changes of relative humidity or low cloud cover explain the major changes in the global mean temperature. We will present the evidence of this argument using the observed relative humidity between years 1970 and 2011 and the observed low cloud cover between years 1983 and 2008. One percent increase in relative humidity or in low cloud cover decreases the temperature by 0.15 °C and 0.11 °C, respectively. In the time periods mentioned before the contribution of the CO2 increase was less than 10% to the total temperature change.
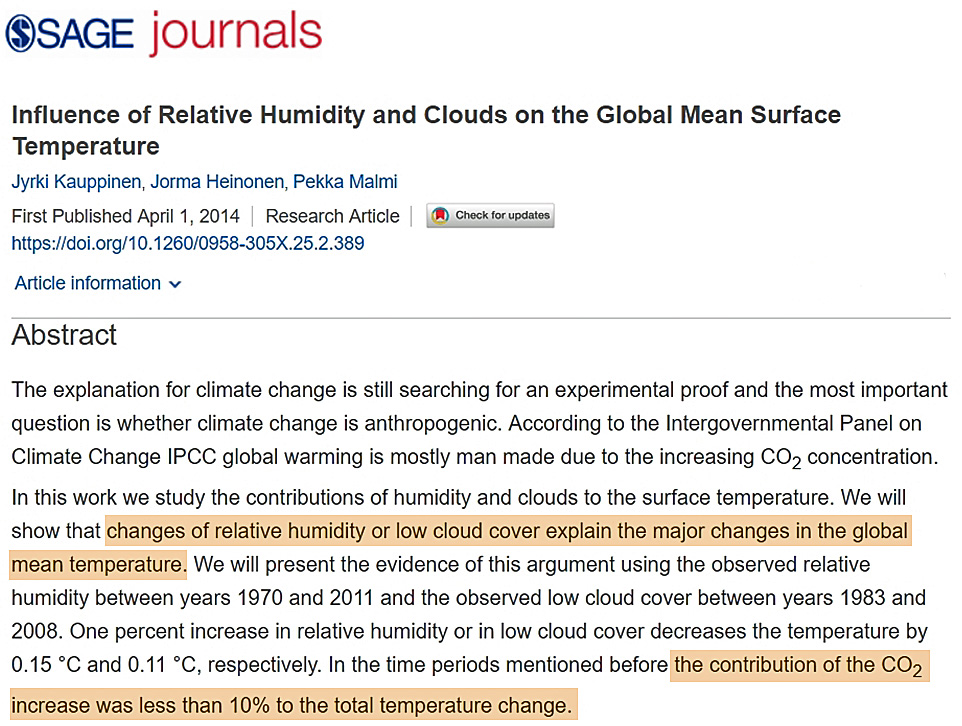
Irvine, 2015
“It is established physics that Long wave Radiation from GHGs only penetrates the oceans to a depth of a fraction of a millimetre. 99% of the long wave radiation reemitted by GHGs is absorbed in pure water in the first 0.015mm of the surface. ,,, The International Panel on Climate Change’s (IPCC) Fifth Assessment Report (AR5) states clearly their belief that the Efficacy (E) of solar forcing (E Solar ) is approximately equal to (E GHG ) in Working Group 1 (WG1) Chapter 8.1.1.3. It has been suggested that the top fraction of a millimetre of the ocean is heated by the long wave radiation (LWR) reemitted by GHGs and that this either acts as a blanket slowing the release of energy to the atmosphere or alternatively is comprehensively mixed by wave action and that these entirely different mechanisms warm the oceans almost exactly the same amount as solar energy which is transported radiatively to a depth of many meters. … Not only is it highly improbable that these entirely different mechanisms would have almost exactly the same effect on OHC, it can, also, be shown by means of a simple experiment, “Appendix 1”, that nearly all the Long Wave GHG energy is returned almost immediately to the atmosphere and space as latent heat of evaporation.”
“What can be said is that LWIR from GHGs will have a different and smaller effect on OHC than a similar amount of solar radiation as the LWIR is nearly totally absorbed in the evaporation layer while nearly all short wave solar radiation is not. … Where water is free to evaporate, test “A” shows that back radiation from GHGs will have a negligible effect on the heat content of that water. Test “B” shows that nearly all the energy from an increase in back radiation from GHGs is returned to the atmosphere as latent heat of evaporation. It follows that any Radiative flux change at the TOA will likely be restored more quickly if it is caused by a change in GHG forcing than if it is caused by a change in solar forcing.”
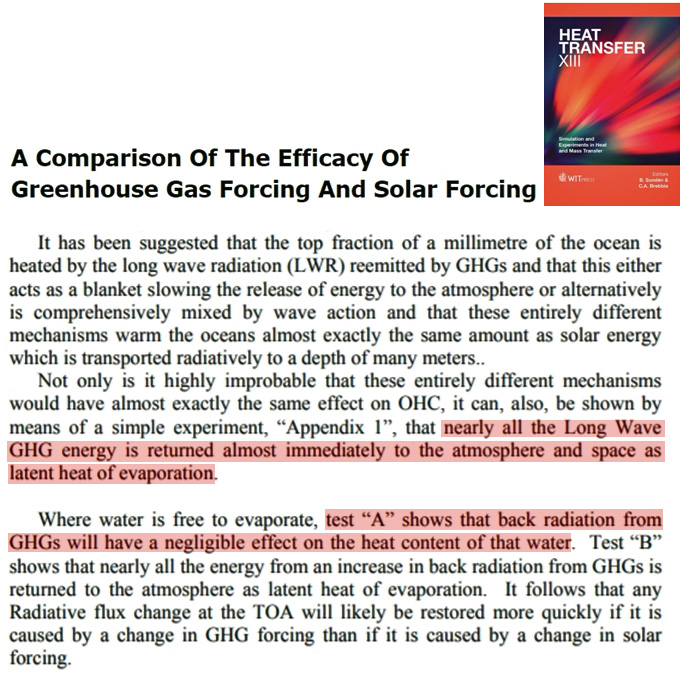

Ellis and Palmer, 2016
Hansen determined that between the LGM CO2 concentration of 180 ppm and the pre-industrial concentration of 280 ppm, the extra feedback provided by CO2 was about 2.25 W/m2, which increases to about 3 W/m2 when other factors are included (Hansen et al., 2012, Fig. 5c and p9). The IPCC data gives a similar figure of 2.8 W/m2 for all greenhouse gases, but neither of these values include water vapour feedbacks (IPCC AR4 6.4.1.2, AR5 box 8.1 and Table 9.5). But since interglacial warming events average about 5000 years this represents just 0.006 W/m2 per decade of additional feedbacks and warming, which is about a third of the energy required to power a honey bee in flight (Roberts and Elekonich, 2005). … [I]nterglacial warming is eccentricity and polar ice regrowth regulated, Great Summer forced, and dust-ice albedo amplified. And the greenhouse-gas attributes of CO2 play little or no part in this complex feedback system.
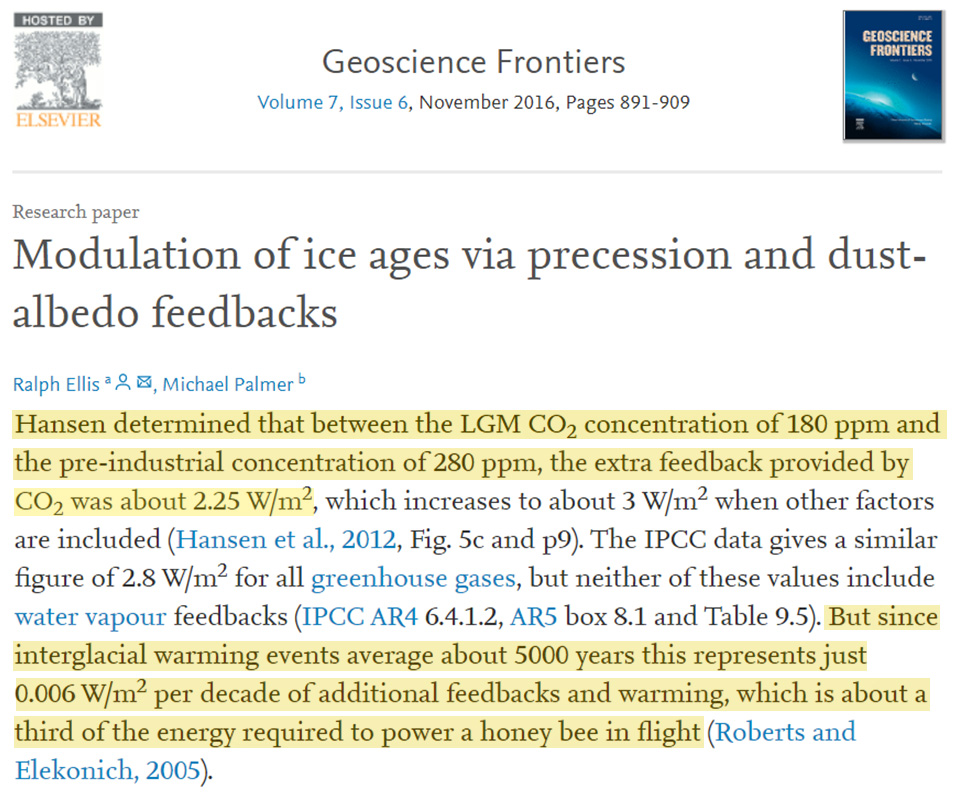
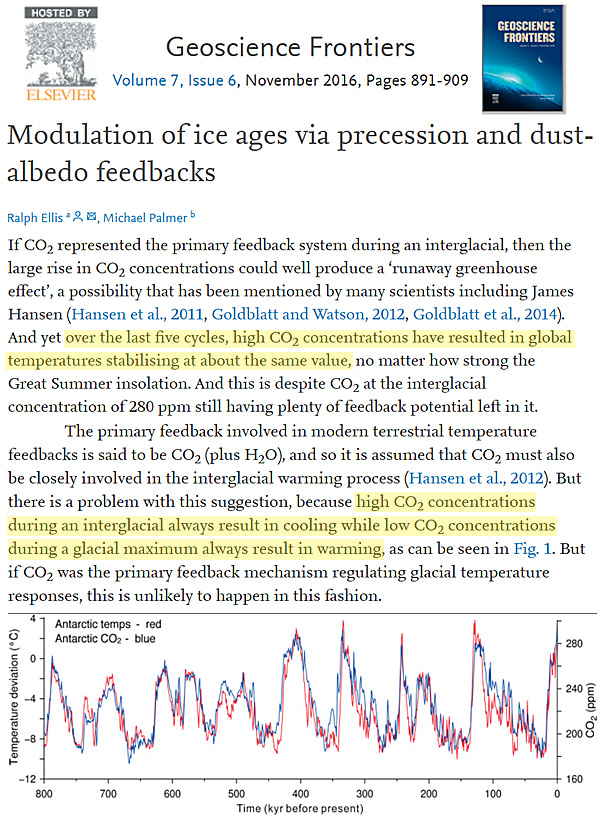
Reilly et al., 1989
![]()
Wagoner et al., 2010
Our results demonstrate that the temperature rise observed in popular classroom demonstration arises not from the radiative greenhouse effect responsible for global warming but primarily from the suppression of convective heat transport between CO2 and air due to the density difference between the two. A simple analytical mode for estimating the magnitude of the radiative greenhouse effect is presented, and the effect is shown to be very small for most tabletop experiments. … The magnitude of the radiative effect [of CO2] is more than an order of magnitude smaller [than its impact due to molecular density] and is difficult to demonstrate convincingly.
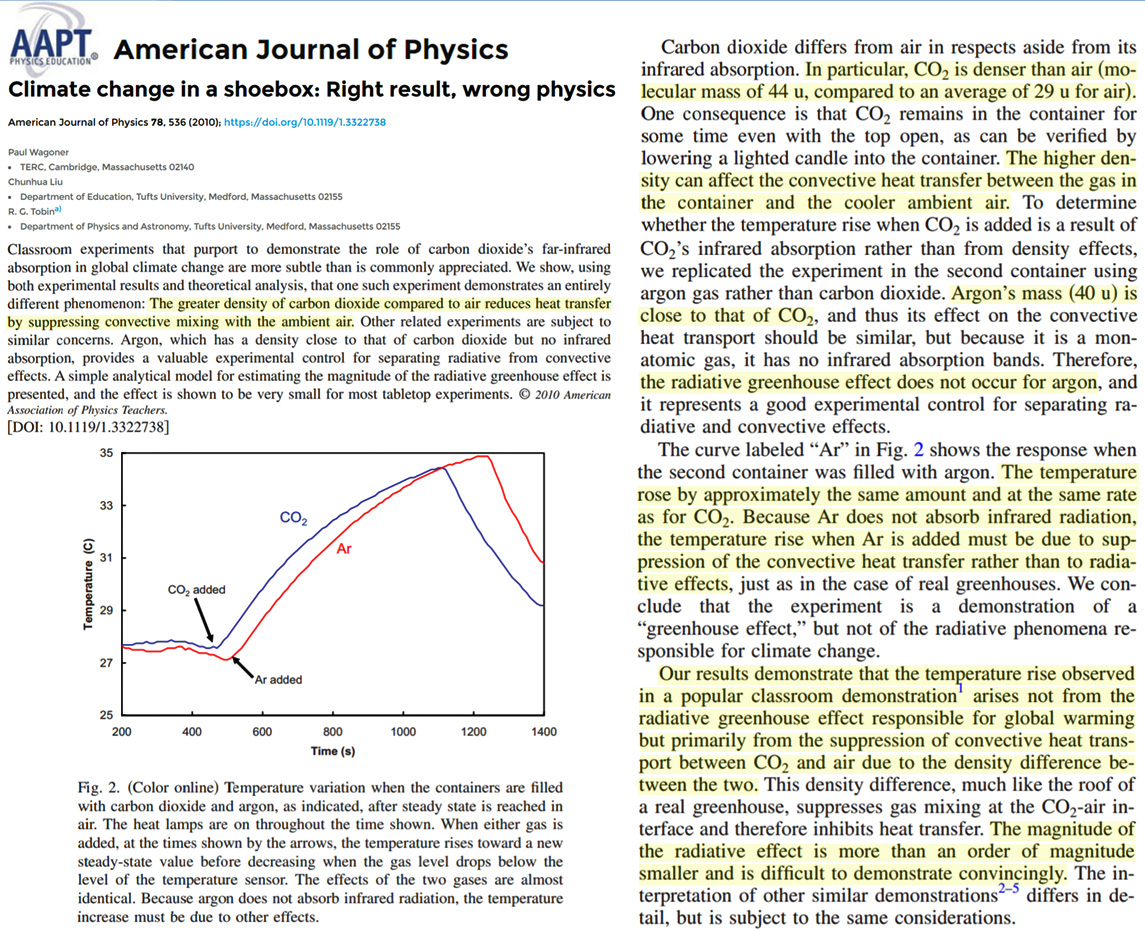
Seim and Olsen, 2020
• [T]he idea that backscatters from CO2 is the main driver of global temperatures might be wrong.
• [T]he temperature [in a thermophile] with [100%] CO2 increased slightly, about 0.5% [an additional 0.15°C for a container heated from 20°C to 50°C].
• We do not observe any significant difference in the two curves due to the increase in the CO2 concentration from ca. 400 ppm to about 100% in the front chamber.
• The results of our study show the near-identical heating curves when we change from air [N2, O2] to 100% CO2 or to Argon gas with low CO2 concentration.
• The warming of the Al-plate was also measured, but no extra heating was found by filling CO2 in the front chamber.
• These findings might question the fundament of the forcing laws used by the IPCC.
[T]he idea that backscatters from CO2 is the main driver of global temperatures might be wrong. … The results of our study show the near-identical heating curves when we change from air to 100% CO2 or to Argon gas with low CO2 concentration. … We do not observe any significant difference in the two curves due to the increase in the CO2 concentration from ca 400 ppm to about 100% in the front chamber. … No measurable extra heating of the rear wall was found with CO2 in the front chamber. The warming of the Al-plate was also measured, but no extra heating was found by filling CO2 in the front chamber. … For heating the air in the rear chamber from 20°C to 50°C then the temperature increment, with [100%] CO2 in the front chamber, should be ca. 0.15°C.
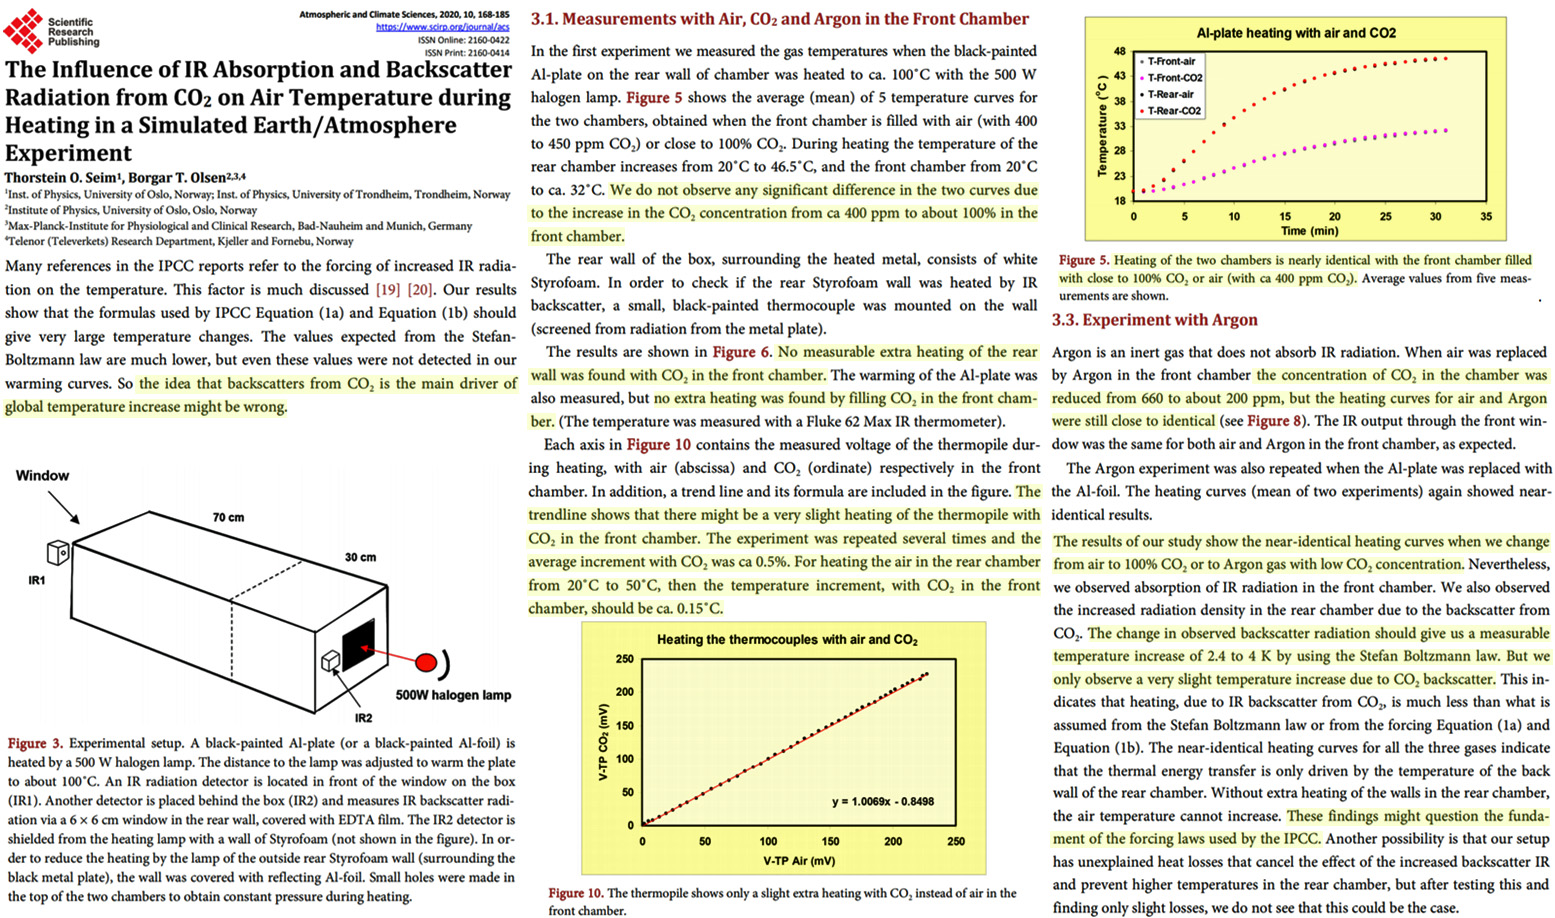
Mulholland and Wilde, 2020
[W]e have demonstrated that the presence of a greenhouse gas in the atmosphere is not an a priori requirement for the retention of energy within a climate system. … [W]hen we add the process of adiabatic energy transfer from the lit side, then the requirement of the current paradigm for back radiation greenhouse gas heating is no longer necessary.
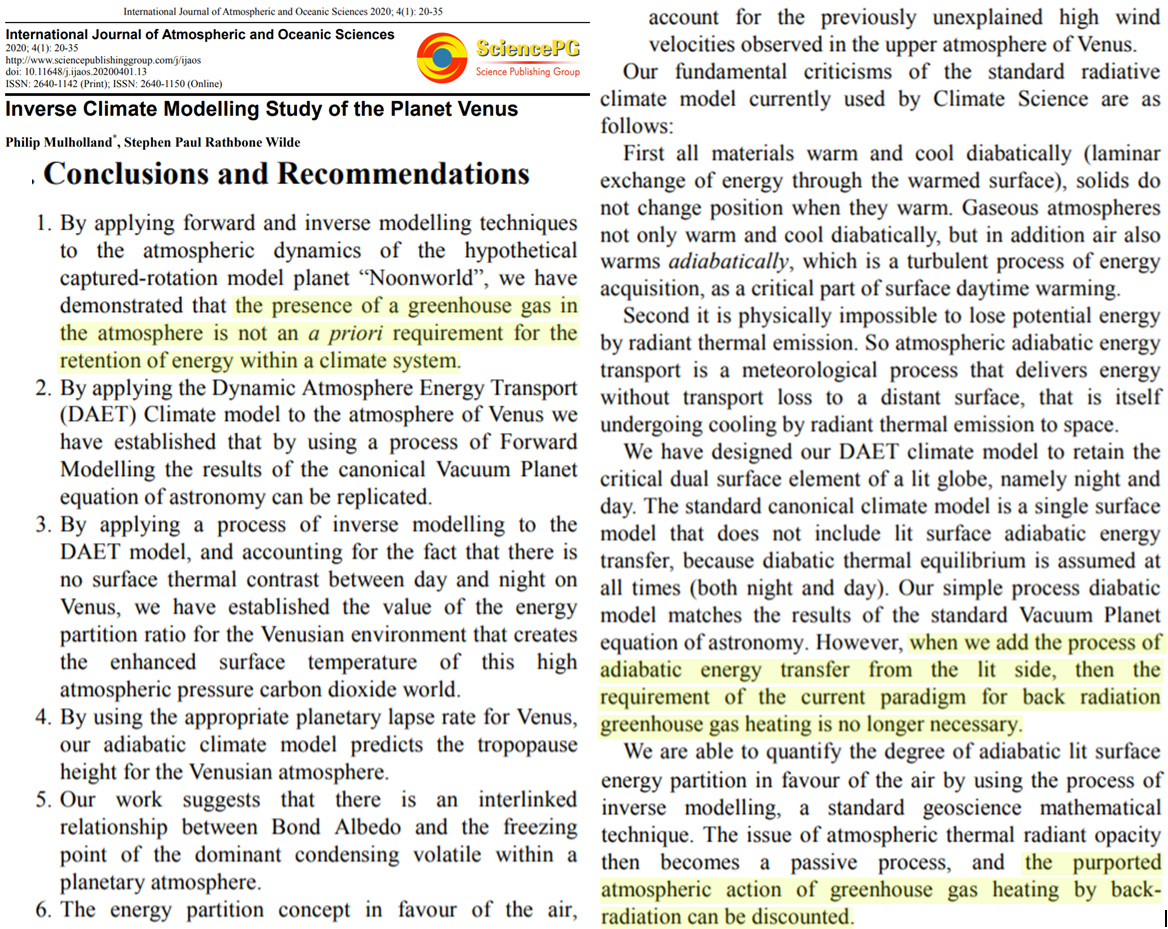
Arrak, 2011
Arctic Warming is Not Greenhouse Warming
After two thousand years of slow cooling Arctic, warming suddenly began more than a century ago. It has continued, with a break in the middle, until this day. The rapid start of this warming rules out the greenhouse effect as its cause. Apparently the time scale of the accumulation of CO2 in the air and the Arctic warming does not match. It is likely that the cause of this warming was a relatively sudden rearrangement of the North Atlantic current system at the turn of the century that directed warm currents into the Arctic Ocean. All observations of Arctic warming can be accounted for as consequences of these flows of warm water to the Arctic. This explains why all attempts to model Arctic warming have failed: Models set up for greenhouse warming are the wrong models for non-greenhouse warming. It turns out that satellites which have been measuring global temperature for the last 31 years cannot see any sign of current warming that supposedly started in the late seventies. This absence of warming in the satellite record is in accord with the observations of Ferenc Miskolczi on IR absorption by the atmosphere. What warming satellites do see is only a short spurt that began with the super El Nino of 1998, raised global temperature by a third of a degree in four years, and then stopped. It was of oceanic origin.
Robock, 1979
Carbon dioxide produced by fossil fuel burning does not seem to have had a significant effect on climatic change as yet. With it the results are slightly better for the entire record and slightly worse for the most recent portion. This conclusion should be qualified because there may be compensating anthropogenic influences such as aerosols, and the model tends to underemphasize the CO2 effect as compared to more sophisticated radiation models which treat the stratosphere explicitly
Fang et al., 2011
In recent decades, there have been a number of debates on climate warming and its driving forces. Based on an extensive literature review, we suggest that (1) climate warming occurs with great uncertainty in the magnitude of the temperature increase; (2) both human activities and natural forces contribute to climate change, but their relative contributions are difficult to quantify; and (3) the dominant role of the increase in the atmospheric concentration of greenhouse gases (including CO2) in the global warming claimed by the Intergovernmental Panel on Climate Change (IPCC) is questioned by the scientific communities because of large uncertainties in the mechanisms of natural factors and anthropogenic activities and in the sources of the increased atmospheric CO2 concentration. More efforts should be made in order to clarify these uncertainties.
Hertzberg et al., 2017
This study examines the concept of ‘greenhouse gases’ and various definitions of the phenomenon known as the ‘Atmospheric Radiative Greenhouse Effect’. The six most quoted descriptions are as follows: (a) radiation trapped between the Earth’s surface and its atmosphere; (b) the insulating blanket of the atmosphere that keeps the Earth warm; (c) back radiation from the atmosphere to the Earth’s surface; (d) Infra Red absorbing gases that hinder radiative cooling and keep the surface warmer than it would otherwise be – known as ‘otherwise radiation’; (e) differences between actual surface temperatures of the Earth (as also observed on Venus) and those based on calculations; (f) any gas that absorbs infrared radiation emitted from the Earth’s surface towards free space. It is shown that none of the above descriptions can withstand the rigours of scientific scrutiny when the fundamental laws of physics and thermodynamics are applied to them.
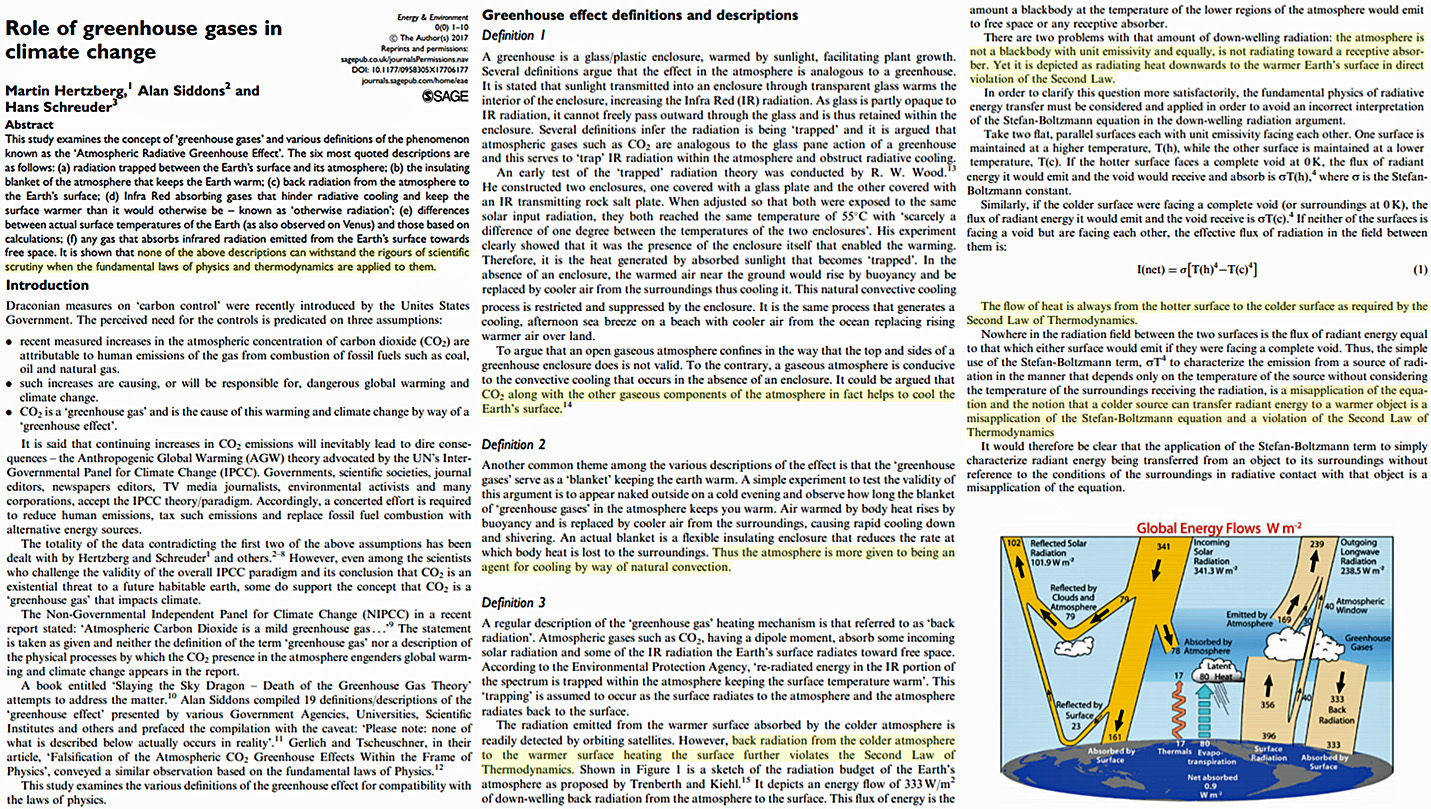
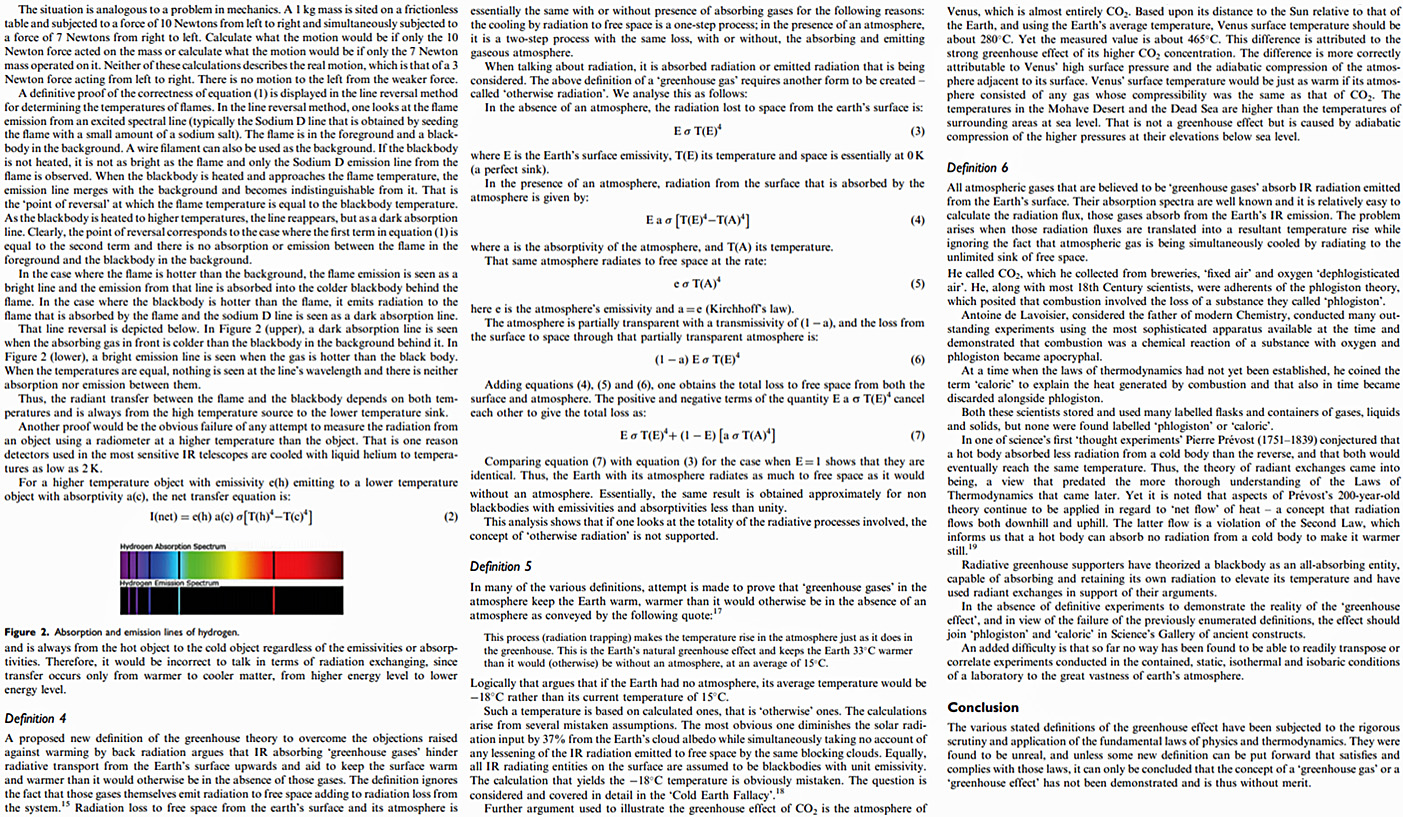
Sawyer, 1972
The output of human industry is still very much less than the total mass of the atmosphere and man-made energy is still small compared with the energy of meteorological systems. The total industrial output of heat each day is, for example, considerably less than 0.1% of the total kinetic energy of the atmosphere, which itself is destroyed by friction and replaced naturally within a few days. Another useful comparison is that of the total man-made heat output in Britain with natural processes over the same area. Even over this area of relatively intense human activity man’s efforts are relatively quite small – man-made heat is less than 1% of the energy received from the Sun. It also must be remembered that the mass of the atmosphere is enormous compared with the products of human activity. The total mass of the atmosphere is more than 500 times the mass of the known coal reserves, for example, and human activities will not change its chief constituents.
Even global mean temperatures have varied by 0.6°C from a minimum around 1880 to the last maximum around 1940. Against this background a change of 0.6°C by the end of the century [2000] will be not be easy to distinguish from natural fluctuations and certainly is not a cause for alarm. Even a doubling of the amount of carbon dioxide in the atmosphere, which would probably require the burning of a large part of the known fuel reserves, would appear to result in a rise of temperature little above that experienced in the climatic optimum which followed the last ice age.
Gerlich and Tscheuschner, 2009
By showing that (a) there are no common physical laws between the warming phenomenon in glass houses and the fictitious atmospheric greenhouse effects, (b) there are no calculations to determine an average surface temperature of a planet, (c) the frequently mentioned difference of 33°C is a meaningless number calculated wrongly, (d) the formulas of cavity radiation are used inappropriately, (e) the assumption of a radiative balance is unphysical, (f) thermal conductivity and friction must not be set to zero, the atmospheric greenhouse conjecture is falsified.
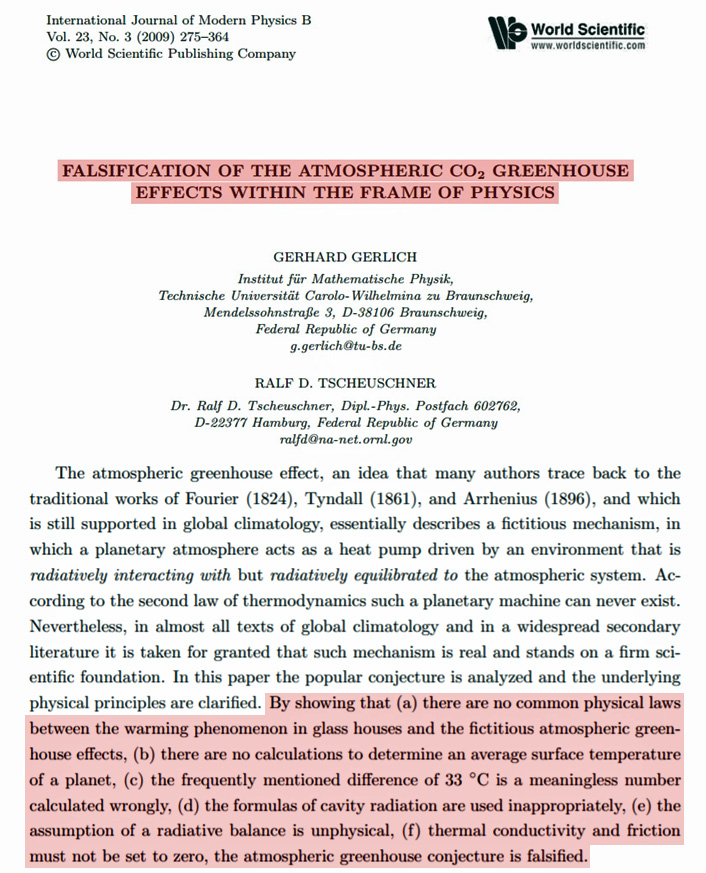
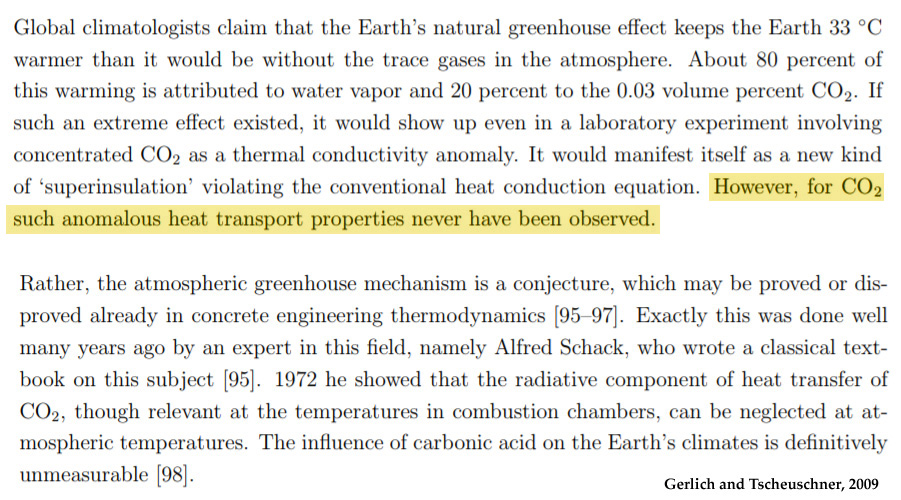
Gerlich and Tscheuschner, 2010
[O]ur falsification paper discusses the violation of fundamental physical and mathematical principles in 14 examples of common pseudo-derivations of fictitious greenhouse effects that are all based on simplistic pictures of radiative transfer and their obscure relation to thermodynamics, including but not limited to those descriptions (a) that define a “Perpetuum Mobile Of The 2nd Kind”, (b) that rely on incorrectly calculated averages of global temperatures, (c) that refer to incorrectly normalized spectra of electromagnetic radiation. Halpern et al. completely missed an exceptional chance to formulate a scientifically well-founded antithesis. They do not even define a greenhouse effect that they wish to defend. We take the opportunity to clarify some misunderstandings, which are communicated in the current discussion on the non-measurable, i.e. physically non-existing influence of the trace gas CO2 on the climates of the Earth.
Miskolczi, 2014
This paper presents observed atmospheric thermal and humidity structures and global scale simulations of the infrared absorption properties of the Earth’s atmosphere. These data show that the global average clear sky greenhouse effect has remained unchanged with time. A theoretically predicted infrared optical thickness is fully consistent with, and supports the observed value. It also facilitates the theoretical determination of the planetary radiative equilibrium cloud cover, cloud altitude and Bond albedo. In steady state, the planetary surface (as seen from space) shows no greenhouse effect: the all-sky surface upward radiation is equal to the available solar radiation. The all-sky climatological greenhouse effect (the difference of the all-sky surface upward flux and absorbed solar flux) at this surface is equal to the reflected solar radiation. The planetary radiative balance is maintained by the equilibrium cloud cover which is equal to the theoretical equilibrium clear sky transfer function. The Wien temperature of the allsky emission spectrum is locked closely to the thermodynamic triple point of the water assuring the maximum radiation entropy. The stability and natural fluctuations of the global average surface temperature of the heterogeneous system are ultimately determined by the phase changes of water. Many authors have proposed a greenhouse effect due to anthropogenic carbon dioxide emissions. The present analysis shows that such an effect is impossible.
Ollila, 2013
Some researchers have noticed that the warming calculations of Intergovernmental Panel on Climate Change (IPCC) are not always based on the atmospheres, which use the global average values. CO2 effect of 26% in greenhouse phenomenon is based on the modified U.S. Standard Atmosphere 1976 (USST 76 atmosphere) containing only 50% of water in comparison to the true value. The calculations prove that the warming of 0.76°C can be achieved if the USST 76 atmospheric model is applied and constant relative humidity (RH) assumed. The analysis also reveals that IPCC’s scenario presentation contains choices, which make the warming results look higher than they should be. All the climate sensitivity values above 1.7 °C conflict with the explanation given by IPCC for the 1750 – 2005 periods. The global warming potential (GWP) values of CH4 and N2O are applicable only for small concentration changes and in higher concentrations these greenhouse (GH) gases are even weaker than CO2. The ultimate worst case scenario is the release of methane from the methane clathrates on the ocean floor. The calculations show that the release would cause 2.1°C temperature increase, which is only 68% of the CO2 warming effect. The spectral analysis show that in the prevailing atmospheric conditions the warming potency of methane is about 14% from the potency of CO2, and the same of N2O is about 17%. The effect of water in the same conditions is 15.2 times greater than that of CO2.
Dyson, 1977
The magnitude of this negative feed-back effect of atmospheric CO2 upon itself depends on many ecological interactions which have yet to be disentangled. The effect could be negligibly small, or it could be as large as 3 x 10⁹ tons of carbon per yr. In summary, there is insufficient evidence to decide whether the carbon content of the biosphere has decreased, increased or remained stationary in response to the manifold human activities of recent decades. There exists a huge literature attempting to assess or to prognosticate the effects of the increasing atmospheric CO2 on the climate of the earth. Such attempts are useful and necessary, hut they run into formidable technical difficulties. Even the mean global temperature rise caused by a given quantity of CO2 is subject to great uncertainty: and the effects of CO2 on local and time-variable phenomena (which may be crucially important to agriculture and other human activities) are more uncertain still. It is possible that the rise in CO2 will be on balance beneficial to mankind, especially in reducing climatic extremes in very cold and very dry regions.
Hertzberg and Schreuder, 2016
The authors evaluate the United Nations Intergovernmental Panel on Climate Change (IPCC) “consensus” that the increase of carbon dioxide in the earth’s atmosphere is of anthropogenic origin and is causing dangerous global warming, climate change and climate disruption. They conclude that the data do not support that supposition. Most of the currently accepted scientific interpretations are examined and the given impression that increased atmospheric carbon dioxide will increase the earth’s surface and/or air temperature is questioned. New insight is offered drawing a conclusion that no additional warming is possible due to the increase of atmospheric carbon dioxide. Acceptance of that IPCC paradigm is incurring costly and draconian efforts to reduce CO2 emissions, tax such emissions and replace fossil fuel combustion by alternative energy systems whether such alternatives will achieve the desired results or not. The totality of the data available on which that theory is based is evaluated here, from Vostok ice core measurements, to residence time of CO2 in the atmosphere, to more recent studies of temperature changes that inevitably precede CO2 changes, to global temperature trends, to the current ratio of carbon isotopes in the atmosphere, to satellite data for the geographic distribution of atmospheric CO2, to the effect of solar activity on cosmic rays and cloud cover. Nothing in the data supports the supposition that atmospheric CO2 is a driver of weather or climate, or that human emissions control atmospheric CO2. Furthermore, CO2 is not a pollutant, but an essential ingredient of the Earth’s ecosystem on which almost all life depends via photosynthesis. This paper rejects the new paradigm of “climate science” and asserts that the traditional, century old meteorological concepts for the factors that control weather and climate remain sound but need to be reassessed.
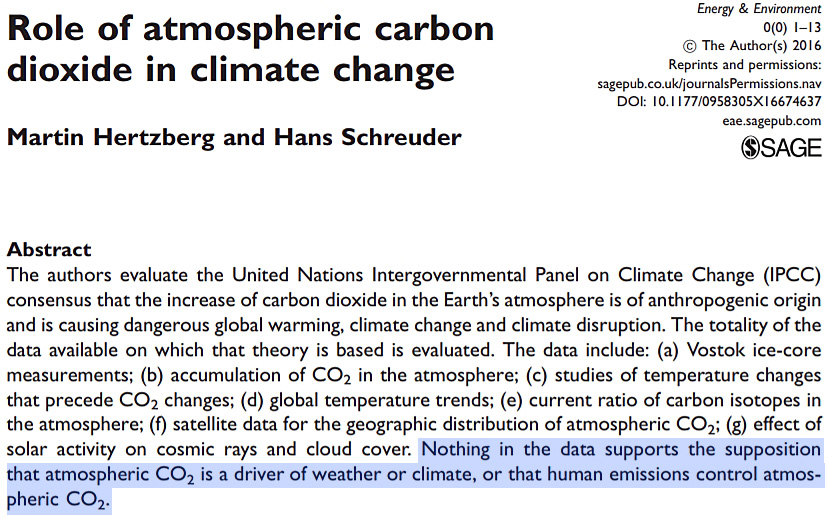
Avakyan, 2013
The author associates the recently observed climate warming and carbon dioxide concentration growth in the lower atmospheric layers with variations of solar-geomagnetic activity in global cloud formation and the significant decrease in the role of forests in carbon dioxide accumulation in the process of photosynthesis. The contribution of the greenhouse effect of carbon-containing gases to global warming turns out to be insignificant.
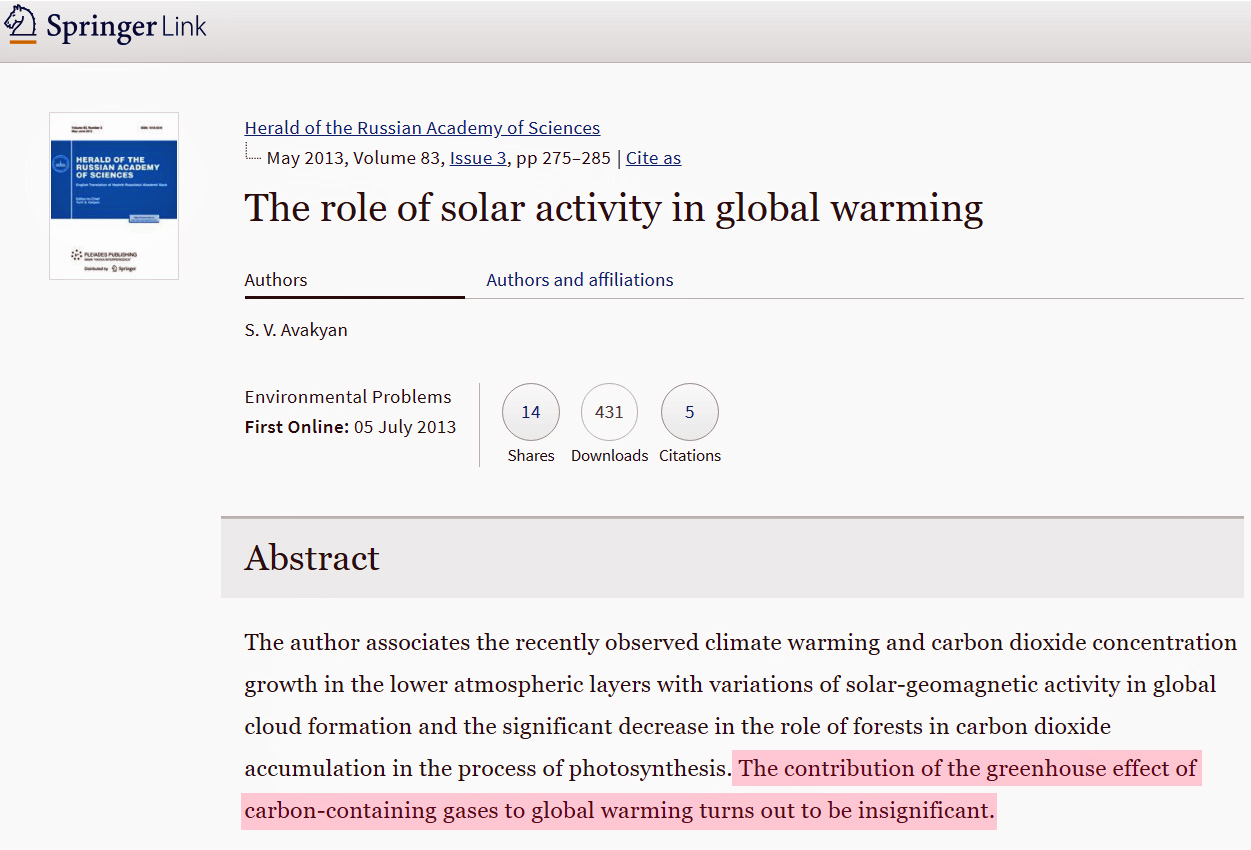
Zhao, 2011
Although there is little controversy about global warming, there is still a debate regarding whether global warming is mainly due to anthropogenic greenhouse gas emissions. Many researchers strongly believe that global warming is mainly due to greenhouse gas emissions. However, other scientists argue that the standard models overstate the importance of CO2 emissions. We propose a reduced-form regression-based test. With the temperature and CO2 emissions data from the U.S., we find little evidence in support of the notion that recent global warming is mainly due to CO2 emissions. Our results, therefore, call for more research on the causes of recent global warming.
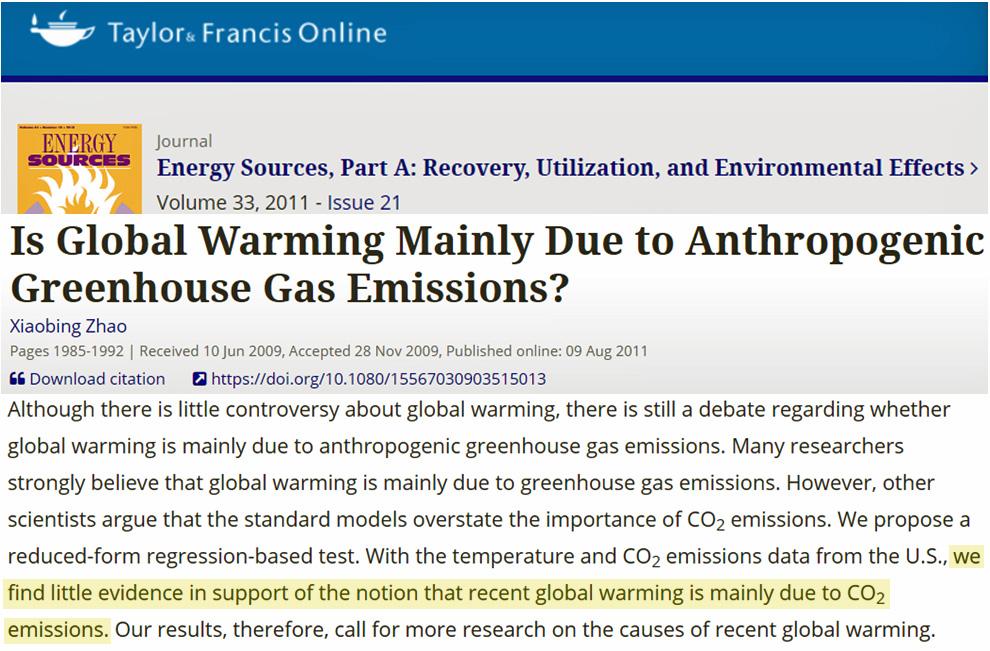
Allmendinger, 2017
Besides a critical discussion of the convenient atmosphere theory profoundly questioning the greenhouse thesis by disclosing several basic errors, the here reported investigation reveals the discovery of direct absorption of shortwave IR-radiation by air. It is part of the incident solar light, but also of artificial light which enables a more exact detection. It is caused by another effect than the one which is responsible for the longer-wave absorption being observed at carbon dioxide, and it is not detectable by IR-spectroscopy since its absorption coefficient is too low. However, it is clearly detectable by means of the here applied apparatus leading to a distinct temperature elevation up to a limiting temperature which depends on the radiative emission. The limiting temperature depends on the gas kind, whereby practically no difference between air and carbon-dioxide could be found.
Nevertheless, that direct absorption effect [shortwave] which was discovered thanks to this method probably contributes significantly to the warming up of the atmosphere while the warming-up due to carbon-dioxide can be neglected.
But since the direct absorption cannot be influenced, the surface albedo must be focused as the governing factor providing the only [anthropogenic] opportunity to mitigate the climate, or at least the microclimate, by changing colour and structure of the surface, particularly in urban areas. However, a prediction seems not feasible since the global climate is too complex. But the greenhouse theory turns out to be a phantasm delivering the wrong diagnosis for the climate change, and a wrong diagnosis cannot enable a healing.
Fleming, 2018
The results of this review point to the extreme value of CO2 to all life forms, but no role of CO2 in any significant change of the Earth’s climate. … There is no correlation of CO2 with temperature in any historical data set that was reviewed. The climate-change cooling over the 1940–1975 time period of the Modern Warming period was shown to be influenced by a combination of solar factors. The cause of the Medieval Warm Period and the Little Ice Age climate changes was the solar magnetic field and cosmic ray connection. When the solar magnetic field is strong, it acts as a barrier to cosmic rays entering the Earth’s atmosphere, clouds decrease and the Earth warms. Conversely when the solar magnetic field is weak, there is no barrier to cosmic rays—they greatly increase large areas of low-level clouds, increasing the Earth’s albedo and the planet cools. The factors that affect these climate changes were reviewed in “Solar magnetic field/cosmic ray factors affecting climate change” section. The calculations of “H2O and CO2 in the radiation package” section revealed that there is no net impact of CO2 on the net heating of the atmosphere. The received heat is simply redistributed within the atmospheric column. This result is consistent and explains the lack of CO2 correlations with observations in the past. The current Modern Warming will continue until the solar magnetic field decreases in strength. If one adds the 350-year cycle from the McCracken result to the center of the Maunder Minimum which was centered in 1680, one would have a Grand Minimum centered in the year 2030.
(c) CO2 Rises as Greenhouse Effect Forcing Declines (1980s-2014)
Cess and Udelhofen, 2003
The greenhouse‐effect anomaly, ΔG, is shown in Figure 2d, again for 40°S to 40°N and again using both WFOV and ERBE/CERES scanner measurements. As for CCSM1, G was evaluated as 1 − (OLR/σTS4), with the annual‐mean and domain‐averaged TS4 determined from TS4 for individual 5° × 5° grids in the surface‐temperature data set [Jones et al., 2001]. Again there is excellent agreement between the WFOV and scanner measurements.
Unlike CCSM1 (Figure 1c), the negative trend of G indicates that the atmospheric greenhouse effect is temporally decreasing, despite the fact that greenhouse gasses are increasing. To understand this, the following three factors can impact G:
-
-
An increase in greenhouse gases, which is occurring [IPCC, 2001] and by themselves would increase G.
-
An increase in tropospheric water vapor, and possibly also a change in lapse rate, associated with the increasing trend in TS (Figure 2a). It is generally agreed that this increases the greenhouse effect and so acts as a positive climate feedback mechanism [IPCC, 2001; Held and Soden, 2000].
-
Clouds are a major contributor to the greenhouse effect and globally provide roughly 30 W/m2 of LW warming to the climate system [Ramanatthan et al., 1989]. So a change in cloudiness could have a major impact upon G. Either a decrease in cloud amount, or a reduction in cloud altitude resulting in warmer clouds that emit more LW radiation, would decrease G.
-
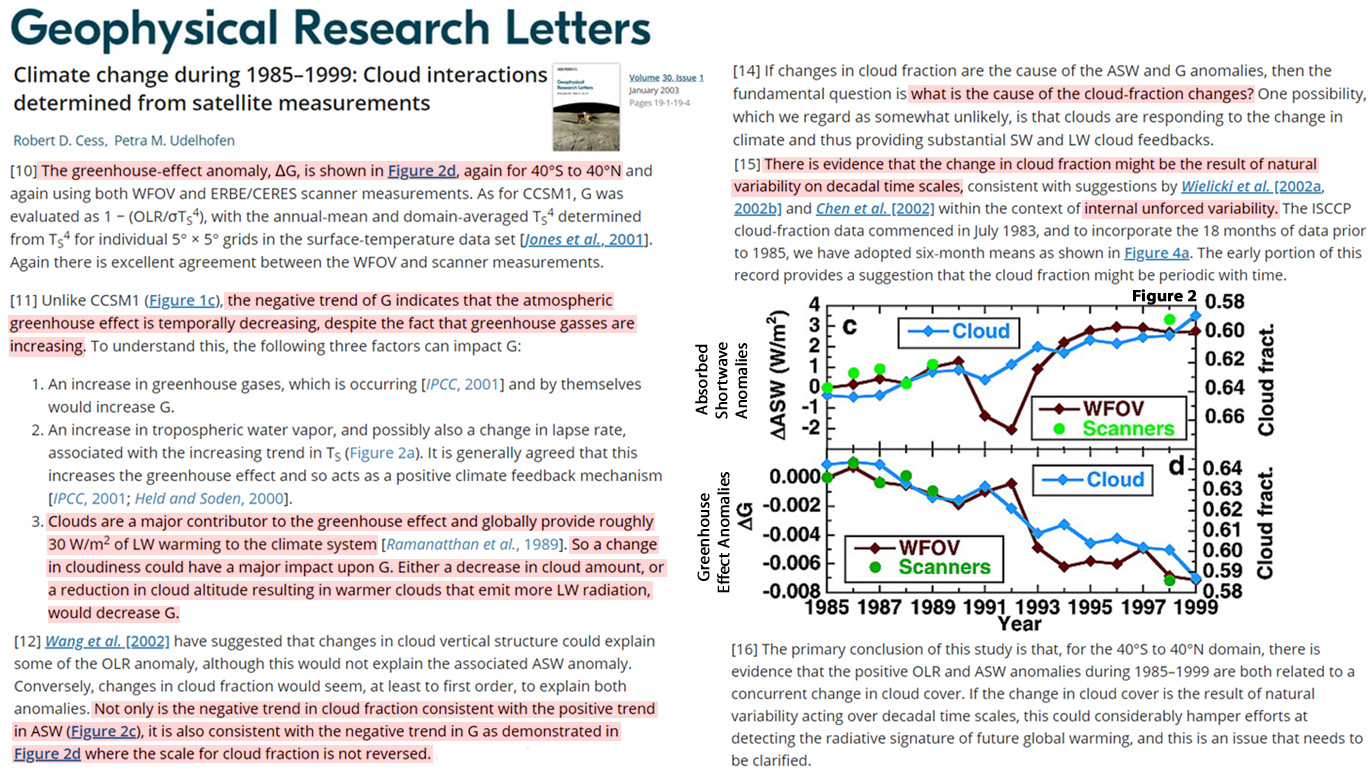
Song et al., 2016
The tendency of the averaged Gaa over the oceans also abruptly changes circa 1992. The oceanic Gaa [atmospheric greenhouse effect anomalies] exhibits a notable increasing trend with a rate of 0.21 W m−2 yr−1 in 1979–1991, whereas its rate of change (−0.04 W m−2 yr−1) during 1992–2014 is not statistically significant. … [A]n unchanged global averaged Gaa is shown during 1991–2002. In the last subperiod, the global averaged SULR anomaly remains trendless (0.02 W m−2 yr−1) because Ts stops rising. Meanwhile, the long-term change of the global averaged OLR [outgoing longwave radiation] anomaly (−0.01 W m−2 yr−1) is also not statistically significant. Thus, these two phenomena result in a trendless Gaa.
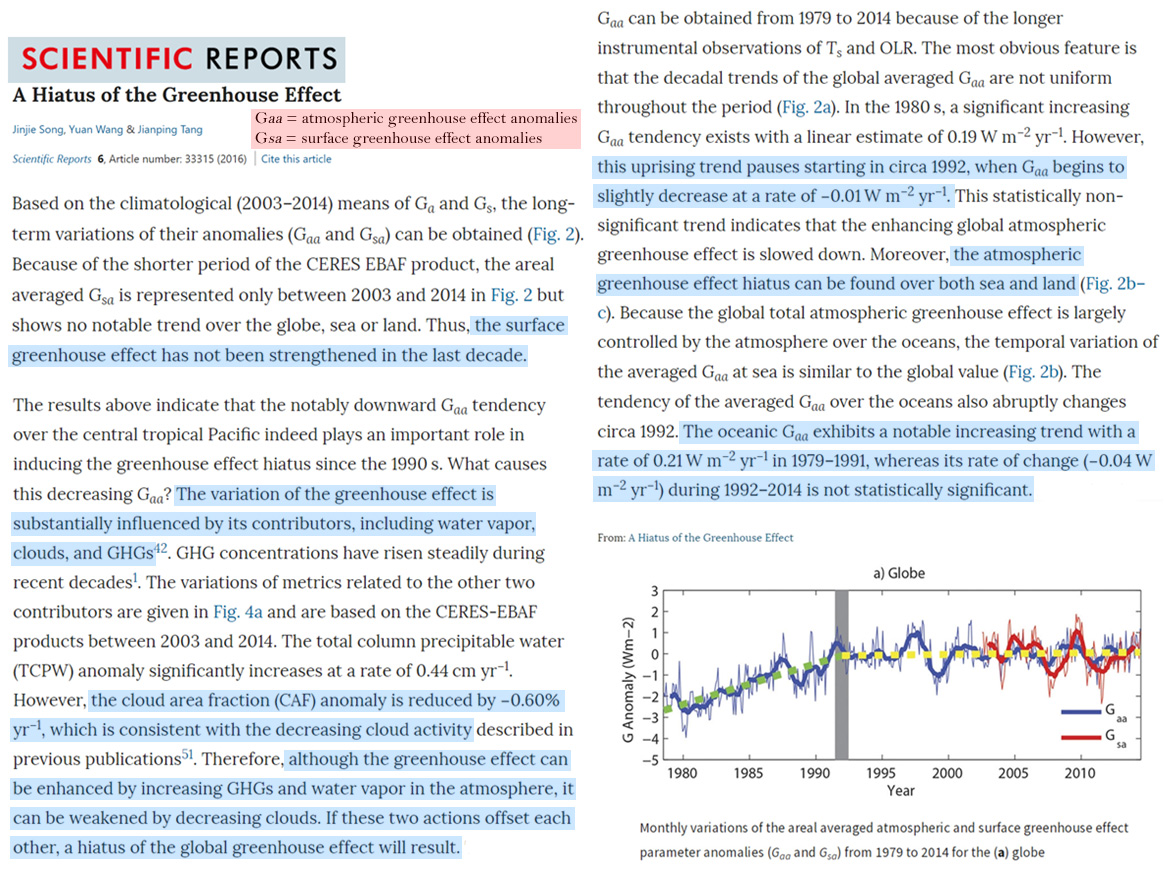
Swift, 2018
The model indicates an increase in absorbed solar radiation over the time period from 1979–2015 of the order of 3 W/m2, which was caused by a decrease in planetary bond albedo. The time-series albedo generated by the model is in agreement with Clouds and Earth’s Radiant Energy System (CERES) derived albedo over the period from 2000–2015. … … Since the surface flux shown in Figure 7e is the product of the greenhouse factor and absorbed solar insolation minus B, that is (P−B)/(1−ε), it is clear from the model that increasing absorbed solar radiation, caused by a lowering of the bond albedo, was the driver of increased surface temperature during the period 1979–2015, and also of the increase in ocean heat content, as shown in Figure 7b. … [A] decrease in atmospheric water content, apart from lowering atmospheric bulk emissivity, also leads to a decrease in cloud cover and therefore to a decrease in albedo.
Figure 7c shows the time-series behavior of the greenhouse factor. The model identifies a slight decrease in this value over the period, which is also reflected in Figure 7f, of atmospheric bulk emissivity. A decreasing greenhouse factor means a weakening of the greenhouse effect. … The model also indicates a slight decrease in atmospheric bulk emissivity over the same period. Since atmospheric bulk emissivity is a function of the sum of all of the greenhouse gas species, a simultaneous decrease in atmospheric water vapor may offset the effect of the well-documented increase in the non-condensing greenhouse gases over the period, and result in an overall net decrease in bulk emissivity. Atmospheric water vapor datasets partially support the conclusion, with the International Satellite Cloud Climatology Project (ISCCP) data supporting a decrease.
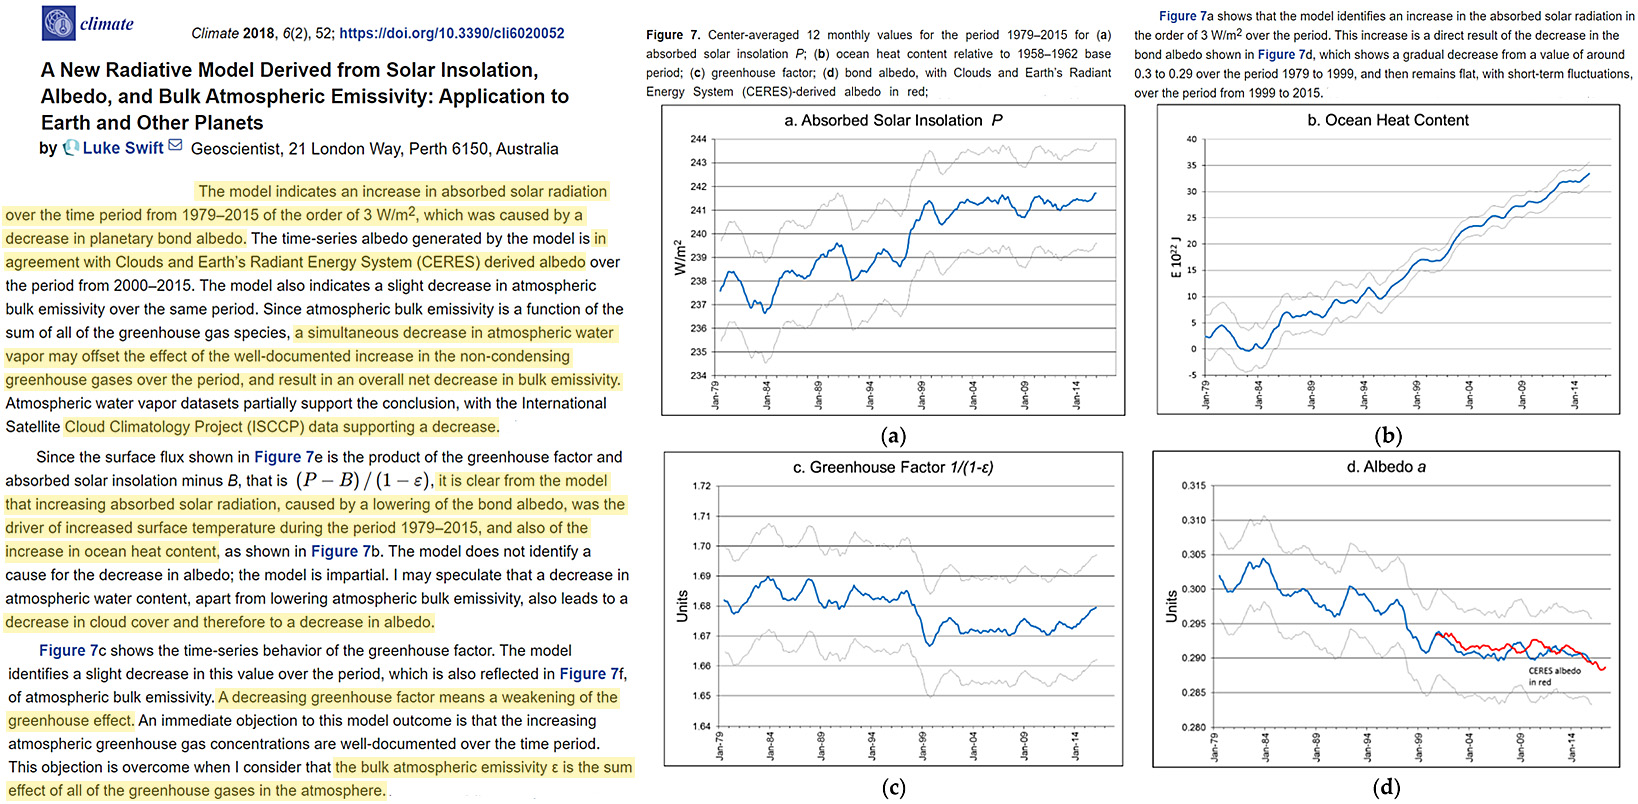
Miskolczi, 2023
The IR flux optical depth has no correlation with time and the strong signal of increasing atmospheric CO2 content in any time series is not present in the IR flux optical thickness data. Consequently, the atmospheric CO2 increase cannot be the reason for global warming. … The real atmosphere does not follow the GHG GE hypothesis of the IPCC. … More details are presented in Figure 14 where the no-feedback responses of some other GHGs are also displayed. The observed 23.6 % increase in CO2 causes -0.75 Wm-2 radiative imbalance (red dot). In the same time period, based on the NOAA-R1 archive the real change is 3.02 Wm-2 (blue dot). There is no such thing that the OLR remains constant and the surface warms up due to some incorrect GHG GE hypothesis, or because of the outcomes of CO2 doubling experiments conducted with never validated GCMs. … IPCC scientists ignore the fact that the clear sky OLR is governed by the unpredictable stochastic nature of the upper tropospheric humidity field (and also the global cloudiness and wind field) which cannot be modelled by any deterministic global climate model. The theoretical constraints governing the global mean radiation flux components are also not part of the GCMs. … The Arrhenius type greenhouse effect of the CO2 and other non-condensing GHGs is an incorrect hypothesis and the CO2 greenhouse effect based global warming hypothesis is also an artifact without any theoretical or empirical footing. … [T]he atmospheric CO2 increase cannot be the reason for global warming.
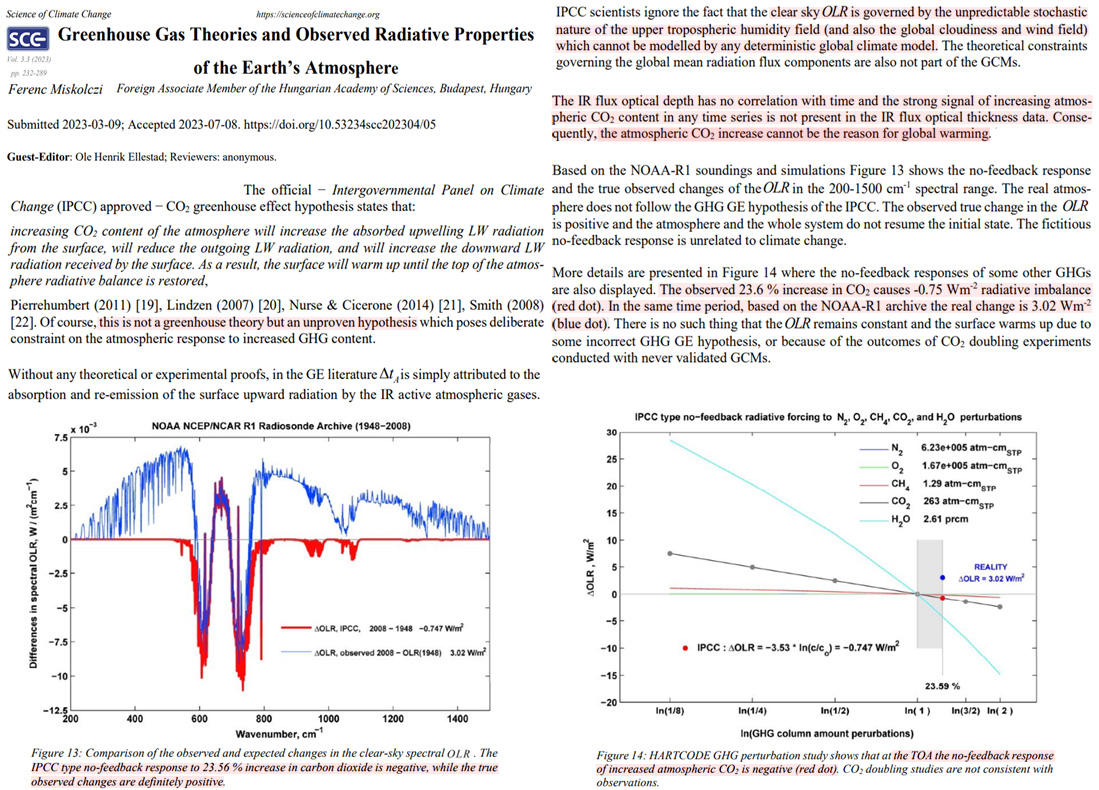
Kato et al., 2018
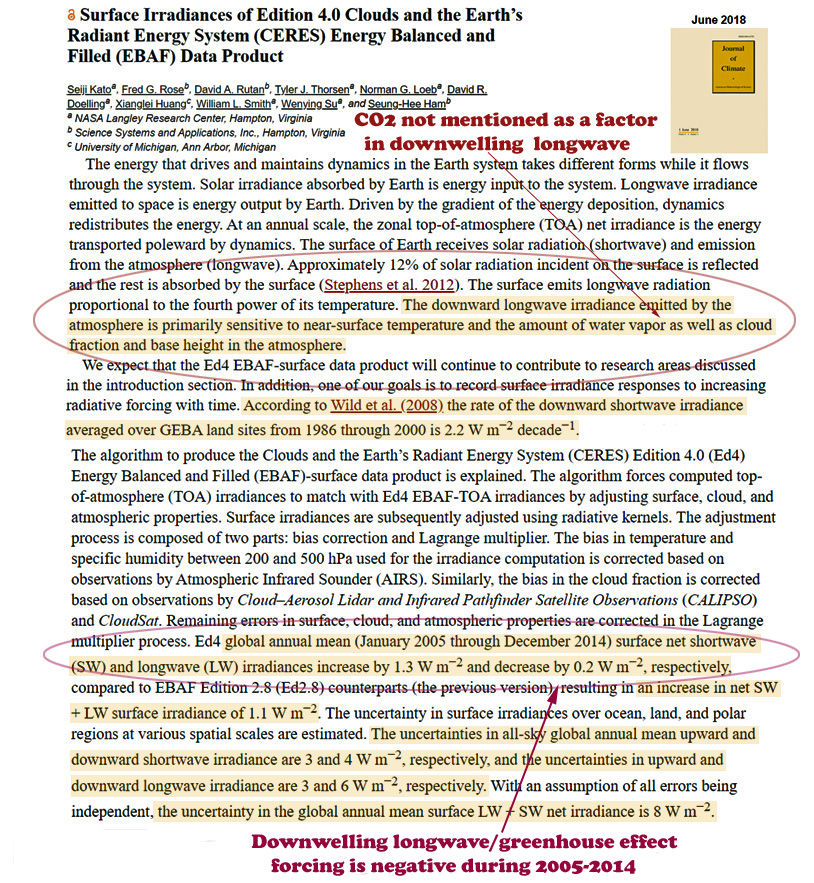
(d) Rising CO2 Causes Surface Cooling
Choudhury and Kukla, 1979
Impact of CO2 on cooling of snow and water surfaces
The levels of CO2 in the atmosphere are being increased by the burning of fossil fuels and reduction of biomass. It has been calculated that the increase in CO2 levels should lead to global warming because of increased absorption by the atmosphere of terrestrial longwave radiation in the far IR (>5 μm). From model computations, CO2 is expected to produce the largest climatic effect in high latitudes by reducing the size of ice and snow fields. We present here computations of spectral radiative transfer and scattering within a snow pack and water. The results suggest that CO2 significantly reduces the shortwave energy absorbed by the surface of snow and water. The energy deficit, when not compensated by downward atmospheric radiation, may delay the recrystallisation of snow and dissipation of pack-ice and result in a cooling rather than a warming effect.
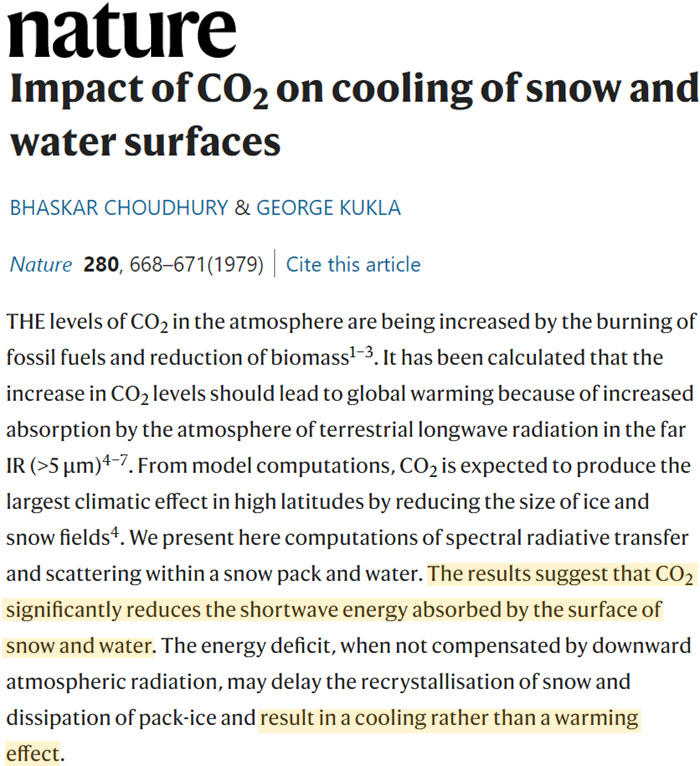
Idso, 1984
An analysis of northern, low and southern latitude temperature trends of the past century, along with available atmospheric CO2 concentration and industrial carbon production data, suggests that the true climatic effect of increasing the CO2 content of the atmosphere may be to cool the Earth and not warm it, contrary to most past analyses of this phenomenon. A physical mechanism is thus proposed to explain how CO2 may act as an inverse greenhouse gas in Earth’s atmosphere. However, a negative feedback mechanism related to a lowering of the planet’s mean surface albedo, due to the migration of more mesic-adapted vegetation onto arid and semi-arid lands as a result of the increased water use efficiency which most plants experience under high levels of atmospheric CO2, acts to counter this inverse greenhouse effect. Quantitative estimates of the magnitudes of both phenomena are made, and it is shown that they are probably compensatory. This finding suggests that we will not suffer any great climatic catastrophe but will instead reap great agricultural benefits from the rapid increase in atmospheric CO2 which we are currently experiencing and which is projected to continue for perhaps another century or two into the future.
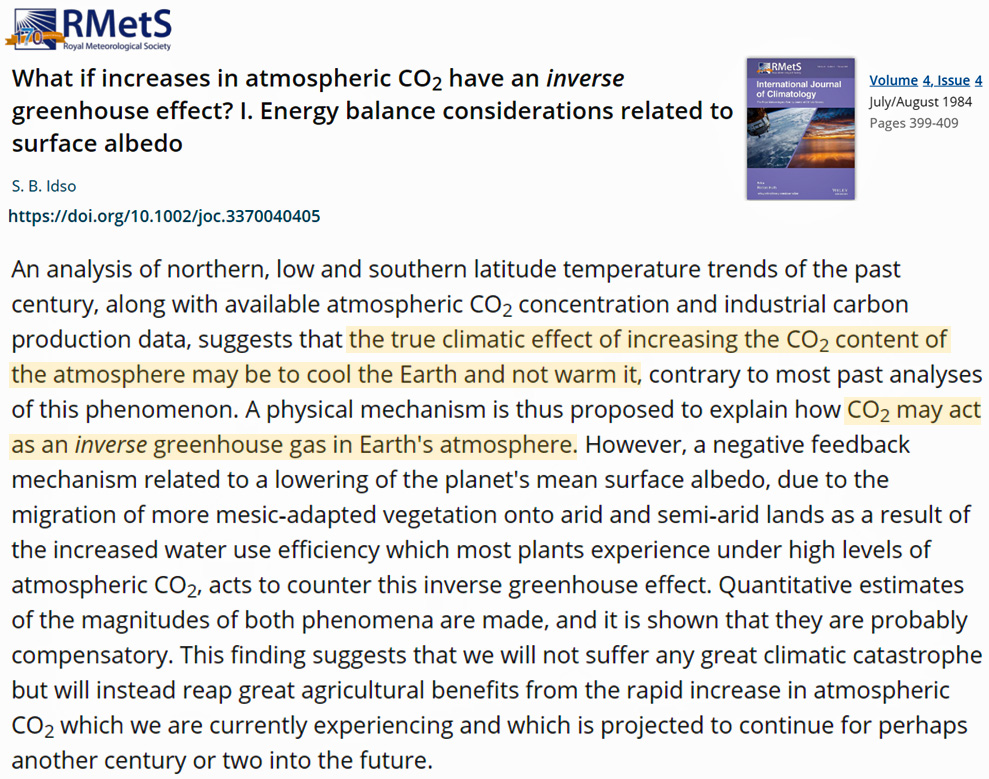
Ellsaesser, 1989
If additional greenhouse gases are added to the atmosphere, it is logical to expect that the greenhouse blanket will thicken; i.e., the average altitude from which the atmosphere emits energy to space will rise above its present level of 6 km. But, since the absorbed solar energy which has to be rejected remains essentially unchanged, the radiating temperature also must remain the same. That is, the average atmospheric temperature at the new higher level of the top of the greenhouse blanket must warm to the temperature existing now at the present top of the greenhouse blanket. And if the lapse rate remains the same, then the temperature of the Earth’s surface will also warm. This is a somewhat simplistic but physically valid picture of the mechanism by which increases in the greenhouse gas content of the atmosphere will lead to climatic warming. Unfortunately, this simple picture of how the greenhouse effect operates is of little help in quantifying the amount of warming to be expected. To see why this is so, examine Fig. 3 [p. 7]. This shows a terrestrial IR spectrum taken by Nimbus IV near Guam on 27 April 1970 on a background of temperature-labeled black body curves and with the wave length range of the principal atmospheric IR absorbers (emitters) indicated. It is obvious that water, including the dimer, (H2O)2 – believed to be responsible for the continuum absorption (and emission) of water vapor, is the principal emitter, without even considering the effect of clouds, which are also composed of water. And since this spectrum is taken at latitude 15.1°N, it appears quite credible that the global average temperature of this emitter is 255 K. On the other hand, the IR flux from the CO2 band centered near 15-microns, is both a small fraction of the total and is coming from an emitter with a temperature near 220 K (-50 to -55°C). Returning to Fig. 2, this temperature range is found in the altitude range 12 to 20 km. If the top of this CO2 greenhouse blanket were to be raised by the addition of CO2 and maintained at constant temperature, this would have little or no effect on the temperature at the surface and, if anything, might cause the surface to cool (i.e., if this radiating layer were pushed above 20 km without changing its temperature).
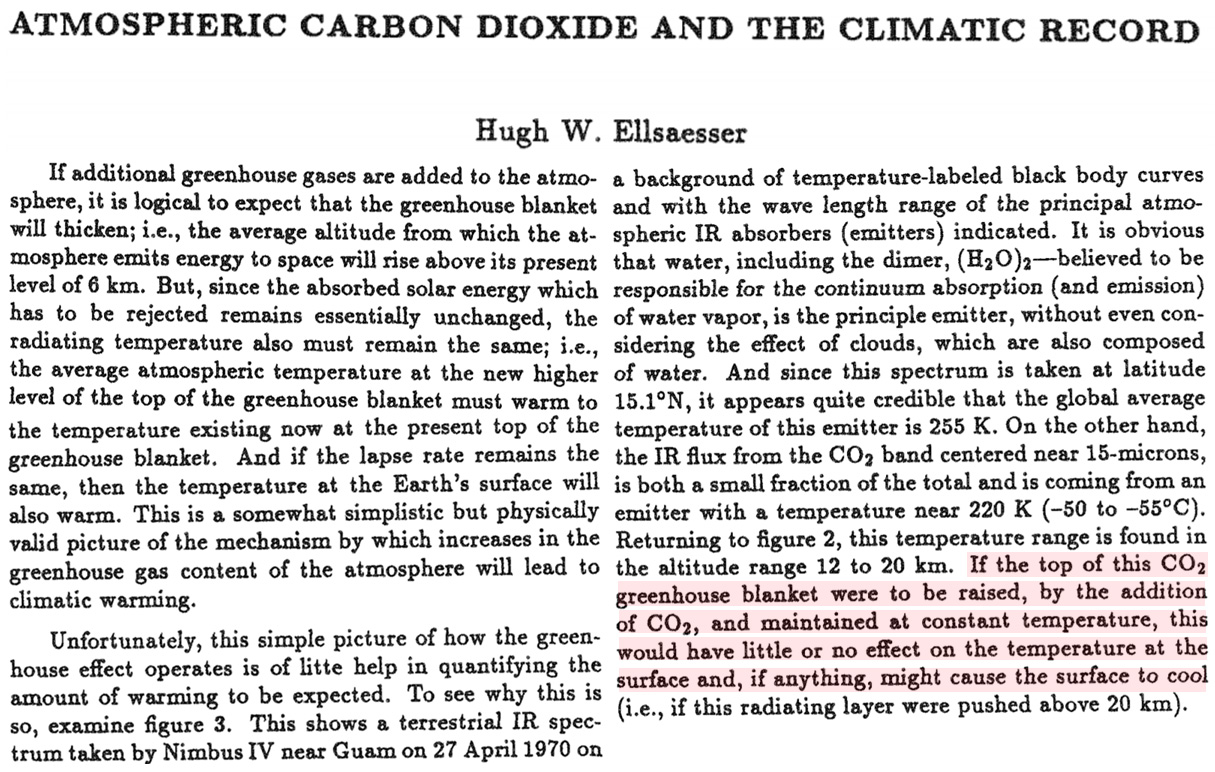
Zhang et al., 2020 (full paper)
The increased atmospheric air temperatures with CO2 concentration (ranging from 300 ppm to 7500 ppm) at daytime with higher radiation were understandable. Unexpectedly, the magnitude of temperature increase of atmospheric air in mesocosms with 16900 ppm CO2 declined significantly compared to that with 7500 ppm CO2 at daytime with higher radiation. In addition, the temperatures of atmospheric air in mesocosms with substantially higher CO2 concentration (ranging from 3200 ppm to 16900 ppm) were lower than that with the lower CO2 concentration (480 ppm) at early morning and/or nighttime with lower heat radiation. These results emphasized that the molecules of CO2 not only absorb the infrared radiation but also re-emit it to the surrounding space (20). Thus an increase of CO2 concentration in atmospheric air may result in either an increase or decrease of the air temperature in the atmosphere, depending on the balance of heat gain and loss. In other words, CO2 with substantially higher concentration may enhance the net heat loss to colder surrounding interfaces when the heat absorption capacity of CO2 was saturated or heat input was much limited.
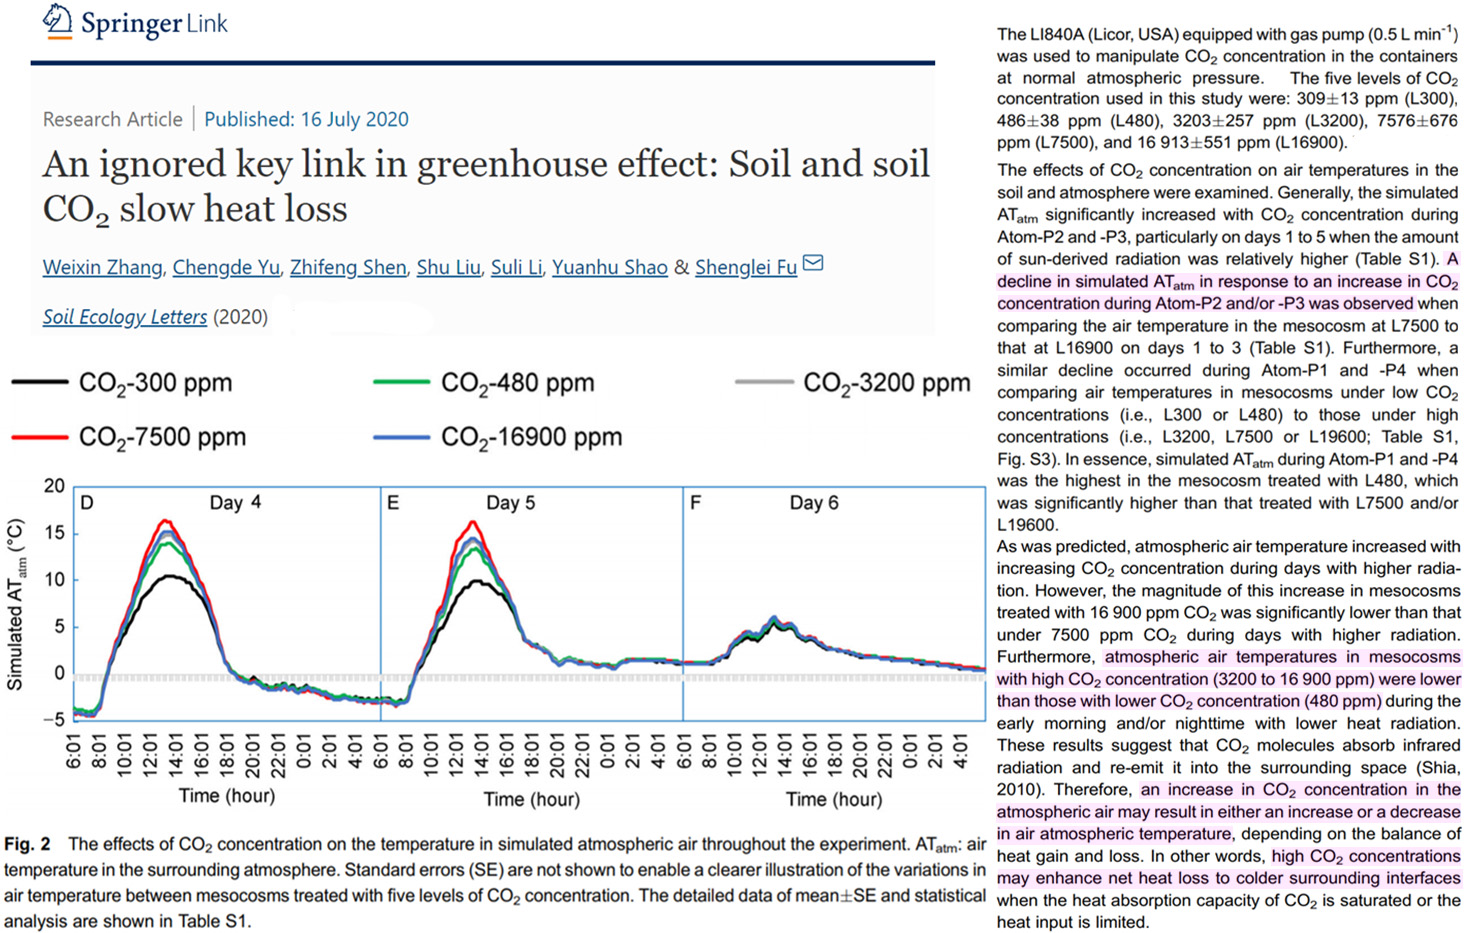
A simple mean hemispheric temperature model has been constructed in the form of a differential equation which is a function of three independent variables: carbon dioxide content of the air, volcanic ejecta and anthropogenic particulate pollution. This model appears to simulate the behavior of Northern Hemisphere mean temperatures as well as they are known and gives a different pattern of behavior for the Southern Hemisphere. By more completely accounting for those anthropogenic processes which produce both lower tropospheric aerosols and carbon dioxide, such as fossil fuel burning and agricultural burning, we calculate an expected slight decrease in surface temperature with an increase in CO2 content. Though an invariant “solar constant” was assumed, an unmistakable 20–25 year periodicity was found in the difference between the calculated and observed direct solar flux reaching the earth’s surface, suggesting a definite but small periodic variation in the solar constant.
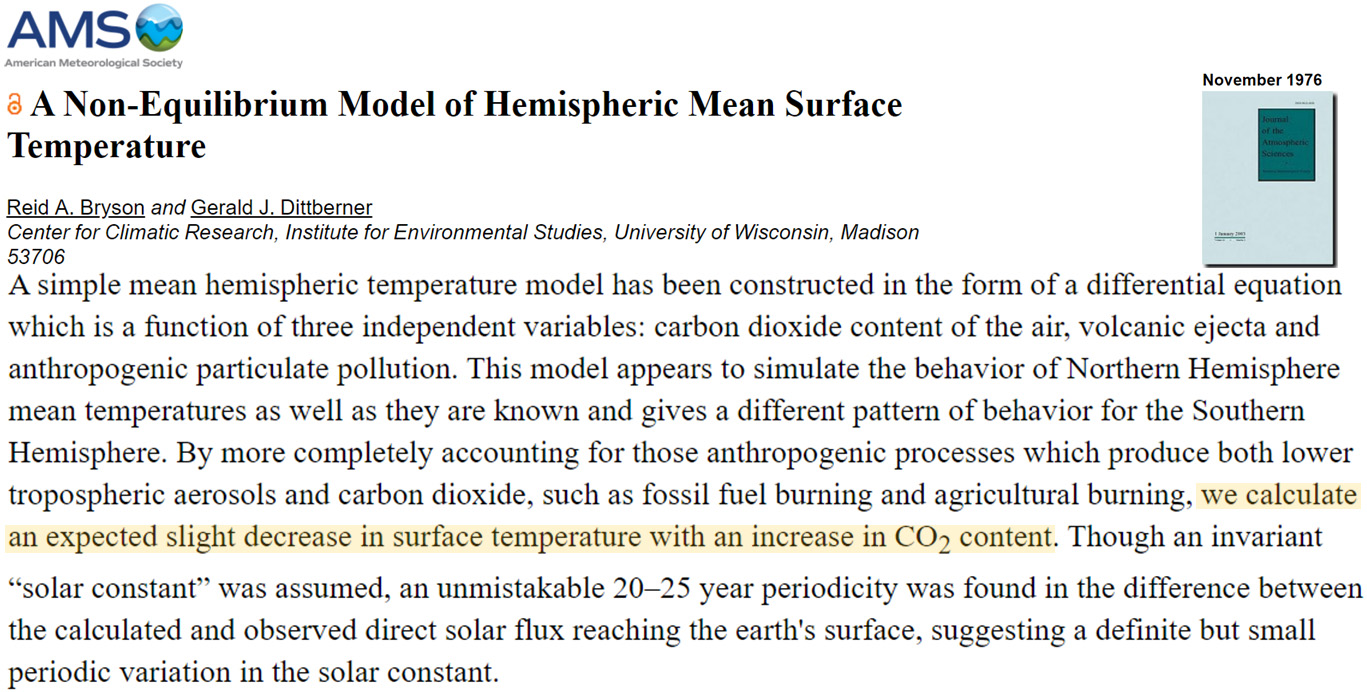
Schmithüsen et al., 2015
Abstract: For this region [central Antarctica], the emission to space is higher than the surface emission; and the greenhouse effect of CO2 is around zero or even negative, which has not been discussed so far. We investigated this in detail and show that for central Antarctica an increase in CO2 concentration leads to an increased long-wave energy loss to space, which cools the Earth-atmosphere system.
For most of the Antarctic Plateau, GHE-TES [greenhouse effect as measured by the Tropospheric Emission Spectrometer] is close to zero or even slightly negative; i.e., the presence of CO2 increases radiative cooling. Over Greenland, the greenhouse effect of CO2 is also comparatively weak but invariably positive. An evaluation of monthly averages of GHE-TES shows that the increased cooling due to CO2 of Antarctica is strongest during austral spring and autumn. … Central Antarctica is the only place on the planet where increased CO2 concentrations lead to an increased LW energy loss to space [cooling]. In the Northern Hemisphere the lowest, but invariably positive, [CO2] forcing values are seen over Greenland and Eastern Siberia.
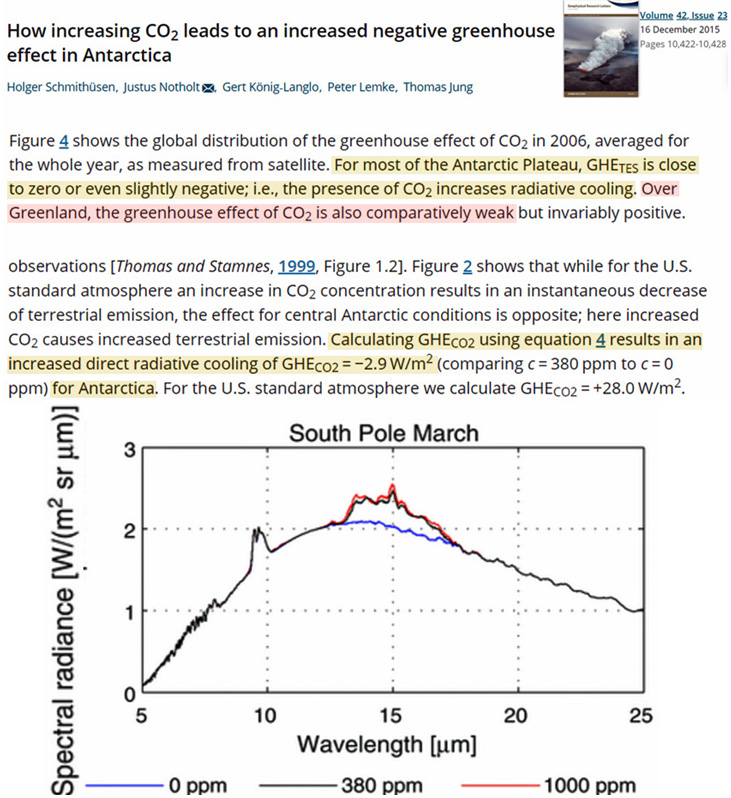
Sejas et al., 2018
Our analysis reveals that even given the same greenhouse gas mixing ratio, as indicated by the nearly uniform CO2 mixing ratio all over the globe, the sign of the GHE strongly depends on the vertical temperature gradient. This dependence on the vertical temperature profile is important, since it implies an increase (decrease) of greenhouse gases does not necessarily enhance (suppress) the GHE, as indicated by the negative radiative forcing produced by increasing the CO2 mixing ratio over the Antarctic Plateau. While the negative radiative forcing is not responsible for the weak but statistically insignificant surface cooling observed over the Antarctic Plateau, it may partially explain why greenhouse gas increases over Antarctica have not triggered a similar amplified warming response as in the Arctic and provides evidence that observed changes in Antarctica are currently driven by remote connections and internal climate variability. Moreover, the vertical temperature dependence implies that the strength of the GHE is determined by factors not limited to greenhouse gas mixing ratios. The seasonal temperature profile for example is heavily influenced by the solar insolation, while the strength of the surface inversion is also dependent on the dynamics.
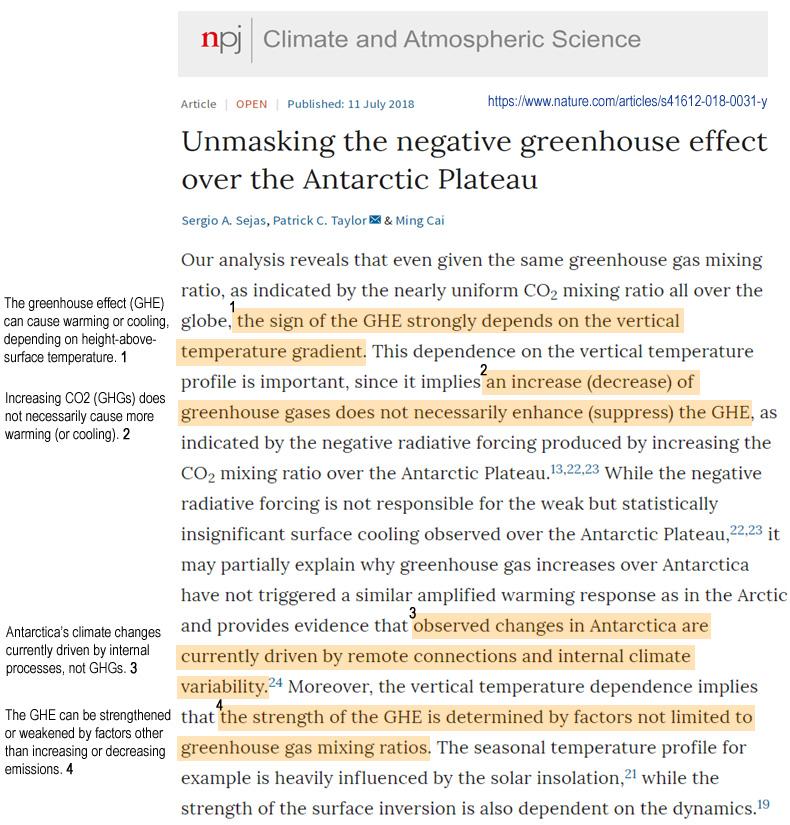
Chen et al., 2024
Negative TOA [top of atmosphere] forcing of CO2 increase [380 to 760 ppm] also happens outside of Antarctica. The Arctic sometimes exhibits strong negative CO2 forcing. This phenomenon even occurs in the tropics and mid-latitudes…
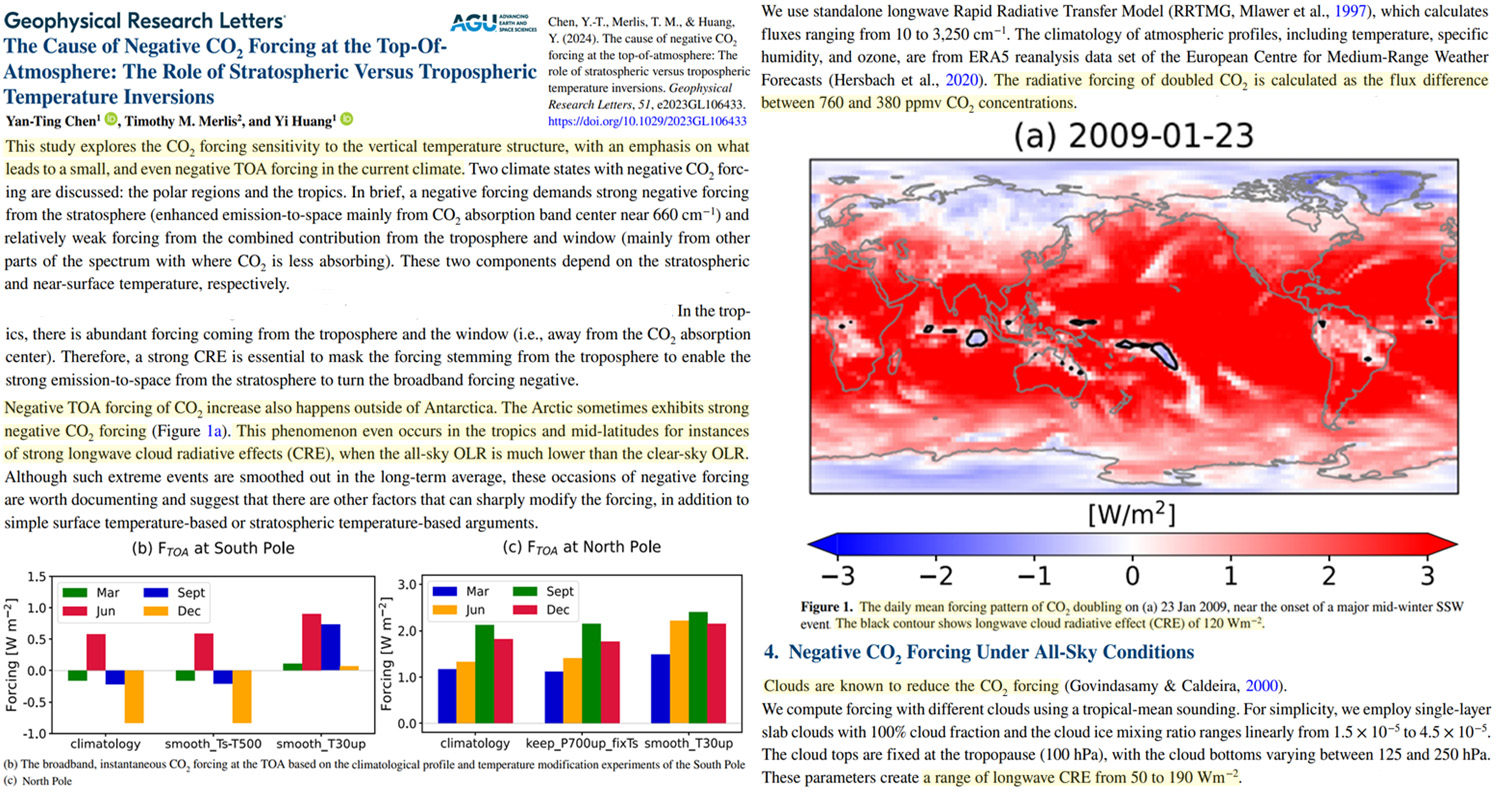


Recent Comments