Occasionally I see alarmists present the Marcott el paper (2013) as fact. But here is an appropriate rebuttal:
http://rogerpielkejr.blogspot.com/2013/03/fixing-marcott-mess-in-climate-science.html
Unmasking Marcott’s ‘Uptick’
Marcott’s 2013 Hockey Stick Debunked
By Marcott’s Own 2011 Ph.D Thesis
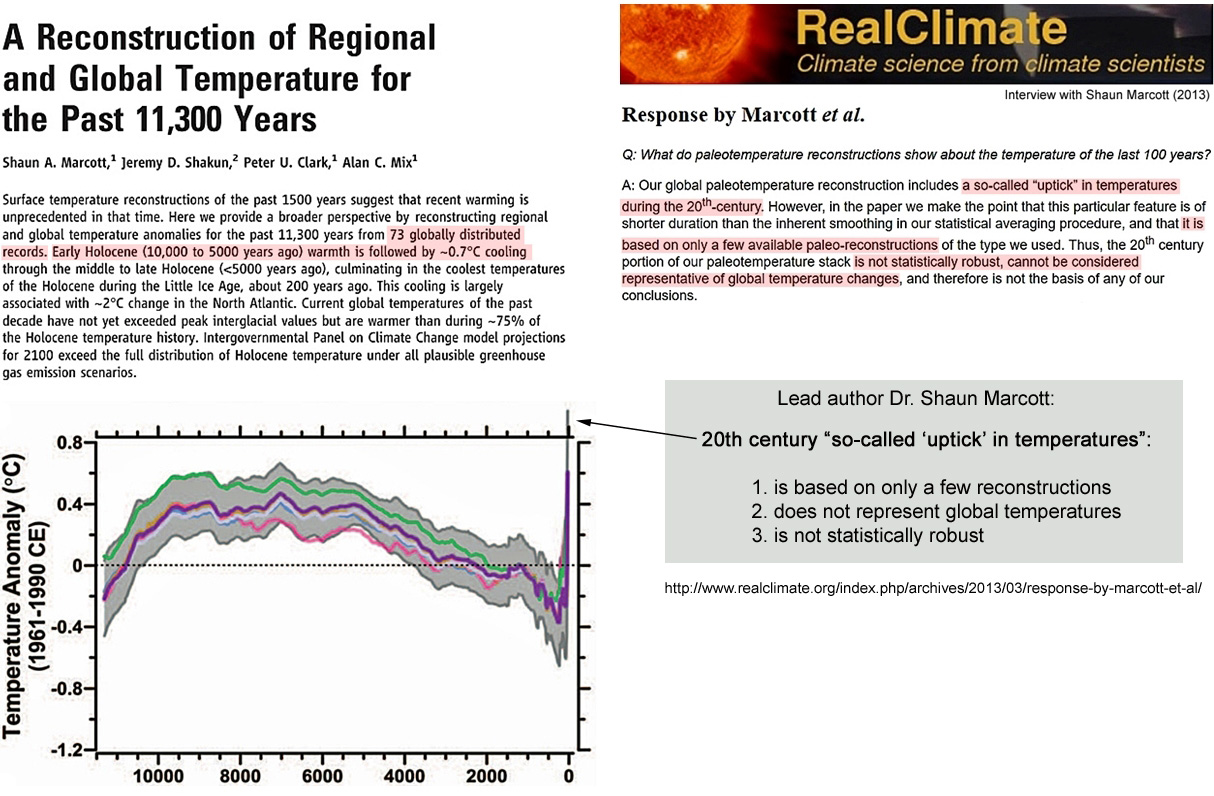
20th century “uptick” from Marcott et al., 2013, RealClimate.org
Almost immediately after it was introduced to the public, the lead author of Marcott et al. (2013) squelched the narrative that said the hockey-stick-shaped reconstruction he and his colleagues produced is a robust representation of modern global-scale temperature changes. In an interview with Marcott published by RealClimate.org, it was acknowledged that the “uptick” does not represent a global-scale reconstruction, as it is based on only a few proxy records and lacks statistical significance. 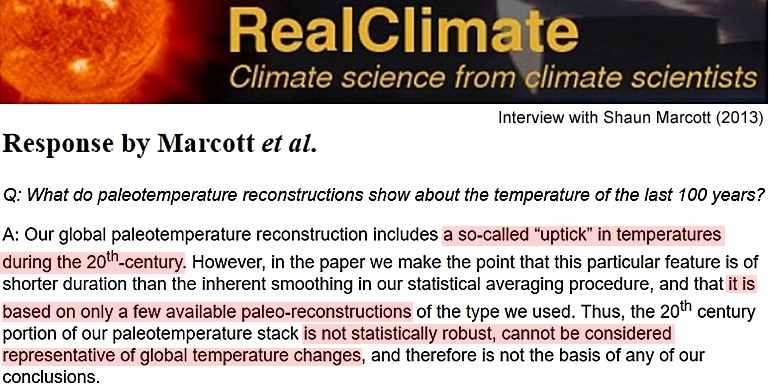 Despite this admitted lack of supporting evidence for the 20th century’s “uptick”, the Marcott et al. (2013) “hockey stick”-shaped graph has nonetheless been unskeptically cited by other authors nearly 700 times.
Marcott’s compilation of 73 reconstructions
The same “73 globally distributed” proxy temperature records used to manufacture the Marcott et al. (2013) “hockey stick”-shaped graph above were featured two years earlier in Shaun Marcott’s Oregon State University doctoral dissertation.
Marcott, 2011 “Late Pleistocene and Holocene Glacier and Climate Change”
One may view the graphical representations of all 73 proxy temperature records used for the 2013 “uptick” on pages 200-203 of Marcott’s 2011 paper (above link, about three-fourths of the way down). Interestingly, a majority of the graphs do not have temperatures extending to the right Y axis, indicating that most of the 73 proxy records do not encompass the modern era and preclude analysis of the relative temperature differences between the past and present. In fact, just 32 of the 73 graphs have overall trend lines that extend to “0 yrs BP” in the Marcott dissertation paper. The rest end somewhere in the Late Holocene (or earlier). The 32 reconstructions that do extend all the way to the right Y axis are shown below. 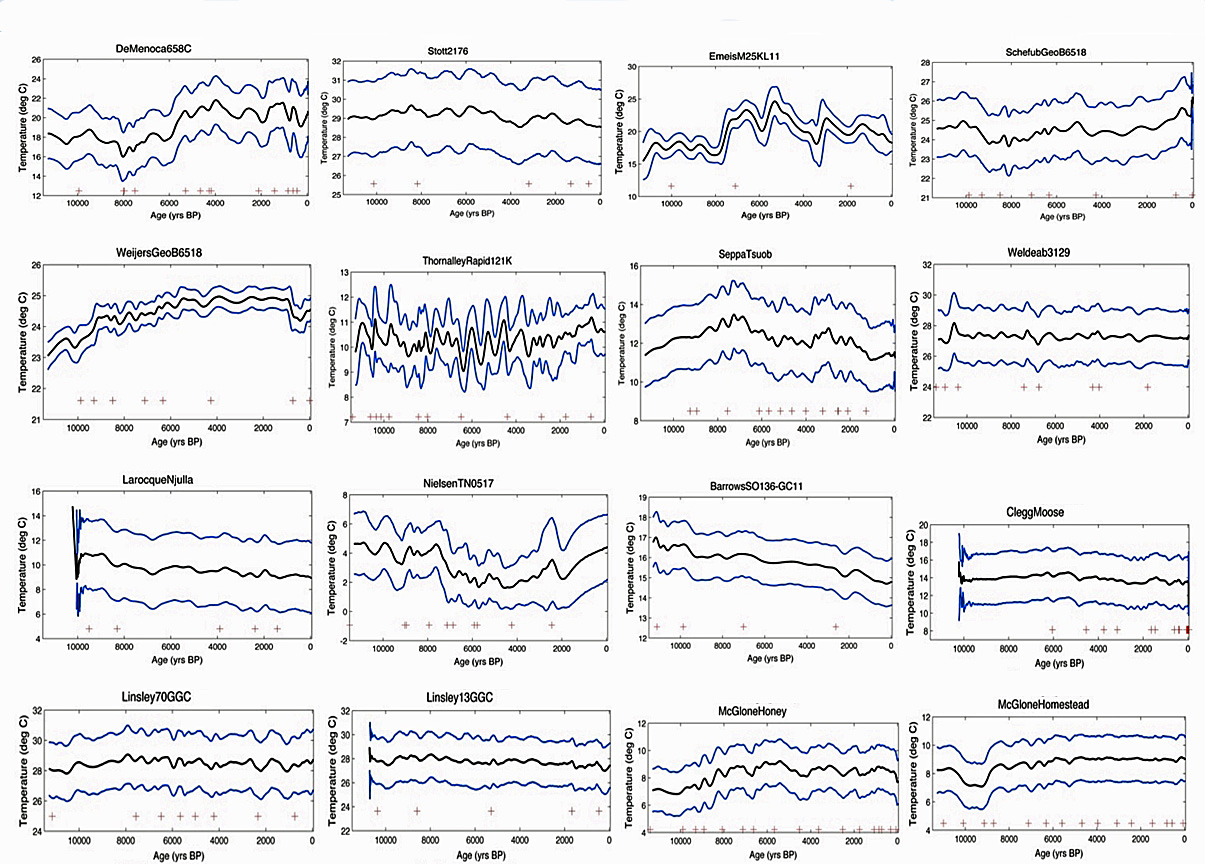
Same data, contradictory results
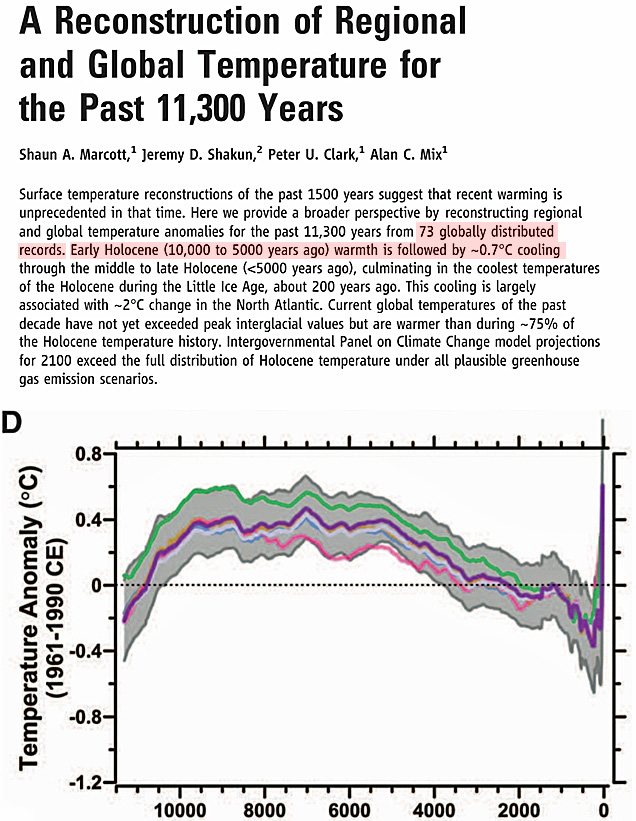
As even a cursory glance at the 32 reconstructions illustrates, Marcott’s 2011 paper showed no 20th century temperature “uptick” after a modest overall Holocene cooling trend. A compilation of all 73 Holocene temperature trends for the past 11,300 years is presented in one compressed graph on page 204. Notice that the large amplitude of variations involving temperature changes of several degrees Celsius shown in the proxy reconstructions has been replaced by much smaller variable ranges (tenths of a degree). 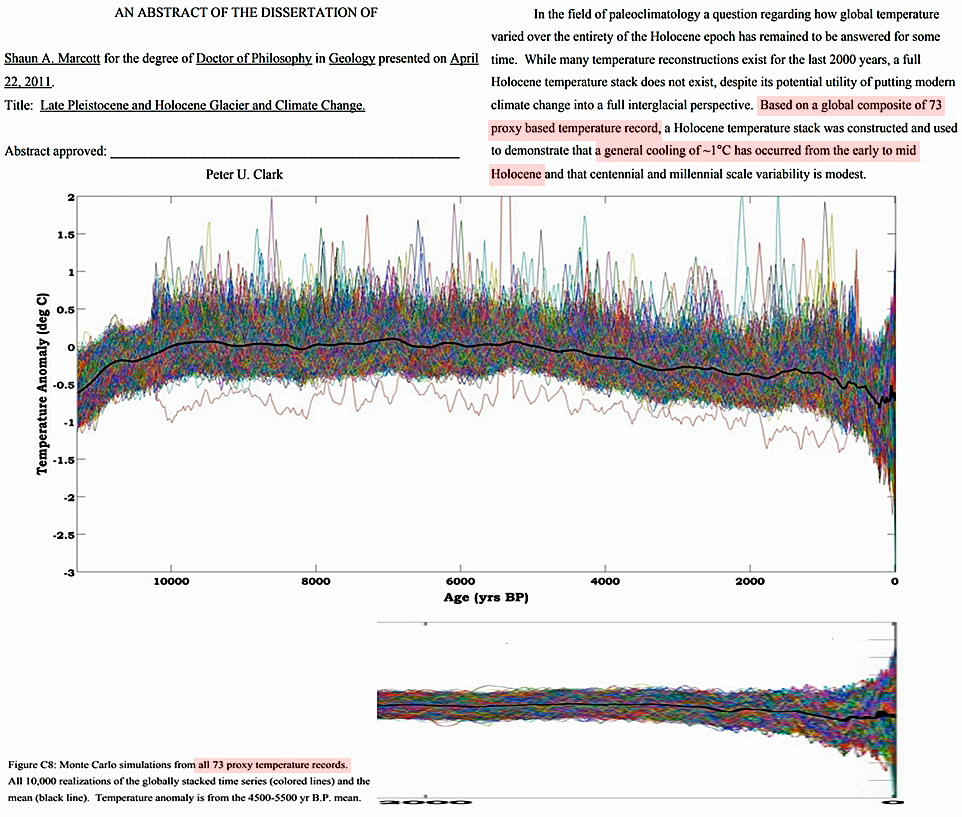 In contrast, the 2013 paper — utilizing the very same 73 temperature reconstructions — depicts the explosive temperature rise during modern times popularized by climate activists.
This glaring contradiction between Marcott’s 2011 and 2013 papers was pointed out by Professor Paul Matthews in a comment published by the journal Science. 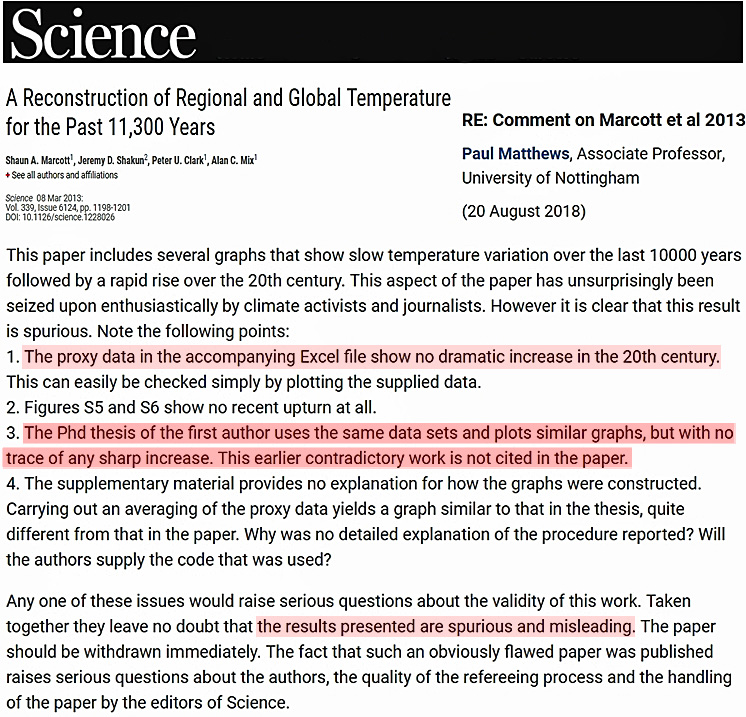
Image Source: Science
Marcott’s selected reconstructions indicate 2°C warmer temps during the Early- to Mid-Holocene
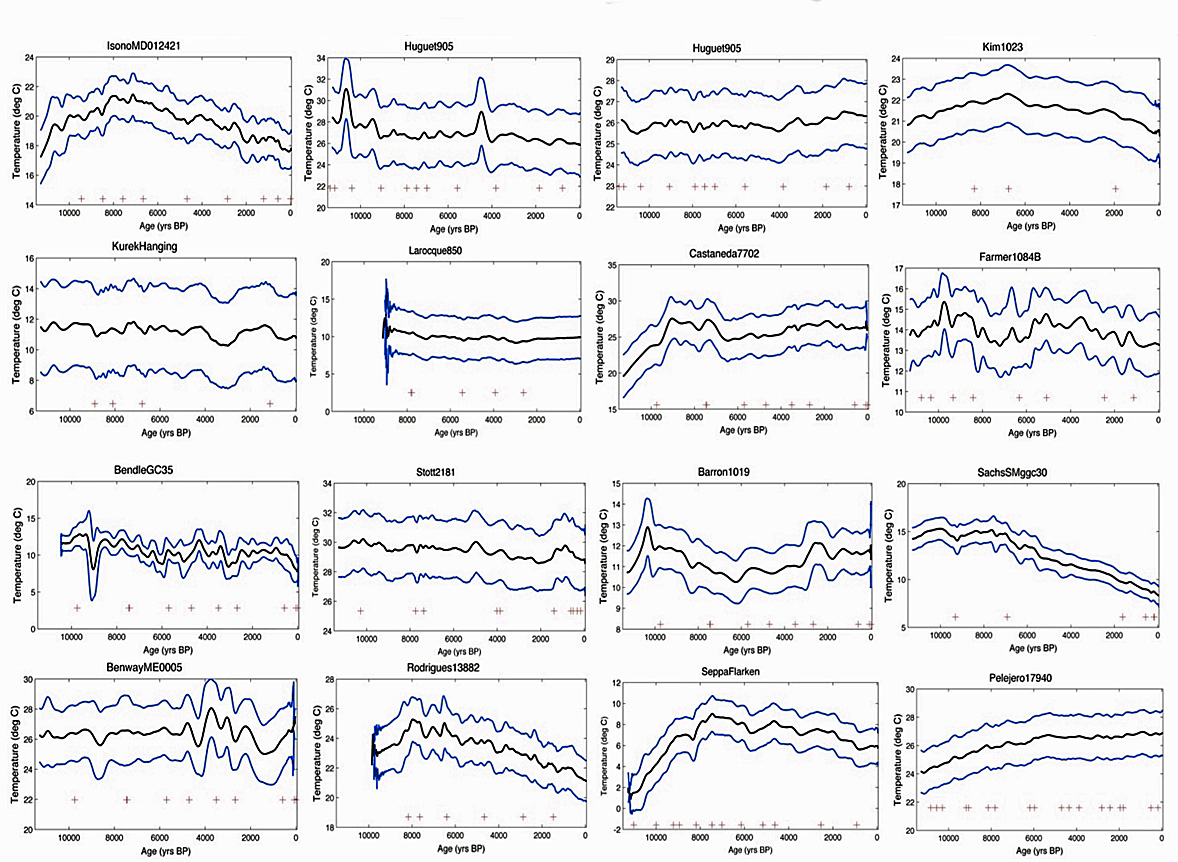
Interestingly, the temperature reconstructions Marcott used to produce both his 2011 Ph.D thesis and his 2013 Science paper show that (a) Early- to Mid-Holocene temperatures were, on average, more than 2°C warmer than today, and (b) they varied throughout the Holocene by multiple degrees Celsius instead of by just the tenths-of-a-degree shown in both the 2011 and 2013 papers. Of the 32 reconstructions extending to the Y axis in Marcott’s papers, 25 clearly define the modern or present temperature relative to the past. The other 7 did not have modern or present temperature values that were clearly defined in the body of the paper. In the 25 reconstructions that did allow comparison, the compiled peak Holocene temperatures were determined to be 2.3°C warmer than today on average. This result wholly contradicts the claims of Marcott’s 2013 paper.
Examples of the warmer-than-today records
Perhaps Marcott did not look closely enough at the content of each paper he referenced. Had he done so, he may have noticed that Rodrigues et al., 2009 indicate the “at present” temperature in the Iberian region is 15°C, which is about 1°C colder than it was during the Little Ice Age (16°C) and 4°C colder than the peak Holocene temperature. 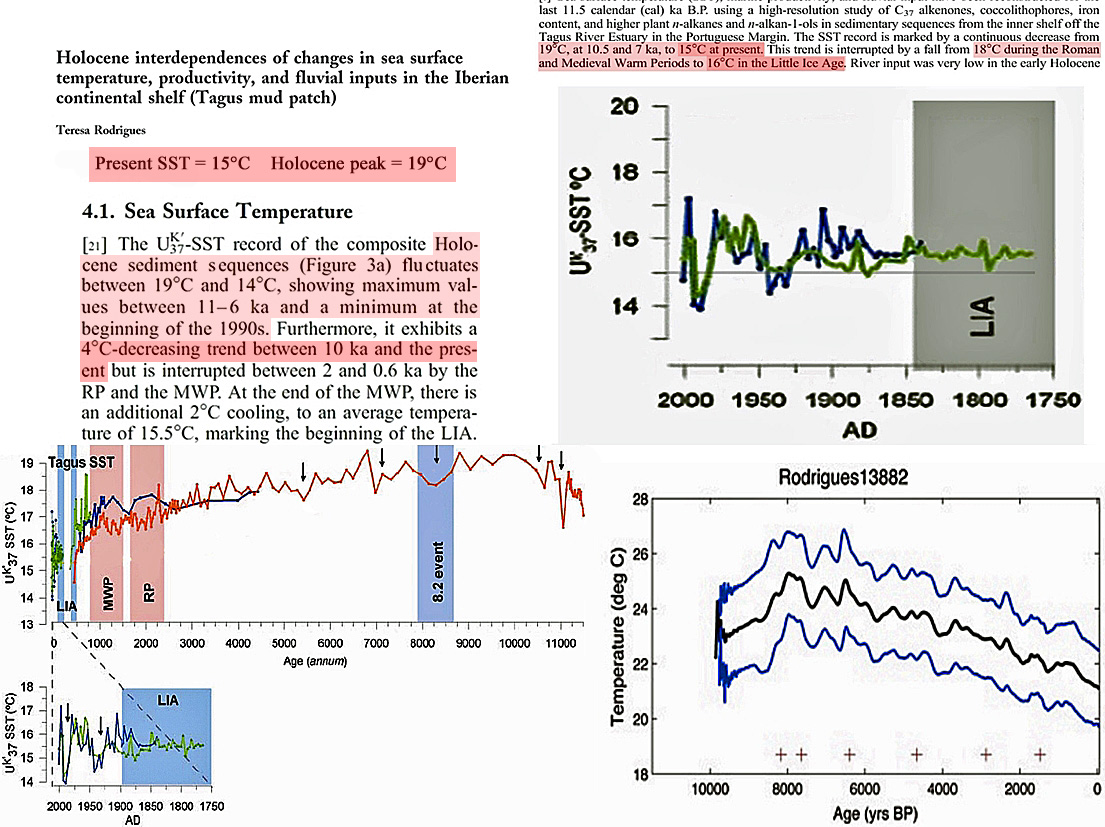 Isono et al. (2009) report that the “present” temperature is 16.7°C, but the peak Holocene temperature was 21.4°C, meaning that North Pacific temperatures were approaching 5°C warmer about 7,000 or 8,000 years ago.
 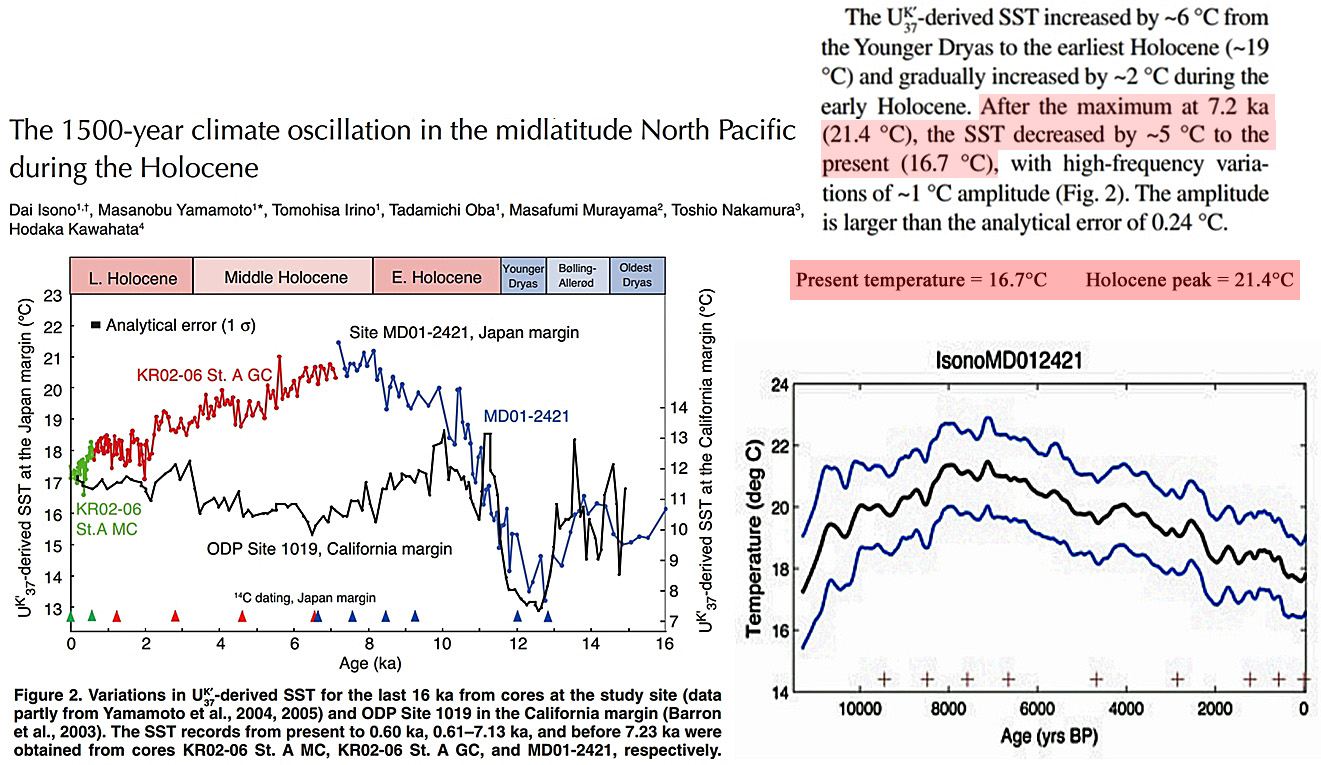 Even a graph that initially appears to support a sharp rise in temperature during modern times (an “uptick”) like Nielsen et al. (2010) actually asserts the Holocene peak was 4°C warmer than the modern average in the body of the paper itself.
 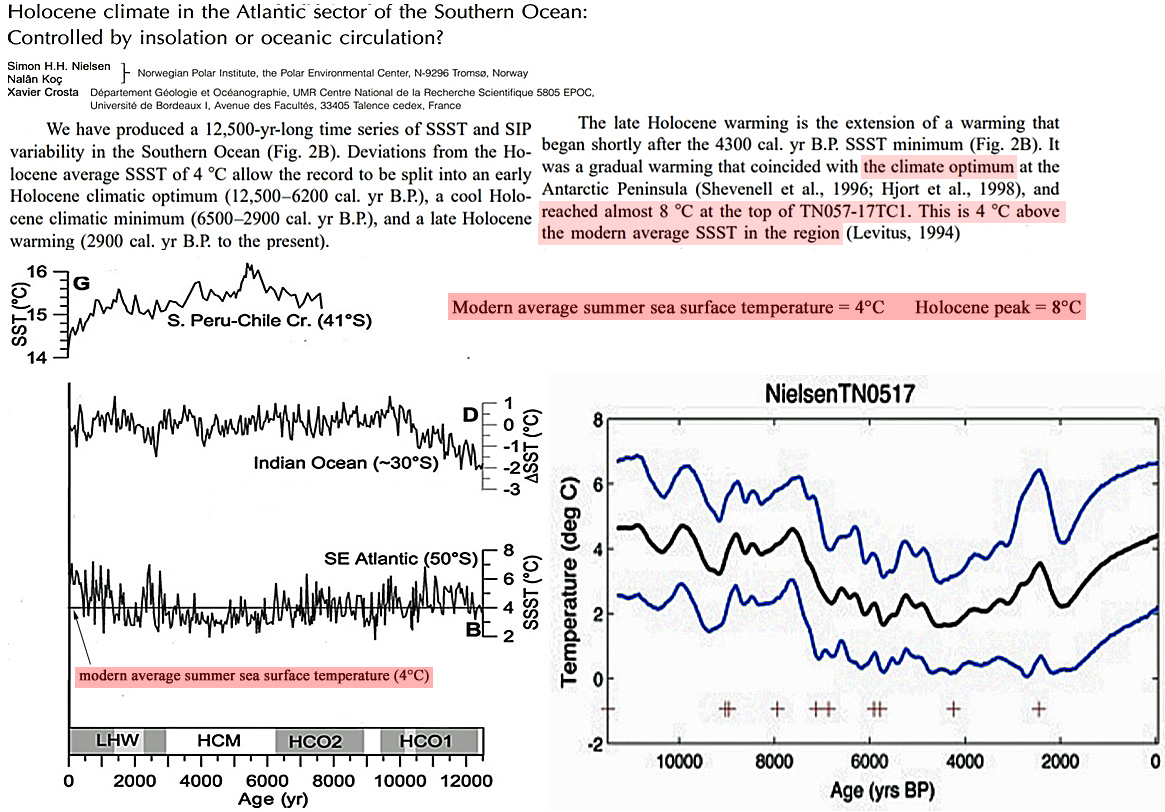 As mentioned, some graphs are identified as not clearly defining the modern temperature values. However, as Bendle and Rosell-Mele, 2007 point out, the amplitude of past temperature changes could reach as high as 10°C within a matter of centuries. This would appear to contradict the contention that Holocene temperature variability was much less pronounced (a few tenths of a degree spanning millennia).
 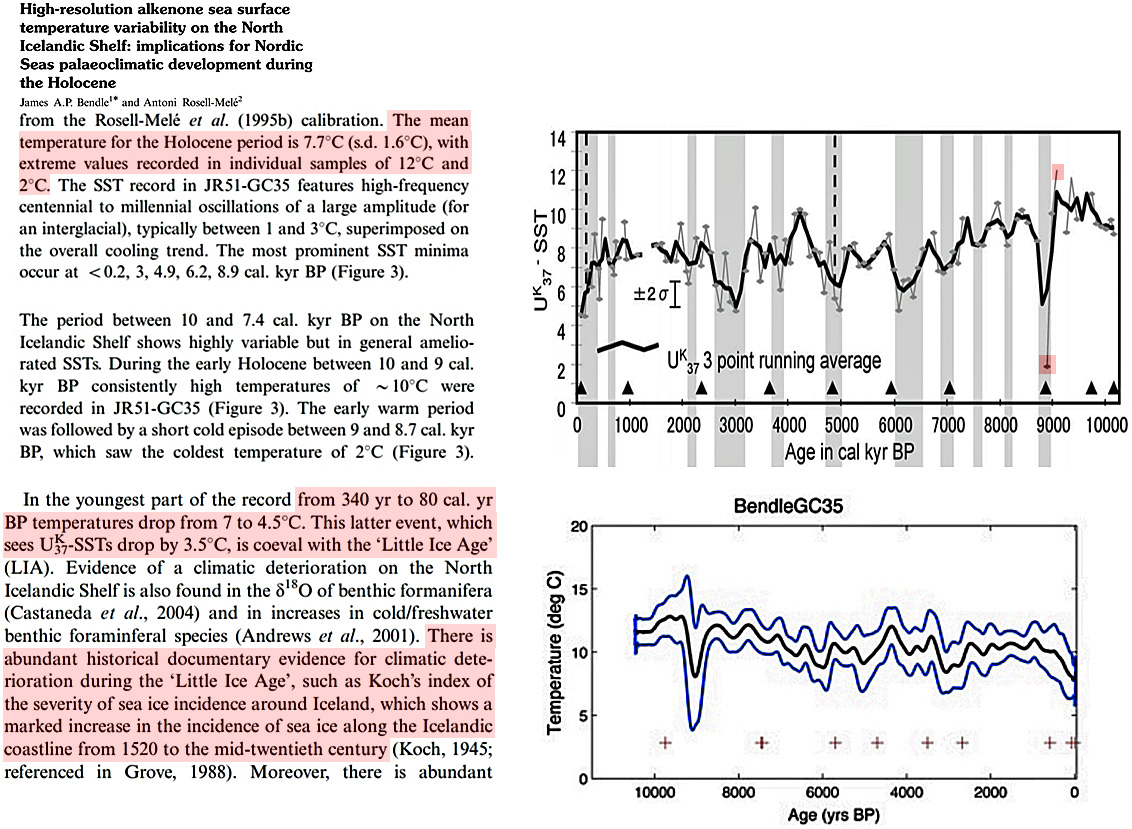 Of note, none of the reconstructions analyzed support the contention that modern temperatures are unusually high or unprecedented.
If the paleoclimate evidence doesn’t support a recent pronounced “uptick”, where does it come from?
To summarize, the proxy evidence from the peer-reviewed scientific papers that Marcott derived his global temperature data set compilation wholly contradicts Marcott’s apparent attempt to construct a Mann-like Holocene-length “hockey stick” temperature record. Marcott himself has acknowledged that the 20th century “uptick” is based on only “a few” reconstructions that are neither globally representative or statistically robust. This begs the questions:
1. What data set is used to justify the depiction of a pronounced temperature “uptick”?
2. Has the “uptick” been fabricated?
3. On what basis did the journal Science publish the 2013 version of a paper that is contradicted by an earlier work by the same author?
The list of Marcott’s graphs
Below is the table of contents for the 32 referenced reconstructions extending to the right Y axis. The warmer-than-now temperature value is emboldened on the right. This list is followed by the pictorial representations of the Marcott-selected reconstructions and excerpts from the papers.
Sachs, 2007 – Northwest Atlantic SSTs: (+4.5°C, +9.5°C, +7.0°C) +7.0°C
Rodrigues et al., 2009 – Iberian Shelf: +4.0°C
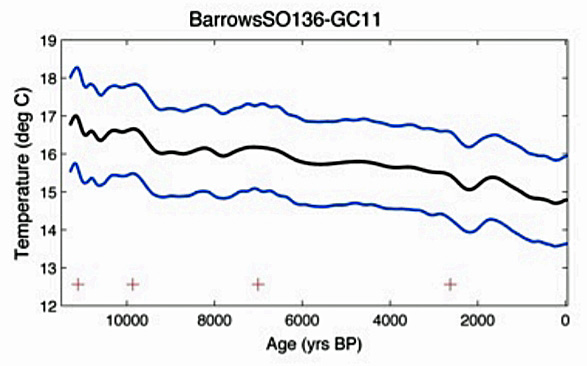
Barrows et al., 2009 – New Zealand: +2.1°C
Bendle and Rosell-Mele, 2007 – North Icelandic Shelf: not clearly defined
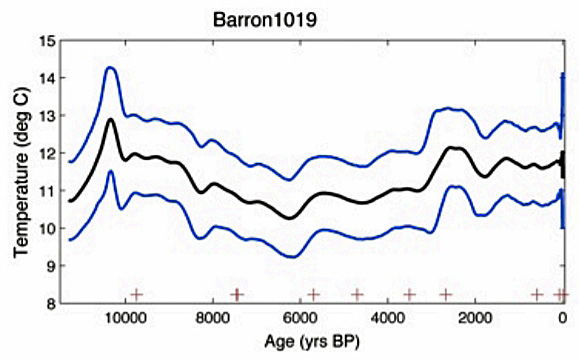
Barron et al., 2003 – Northern California: +1.3°C
Isono et al., 2009 – North Pacific: +4.7°C
Larocque and Hall, 2004 – Northern Sweden: +2.1°C, +3.0°C
Emeis et al., 2003 – NW Europe: +4.0°C
Kim et al., 2002 – Eastern Atlantic: +2.6°C
Kurek et al., 2009 – Yukon Territory: +2.0°C
Pelejero et al., 1999 – South China Sea: +0.25°C
McGlone et al., 2010 – Southern Ocean: +2.0°C, not clearly defined
Thornalley et al., 2009 – Subpolar North Atlantic: not clearly defined
DeMenocal et al., 2000 – NW Africa: MWP “marginally warmer than present”
Linsley et al., 2010 – Western Pacific: +0.5°C, +0.5°C
Stott et al., 2004 – Western Tropical Pacific: +0.5°C, +0.5°C
Clegg et al., 2010 – Alaska: +1.0°C
Nielsen et al., 2010 – South Atlantic/Southern Ocean: +4.0°C
Farmer et al., 2005 – South Africa: +1.5°C
Weijers et al., 2007 – Tropical Africa: +1.3°C
Castañeda et al., 2010 – Eastern Mediterranean: +1.5°C
Weldeab et al., 2006 – Western Tropical Atlantic: +1.2°C
Benway et al., 2006 – Eastern Pacific Warm Pool: not clearly defined
Huguet et al., 2006 – Arabian Sea: +5.3°C, not clearly defined
Schefuß et al., 2005 – Central Africa: not clearly defined
Seppä and Birks, 2001 – Fennoscandia: +1.7°C
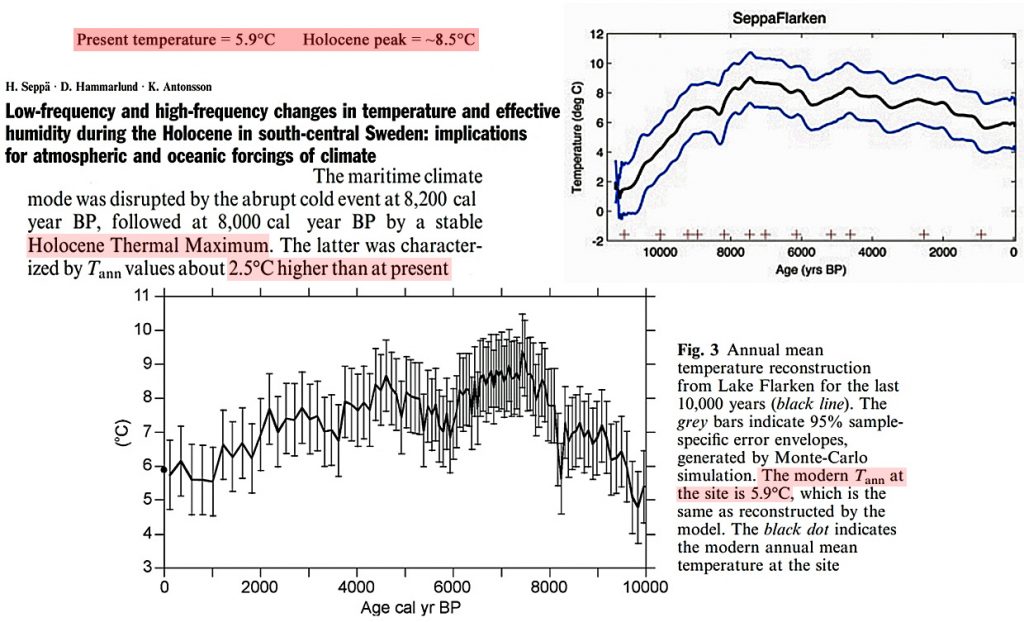
Seppä et al., 2005 – Sweden: +2.5°C
Holocene peak (+4.5°C, +9.5°C, +7°C) +7.0°C warmer than present
Sachs, 2007 Sachs, J. P. (2007). Cooling of Northwest Atlantic slope waters during the Holocene. Geophysical Research Letters 34, L03609, doi:10.1029/2006GL028495. 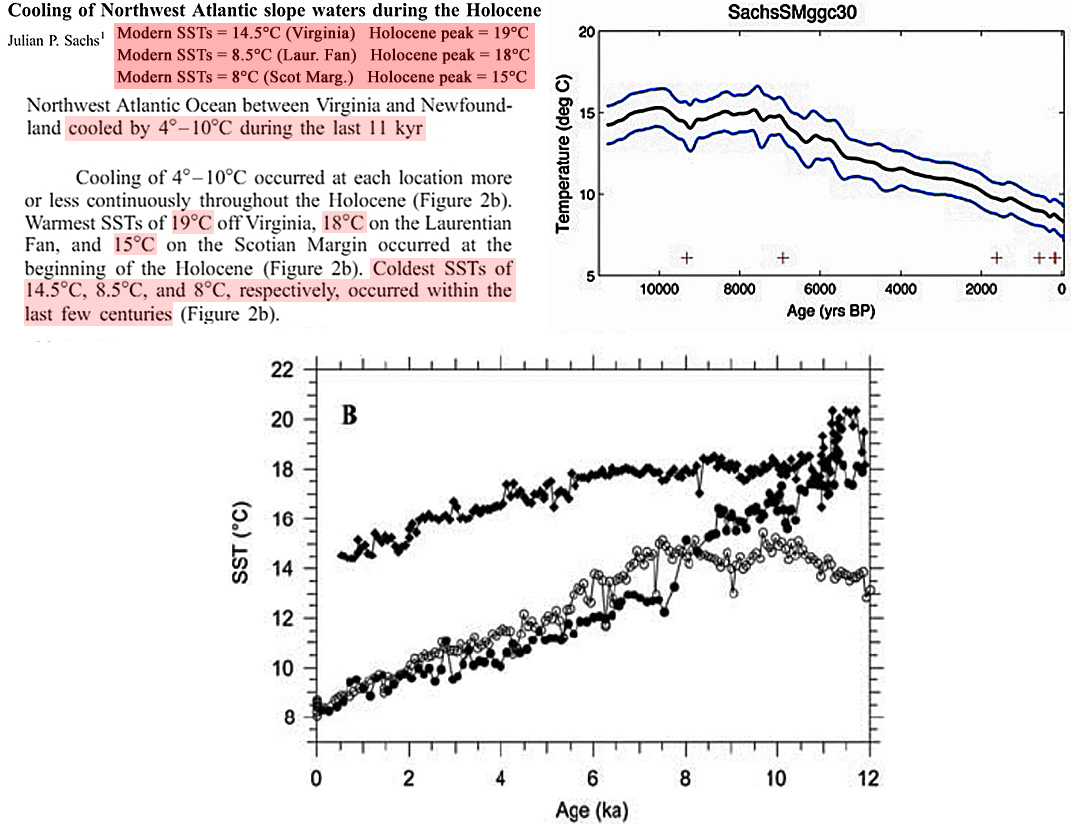
Holocene peak +4.0°C warmer than present
Rodrigues et al., 2009 Rodrigues, T., Grimalt, J. O., Abrantes, F. G., Flores, J. A., and Lebreiro, S. M. (2009). Holocene interdependences of changes in sea surface temperature, productivity, and fluvial inputs in the Iberian continental shelf (Tagus mud patch). Geochemistry, Geophysics, and Geosystems 10, Q07U06, doi:10.1029/2008GC002367.
Holocene peak +2.1°C warmer than present
Barrows et al., 2007 Barrows, T. T., Lehman, S. J., Fifield, L. K., and De Deckker, P. (2007). Absence of Cooling in New Zealand and the Adjacent Ocean During the Younger Dryas Chronozone. Science 318, 86-89. 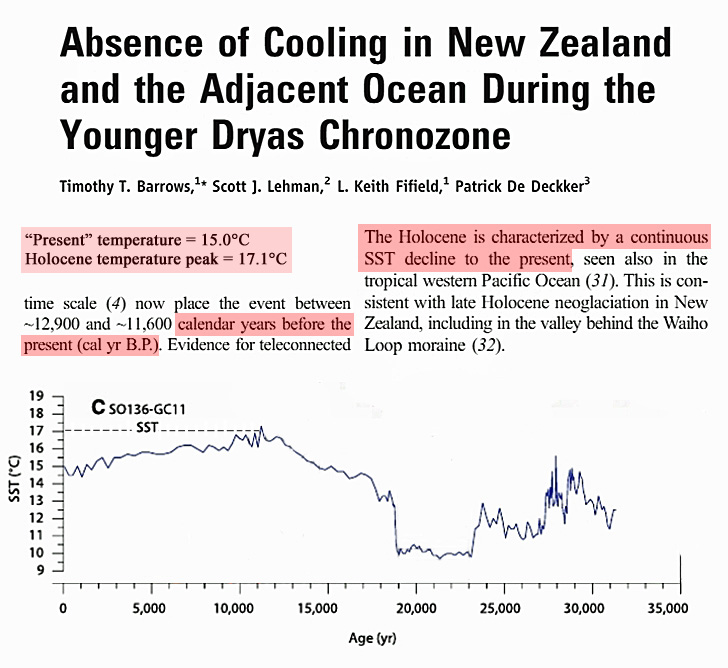
Holocene peak vs. present not clearly defined, warm/cool amplitudes of 10°C
Bendle and Rosell-Mele, 2007 Bendle, J. A. P., and Rosell-Mele, A. (2007). High-resolution alkenone sea surface temperature variability on the North Icelandic Shelf: implications for Nordic Seas palaeoclimatic development during the Holocene. The Holocene 17, 9-24.
Holocene peak +1.3°C warmer than present
Barron et al., 2003 Barron, J. A., Heusser, L., Herbert, T., and Lyle, M. (2003). High resolution climatic evolution of coastal northern California during the past 16,000 years. Paleoceanography 18, 20-1 to 20-14 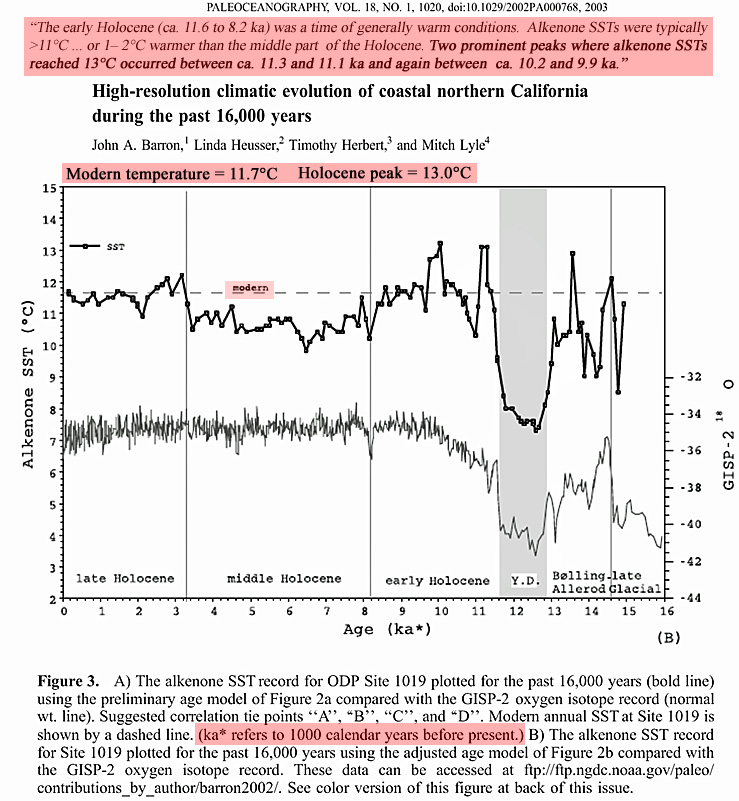
Holocene peak +4.7°C warmer than present
Isono et al., 2009 Isono, G., Yamamoto, M., Irino, T., Oba, T., Murayama, M., Nakamura, T., and Kawahata, H. (2010). The 1500-year climate oscillation in the midlatitude North Pacific during the Holocene. Geology 37, 591-594
Holocene peak +2.1°C and +3.0°C warmer than present
Larocque and Hall, 2004 Larocque, I., and Hall, R. I. (2004). Holocene temperature estimates and chironomid community composition in the Abisko Valley, northern Sweden. Quaternary Science Review 23, 2453-2465. 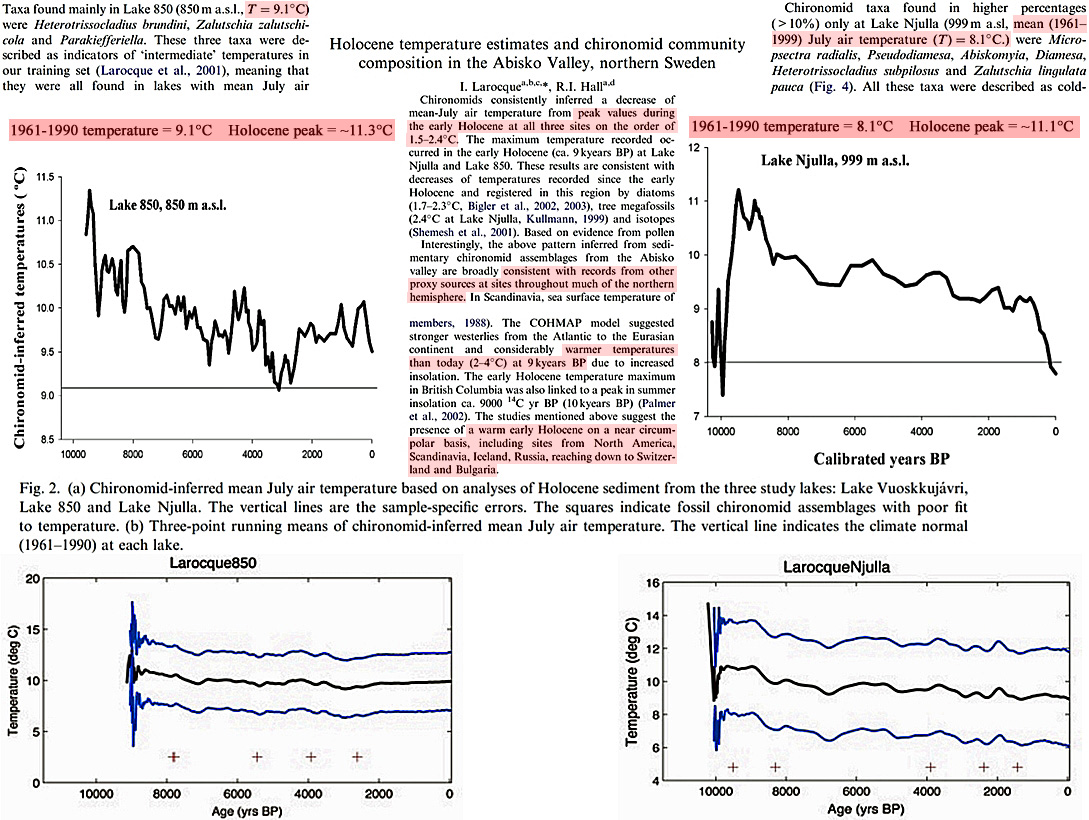
Holocene peak +4.0°C warmer than present
Emeis et al., 2003 Emeis, K. C., Struck, U., Blanz, T., Kohly, A., and Woß, M. (2003). Salinity changes in the central Baltic Sea (NW Europe) over the last 10 000 years. The Holocene 13, 411-421. 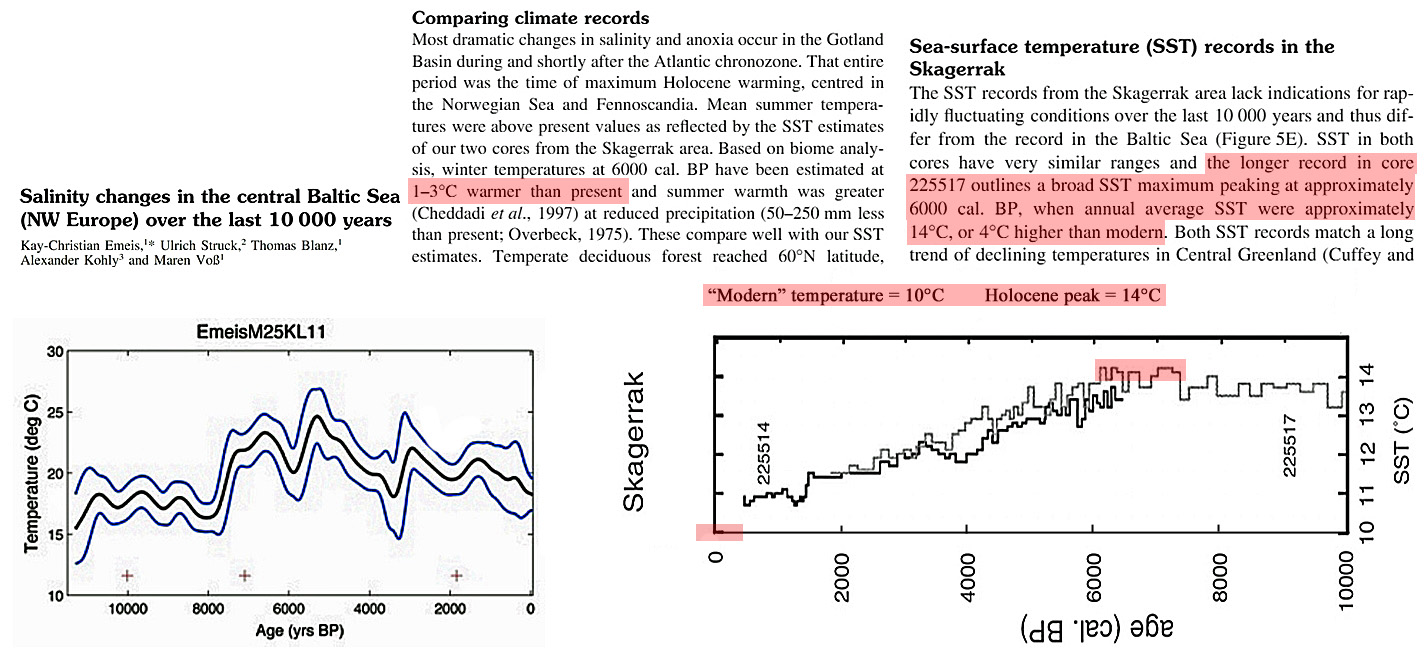
Holocene peak +2.6°C warmer than present
Kim et al., 2002 Kim, J.-H., Schneider, R. R., Muller, P. J., and Wefer, G. (2002). Interhemispheric comparison of deglacial sea-surface temperature patterns in Atlantic eastern boundary currents. Earth and Planetary Science Letters 194, 383-393. 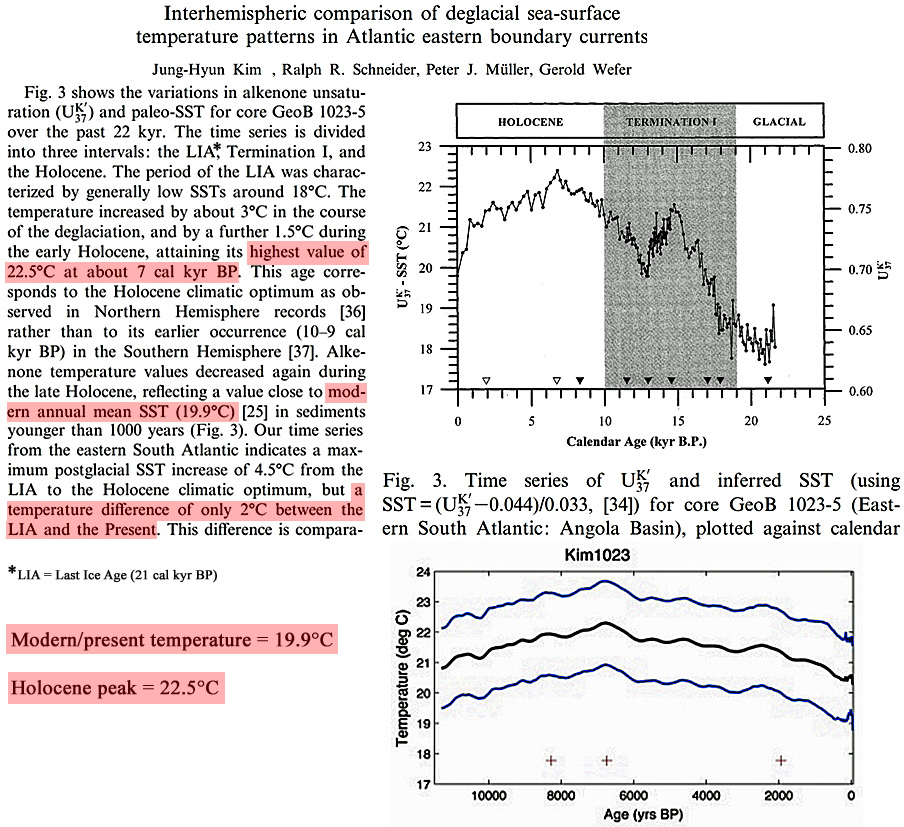
Holocene peak +2.0°C warmer than present
Kurek et al., 2009 Kurek, J., Cwynar, L., and Vermaire, J. C. (2009). A late Quaternary paleotemperature record from Hanging Lake, northern Yukon Territory, eastern Beringia. Quaternary Research 72, 246-257. 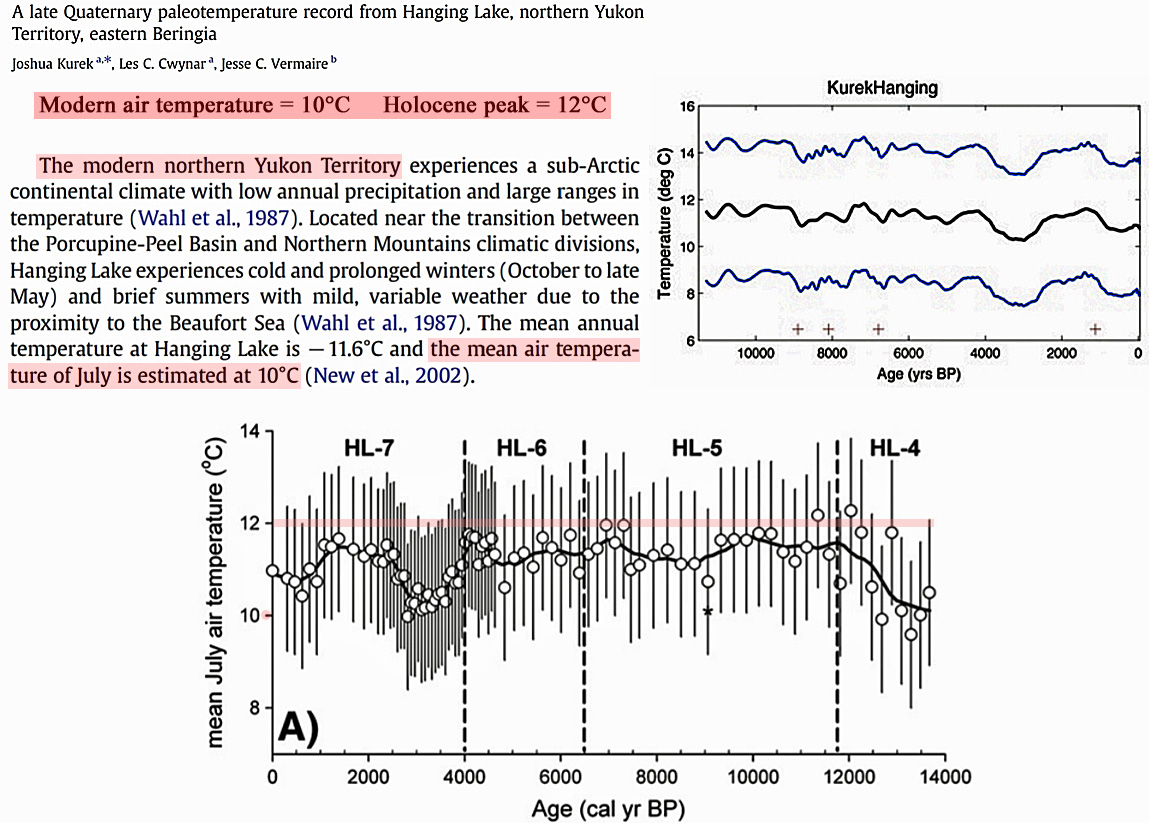
Holocene peak +0.25°C warmer than present
Pelejero et al., 1999 Pelejero, C., Grimalt, J., Heilig, S., Kienast, M., and Wang, L. (1999). High resolution UK37 temperature reconstructions in the South China Sea over the past 220 kyr. Paleoceanography 14, 224-231. 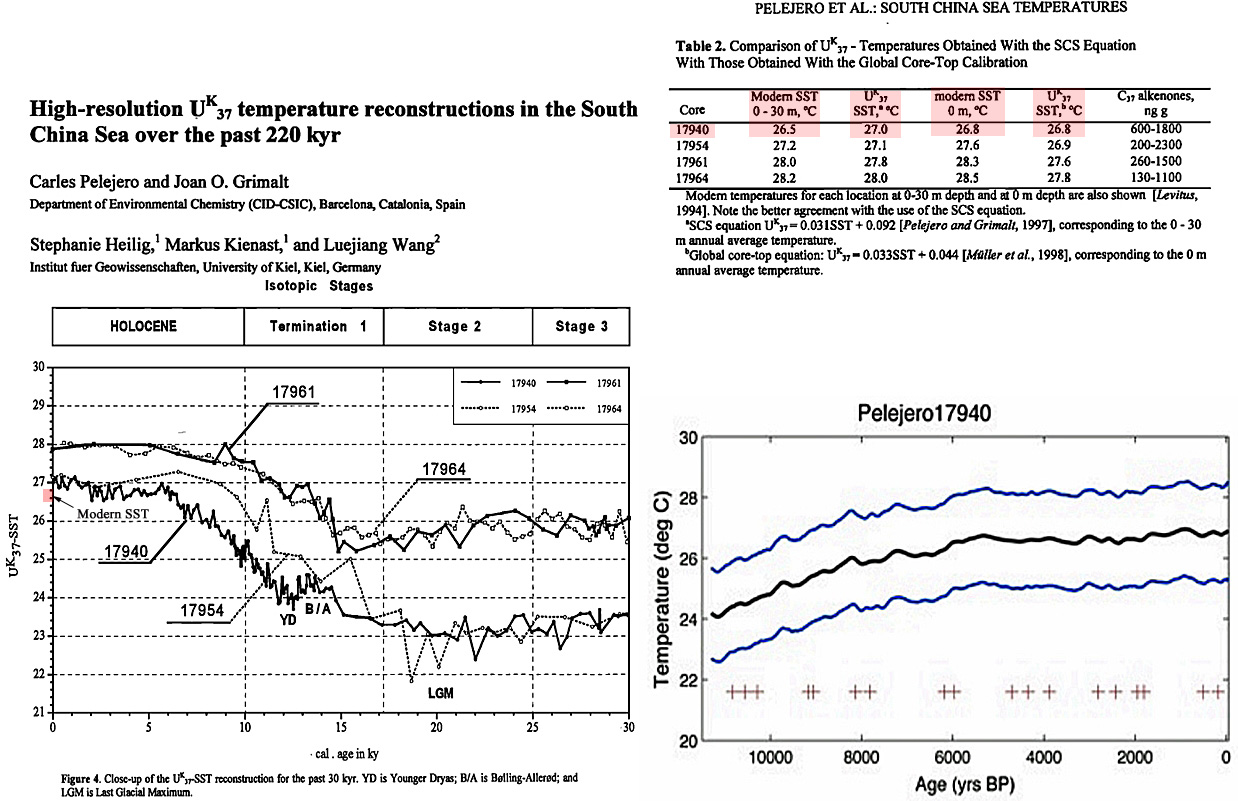
Holocene peak +2.0°C warmer than present (bottom), not clearly defined (top)
McGlone et al., 2010 McGlone, M. S., Turney, C. S. M., Wilmshurst, J. M., Renwick, J., and Pahnke, K. (2010). Divergent trends in land and ocean temperature in the Southern Ocean over the past 18,000 years. Nature Geoscience 3, 622-626. 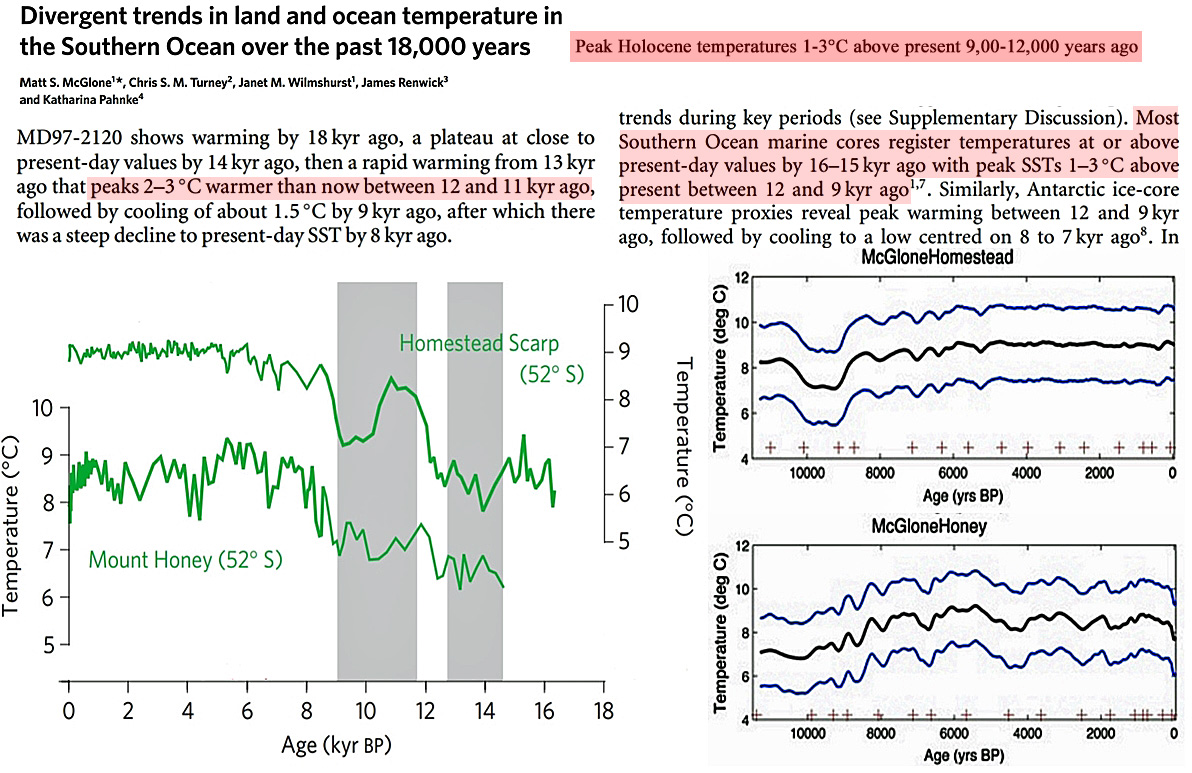
Holocene peak not clearly defined
Thornalley et al., 2009 Thornalley, D. J. R., Elderfield, H., and McCave, I. N. (2009). Holocene oscillations in temperature and salinity of the surface subpolar North Atlantic. Nature 457. 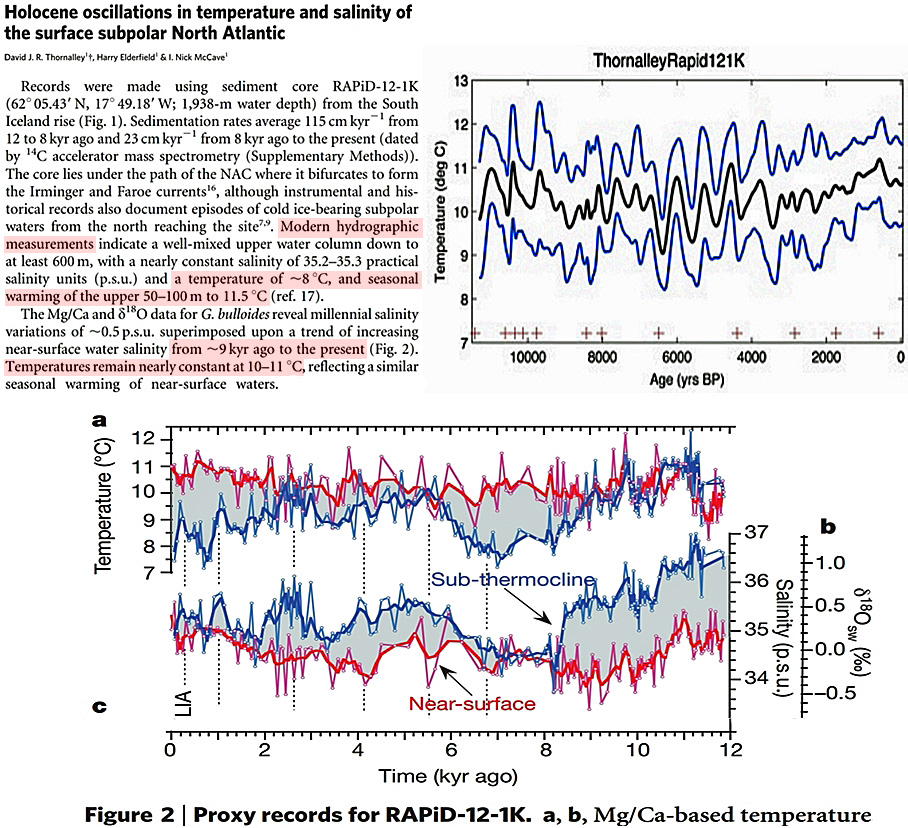
Holocene peak not clearly defined, MWP “marginally warmer than present”
deMenocal et al., 2000 deMenocal, P., Ortiz, J., Guilderson, T., and Sarnthein, M. (2000). Coherent Highand Low-Latitude climate variability during the Holocene warm period. Science 288, 2198-2202. [Northwest Africa] 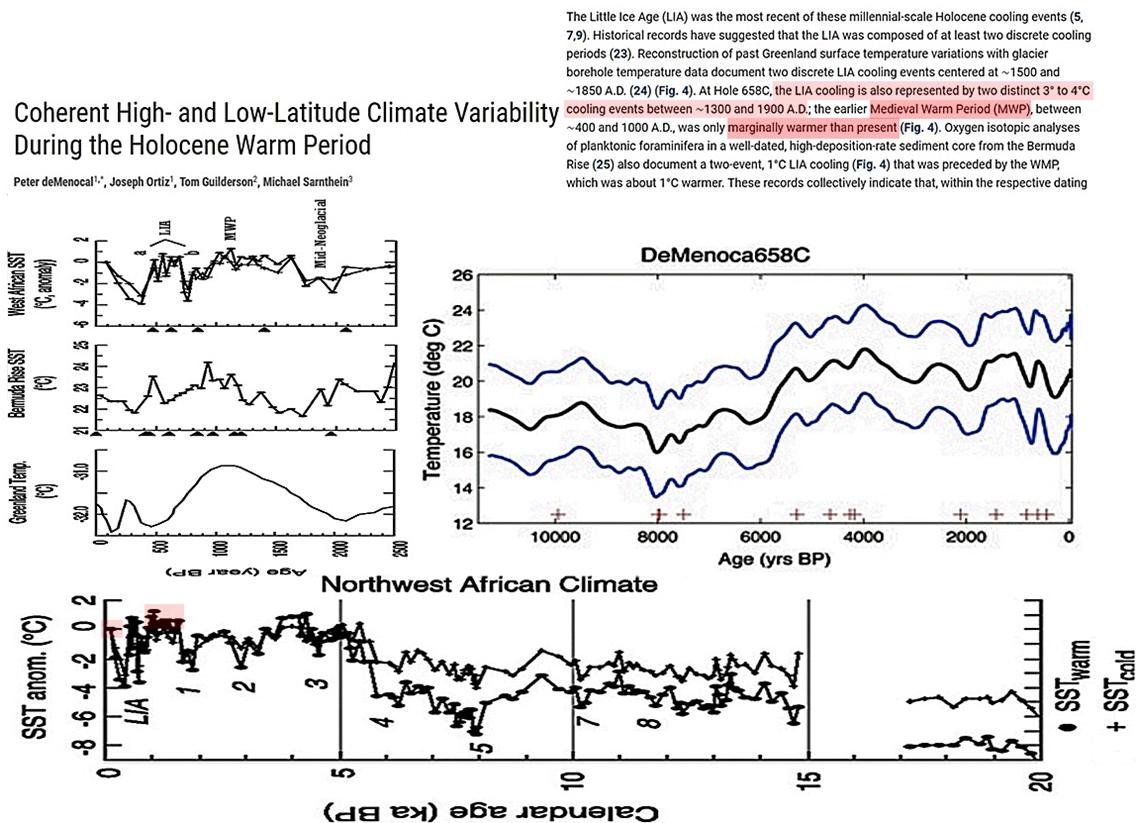
Holocene peak +0.5°C warmer than present (2 reconstructions)
Linsley et al., 2010 Linsley, B. K., Rosenthal, Y., and Oppo, D. W. (2010). Holocene evolution of the Indonesian throughflow and the western Pacific warm pool. Nature Geoscience 3, 578-583. 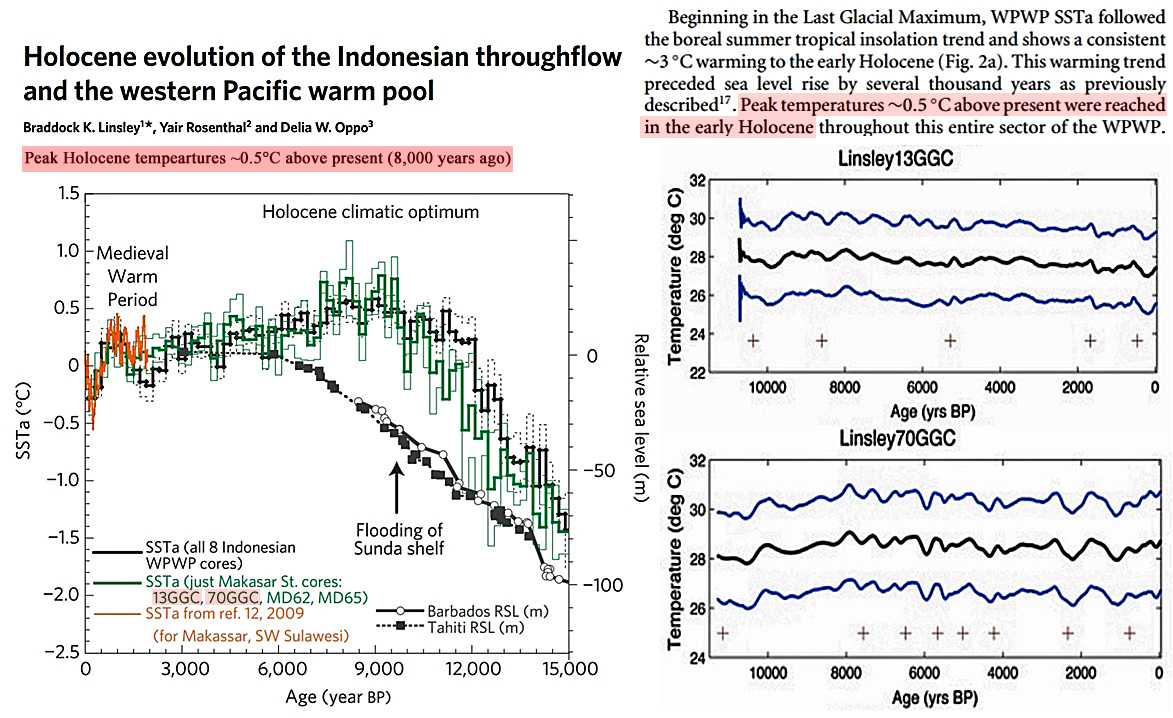
Holocene peak +0.5°C warmer than present (2 reconstructions)
Stott et al., 2004 Stott, L., Cannariato, K., Thunell, R., Haug, G.H., Koutavas, A. and Lund, S. (2004) Decline of surface temperature and salinity in the western tropical Pacific Ocean in the Holocene epoch. Nature 431. 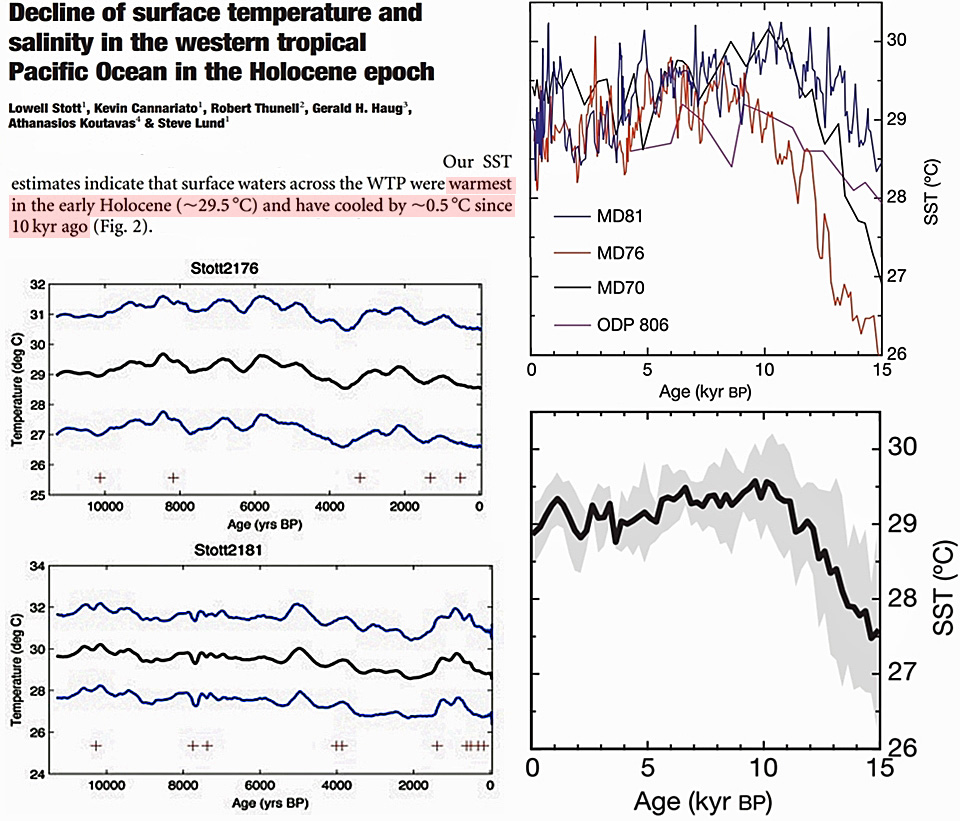
Holocene peak +1.0°C warmer than present
Clegg et al., 2010 Clegg, B. F., Clarke, G. H., Chipman, M. L., Chou, M., I.R., W., Tinner, W., and Hu, F. S. (2010). Six millennia of summer temperature variation based on midge analysis of lake sediments from Alaska. Quaternary Science Review, doi:10.1016/j.quascirev.2010.08.001. 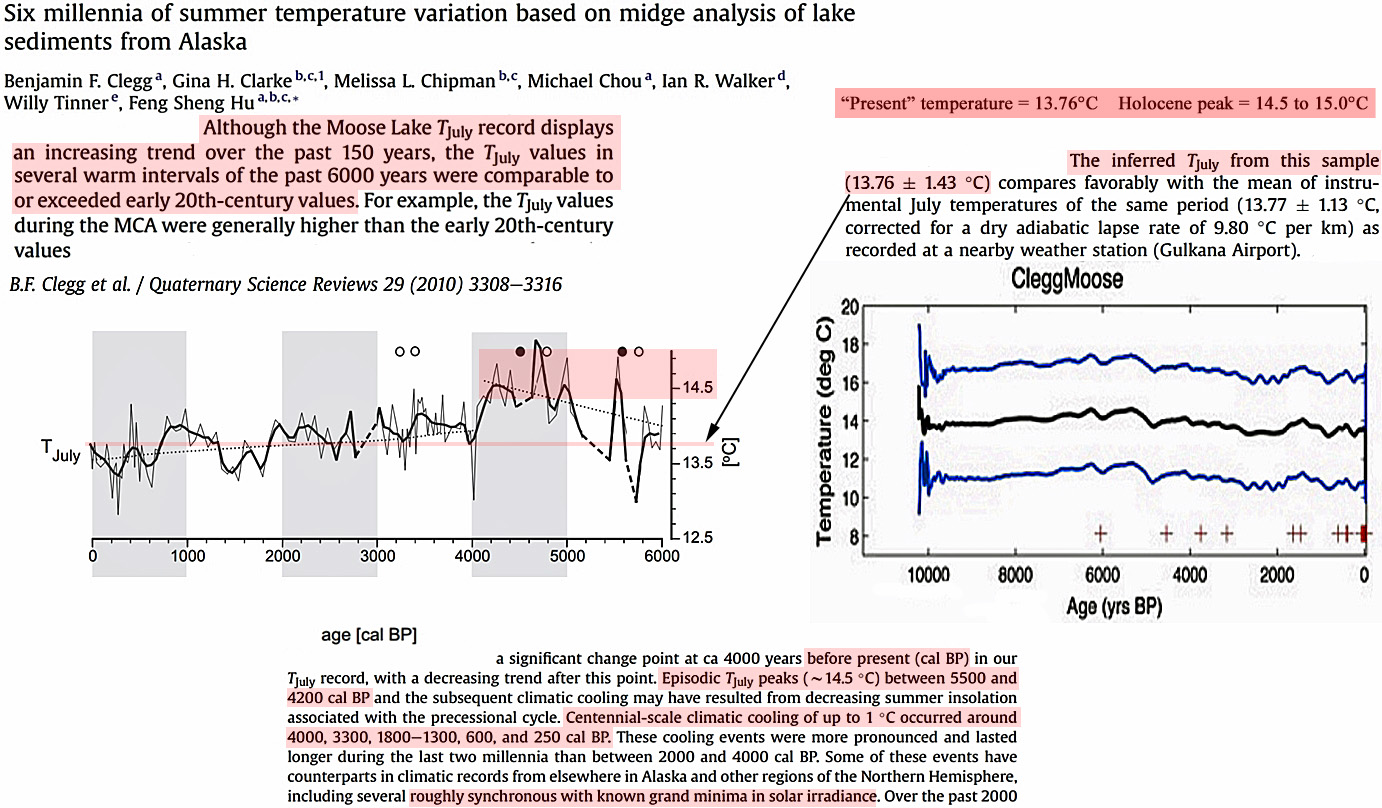
Holocene peak +4.0°C warmer than present
Nielsen et al., 2010 Nielsen, S. H. H., Koç, N., and Crosta, X. (2010). Holocene climate in the Atlantic sector of the Southern Ocean: Controlled by insolation or oceanic circulation? Geology 32, 317-320.
Holocene peak +1.5°C warmer than present
Farmer et al., 2005 Farmer, E. C., deMendocal, P. B., and Marchitto, T. M. (2005). Holocene and deglacial ocean temperature variability in the Benguela upwelling region: Implications for low-latitude atmospheric circulation. Paleoceanography 20, doi:10.1029/2004PA001049. 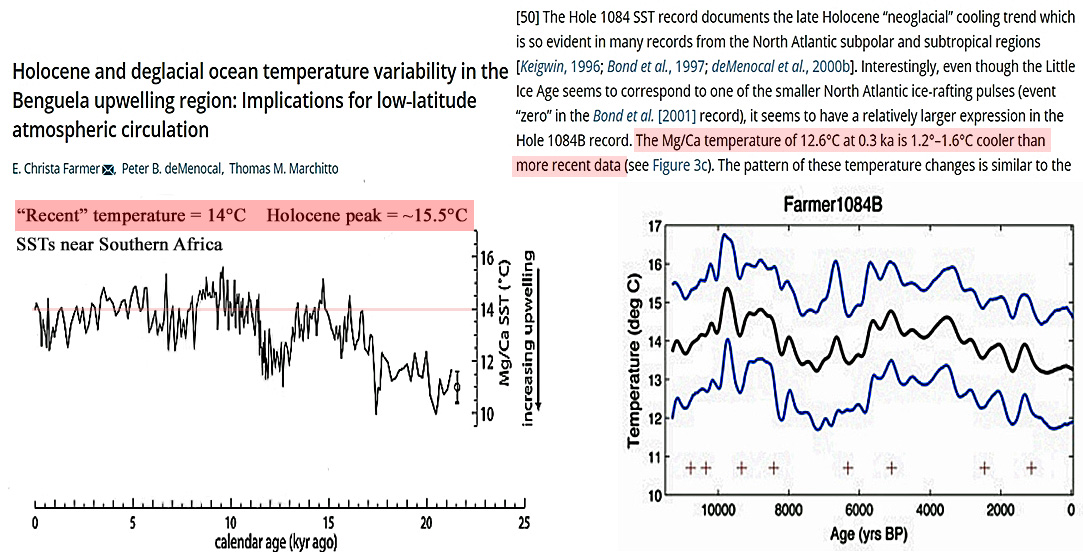
Holocene peak +1.3°C warmer than present
Weijers et al., 2007 Weijers, J. W. H., Schefuß, E., Schouten, S., and Damste, J. S. D. (2007). Coupled Thermal and Hydrological Evolution of Tropical Africa over the Last Deglaciation. Science 315, 1701-1704. 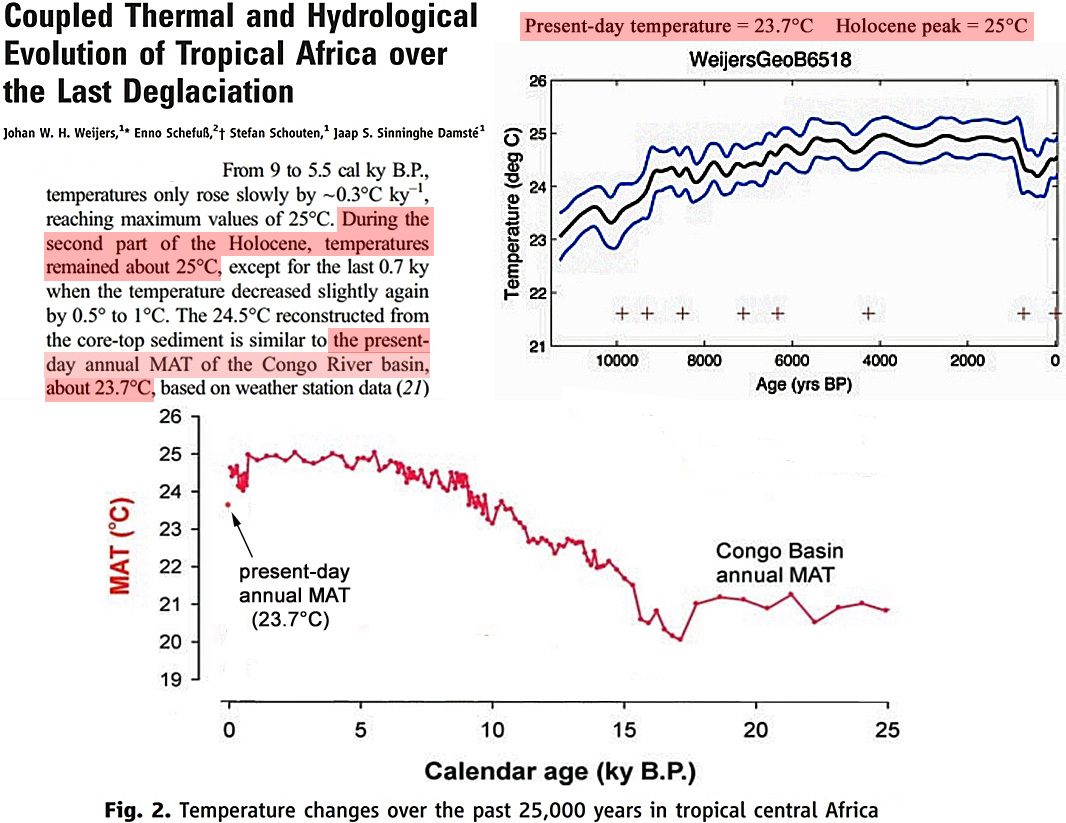
Holocene peak +1.5°C warmer than present
Castañeda et al., 2010 Castañeda, I. S., Schefuß, E., Pätzold, J., Damste, J. S. D., Weldeab, S., and Schouten, S. (2010). Millennial‐scale sea surface temperature changes in the eastern Mediterranean (Nile River Delta region) over the last 27,000 years. Paleoceanography 25, PA1208, doi:10.1029/2009PA001740. 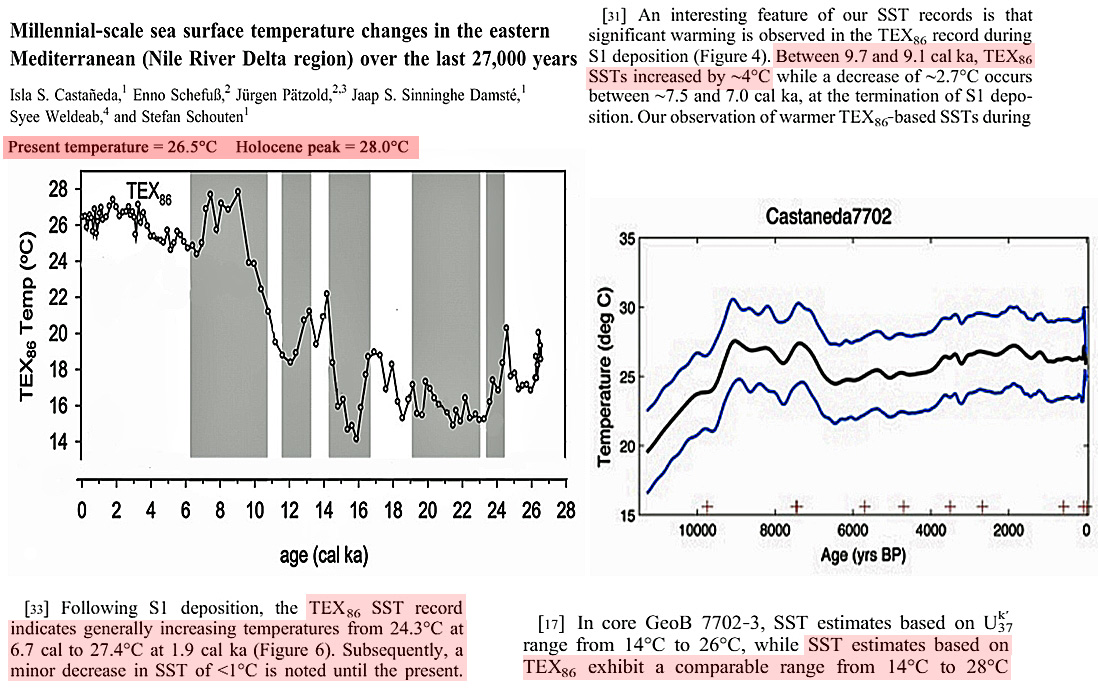
Holocene peak +1.2°C warmer than present
Weldeab et al., 2006 Weldeab, S., Schneider, R. R., and Kölling, M. (2006). Deglacial sea surface temperature and salinity increase in the western tropical Atlantic in synchrony with high latitude climate instabilities. Earth and Planetary Science Letters 241, 699-706. 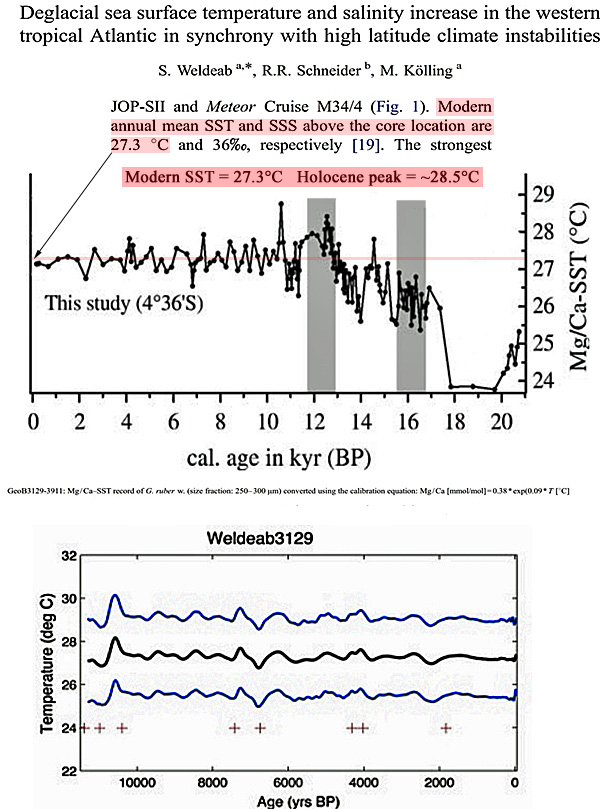
Holocene peak not clearly defined
Benway et al., 2006 Benway, H. M., Mix, A. C., Haley, B. A., and Klinkhammer, G. P. (2006). Eastern Pacific Warm Pool paleosalinity and climate variability: 0 – 30 kyr. Paleoceanography 21, PA3008, doi:10.1029/2005PA001208 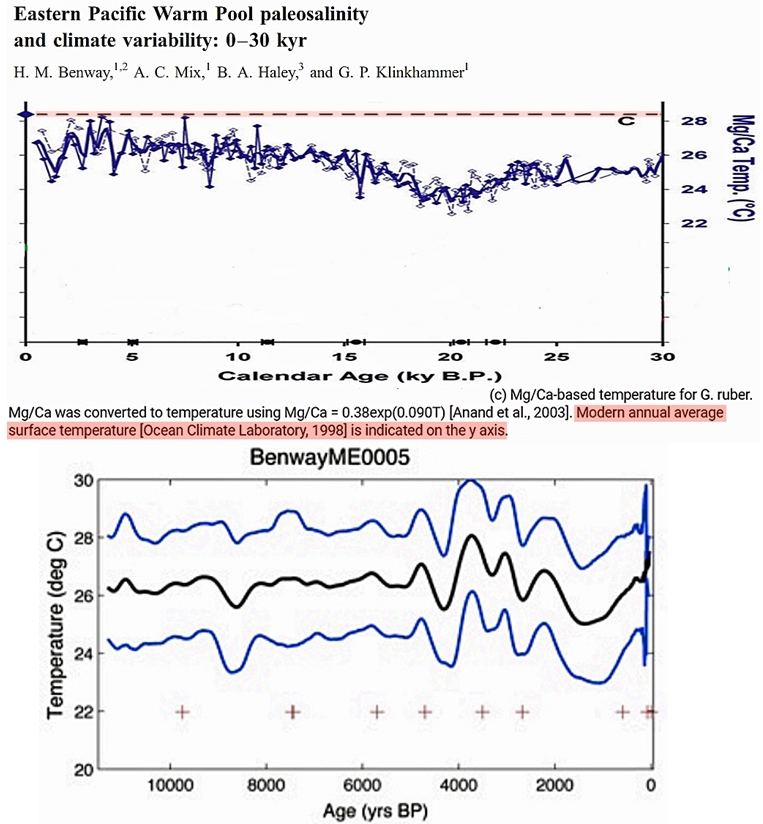
Holocene peak +5.3°C warmer than present (top), not clearly defined (bottom)
Huguet et al., 2006 Huguet, C., Kim, J.-H., Damsté, J. S. S., and Schouten, S. (2006). Reconstruction of sea surface temperature variations in the Arabian Sea over the last 23 kyr using organic proxies (TEX86 and UK37). Paleoceanography 21, doi:10.1029/2005PA001215. 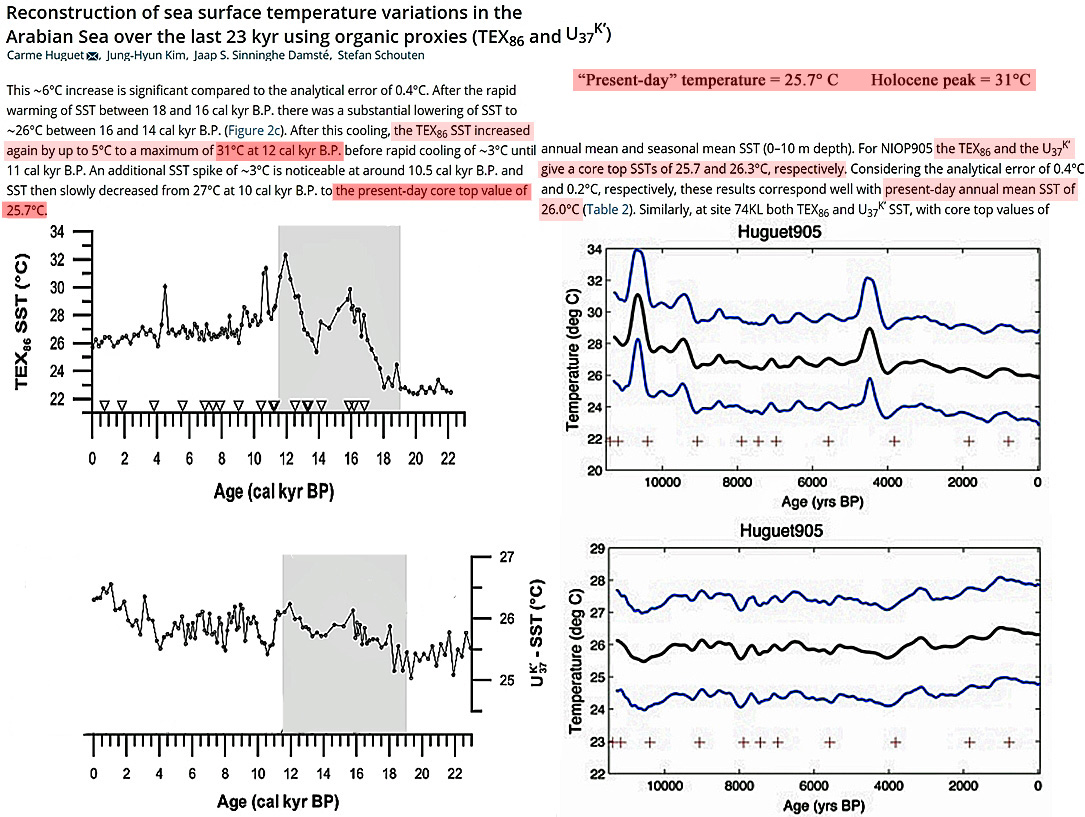
Holocene peak not clearly defined
Schefuß et al., 2005 Schefuß, E., Schouten, S., and Schneider, R. R. (2005). Climatic controls on central African hydrology during the past 20,000 years. Nature 437, 1003-1006. 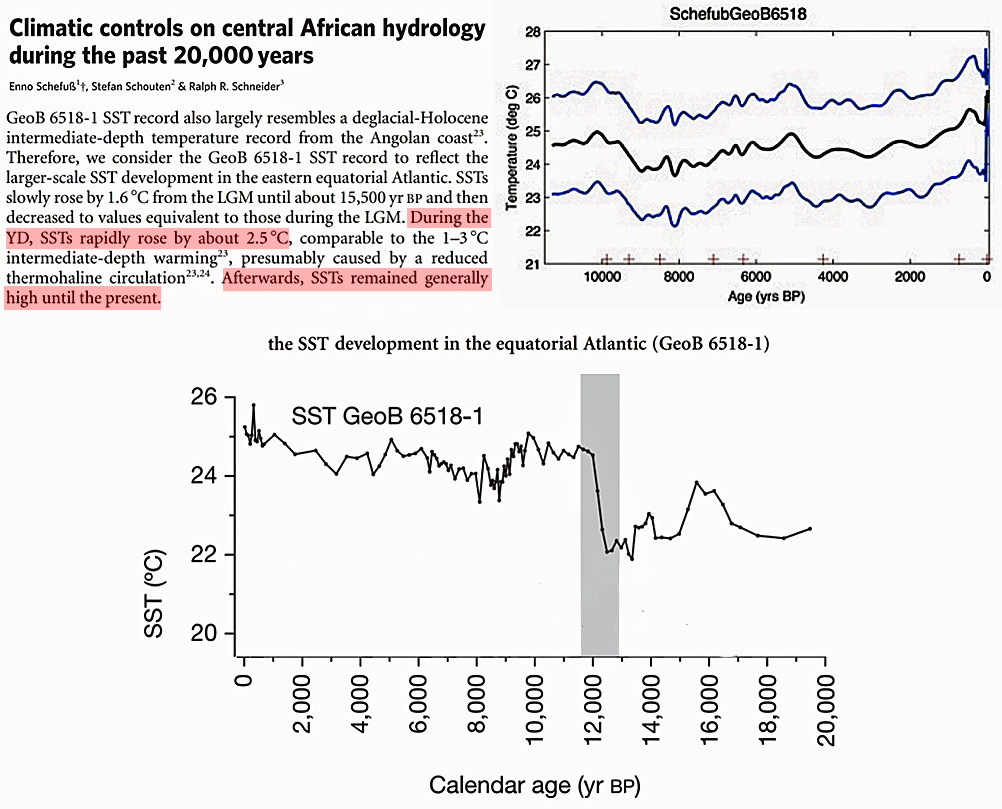
Holocene peak +1.7°C warmer than present
Seppä and Birks, 2001 Seppä, H., and Birks, H. J. B. (2001). July mean temperature and annual precipitation trends during the Holocene in the Fennoscandian tree-line area: pollen-based climate reconstructions. The Holocene 11, 527-539. 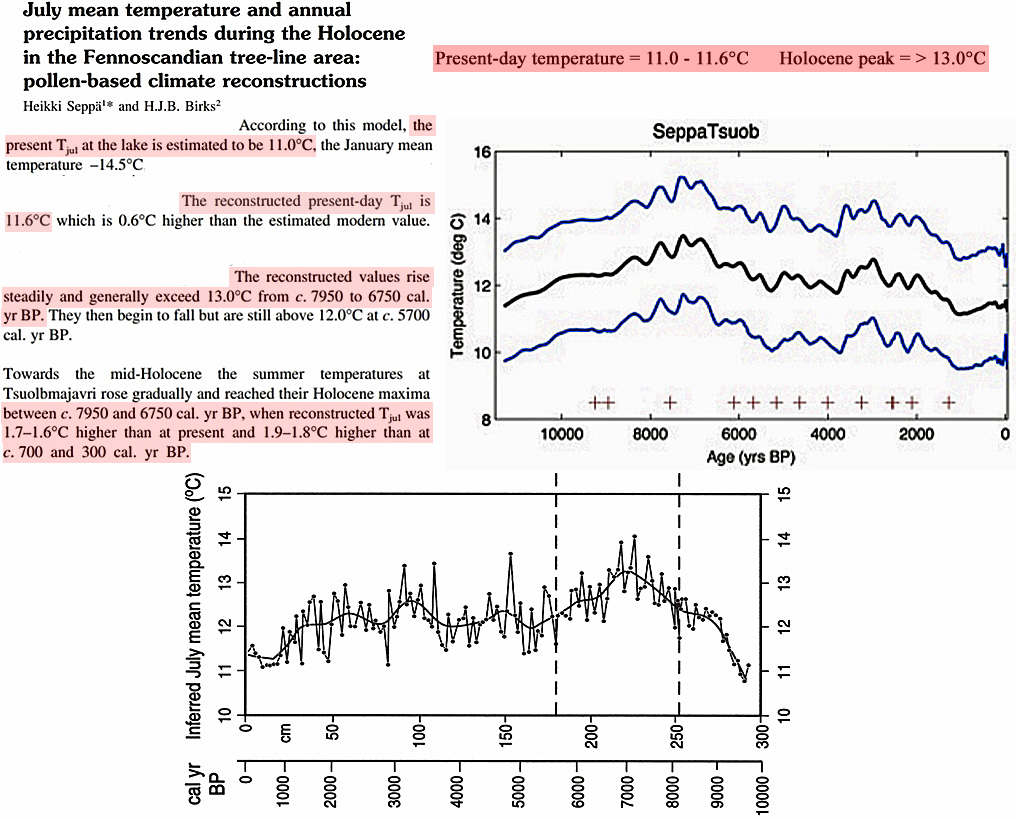
Holocene peak +2.5ºC warmer than present
Seppä et al. 2005 Seppä, H., Hammarlund, D., and Antonsson, K. (2005). Low-frequency and high-frequency changes in temperature and effective humidity during the Holocene in south-central Sweden: implications for atmospheric and oceanic forcings of climate. Climate Dynamics 25, 285-297.


Recent Comments