I. Failing/Failed Renewable Energy, Climate Policies (10)
Jones and Warner, 2016 Here we quantify the changes in the global energy mix necessary to address population and climate change under two energy-use scenarios, finding that renewable energy production (9% in 2014) must comprise 87–94% of global energy consumption by 2100. Our study suggests >50% renewable energy needs to occur by 2028 in a <2 °C warming scenario
(press release) Efforts to curtail world temps will almost surely fail… The Texas A&M researchers modelled the projected growth in global population and per capita energy consumption, as well as the size of known reserves of oil, coal and natural gas, and greenhouse gas emissions to determine just how difficult it will be to achieve the less-than-2 degree Celsius warming goal. “It would require rates of change in our energy infrastructure and energy mix that have never happened in world history and that are extremely unlikely to be achieved,” explains Jones. “Just considering wind power, we found that it would take an annual installation of 485,000 5-megawatt wind turbines by 2028. The equivalent of about 13,000 were installed in 2015. That’s a 37-fold increase in the annual installation rate in only 13 years to achieve just the wind power goal,” adds Jones. Similar expansion rates are needed for other renewable energy sources. “To even come close to achieving the goals of the Paris Agreement, 50 percent of our energy will need to come from renewable sources by 2028, and today it is only 9 percent, including hydropower. For a world that wants to fight climate change, the numbers just don’t add up to do it.”
DeCicco et al., 2016U.S. biofuel use to date is associated with a net increase rather than a net decrease in CO2 emissions.
(press release) The researchers conclude that rising biofuel use has been associated with a net increase — rather than a net decrease, as many have claimed — in the carbon dioxide emissions that cause global warming. …“When it comes to the emissions that cause global warming, it turns out that biofuels are worse than gasoline,” DeCicco said. “So the underpinnings of policies used to promote biofuels for reasons of climate have now been proven to be scientifically incorrect. … “Policymakers should reconsider their support for biofuels. This issue has been debated for many years. What’s new here is that hard data, straight from America’s croplands, now confirm the worst fears about the harm that biofuels do to the planet.”
Lomborg, 2016All climate policies by the US, China, the EU and the rest of the world, implemented from the early 2000s to 2030 and sustained through the century will likely reduce global temperature rise about 0.17°C in 2100. These impact estimates are robust to different calibrations of climate sensitivity, carbon cycling and different climate scenarios. Current climate policy promises will do little to stabilize the climate and their impact will be undetectable for many decades.
Campbell, 2016What does the Paris Agreement actually do? … Though very widely believed to be inadequate in the target it sets, the Paris Agreement is commonly thought actually to set a binding target of reducing global CO2e emissions so as to limit global warming to 2℃. Proper legal interpretation of the Agreement shows it to set no such target. It rather gives the newly industrialising countries such as China and India a permission to emit as much as they see fit. These countries have been principally responsible for the huge growth in emissions since 1990 and they will be responsible for their continued huge growth until 2030. The Paris Agreement therefore makes the policy of mitigation of global warming impossible. However, this policy has been impossible over the whole of the now more than a quarter century of international climate change policy.
Moriarty and Honnery, 2016 Highlights: We argueit is unlikely that RE [renewable energy] can meet existing global energy use. … Fossil fuels face resource depletion, supply security, and climate change problems; renewable energy (RE) may offer the best prospects for their long-term replacement. However, RE sources differ in many important ways from fossil fuels, particularly in that they are energy flows rather than stocks. The most important RE sources, wind and solar energy, are also intermittent, necessitating major energy storage as these sources increase their share of total energy supply. We show that estimates for the technical potential of RE vary by two orders of magnitude, and argue that values at the lower end of the range must be seriously considered, both because their energy return on energy invested falls, and environmental costs rise, with cumulative output. Finally, most future RE output will be electric, necessitating radical reconfiguration of existing grids to function with intermittent RE.
Ferroni and Hopkirk, 2016 Many people believe renewable energy sources to be capable of substituting fossil or nuclear energy. However there exist very few scientifically sound studies, which apply due diligence to substantiating this impression. … The main reasons are due to the fact that on one hand, solar electricity is very material-intensive, labour-intensive and capital-intensive and on the other hand the solar radiation exhibits a rather low power density. … [A]n electrical supply system based on today’s PV [solar electricity] technologies cannot be termed an energy source, but rather a non-sustainable energy sink … [I]t has become clear that photovoltaic energy at least will not help in any way to replace the fossil fuel.
Janković and Schultz, 2016 First, weather extremes are only one of the predicted effects of climate change and are best addressed by measures other than emission policies. Second, a pre-industrial climate may remain a policy goal, but is unachievable in reality. Third, the damages caused by any anthropogenically driven extremes may be overshadowed by the damages caused by increased exposure and vulnerability to the future risk. In reality, recent increases in damages and losses due to extreme weather events are due to societal factors. Thus, invoking atmosfear through such approaches as attribution science is not an effective means of either stimulating or legitimizing climate policies.
Bannaga, 2016 It is evident that UN efforts to combat climate change are not effective because past experience shows that CO2 generation cuts weren’t near enough. The recent Paris Agreement may restore a faith in UN process if implemented but doesn’t reduce temperatures as needed unless all drivers of climate variability are considered, particularly the abortive role of developing cities. The UN Programme appears to be focusing on attaining urban resilience rather than targeting grassroots causes. Urbane-bias global policies drive the rural population to leave their land and flood cities while over-usage of natural resources by the rich is left unchecked.
Kelly, 2016 The growth of the ecological footprint of a human population about to increase from 7B now to 9B in 2050 raises serious concerns about how to live both more efficiently and with less permanent impacts on the finite world. One present focus is the future of our climate, where the level of concern has prompted actions across the world in mitigation of the emissions of CO2. An examination of successful and failed introductions of technology over the last 200 years generates several lessons that should be kept in mind as we proceed to 80% decarbonize the world economy by 2050. I will argue that all the actions taken together until now to reduce our emissions of carbon dioxide will not achieve a serious reduction, and in some cases, they will actually make matters worse.
Tatchley, 2016 This thesis presents the results of the first survey of public attitudes specifically towards SWTs [small wind turbines] . Generally attitudes towards SWTs were positive, with over half of respondents rating SWTs as acceptable across a range of landscape settings. However, as for wind power where public attitudes in general are positive but local wind farm developments may still face opposition, only 35% of respondents were in favour of having a SWT [small wind turbine] installed in sight of their home.
II. Climate Model Unreliability/Biases and the Pause (34)
Sterl, 2016 The large heat capacity of the ocean as compared to the atmosphere provides a memory in the climate system that might have the potential for skilful climate predictions a few years ahead. However, experiments so far have only found limited predictability after accounting for the deterministic forcing signal provided by increased greenhouse gas concentrations. One of the problems is the drift that occurs when the model moves away from the initial conditions towards its own climate. This drift is often larger than the decadal signal to be predicted. In this paper we describe the drift occurring in the North Atlantic Ocean in the EC-Earth climate model and relate it to the lack of decadal predictability in that region. While this drift may be resolution dependent and disappear in higher resolution models, we identify a second reason for the low predictability. A subsurface heat content anomaly can only influence the atmosphere if (deep) convection couples it to the surface, but the occurrence of deep convection events is random and probably mainly determined by unpredictable atmospheric noise.
Kim et al., 2016 Cirrus clouds in the tropical tropopause layer (TTL) and water vapor transported into the stratosphere have significant impacts on the global radiation budget and circulation patterns. Climate models, however, have large uncertainties in representing dehydration and cloud processes in the TTL [tropical tropopause layer], and thus their feedback with surface climate, prohibiting an accurate projection of future global and regional climate changes.
Fyfe et al., 2016It has been claimed that the early-2000s global warming slowdown or hiatus, characterized by a reduced rate of global surface warming, has been overstated, lacks sound scientific basis, or is unsupported by observations. The evidence presented here contradicts these claims.
(press release) “There is this mismatch between what the climate models are producing and what the observations are showing,” says lead author John Fyfe, a climate modeller at the Canadian Centre for Climate Modelling and Analysis in Victoria, British Columbia. “We can’t ignore it.” … Susan Solomon, a climatologist at the Massachusetts Institute of Technology in Cambridge, says that Fyfe’s framework helps to put twenty-first-century trends into perspective, and clearly indicates that the rate of warming slowed down at a time when greenhouse-gas emissions were rising dramatically.
Fan et al., 2016 Over the past decade, the number of studies that investigate aerosol-cloud interactions has increased considerably. Although tremendous progress has been made to improve our understanding of basic physical mechanisms of aerosol-cloud interactions and reduce their uncertainties in climate forcing, we are still in poor understanding of (1) some of the mechanisms that interact with each other over multiple spatial and temporal scales, (2) the feedbacks between microphysical and dynamical processes and between local-scale processes and large-scale circulations, and (3) the significance of cloud-aerosol interactions on weather systems as well as regional and global climate. … [A] lack of concurrent profile measurements of cloud dynamics, microphysics, and aerosols over a wide region on the observation side and the large variability of cloud microphysics parameterizations resulting in a large spread of modeling results on the modeling side. Therefore, large efforts are needed to escalate our understanding.
Pitkänen et al., 2016 The results show, that data uncertainties can significantly bias data comparisons due to regression dilution and RTM, a fact that is known in statistics, but disregarded in atmospheric sciences. Thus we argue, that often these biases are widely regarded as measurement or modeling errors, for instance, while they in fact are artificial. It is essential that atmospheric and geoscience communities become aware of and consider these features in research.
Wegmann et al., 2016The early twentieth century Arctic warming (ETCAW) between 1920 and 1940 is an exceptional feature of climate variability in the last century. Its warming rate was only recently matched by recent warming in the region. Unlike recent warming largely attributable to anthropogenic radiative forcing, atmospheric warming during the ETCAW was strongest in the mid-troposphere and is believed to be triggered by an exceptional case of natural climate variability. Nevertheless, ultimate mechanisms and causes for the ETCAW are still under discussion. Here we use state of the art multi-member global circulation models, reanalysis and reconstruction datasets to investigate the internal atmospheric dynamics of the ETCAW. We investigate the role of boreal winter mid-tropospheric heat transport and circulation in providing the energy for the large scale warming. Analyzing sensible heat flux components and regional differences, climate models are not able to reproduce the heat flux evolution found in reanalysis and reconstruction datasets.
Ghan et al., 2016 A large number of processes are involved in the chain from emissions of aerosol precursor gases and primary particles to impacts on cloud radiative forcing. … Given the diversity of the relationships, constraints are needed to guide model development and reduce uncertainty in estimates of the radiative forcing. Unfortunately, the preindustrial observations needed to constrain the sensitivities are not available. … Removing those biases is necessary if climate models are to be used for simulations of future climate change. Additional data characterizing each of the factors and components are needed. Some of the necessary data (L, re, aerosol optical depth) are available from 1990, but reliable estimates ofNd,τ, andRare not available for years before 2001, when the Earth Observing System satellite constellation was launched
Hawkins et al., 2016Irreducible uncertainty in near-term climate projections … These results suggest that climate projections need to be performed with many more ensemble members than at present, using a range of ocean initial conditions, if the uncertainty in near-term regional climate is to be adequately quantified. … The presence of initial condition uncertainty and non-linearity produces significant irreducible uncertainty in future regional climate changes. For trends of 20 years, the climate change signal rarely emerges from the noise of internal variability in FAMOUS. Uncertainty in future trends of temperature and precipitation reduce for longer trends as the initial condition uncertainty saturates.
Zhao et al., 2016 The authors demonstrate that model estimates of climate sensitivity can be strongly affected by the manner through which cumulus cloud condensate is converted into precipitation in a model’s convection parameterization, processes that are only crudely accounted for in GCMs. … Given current uncertainties in representing convective precipitation microphysics and the current inability to find a clear observational constraint that favors one version of the authors’ model over the others, the implications of this ability to engineer climate sensitivity need to be considered when estimating the uncertainty in climate projections.
Zhang, 2016Global mean surface temperature (GMST) rising has slowed down since late 1990s, which is referred to as the global warming hiatus. There was another global warming hiatus event during 1940s–1960s. The roles of the external forcing and the natural variability in both global warming hiatuses are explored, using EOF analysis. The first two leading EOF modes of the 5-year running mean global sea surface temperature (SST) reflect the global warming scenario (EOF1) and the interdecadal Pacific oscillation (IPO)-like natural variability (EOF2), respectively. In observation, PC2 was in its positive phase (eastern Pacific cooling) during 1940s–1960s, which contributed to the previous warming hiatus. In addition, GMST trends are found to be negative during late 1950s and 1960s in most of the CMIP5 historical runs, which implies that the external forcing also contributed to the pause in the GMST rising. It is further demonstrated that it is the natural radiative forcing (volcanic forcing) that caused the drop-down of GMST in 1960s. The current global warming hiatus has been attributed to the eastern Pacific cooling/enhanced Pacific trade winds.It is shown that the PC2 switched to its positive phase in late 1990s, and hence the IPO-like natural variability made a contribution to the slowdown of GMST rising in the past decade.
Stone and Hansen, 2016Despite being a well-established research field, the detection and attribution of observed climate change to anthropogenic forcing is not yet provided as a climate service. … Deployment of the method on 116 regional assessments of recent temperature and precipitation changes indicates that existing rules of thumb concerning the detectability of climate change ignore the full range of sources of uncertainty, most particularly the importance of adequate observational monitoring.
Wagner and Zeckhauser, 2016Confronting Deep and Persistent Climate Uncertainty … Despite important advances in other areas of climate science, we have discovered new uncertainties that make us even less confident about the range of equilibrium climate sensitivity than we were before the latest IPCC report was published. Given the increasing marginal costs of global warming, greater uncertainty, other factors equal, raises the returns from curbing greenhouse gases. Themassive uncertainties afflicting climatechange should be a prod to policy action.
Rypdal and Rypdal, 2016The analysis of additivity in the ZC model suffers from a confusing presentation of results based on an invalid approximation, and from ignoring the effect of internal variability. We present tests without this approximation which are not able to detect nonlinearity in the response, even without accounting for internal variability. We also demonstrate that internal variability will appear as subadditivity if it is not accounted for. L&V’s analysis of intermittencies is based on a mathematical result stating that the intermittencies of forcing and response are the same if the response is linear. We argue that there are at least three different factors that may invalidate the application of this result for these data.
Ljungqvist et al., 2016 We find a larger percentage of land area with relatively wetter conditions in the ninth to eleventh and the twentieth centuries, whereas drier conditions are more widespread between the twelfth and nineteenth centuries. Our reconstruction reveals that prominent seesaw patterns of alternating moisture regimes observed in instrumental data across the Mediterranean, western USA, and China have operated consistently over the past twelve centuries. …. [T]he intensification of the twentieth-century-mean hydroclimate anomalies in the simulations, as compared to previous centuries, is not supported by our new multi-proxy reconstruction. This finding suggests that much work remains before we can model hydroclimate variability accurately, and highlights the importance of using palaeoclimate data to place recent and predicted hydroclimate changes in a millennium-long context.
(press release) According to a new study, the Northern Hemisphere has experienced considerably larger variations in precipitation during the past twelve centuries than in the twentieth century. Researchers from Sweden, Germany, and Switzerland have found that climate models overestimated the increase in wet and dry extremes as temperatures increased during the twentieth century.
Ukkola et al., 2016The simulated Edrought magnitude was ~8 times greater than observed and twice as intense. Our findings point to systematic biases across LSMs [land surface models] when simulating water and energy fluxes under water-stressed conditions. The overestimation of key Edrought characteristics undermines our confidence in the models’ capability in simulating realistic drought responses to climate change and has wider implications for phenomena sensitive to soil moisture, including heat waves.
Xie et al., 2016As the recent global warming hiatus has attracted worldwide attention, we examined the robustness of the warming hiatus in China and the related dynamical mechanisms in this study. Based on the results confirmed by the multiple data and trend analysis methods, we found that the annual mean temperature in China had a cooling trend during the recent global warming hiatus period, which suggested a robust warming hiatus in China. The warming hiatus in China was dominated by the cooling trend in the cold season, which was mainly induced by the more frequent and enhanced extreme-cold events.
McDonald, 2016There are many cases where the climate models do not agree with the empirical data. For instance, the data from radiosondes (and MSUs) do not show the amount of warming in the upper troposphere that is predicted by the models (Thorne et al. 2011). … [A] paradigm shift to Saussure’s scheme, where the thermal radiation is absorbed at the base of the atmosphere, rather than throughout the atmosphere as in Fourier’s scheme, may solve many climate models problems. In this new paradigm the boundary layer continually exchanges radiation with the surface. Thus only at two instants during the day is there no net gain or loss of heat by the boundary layer from the surface, and so that layer is not in LTE. Moreover, since the absorption of outgoing longwave radiation is saturated within the boundary layer, it has little influence on the TOA [top of the atmosphere] balance. That balance is mostly maintained by changes in albedo, e.g. clouds and ice sheets. Use of this paradigm can explain why the excess warming in south western Europe was caused by water vapour close to the surface (Philipona et al. 2005), and may also explain why there are difficulties in closing the surface radiation balance (Wild et al. 2013) and in modelling abrupt climate change (White et al. 2013).
Markonis et al., 2016 Recent studies have showed that there is a significant decrease in rainfall over Greece during the last half of the previous century, following an overall decrease of the precipitation at the eastern Mediterranean. However, during the last decade an increase in rainfall was observed in most regions of the country, contrary to the general circulation climate models forecasts. … Our findings show that (a) change occurs in different scales; most regions show a decline since 1950, an increase since 1980 and remain stable during the last 15 years; (b) the significance of the observed decline is highly dependent to the statistical assumptions used; there are indications that the Mann-Kendall test may be the least suitable method
Zhang et al., 2016 It is now recognized that Earth’s upper atmosphere is experiencing a long-term cooling over the past several solar cycles. The potential impact of the cooling on societal activities is significant, but a fundamental scientific question exists regarding the drivers of the cooling. … The aggregate radar observations have very comparable and consistent altitude dependence of long-term trends. In particular, the lower F region (< 275 km) exhibits dayside cooling trends that are significantly higher (-3 to -1K/year at 250 km) than anticipated from model predictions given the anthropogenic increase of greenhouse gases. Above 275 km, cooling trends continue to increase in magnitude but values are strongly dependent on magnetic latitude, suggesting the presence of significant downward influences from non-neutral atmospheric processes.
Harrison et al., 2016 Palaeoclimate assessment has demonstrated that changes in large-scale features of climate that are governed by the energy and water balance show consistent responses to changes in forcing in different climate states, and these consistent responses are reproduced by climate models. However, state-of-the-art models are still largely unable to reproduce observed changes in climate at a regional scale reliably. While palaeoclimate analyses of state-of-the-art climate models suggest an urgent need for model improvement, much work is also needed on extending and improving palaeoclimate reconstructions and quantifying and reducing both numerical and interpretative uncertainties.
Zhou and Penner, 2016Observation-based studies have shown that the aerosol cloud lifetime effect or the increase of cloud liquid water (LWP) with increased aerosol loading may have been overestimated in climate models.
Lehner et al., 2016 Comparisons of the observed global-scale cooling following recent volcanic eruptions to that simulated by climate models from the Coupled Model Intercomparison Project 5 (CMIP5) indicate that the models overestimate the magnitude of the global temperature response to volcanic eruptions. Here we show that this overestimation can be explained as a sampling issue, arising because all large eruptions since 1951 coincided with El Niño events, which cause global-scale warming that partially counteracts the volcanically induced cooling. … Estimates of the relative contributions by anthropogenic and natural forcings inform our attempts to constrain transient and equilibrium climate sensitivity. Yet such attempts are inherently complicated by the fact that we observe only one of many possible climate trajectories. With internal variability contributing significantly to decadal-scale trends in certain quantities and regions, robust attribution of climate change can become challenging and sensitive to the particular realization of variability sampled in the observational record.
Sévellec et al., 2016 The nature of rogue events is their unlikelihood and the recent unpredicted decade-long slowdown in surface warming, the so-called hiatus, may be such an event. However, given decadal variability in climate, global surface temperatures were never expected to increase monotonically with increasing radiative forcing. Here, surface air temperature from twenty climate models is analysed to estimate the historical and future likelihood of hiatuses and “surges” (faster than expected warming), showing that the global hiatus of the early 21st Century was extremely unlikely.
Rehfeld and Laepple, 2016[C]limate model simulations might be considerably biased, overestimating the short-term negative associations between regional rainfall and temperature and lacking long-term positive relationships between them.
Hand, 2016Models suggest that climate change should weaken the AMOC as warmer Arctic temperatures, combined with buoyant freshwater from Greenland’s melting ice cap, impede the formation of deep currents. But so far, limited ocean measurements show the AMOC to be far more capricious than the models have been able to capture.
Bracegirdle et al., 2016Predicting the Antarctic climate using climate models … Climate models are the main tool for making quantitative estimates of how Antarctic climate may change over the 21st century. There is high agreement on some aspects of the predictions provided by models, but improvements in understanding are needed in key components of the Antarctic climate system, such as sea ice and coastal ocean-ice shelf processes. In the near term (on timescales of a few years) the climate change signal is small compared to natural cycles (associated with phenomena such as El Niño), the remote impacts of which on the Antarctic atmosphere are difficult to predict. In the longer term (on multi-decadal timescales) the reliability of climate model predictions is limited by uncertainty over human emissions pathways, the realism of climate models, and feedbacks between other elements of the Earth System (e.g. ice sheets).
Chiodo and Polvani, 2016 An accurate assessment of the role of solar variability is a key step towards a proper quantification of natural and anthropogenic climate change. To this end, climate models have been extensively used to quantify the solar contribution to climate variability. However, owing to its large computational cost, the bulk of modeling studies to date have been performed without interactive stratospheric photochemistry: the impact of this simplification on the modeled climate system response to solar forcing remains largely unknown. … This has implications for simulations of the climate in the Last Millennium and geoengineering applications employing irradiance changes larger than those observed over the 11-year sunspot cycle, where models often use simplified treatments of stratospheric ozone that are inconsistent with the imposed solar forcing.
Stier, 2016Aerosol–cloud interactions are considered a key uncertainty in our understanding of climate change (Boucher et al., 2013). … [U]nderlying assumptions cannot be robustly tested with the small number of measurements available so that no reliable global estimate of cloud condensation nuclei exists. This study overcomes this limitation using a self-consistent global model (ECHAM-HAM) of aerosol radiative properties and cloud condensation nuclei. An analysis of the correlation of simulated aerosol radiative properties and cloud condensation nuclei reveals that common assumptions about their relationships are violated for a significant fraction of the globe: 71% of the area of the globe shows correlation coefficients between CCN0.2% at cloud base and aerosol optical depth (AOD) below 0.5, i.e. AOD variability explains only 25% of the CCN variance. This has significant implications for satellite based studies of aerosol–cloud interactions. The findings also suggest that vertically resolved remote-sensing techniques, such as satellite-based high spectral resolution lidars, have a large potential for global monitoring of cloud condensation nuclei.
Arora et al., 2016Previous studies have shown a slowdown in the warming rate of the annual mean global surface temperature in the recent decade and it is referred to as the hiatus in global warming. Some recent studies have suggested that the hiatus in global warming is possibly due to strong cooling in the tropical Pacific. This study investigates the possible role of the Indian Ocean warming on the tropical Pacific cooling. Despite the continued rise in sea surface temperature (SST) over the tropical Indian Ocean, SST over the tropical Pacific has shown a cooling trend in the recent decade (2002–2012). It is well known fact that the Indian Ocean and the Pacific Ocean are strongly coupled to each other and the Indian Ocean basin wide warming is triggered by El Niño on interannual time scale.
Parker, 2016Atlantic Meridional Overturning Circulation is stable under global warming … Many new studies have been published supporting the hypothesis that the Atlantic Meridional Overturning Circulation (AMOC) is experiencing a slowdown. These studies are based on proxies, climate model predictions, or a combination of both. The latest work (1) is only based on predictions.
Sigmond and Fyfe, 2016The North American continent generally experienced a cooling trend in winter over the early 2000s. This cooling trend represented a significant deviation from expected anthropogenic warming and so requires explanation. Previous studies indicate that climate variations in the tropical Pacific contributed to many mid-latitude climate variations over the early twenty-first century. Here we show using large ensembles of fully coupled, partially coupled and uncoupled model simulations that in northwest North America the winter cooling was primarily a remote response to climate fluctuations in the tropical Pacific. By contrast, in central North America the winter cooling appears to have resulted from a relatively rare fluctuation in mid-latitude circulation that was unrelated to the tropical Pacific. Our results highlight how decadal climate signals—both remote and local in origin—can together offset anthropogenic warming to produce continental-scale cooling.
Rugenstein et al., 2016 The ocean dominates the planetary heat budget and takes thousands of years to equilibrate to perturbed surface conditions, yet those long time scales are poorly understood. Here we analyze the ocean response over a range of forcing levels and time scales in a climate model of intermediate complexity and in the CMIP5 model suite. We show that on century to millennia time scales the response time scales, regions of anomalous ocean heat storage, and global thermal expansion depend non-linearly on the forcing level and surface warming. As a consequence, it is problematic to deduce long term from short term heat uptake or scale the heat uptake patterns between scenarios. These results also question simple methods to estimate long term sea level rise from surface temperatures, and the use of deep sea proxies to represent surface temperature changes in past climate.
Gong et al., 2016 In addition to its influences on the regional climate, the AO [Arctic Oscillation] has significant implications for the climate change in the Northern Hemisphere. It is important to reproduce the pattern and related climate anomalies of AO in climate models realistically because the climate model is an essential tool to understand and project the future climate change. Unfortunately, the AO pattern in many climate models shows clear biases compared with that in observations.
Qian et al., 2016 The projection of future climate is one of the most complex problems undertaken by the scientific community. Although scientists have been striving to better understand the physical basis of the climate system and to improve climate models, the overall uncertainty in projections of future climate has not been significantly reduced [e.g., from the Intergovernmental Panel on Climate Change (IPCC) Fourth Assessment Report (AR4) to Fifth Assessment Report (AR5)]. With the rapid increase of complexity in Earth system models, reducing uncertainties in climate projections becomes extremely challenging. … Currently, concerns about model deficiencies in projections are assessed by the level of agreement within a multimodel ensemble and metrics that summarize how a certain response is obtained. There do not seem to be clear-cut answers on how to account for the effects of missing physics.
III. Elevated CO2 Greens Planet, Raises Crop Yields (10)
Lu et al., 2016Elevated CO2 as a driver of global dryland greening …While recent findings based on satellite records indicate a positive trend in vegetation greenness over global drylands, the reasons remain elusive. We hypothesize that enhanced levels of atmospheric CO2 play an important role in the observed greening through the CO2 effect on plant water savings and consequent available soil water increases. Meta-analytic techniques were used to compare soil water content under ambient and elevated CO2 treatments across a range of climate regimes, vegetation types, soil textures and land management practices. Based on 1705 field measurements from 21 distinct sites, a consistent and statistically significant increase in the availability of soil water (11%) was observed under elevated CO2 treatments in both drylands and non-drylands, with a statistically stronger response over drylands (17% vs. 9%). Given the inherent water limitation in drylands, it is suggested that the additional soil water availability is a likely driver of observed increases in vegetation greenness.
Fitzgerald et al., 2016Elevated atmospheric [CO2] can dramatically increase wheat yields in semi-arid environments and buffer against heat waves … Wheat production will be impacted by increasing concentration of atmospheric CO2 [CO2], which is expected to rise from about 400 μmol mol−1 in 2015 to 550 μmol mol−1 by 2050. … The Australian Grains Free Air CO2 Enrichment (AGFACE) facility was established to compare wheat (Triticum aestivum) growth and yield under ambient (~370 μmol−1 in 2007) and e[CO2] (550 μmol−1) in semi-arid environments. Experiments were undertaken at two dryland sites (Horsham and Walpeup) across three years with two cultivars, two sowing times and two irrigation treatments. Mean yield stimulation due to e[CO2] was 24% at Horsham and 53% at Walpeup, with some treatment responses greater than 70%, depending on environment. Under supplemental irrigation, e[CO2] stimulated yields at Horsham by 37% compared to 13% under rainfed conditions, showing that water limited growth and yield response to e[CO2]. Heat wave effects were ameliorated under e[CO2] as shown by reductions of 31 and 54% in screenings and 10 and 12% larger kernels (Horsham and Walpeup).
Oliveira et al., 2016Elevated CO2 Atmosphere Minimizes the Effect of Drought on the Cerrado Species Chrysolaena obovata. … The results indicate that under elevated [CO2], the negative effects of water restriction on physiological processes were minimized, including the maintenance of rhizophore water potential, increase in water use efficiency, maintenance of photosynthesis and fructan reserves for a longer period, conditions that shall favor the conservation of this species in the predicted climate change scenarios.
Roy et al., 2016 Extreme climatic events (ECEs) such as droughts and heat waves are predicted to increase in intensity and frequency and impact the terrestrial carbon balance. However, we lack direct experimental evidence of how the net carbon uptake of ecosystems is affected by ECEs under future elevated atmospheric CO2concentrations (eCO2). … Our results indicate that eCO2[elevated CO2] not only slows down the decline of ecosystem carbon uptake during the ECE [extreme climate events] but also enhances its recovery after the ECE , as mediated by increases of root growth and plant nitrogen uptake induced by the ECE. These findings indicate that, in the predicted near future climate, eCO2 could mitigate the effects of extreme droughts and heat waves on ecosystem net carbon uptake.
Thomas et al., 2016Observations show an increasing amplitude in the seasonal cycle of CO2 (ASC) north of 45° N of 56 ± 9.8% over the last 50 years and an increase in vegetation greenness of 7.5-15% in high northern latitudes since the 1980’s. Modelled increases in greenness are primarily driven by warming whereas ASC changes are primarily driven by increasing CO2.
Abebe et al., 2016 Highlights: Effect of elevated CO2 and temperature on maize was studied using open top chamber. Grain yield and yield attributes increased with elevated CO2 in north–west India. Elevated temperature decreased yield but improved grain nutrient contents. Elevated CO2 reduced the negative effects of elevated temperature on maize yield. …Elevated CO2 increased grain yield of maize by 53.7% and harvest index (HI) by 2.9% compared to ambient CO2. Stover yield and yield attributes such as cob length, cob diameter, grain weight cob−1, number of grains cob−1 and 100 grain weight also increased with elevated CO2.
Vejpustková et al., 2016 Trees growing in a pure aspen stand were selected according to the CO-gas regime within their rooting zone. Five high [CO2] trees (10–25% CO2 in the soil) and five low [CO2] trees (up to 3% CO2 in the soil) were sampled. Stem growth analysis of each trunk was carried out to study growth pattern in detail. High and low [CO2] trees significantly differed in a growth rate. At the age of 25 years, the basal area of high [CO2] trees exceeded low [CO2] trees by 39 %. The positive effect of CO2 on annual increment was pronounced particularly in the years with optimal growing conditions. Results suggest that trees can be fertilized not only by elevated atmospheric CO2 but also when fed with CO2 via the roots.
Zhu et al., 2016 Global environmental change is rapidly altering the dynamics of terrestrial vegetation, with consequences for the functioning of the Earth system and provision of ecosystem services. Yet how global vegetation is responding to the changing environment is not well established. Here we use three long-term satellite leaf area index (LAI) records and ten global ecosystem models to investigate four key drivers of LAI trends during 1982–2009. We show a persistent and widespread increase of growing season integrated LAI (greening) over 25% to 50% of the global vegetated area, whereas less than 4% of the globe shows decreasing LAI (browning). Factorial simulations with multiple global ecosystem models suggest that CO2 fertilization effects explain 70% of the observed greening trend, followed by nitrogen deposition (9%), climate change (8%) and land cover change (LCC) (4%). CO2 fertilization effects explain most of the greening trends in the tropics, whereas climate change resulted in greening of the high latitudes and the Tibetan Plateau.
van der Kooi et al., 2016Exposure of plants to elevated CO2 (eCO2) has a number of physiological effects, including increased photosynthetic carbon fixation and decreased stomatal conductance, resulting in greater growth and yield and also improved water use efficiency. Therefore, eCO2[elevated CO2] is considered to ameliorate the adverse effects of drought. … Our results suggest that crops grown in areas with limited water availability will benefit from future eCO2[elevated CO2], regardless of their metabolism. Drought leads to stomatal limitation of photosynthesis in both C3 and C4 crops, which is alleviated when the plants are grown under eCO2.
Mao et al., 2016Significant land greening in the northern extratropical latitudes (NEL) has been documented through satellite observations during the past three decades. Our findings reveal that the observed greening record is consistent with an assumption of anthropogenic forcings, where greenhouse gases play a dominant role, but is not consistent with simulations that include only natural forcings and internal climate variability. These results provide the first clear evidence of a discernible human fingerprint on physiological vegetation changes other than phenology and range shifts.
IV. Wind Turbines, Solar Utilities Endangering Wildlife (7)
Hein and Schirmacher, 2016Two recent attempts were made to estimate bat fatality in the United States for 2012. Hayes (2013) followed a similar approach to Cryan (2011) and based his analysis primarily on the limited dataset from Arnet et al. (2008). Hayes (2013) indicated that >600,000 bats were killed at wind energy facilities in 2012 and suggested that this was a conservative estimate. Smallwood (2013) estimated up to 888,000 bats were killed in the United States in 2012. … We suggest that each of these be considered an order of magnitude estimate; taken together, they highlight the almost certain large number of bats being killed (i.e., on the order of hundreds of thousands per year) in the United States and Canada. Given that bats have a low reproductive rate—typically only having 1 or 2 pups/year—and require high adult survivorship to avoid population declines (Barclay and Harder 2003), this level of impact presumably puts bat populations at risk. Moreover, many species were thought to be declining prior to the onset and expansion of wind energy development, including species impacted by white-nose syndrome (Winhold et al. 2008, Frick et al. 2010). Although population data are sparse or lacking for many bat species, current and presumed future level of fatality is considered to be unsustainable, and actions to reduce impact of wind turbines on bats should be implemented immediately.
O’Shea et al., 2016 Two factors led to a major shift in causes of MMEs [multiple mortality events] in bats at around 2000: the global increase of industrial wind-power facilities and the outbreak of white-nose syndrome in North America.Collisions with wind turbines and white-nose syndrome are now the leading causes of reported MMEs [multiple mortality events] in bats.
Zimmerling and Francis, 2016Bat mortality due to wind turbines in Canada … On average, 15.5 ± 3.8 (95% CI) bats were killed per turbine per year at these sites (range = 0−103 bats/turbine/yr at individual wind farms). Based on 4,019 installed turbines (the no. installed in Canada by Dec 2013), an estimated47,400 bats (95% CI = 32,100−62,700) are killed by wind turbines each year in Canada. Installed wind capacity is growing rapidly in Canada, and is predicted to increase approximately 3.5-fold over the next 15 years, which could lead to direct mortality of approximately166,000 bats/year. … The little brown myotis (Myotis lucifugus), which was listed as Endangered in 2014 under the Species At Risk Act (SARA), accounted for 13% of all mortalities from wind turbines
Davila, 2016Our study focused on four single-standing turbines found in Erie, IL, Sherrard, IL, and two in Geneseo, IL. We searched for dead bat carcasses within a 48 m radius of the turbine base to determine frequency of bat mortality each week from 6/8/2015 to 10/31/2015 [20 weeks] to include summer roosting and fall migration periods. Dead bats located within the circular plot were marked with GPS, and species were identified. Anabat acoustic detectors were used to determine species present in the surrounding habitat. … Forty-three carcasses were found at the sites [approximately 11 bats killed per turbine in a 20-week period ], increasing in August, and continuing through the fall migration season. … [T]he increased passage of bat species during the fall migration, particularly during high wind, cause an increase bat mortality. Wind turbines are typically set to function only during high wind speeds. Bats of this region typically fly during wind speeds averaging no more than 8 m/s, so passage of bat species during high wind was not expected.
Hutchins and Leopold, 2016The United States is one of the world’s leaders in wind energy development. As of September 2014, there were 46,600 operational wind turbines … [T]he U.S. Department of Energy recently revised its original estimate of 20% of electrical energy being produced by wind by 2030 to a projected 35% by 2050 (Jackson 2015). This would mean tens of thousands of new turbines, many of which may be 152 to 213 m high, with blades as long as a football field, traveling at up to 274 km per hour. It would also mean hundreds of kilometers of new power lines and towers to carry this power into the national grid (Wernau 2014), both of which pose a substantial risk to wildlife, primarily birds, through collision and electrocution (Manville 2005, Loss et al. 2014). … While this rapid development of a clean, renewable energy resource may help our nation address anthropogenic climate change (Vasi 2011), it is also having a non-trivial impact on wildlife, particularly our ecologically important birds and bats (Smallwood 2013, Zimmerling et al. 2013, Loss et al. 2014, Erickson et al. 2014). Birds and bats are either struck by the wind turbine blades or, in the case of bats, injured or killed by the air-pressure changes associated with them (Baerwald et al. 2008).
Walston et al., 2016A preliminary assessment of avian mortality at utility-scale solar energy facilities in the United States … We estimated annual USSE [utility-scale solar energy] -related avian mortality to be between 16,200 and 59,400 birds in the southern California region, which was extrapolated to between 37,800 and 138,600 birds [killed per year] for all USSE [utility-scale solar energy] facilities across the United States that are either installed or under construction. … Based on turbine locations mapped by the USGS through July 2013, we calculated 4402 MW of total electric energy production of wind energy facilities in the study region. … Taking a capacity-weighted average mortality rate across projects in the region results in an estimate of 6.71 bird deaths/MW/year. In addition, based on Smallwood (2013) national mortality estimate of 573,093 birds across a total installed wind energy capacity of 51,630 MW in the United States (as of 2012), we estimated a national avian mortality rate of 11.10 birds/MW.
Katzner et al., 2016Golden Eagle fatalities and the continental-scale consequences of local wind-energy generation … Renewable energy production is expanding rapidly despite mostly unknown environmental effects on wildlife and habitats. …Geospatial analyses of δ2H values obtained from feathers showed that ≥25% of these APWRA[wind turbine]-killed eagles were recent immigrants to the population, most from long distances away (>100 km). … Demographic models implied that in the face of this mortality, the apparent stability of the local Golden Eagle population was maintained by continental-scale immigration. These analyses demonstrate that ecosystem management decisions concerning the effects of local-scale renewable energy can have continental-scale consequences.
(press release) The APWRA is one of the oldest wind farms in the country and one of the largest in the world originally with around 5,000 turbines. Worldwide, such facilities have been responsible for the deaths of 140,000 to 328,000 birds and 500,000 to 1.6 million bats, raising questions about their effects on population sustainability. … “The golden eagle fatalities at this one site have demonstrated consequences that extend across much of the range of the species across North America,” DeWoody said.
V. Heat Not Hazardous To Polar Bears, Humans (3)
York et al., 2016 Subpopulation growth rates and the probability of decline at current harvest levels were determined for 13 subpopulations of polar bears (Ursus maritimus) that are within or shared with Canada based on mark–recapture estimates of population numbers and vital rates, and harvest statistics using population viability analyses (PVA). … Considering both TEK [traditional ecological knowledge] and scientific information, we suggest that the current status of Canadian polar bear subpopulations in 2013 was 12 stable/increasing and one declining (Kane Basin). We do not find support for the perspective that polar bears within or shared with Canada are currently in any sort of climate crisis. We show that much of the scientific evidence indicating that some polar bear subpopulations are declining due to climate change-mediated sea ice reductions is likely flawed by poor mark–recapture (M-R) sampling and that the complex analysis models employed to overcome these capture issues apparently fail to provide accurate estimates of the demographic parameters used to determine subpopulation status. … There is no trend evident from the summed subpopulation numbers from the PBSG status reports. Other indications of individual subpopulation decline are in conflict with aerial survey results, TEK [traditional ecological knowledge from native populations], or subject to sampling ambiguity, with the exception of the KB subpopulation. … We hypothesize that when polar bear subpopulation trends are evaluated by both M-R sampling and TEK; notable differences are most likely due to errors in scientific methodology rather than mistaken TEK [traditional ecological knowledge].
Shaposhnikov and Revich, 2016 Highlights: Cold spells seem to be more hazardous to human health than heat waves. …Heat waves and cold spells were identified during 1999–2007. Statistical analysis of mortality from all non-traumatic, cardiovascular, respiratory and all external causes among age groups 30–64 and ⩾65 allowed to obtain site-specific and then pooled estimates of relative increases in mortality separately for heat and cold waves. The evidence of impacts of cold on mortality was more robust than the same for heat.
Arbuthnott et al., 2016 The electronic searches returned 9183 titles and abstracts, of which eleven studies examining the effects of ambient temperature over time were included and six studies comparing the effect of different heatwaves at discrete time points were included. Of the eleven papers that quantified the risk of, or absolute heat related mortality over time, ten found a decrease in susceptibility over time of which five found the decrease to be significant. The magnitude of the decrease varied by location. Only two studies attempted to quantitatively attribute changes in susceptibility to specific adaptive measures and found no significant association between the risk of heat related mortality and air conditioning prevalence within or between cities over time. Four of the six papers examining effects of heatwaves found a decrease in expected mortality in later years. Five studies examined the risk of cold. In contrast to the changes in heat related mortality observed, only one found a significant decrease in cold related mortality in later time periods. … There is evidence that across a number of different settings, population susceptibility to heat and heatwaves has been decreasing. These changes in heat related susceptibility have important implications for health impact assessments of future heat related risk. A similar decrease in cold related mortality was not shown.
VI. Less Extreme, Unstable Weather With Warming (15)
van der Wiel et al., 2016 [T]he observed record and historical model experiments were used to investigate changes in the recent past. In part because of large intrinsic variability, no evidence was found for changes in extreme precipitation attributable to climate change in the available observed record
D’Aleo and Khandekar, 2016 In recent years, media and scientific journals have given increasing attention to worldwide extreme weather (EW) events and their possible relation to climate change and to specifically model proposed warming of the earth’s climate. This warming, which has been linked to human CO2 emissions, has been referred to by the Intergovernmental Panel on Climate Change (IPCC) as anthropogenic global warming (AGW). A brief overview of the ongoing debate is presented, synthesizing worldwide EW events of last decades and analyzing the possible linkage between EW and AGW. Data show that the postulated AGW/EW [extreme weather/anthropogenic global warming] link is a perception rather than reality, the perception being fostered by increased and uncritical media attention to recent EW [extreme weather] events.
Gaucherel and Moron, 2016‘Tipping points’ (TPs) are thresholds of potentially disproportionate changes in the Earth’s climate system associated with future global warming and are considered today as a ‘hot’ topic in environmental sciences. In this study, TP interactions are analysed from an integrated and conceptual point of view using two qualitative Boolean models built on graph grammars. They allow an accurate study of the node TP interactions previously identified by expert elicitation and take into account a range of various large-scale climate processes potentially able to trigger, alone or jointly, instability in the global climate. Our findings show that, contrary to commonly held beliefs, far from causing runaway changes in the Earth’s climate, such as self-acceleration due to additive positive feedbacks, successive perturbations might actually lead to its stabilization. A more comprehensive model defined TPs as interactions between nine (non-exhaustive) large-scale subsystems of the Earth’s climate, highlighting the enhanced sensitivity to the triggering of the disintegration of the west Antarctic ice sheet. We are claiming that today, it is extremely difficult to guess the fate of the global climate system as TP sensitivity depends strongly on the definition of the model. Finally, we demonstrate the stronger effect of decreasing rules (i.e. mitigating connected TPs) over other rule types, thus suggesting the critical role of possible ‘stabilizing points’ that are yet to be identified and studied.
Boos and Sterelvmo, 2016Theoretical models have been used to argue that seasonal mean monsoons will shift abruptly and discontinuously from wet to dry stable states as their radiative forcings pass a critical threshold, sometimes referred to as a “tipping point.” Further support for a strongly nonlinear response of monsoons to radiative forcings is found in the seasonal onset of the South Asian summer monsoon, which is abrupt compared with the annual cycle of insolation. Here it is shown that the seasonal mean strength of monsoons instead exhibits a nearly linear dependence on a wide range of radiative forcings. … Thus, neither a physically correct theoretical model nor a comprehensive climate model support the idea that seasonal mean monsoons will undergo abrupt, nonlinear shifts in response to changes in greenhouse gas concentrations, aerosol emissions, or land surface albedo.
Tozer et al., 2016 Paleoclimate research indicates that the Australian instrumental climate record ( ∼ 100 years) does not cover the full range of hydroclimatic variability that is possible. To better understand the implications of this on catchment-scale water resources management, a 1013-year (1000– 2012 common era (CE)) annual rainfall reconstruction was produced for the Williams River catchment in coastal eastern Australia. … The reconstruction shows that significantly longer and more frequent wet and dry periods were experienced in the preinstrumental compared to the instrumental period [∼1900–2010]. This suggests that existing drought and flood risk assessments underestimate the true risks due to the reliance on data and statistics obtained from only the instrumental record.
Shi et al., 2016Patterns and trends of high-impact weather in China during 1959–2014 … The spatial and temporal characteristics of the frequencies of four types of high-impact weather (HIW), i.e. snowfall, thunderstorms, fog and hailstorms, were analysed in China during 1959–2014. Results indicate a significant decrease in the number of snowfall days, thunderstorm days and thunderstorm spells in all six regions of China, with regional decreasing rates of 0.1–3.4 days, 1.6–5.1 days and 0.23–0.77 times per decade respectively. The number of foggy days, hailstorm days and snowfall spells decreased at rates of 0.2–1.8 days, 0.1–0.7 days and 0.14–0.44 times per decade respectively in almost all regions and fog and hailstorm spells decreased at rates of 0.06–0.17 and 0.001–0.043 times per decade respectively in most regions of China.
Pausata et al., 2016 Following the devastating droughts that ravaged the Sahel in the 1970–1980s, many efforts have been directed at investigating climate variability in Northern Africa, focusing on vegetation–climate feedbacks and the dynamics of the West African Monsoon (WAM) system (Charney et al., 1975 and Giannini et al., 2003). However, the past millennia have witnessed much larger precipitation changes than those seen in recent decades. One of the most dramatic changes in the WAM began around 15000 yr BP, when increased summer precipitation led to an expansion of the North African lakes and wetlands. Grassland and shrubland covered areas that are currently desert (Holmes, 2008), giving origin to the so-called “Green Sahara”, or African Humid Period. The African Humid Period ended between ∼5500 and ∼4000 yr BP (Armitage et al., 2015, deMenocal et al., 2000, Shanahan et al., 2015 and Weldeab et al., 2007). Climate model simulations for the Mid-Holocene (MH, 6000 yr BP) are not currently able to fully reproduce the intensification and geographical expansion of the African monsoon (Harrison et al., 2014). Hargreaves et al. (2013) have shown that this is not a function of the resolution at which the data-model comparisons are made, and that the source of these discrepancies must lie in a shortcoming common to all models.
Mallakpour and Villarini, 2016 These results indicate that over the last 65 years, the stronger storms are not getting stronger, but a larger number of heavy precipitation events have been observed. The annual maximum precipitation and annual frequency of heavy precipitation reveal a marked seasonality over the contiguous USA. However, we could not find any evidence suggesting shifting in the seasonality of annual maximum precipitation by investigating whether the day of the year at which the maximum precipitation occurs has changed over time. Furthermore, we examine whether the year-to-year variations in the frequency and magnitude of heavy precipitation can be explained in terms of climate variability driven by the influence of the Atlantic and Pacific Oceans. Our findings indicate that the [natural] climate variability of both the Atlantic and Pacific Oceans can exert a large control on the precipitation frequency and magnitude over the contiguous USA.
Dezileau et al., 2016Storms and tsunamis, which may seriously endanger human society, are amongst the most devastating marine catastrophes that can occur in coastal areas. Many such events are known and have been reported for the Mediterranean, a region where high-frequency occurrences of these extreme events coincides with some of the most densely populated coastal areas in the world. In a sediment core from the Mar Menor (SE Spain), we discovered eight coarse-grained layers which document marine incursions during periods of intense storm activity or tsunami events. Based on radiocarbon dating, these extreme events occurred around 5250, 4000, 3600, 3010, 2300, 1350, 650, and 80 years cal BP. No comparable events have been observed during the 20th and 21st centuries. The results indicate little likelihood of a tsunami origin for these coarse-grained layers, although historical tsunami events are recorded in this region. These periods of surge events seem to coincide with the coldest periods in Europe during the late Holocene, suggesting a control by a climatic mechanism for periods of increased storm activity.
Bellprat and Doblas-Reyes, 2016Attribution of extreme weather and climate events overestimated by unreliable climate simulations … Event attribution aims to estimate the role of an external driver after the occurrence of an extreme weather and climate event by comparing the probability that the event occurs in two counterfactual worlds. These probabilities are typically computed using ensembles of climate simulations whose simulated probabilities are known to be imperfect. The implications of using imperfect models in this context are largely unknown, limited by the number of observed extreme events in the past to conduct a robust evaluation. Using an idealized framework, this model limitation is studied by generating large number of simulations with variable reliability in simulated probability. The framework illustrates that unreliable climate simulations are prone to overestimate the attributable risk to climate change. Climate model ensembles tend to be overconfident in their representation of the climate variability which leads to systematic increase in the attributable risk to an extreme event. Our results suggest that event attribution approaches comprising of a single climate model would benefit from ensemble calibration in order to account for model inadequacies similarly as operational forecasting systems.
Frazier and Giambelluca, 2016From 1920 to 2012, over 90% of the state experienced drying trends, with Hawai‘i Island, and in particular the western part of the island, experiencing the largest significant long-term declines in annual and dry season rainfall. The running trend analysis highlighted the multi-decadal variability present in these trends, and revealed that the only region in the state with persistent annual and dry season trends through the study period is the western part of Hawai‘i Island; for most other regions, the drying trends were not significant until the most recent part of the record was included. These results support previous studies that indicate drying across the state over recent decades, and reveal the timing of upward and downward trends as well as important spatial details for natural resource management in Hawai‘i.
van Wijngaarden and Syed, 2016Changes in annual precipitation over the Earth’s land mass excluding Antarctica from the 18th century to 2013 … The trends for precipitation change together with their 95% confidence intervals were found for various periods of time. Most trends exhibited no clear precipitation change. The global changes in precipitation over the Earth’s land mass excluding Antarctica relative to 1961-90 were estimated to be: -1.2. ±. 1.7, 2.6. ±. 2.5 and -5.4. ±. 8.1% per century for the periods 1850-2000, 1900-2000 and 1950-2000, respectively. A change of 1% per century corresponds to a precipitation change of 0.09. mm/year. … There are year to year as well as decadal fluctuations of precipitation that are undoubtedly influenced by effects such as the El Nino Southern Oscillation (ENSO) (Davey et al., 2014) and the North Atlantic Oscillation (NAO) (Lopez-Moreno et al., 2011). However, most trends over a prolonged period of a century or longer are consistent with little precipitation change. … Stations experiencing low, moderate and heavy annual precipitation did not show very different precipitation trends. This indicates deserts/jungles are neither expanding nor shrinking due to changes in precipitation patterns. It is therefore reasonable to conclude that some caution is warranted about claiming that large changes to global precipitation have occurred during the last 150 years.
Salzmann, 2016Global warming without global mean precipitation increase? … Global climate models simulate a robust increase of global mean precipitation of about 1.5 to 2% per kelvin surface warming in response to greenhouse gas (GHG) forcing. Here, it is shown that the sensitivity to aerosol cooling is robust as well, albeit roughly twice as large. This larger sensitivity is consistent with energy budget arguments. At the same time, it is still considerably lower than the 6.5 to 7% K−1 decrease of the water vapor concentration with cooling from anthropogenic aerosol because the water vapor radiative feedback lowers the hydrological sensitivity to anthropogenic forcings. When GHG and aerosol forcings are combined, the climate models with a realistic 20th century warming indicate that the global mean precipitation increase due to GHG warming has, until recently, been completely masked by aerosol drying. This explains the apparent lack of sensitivity of the global mean precipitation to the net global warming recently found in observations. As the importance of GHG warming increases in the future, a clear signal will emerge.
Guo et al., 2016Variability of Tornado Occurrence over the Continental United States since 1950 … The United States experiences the most tornadoes of any country in the world. Given the catastrophic impact of tornadoes, concern has arisen regarding the variation in climatology of U.S. tornadoes under the changing climate. … Based on the 64-year tornado records (1950-2013), we found that the trends in tornado temporal variability varied across the U.S., with only one-third of the continental area or three out of ten contiguous states (mostly from the Great Plains and Southeast, but where the frequency of occurrence of tornadoes is greater) displaying a significantly increasing trend. The other two-thirds area, where 60% of the U.S. tornadoes were reported (but the frequency of occurrence of tornadoes is less), however, showed a decreasing or a near-zero trend in tornado temporal variability. Furthermore, unlike the temporal variability alone,the combined spatial-temporal variability of U.S. tornado occurrence has remained nearly constant since 1950.
Pratte et al., 2016 The highest dust fluxes in the Baie bog were recorded from 1750–1000 cal. BP to 600–100 cal. BP and occur at the same time as periods of high variability in the macrofossil record (i.e. successive layers dominated by Sphagnum or Ericaceae). The timing of these events in the dust and macrofossil records also corresponds to documented cold periods. These two periods have been identified as episodes of climatic instability, which could have been caused by changes in the wind regime.
VII. No Increasing Trends In Intense Hurricanes (3)
Chang et al., 2016 Extratropical cyclones cause much of the high impact weather over the mid-latitudes. With increasing greenhouse gases, enhanced high-latitude warming will lead to weaker cyclone activity. Here we show that between 1979 and 2014, the number of strong cyclones in Northern Hemisphere in summer has decreased at a rate of 4% per decade, with even larger decrease found near northeastern North America. Climate models project a decrease in summer cyclone activity, but the observed decreasing rate is near the fastest projected. Decrease in summer cyclone activity will lead to decrease in cloud cover, giving rise to higher maximum temperature, potentially enhancing the increase in maximum temperature by 0.5 K or more over some regions. We also show that climate models may have biases in simulating the positive relationship between cyclone activity and cloud cover, potentially under-estimating the impacts of cyclone decrease on accentuating the future increase in maximum temperature.
Zarzycki, 2016Tropical cyclones (TCs), particularly those that are intense and/or slow-moving, induce sea surface temperature (SST) reductions along their tracks (commonly referred to as ‘cold wakes’) that provide a negative feedback on storm energetics by weakening surface enthalpy fluxes. … Here, an idealized slab ocean is coupled to a 0.25° variable-resolution version of the Community Atmosphere Model (CAM) to improve closure of the surface energy balance and reproduce observed Northern Hemisphere cold wakes. This technique produces cold wakes that are realistic in structure and evolution and with magnitudes similar to published observations, without impacting large-scale SST climatology. Multi-member ensembles show that the overall number of TCs generated by the model is reduced by 5-9% when allowing for two-way air-sea interactions. TC intensity is greatly impacted; the strongest 1% of all TCs are 20-30 hPa (4-8 m s−1) weaker and the number of simulated Category 4 and 5 TCs are reduced by 65% in slab ocean configurations. Reductions in intensity are in line with published thermodynamic theory. Additional offline experiments and sensitivity simulations demonstrate this response is both significant and robust. These results imply caution should be exercised when assessing high-resolution prescribed SST climate simulations capable of resolving intense TCs, particularly if discrete analysis of extreme events is desired.
Williams et al., 2016 Bayesian age–depth models, derived from eight AMS radiocarbon dates, suggest that the frequency of typhoon strikes was 2–5 times greater from 3900 to 7800 cal. yr. BP compared to 0–3900 cal. yr. BP. Possible explanations for this variability in the typhoon record are that typhoons were more frequent and/or more intense in Southeast Asia in the mid-Holocene because of climatic changes associated with the Mid-Holocene Warm Period or that the record reflects site sensitivity changes resulting from a mid-Holocene sea-level highstand.
VIII. No Increasing Trends In Drought Frequency, Severity (7)
Cheng et al., 2016 The current California drought has cast a heavy burden on statewide agriculture and water exacerbated by concurrent extreme high temperatures. Furthermore, industrial-era global radiative forcing brings into question the role of long-term climate change with regard to California drought. How has human-induced climate change affected California drought risk? Here, observations and model experimentation are applied to characterize this drought employing metrics that synthesize drought duration, cumulative precipitation deficit, and soil moisture depletion. The model simulations show that increases in radiative forcing since the late nineteenth century induce both increased annual precipitation and increased surface temperature over California, consistent with prior model studies and with observed long-term change. … The results thus indicate that the net effect of climate change has made agricultural drought less likely and that the current severe impacts of drought on California’s agriculture have not been substantially caused by long-term climate changes.
Prein et al., 2016 Summary and Conclusion: Projected changes of a poleward extension of the subtropical dry zones simulated by climate models and the corresponding decrease of precipitation in the U.S. Southwest have not been found in observations to date because of the large natural climate variability.
Milly and Dunne, 2016 By various measures (drought area and intensity, climatic aridity index, and climatic water deficits), some observational analyses have suggested that much of the Earth’s land has been drying during recent decades, but such drying seems inconsistent with observations of dryland greening and decreasing pan evaporation. ‘Offline’ analyses of climate-model outputs from anthropogenic climate change (ACC) experiments portend continuation of putative drying through the twenty-first century, despite an expected increase in global land precipitation. A ubiquitous increase in estimates of potential evapotranspiration (PET), driven by atmospheric warming, underlies the drying trends, but may be a methodological artifact. Here we show that the PET estimator commonly used (the Penman–Monteith PET for either an open-water surface or a reference crop) severely overpredicts the changes in non-water-stressed evapotranspiration computed in the climate models themselves in ACC experiments.
Stahle et al., 2016 The El Niño/Southern Oscillation (ENSO) is the most important ocean-atmospheric forcing of moisture variability detected with the MXDA. … [A]nalyses based on the millennium climate simulations with the Community Earth System Model suggest that the moisture balance during the winter, spring, and early summer over northern Mexico may indeed be particularly sensitive to ENSO forcing. Nationwide drought is predicted to become more common with anthropogenic climate change, but the MXDA reconstructions indicate that intense “All Mexico” droughts have been rare over the past 600 years and their frequency does not appear to have increased substantially in recent decades.
Hofmann et al., 2016Abrupt mid-Holocene megadrought in northwestern Montana …One of the best studied examples of historic drought in North America includes the 1930s Dust Bowl event (Woodhouse and Overpeck, 1998) that heavily impacted agriculture in the Great Plains region and that is well represented in lake sediment records in North America (e.g. Alley et al., 2003). Interestingly, lake sediment records that contain a signal of the Dust Bowl event (e.g. Alley et al., 2003) also show that such [megadrought] events occurred more frequently and on a higher magnitude throughout the late Holocene (Laird et al., 1996). … Most importantly, we present a quantitative evaluation of a substantial early mid- Holocene megadrought caused by the volcanic eruption of Mount Mazama that resulted in an extreme mid-Holocene lake lowstand with a decreased lake volume of -25%.
Dai and Zhao, 2016 How drought may change in the future are of great concern as global warming continues. In Part I of this study, we examine the uncertainties in estimating recent drought changes. … Consistent with reported declines in pan evaporation, our calculated potential evapotranspiration (PET) shows negative or small trends since 1950 over the United States, China, and other regions, and no global PET trends from 1950 to 1990. Updated precipitation and streamflow data and the self-calibrated PDSI_pm all show consistent drying during 1950–2012 over most Africa, East and South Asia, southern Europe, eastern Australia, and many parts of the Americas. While these regional drying trends resulted primarily from precipitation changes related to multi-decadal oscillations in Pacific sea surface temperatures, rapid surface warming and associated increases in surface vapor pressure deficit since the 1980s have become an increasingly important cause of widespread drying over land.
Yadava et al., 2016 We developed the first boreal spring precipitation reconstruction for the western Himalaya covering the last millennium (1030–2011 C.E.). … The precipitation reconstruction revealed persistent long-term spring droughts from the 12th to early 16th century C.E. and pluvial from the late 16th century C.E. to recent decades. The late 15th and early 16th centuries (1490–1514 C.E.) displayed the driest episode, with precipitation being ∼15% lower than the long-term mean. The early 19th century (1820–1844 C.E.) was the wettest period of the past millennium, with mean precipitation ∼13% above the long-term mean. The reconstructed boreal spring precipitation from the western Himalaya revealed large-scale consistency with hydrological records from westerly dominated regions in Central Asia, indicating synoptic-scale changes in atmospheric circulation during the major part of the Medieval and Little Ice Age periods. Protracted droughts in Central Asia could have caused severe contraction of the regional economy, as indicated by striking coherence of reconstructed drought periods and historic social upheavals and invasions of India from Central and Western Asian invaders.
IX. Urban Surfaces Cause (Artificial) Warming (4)
Murray and Heggie, 2016 Introduction: It has long been known that within large cities, thermal emission from heated buildings, industry, and transport can contribute to a microclimate up to 12°C warmer than background levels in the surrounding area, a phenomenon known as the urban heat island (UHI) effect. … Discussion and Conclusion: Our results are strong evidence that changes in energy consumption contribute to temperature change over sub-decadal timescales in the two nations considered. Britain has experienced a drop in temperature of about 0.5°C since the early years of the millennium at a time when world temperatures have remained virtually stable, whereas Japan experienced a rise in Δt [surface temperature] of 1.0°C between the early 1980s and 2000, double the world rise in temperature over the same period. Both these changes reflect changes in energy consumption in each country.
Liao et al., 2016 We examine the urban effect on surface warming in Eastern China, where a substantial portion of the land area has undergone rapid urbanization in the last few decades. Daily surface air temperature records during the period 1971–2010 at 277 meteorological stations are used to investigate temperature changes. Owing to urban expansion, some of the stations formerly located in rural areas are becoming increasingly influenced by urban environments. … [T]he estimated urban-induced trends in the daily minimum and mean temperature are 0.167 and 0.085 °C decade−1, accounting for 33.6 and 22.4% of total surface warming, respectively. The temperature difference between urban and rural stations indicates that urban heat island intensity has dramatically increased owing to rapid urbanization, and is highly correlated with the difference in fractional coverage of artificial surfaces between these two types of stations.
To and Yu, 2016 By analyzing the monthly air temperatures recorded at an urban site and a rural site, it was found that the urban heat island effect led to the urban site being on average 0.865◦C warmer than the rural site over the past two decades. Besides, the results of correlation analysis showed that the increase in annual mean air temperature was significantly associated with the increase in population, gross domestic product, urban land use, and energy use, with the R2 values ranging from 0.37 to 0.43.
Morris et al., 2016Putrajaya is a planned city built from a formerly vegetated farm and agricultural lands to a modern urban city. This study aims to investigate the chronological local urban climate changes that have taken place over a decade (1999–2011) of urbanisation using the NCAR Weather and Research Forecasting (WRF) model coupled to a numerically proven land surface and urban canopy model (NOAH LSM/UCM). … Results show that 2-m temperature of the area is increasing at the rate of 1.66 °C per decade, while the prevailing urban heat island intensity (UHII) of the area is ∼2.1 °C. The urban climate prognostic and diagnostic variables show good correlations with the urban surface modifications of the area from the original natural surfaces, except for wind speed which shows less variability to urbanisation. Furthermore, formation of urban cool islands is also noticed for 1999, 2007, and 2011. Near-uniform net all-waves radiations of the different years experimented conform to tropical city low climatic variability. Finally, the thermal conditions of the area exhibit spatial and temporal variations heavily induced by urbanisation.
X. ‘Settled’ Science Dismantled (3)
Xi et al., 2016We find that carbonation of cement materials over their life cycle represents a large and growing net sink of CO2, increasing from 0.10 GtC yr−1 in 1998 to 0.25 GtC yr−1 in 2013. In total, we estimate that a cumulative amount of 4.5 GtC has been sequestered in carbonating cement materials from 1930 to 2013, offsetting 43% of the CO2 emissions from production of cement over the same period, not including emissions associated with fossil use during cement production. We conclude that carbonation of cement products represents a substantial carbon sink that is not currently considered in emissions inventories.
(press release) Concrete jungle functions as carbon sink, researchers find: Cement-based materials eventually reabsorb much of the CO2 released during creation
Hoggard et al., 2016Our power spectral analysis reveals significant discrepancies between observed and predicted dynamic topography.
(press release) Map of flow within the Earth’s mantle finds the surface moving up and down ‘like a yo-yo’ … They found that the wave-like movements of the mantle are occurring at a rate that is an order of magnitude faster than had been previously predicted. The results, reported in the journal Nature Geoscience, have ramifications across many disciplines including the study of ocean circulation and past climate change.
Som et al., 2016The result implies that the thin atmosphere was rich in auxiliary greenhouse gases and that Patm [surface atmospheric pressure] fluctuated over geologic time to a previously unrecognized extent.
(press release) Early Earth’s air weighed less than half of today’s atmosphere … The idea that the young Earth had a thicker atmosphere turns out to be wrong. New research from the University of Washington uses bubbles trapped in 2.7 billion-year-old rocks to show that air at that time exerted at most half the pressure of today’s atmosphere. The results, published online May 9 in Nature Geoscience, reverse the commonly accepted idea that the early Earth had a thicker atmosphere to compensate for weaker sunlight. The finding also has implications for which gases were in that atmosphere, and how biology and climate worked on the early planet. … “For the longest time, people have been thinking the atmospheric pressure might have been higher back then, because the sun was fainter,” said lead author Sanjoy Som, who did the work as part of his UW doctorate in Earth and space sciences. “Our result is the opposite of what we were expecting.” … “We’re still coming to grips with the magnitude of this,” Buick said. “It’s going to take us a while to digest all the possible consequences.”
XI. Natural CO2, Methane Sources Out-Emit Humans (3)
Reich et al., 2016Plant respiration results in an annual flux of carbon dioxide (CO2) to the atmosphere that is six times as large as that due to the emissions from fossil fuel burning, so changes in either will impact future climate.
Kim et al., 2016 Better understanding of factors that control the global carbon cycle could increase confidence in climate projections. Previous studies found good correlation between the growth rate of atmospheric CO2 concentration and the El Niño–Southern Oscillation (ENSO). Growth rate of atmospheric CO2 increases during El Niño but decreases during La Niña. In this study, long-term simulations of the Earth System Models (ESMs) in the Coupled Model Intercomparison Project Phase 5 archive were used to examine the interannual carbon flux variability associated with ENSO. The ESMs [Earth System Models] simulate the relationship reasonably well with a delay of several months between ENSO and the changes in atmospheric CO2 [oceanic heat change precedes CO2 emission rate change].
Nisbet et al., 2016The isotopic evidence presented here suggests that the methane rise was dominated by significant increases in biogenic methane emissions, particularly in the tropics, for example, from expansion of tropical wetlands in years with strongly positive rainfall anomalies or emissions from increased agricultural sources such as ruminants and rice paddies. Changes in the removal rate of methane by the OH radical have not been seen in other tracers of atmospheric chemistry and do not appear to explain short-term variations in methane. Fossil fuel emissions may also have grown, but the sustained shift to more 13C-depleted values and its significant interannual variability, and the tropical and Southern Hemisphere loci of post-2007 growth, both indicate that fossil fuel emissions have not been the dominant factor driving the increase. A major cause of increased tropical wetland and tropical agricultural methane emissions, the likely major contributors to growth, may be their responses to meteorological change.
XII. Fires, Anthropogenic Climate Change Disconnect (5)
Radovanovic, 2016Contemporary science is burdened with contradictory, that is, severely opposed attitudes relating to climate changes issues such as global warming. What is undisputable is that if climate changes are more intensive, changes relating to stands of plants are also more intensive. Forest fires are one of the most drastic factors that influence changes of stands of plants in mountain terrains. The damage caused by forest fires destroying forests varies from case to case, but a significant problem occurs in irretrievable losses of soil because of increased erosion, as well as disturbances in underground water circulation. In contrast to plain terrains, mountains are far more sensitive to such disasters, especially when we consider losses in agricultural soil as well as of wildlife. The fact that a direct connection between any of the climate elements and the initial phase of a fire has not been established so far represents a special challenge to science. A new hypothesis is presented in this chapter, which attempts to link the processes on the sun, that is, charged particles (protons and electrons) as potential causes of forest fires of unknown origin.
Doerr and Santín, 2016 Wildfire has been an important process affecting the Earth’s surface and atmosphere for over 350 million years and human societies have coexisted with fire since their emergence. Yet many consider wildfire as an accelerating problem, with widely held perceptions both in the media and scientific papers of increasing fire occurrence, severity and resulting losses. However, important exceptions aside, the quantitative evidence available does not support these perceived overall trends. Instead, global area burned appears to have overall declined over past decades, and there is increasing evidence that there is less fire in the global landscape today than centuries ago. Regarding fire severity, limited data are available. For the western USA, they indicate little change overall, and also that area burned at high severity has overall declined compared to pre-European settlement. Direct fatalities from fire and economic losses also show no clear trends over the past three decades.
Fanin and van den Werf, 2016 Over the past decades, fires have burned annually in Indonesia, yet the strength of the fire season is for a large part modulated by the El Niño Southern Oscillation (ENSO). The two most recent very strong El Niño years were 2015 and 1997. Both years involved high incidences of fire in Indonesia. … [W]e found that the non-linearity between rainfall and fire in Indonesia stems from longer periods without rain in extremely dry years.
Mariani et al., 2016ENSO controls inter-annual fire activity in southeast Australia … El Niño Southern Oscillation (ENSO) is the main mode controlling the variability in the ocean-atmosphere system in the South Pacific. While the ENSO influence on rainfall regimes in the South Pacific is well documented, its role in driving spatiotemporal trends in fire activity in this region has not been rigorously investigated. This is particularly the case for the highly flammable and densely populated southeast Australian sector, where ENSO is a major control over climatic variability. Here we conduct the first region-wide analysis of how ENSO controls fire activity in southeast Australia. We identify a significant relationship between ENSO and both fire frequency and area burnt. Critically, wavelet analyses reveal that, despite substantial temporal variability in the ENSO system, ENSO exerts a persistent and significant influence on southeast Australian fire activity. Our analysis has direct application for developing robust predictive capacity for the increasingly important efforts at fire management.
Taylor et al., 2016 We developed a 415-y record (1600–2015 CE) of fire activity by merging a tree-ring–based record of Sierra Nevada fire history with a 20th-century record based on annual area burned. Large shifts in the fire record corresponded with socioecological change, and not climate change, and socioecological conditions amplified and buffered fire response to climate. Fire activity was highest and fire–climate relationships were strongest after Native American depopulation—following mission establishment (ca. 1775 CE)—reduced the self-limiting effect of Native American burns on fire spread.
XIII. Miscellaneous (4)
Stenhouse et al., 2016Conflict about Climate Change at the American Meteorological Society: Meteorologists’ Views on a Scientific and Organizational Controversy … A web-based survey was sent to all professional (i.e. non-student) members of the AMS in December 2011. The survey was sent to 7062 valid email addresses, and 1854 people completed some portion of the survey, yielding a minimum response rate of 26.3% … 1) Members who said the global warming of the last 150 years was mostly caused by human activity (53% of full sample). … Members who are convinced of largely human-caused climate change expressed that debate over global warming sends an unclear message to the public. Conversely, members who are unconvinced of human-caused climate change often felt that their peers were closed-minded, and were suppressing unpopular views. These two groups converged, however, on one point: politics was seen as an overwhelmingly negative influence on the debate.
Nissen et al., 2016 In our model, publication bias — in which positive results are published preferentially over negative ones — influences the distribution of published results. We find that when readers do not know the degree of publication bias and thus cannot condition on it, false claims often can be canonized as facts. Unless a sufficient fraction of negative results are published, the scientific process will do a poor job at discriminating false from true claims. This problem is exacerbated when scientists engage in p-hacking, data dredging, and other behaviors that increase the rate at which false positives are published. If negative results become easier to publish as a claim approaches acceptance as a fact, however, true and false claims can be more readily distinguished. To the degree that the model accurately represents current scholarly practice, there will be serious concern about the validity of purported facts in some areas of scientific research.
Druckman and Shafranek, 2016The local warming effect occurs when perceived deviations in the day’s temperature affect individuals’ global warming beliefs. When people perceive the day to be warmer than usual, they tend to overestimate the number of warm days throughout the year, and to report increased belief in and worry about global warming. For many, this is normatively concerning because a single day’s perceived temperature fluctuation is not representative of longer-term, large-scale climate patterns. It thus makes for a poor basis for global warming judgments. Recent work shows that the local warming effect might disappear when people receive a reminder to think about weather patterns over the past year (i.e., a correction). This paper employs a survey experiment that extends past research by exploring the generalizability, conditionality, and durability of the corrective information. It identifies the conditions under which a local warming effect is more or less likely to occur.
Morales Maqueda et al., 2016 Physics and climatology of sea ice … Three factors affect substantially the radiation balance in polar regions: surface albedo, surface air temperature, and cloudiness. The surface albedo controls the shortwave energy budget; surface air temperature determines the incoming longwave radiation; cloudiness alters both the solar and the infrared radiative components. [CO2 is not mentioned as a factor affecting the radiation balance, sea ice, or climate in polar regions.]
XIV. Scientists: We Don’t Know (4)
Dhomse et al., 2016 [T]here are still large [uncertainties] in current observational and meteorological reanalysis datasets, so accurate quantification of the influence of solar flux variability on the climate system remainsan open scientific question.
Stendel et al., 2016This chapter examines past and present studies of variability and changes in atmospheric variables within the North Sea region over the instrumental period; roughly the past 200 years. The variables addressed are large-scale circulation, pressure and wind, surface air temperature, precipitation and radiative properties (clouds, solar radiation, and sunshine duration). Temperature has increased everywhere in the North Sea region, especially in spring and in the north. Precipitation has increased in the north and decreased in the south. There has been a north-eastward shift in storm tracks, which agrees with climate model projections. Due to large internal variability, it is not clear which aspects of the observed changes are due to anthropogenic activities and which are internally forced, and long-term trends are difficult to deduce.
Yang et al., 2016The stratosphere has been cooling under global warming, the causes of which are not yet well understood. … [T]he much stronger/weaker dynamic warming in the northern/southern winter extratropics is associated with an increase of the planetary-wave activity in the northern winter, but a slight decrease in the southern winter hemisphere, under global warming. More importantly, although radiative processes dominate the stratospheric cooling, the spatial patterns are largely determined by the non-radiative effects of dynamic processes.
Lott and Stott, 2016Although it is critical to assess the accuracy of attribution studies, the Fraction of Attributable Risk (FAR) cannot be directly assessed from observations, since it involves the probability of an event in a world that did not happen, the “natural” world where there was no human influence on climate.
By continuing to use the site, you agree to the use of cookies. more information
The cookie settings on this website are set to "allow cookies" to give you the best browsing experience possible. If you continue to use this website without changing your cookie settings or you click "Accept" below then you are consenting to this. More information at our Data Privacy Policy
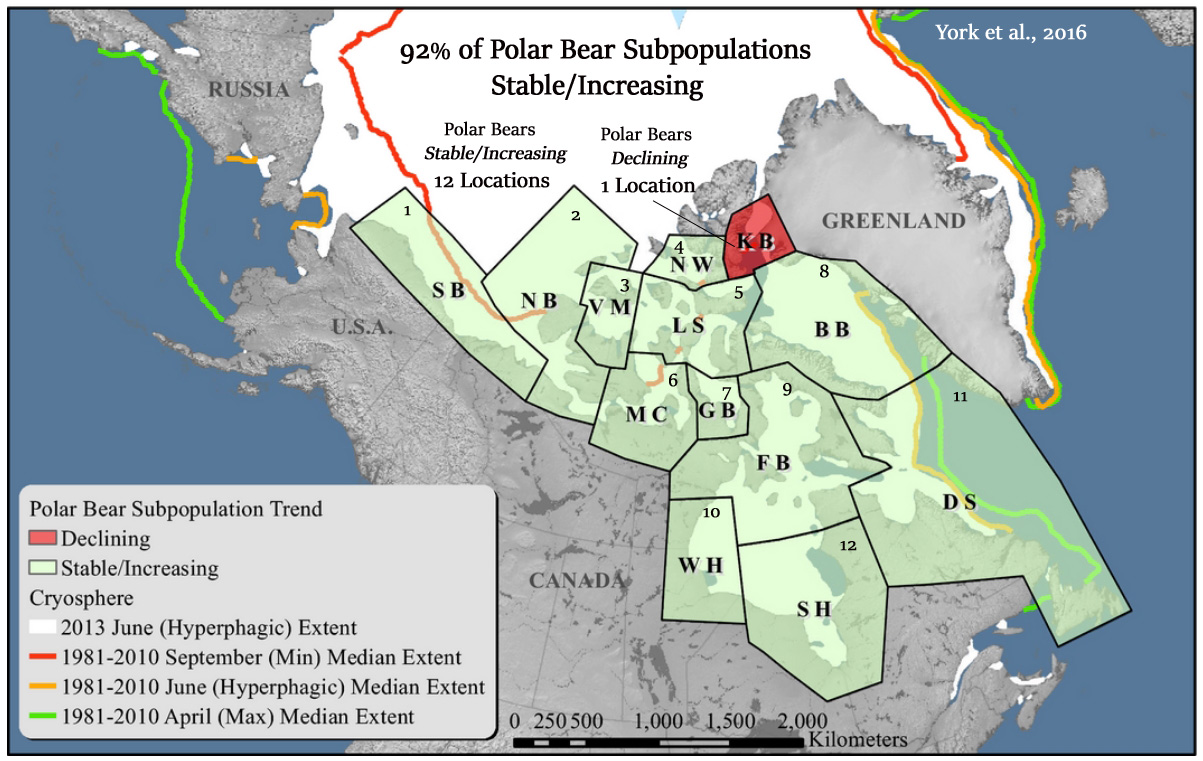


Recent Comments