Climate Model Unreliability/Biases/Errors and the Pause (28) Failing Renewable Energy, Climate Policies (12) Wind Power Harming The Environment, Biosphere (8) Elevated CO2 Greens Planet, Produces Higher Crop Yields (14) Warming Beneficial, Does Not Harm Humans, Wildlife (8) Warming, Acidification Not Harming Oceanic Biosphere (18) Decreases In Extreme, Unstable Weather With Warming (3) Urban Heat Island: Raising Surface Temperatures Artificially (5) No Increasing Trends In Intense Hurricanes (4) No Increasing Trends In Drought/Flood Frequency, Severity (3) Natural CO2, Methane Sources Out-Emit Human Source (4) Increasing Snow Cover Since The 1950s (3) Miscellaneous (7) Scientists: We Don’t Know (3)
Part 3. Unsettled Science, Ineffective Climate Modeling
Climate Model Unreliability/Biases/Errors and the Pause (28)
Scafetta et al., 2017 [T]he AGWT [Anthropogenic Global Warming Theory] was globally advocated by the IPCC in 2001 because it appeared to be supported by the ‘infamous’ Hockey Stick temperature reconstructions by Mann et al. [1998, 1999]. … However, since 2005 novel Northern Hemisphere proxy temperature reconstructions were published revealing the existence of a large millennial oscillation that contradicts the Hockey Stick temperature pattern. … The new findings were consistent with alternative climatic and solar activity records showing that a quasi-millennial oscillation occurred throughout the entire Holocene for the last 10,000 years. … The severe discrepancy between observations and modeled predictions found during the 1922-1941 and 2000-2016 periods further confirms, according to the criteria proposed by the AGWT [anthropogenic global warming theory] advocates themselves, that the current climate models have significantly exaggerated the anthropogenic greenhouse warming effect. [A]ccording to the AGWT advocates’ own criteria, a divergence between observations and climate models occurring at the bi-decadal scale would provide strong convincing evidences that the GCMs used to support the AGWT[Anthropogenic Global Warming Theory]are severely flawed. … In conclusion, the temperature records clearly manifest several fluctuations from the inter-annual scale to the multidecadal one. Detailed spectral analyses have determined the likely existence of harmonics at about 9.1, 10.5, 20 and 60- year periods. By contrast, the CMIP5 GCMs simulations used by the IPCC (2013) to advocate the AGWT show a quite monotonic accelerating warming since 1860 …Thus, the models are not able to reproduce the natural variability observed in the climate system and should not be trusted for future energy planning.
Scafetta et al., 2017A millennial climatic oscillation would suggest that a significant percentage of the warming observed since 1850 could simply be a recovery from the Little Ice Age of the 14th – 18th centuries and that throughout the 20th century the climate naturally returned to a warm phase as it happened during the Roman and the Medieval warm periods. … We critically analyze the year 2015-2016, which has been famed as the hottest year on record. We show that this anomaly is simply due to a strong El-Niño event that has induced a sudden increase of the global surface temperature by 0.6 °C. This event is unrelated to anthropogenic emissions. … Herein, the authors have studied the post 2000 standstill global temperature records. It has been shown that once the ENSO signature is removed from the data, the serious divergence between the observations and the CMIP5 GCM projections becomes evident. … Since 2000 there has been a systematic tendency to find lower climate sensitivity values. The most recent studies suggest a transient climate response (TCR) of about 1.0 °C, an ECS less than 2.0 °C and an effective climate sensitivity (EfCS) in the neighborhood of 1.0 °C. …Thus, all evidences suggest that the IPCC GCMs at least increase twofold or even triple the real anthropogenic warming. The GHG theory might even require a deep re-examination.
Blackall, 2017The science publication Nature Climate Change this year published a study demonstrating Earth this century warmed substantially less than computer-generated climate models predict. Unfortunately for public knowledge, such findings don’t appear in the news. Sea levels too have not been obeying the ‘grand transnational narrative’ of catastrophic global warming. Sea levels around Australia 2011–2012 were measured with the most significant drops in sea levels since measurements began. This phenomenon was due to rainfall over Central Australia, which filled vast inland lakes. It was notpredicted in the models, nor was it reported in the news. The 2015–2016 El-Niño, a natural phenomenon, drove sea levels around Indonesia to low levels such that coral reefs were bleaching. The echo chamber of news repeatedly fails to report such phenomena and yet many studies continue to contradict mainstream news discourse. Whistle-blower Dr. John Bates exposed the U.S. National Oceanic Atmospheric Administration (NOAA) when it manipulated data to meet politically predetermined conclusions for the 2015 Paris (Climate) Agreement. This was not reported. Observational scientific analyses and their data sets continue to disagree with much of climate science modelling, and are beginning to suggest that some natural phenomena, which cause variability, may never be identified. … Scientists test, measure, observe and retest, and they must be able to verify and repeat results (Errington et al., 2014). Uncertainty is always present (van Der Sluijs, 2005), but when uncertainty is replaced by ‘consensus’ (post-normal science), a culture of gatekeeping ensues (Lindzen, 2009). Post-normal science is said to be appropriate when ‘traditional methodologies are ineffective. In those circumstances, the quality assurance of scientific inputs to the policy process requires an ‘extended peer community’, consisting of all those with a stake in the dialogue on the issue’ (Funtowicz & Ravetz, 1993). Then, and dangerously, dissenters are silenced so that chosen and ‘necessary’ discourses arrive in journals, conferences and boardrooms. In such a climate, it is difficult for the assertion to be made that there might be other sources, than a nontoxic greenhouse gas called carbon dioxide (CO2), that could be responsible for ‘climate disruption’. A healthy scientific process would allow such a proposition.
Power et al., 2017All of the model simulations examined simulate multi-decadal warming in the Pacific over the past half-century that exceeds observed values. This difference cannot be fully explained by observed internal multi-decadal climate variability, even if allowance is made for an apparent tendency for models to underestimate internal multi-decadal variability in the Pacific. Models which simulate the greatest global warming over the past half-century also project warming that is among the highest of all models by the end of the twenty-first century, under both low and high greenhouse gas emission scenarios. Given that the same models are poorest in representing observed multi-decadal temperature change, confidencein the highest projections is reduced.
Hedemann et al., 2017 (full paper) During the first decade of the twenty-first century, the Earth’s surface warmed more slowly than climate models simulated. This surface-warming hiatus is attributed by some studies to model errors in external forcing, while others point to heat rearrangements in the ocean caused by internal variability, the timing of which cannot be predicted by the models. However, observational analyses disagree about which ocean region is responsible. Here we show that the hiatus could also have been caused by internal variability in the top-of-atmosphere energy imbalance. Energy budgeting for the ocean surface layer over a 100-member historical ensemble reveals that hiatuses are caused by energy-flux deviations as small as 0.08 W m−2, which can originate at the top of the atmosphere, in the ocean, or both. Budgeting with existing observations cannot constrain the origin of the recent hiatus, because the uncertainty in observations dwarfs the small flux deviations that could cause a hiatus. The sensitivity of these flux deviations to the observational dataset and to energy budget choices helps explain why previous studies conflict, and suggests that the origin of the recent hiatus may never be identified. … The observed trend deviated by as much as −0.17 ◦C per decade from the CMIP5 (Coupled Model Intercomparison Project Phase 5) ensemble-mean projection—a gap two to four times the observed trend. The hiatus therefore continues to challenge climate science.
Xie et al., 2017As the recent global warming hiatus has attracted worldwide attention, we examined the robustness of the warming hiatus in China and the related dynamical mechanisms in this study. Based on the results confirmed by the multiple data and trend analysis methods, we found that the annual mean temperature in China had a cooling trend during the recent global warming hiatus period, which suggested a robust warming hiatus in China. The warming hiatus in China was dominated by the cooling trend in the cold season, which was mainly induced by the more frequent and enhanced extreme-cold events.
Xian and Fu, 2017Despite continually increasing concentrations of greenhouse gas, there has been a hiatus in rising global temperatures during the 21st century.
Liu and Zhou, 2017Here, we divided recent decades intothe recent hiatus period [1998-2013] and the preceding warming period (1983–1998) to investigate the atmospheric footprint. We use a process-resolving analysis method to quantify the contributions of different processes to the total temperature changes. We show that the increasing rate of global mean tropospheric temperature was also reduced during the hiatus period. The decomposed trends due to physical processes, including surface albedo, water vapour, cloud, surface turbulent fluxes and atmospheric dynamics, reversed the patterns between the two periods. … [C]limate models designed to represent the physics and dynamics of the climate system project that GMST [global mean surface temperature] continued to rise in the early 2000s. Dominant mechanisms proposed to understand the hiatus included the internal climate variability and ocean heat uptake and transport; however, the differences in the atmospheric footprint of recent warming slowdown remains unclear in terms of the dynamical and physical processes.
Rosenblum and Eisenman, 2017 Observations indicate that the Arctic sea ice cover is rapidly retreating while the Antarctic sea ice cover is steadily expanding. State-of-the-art climate models, by contrast, typically simulate a moderate decrease in both the Arctic and Antarctic sea ice covers. … [W]e find that simulated Arctic sea ice retreat as fast as observed would occur less than 1% of the time. This implies that the models are not consistent with the observations. In the Antarctic, we find that simulated sea ice expansion as fast as observed typically corresponds with too little global warming, although these results are more equivocal. We show that because of this, the simulations do not capture the observed asymmetry between Arctic and Antarctic sea ice trends. This suggests that the models may be getting the right sea ice trends for the wrong reasons in both polar regions.
Zanchettin, 2017Multiple lines of evidence from climate observations, reconstructions, and simulations point to the potential of volcanic eruptions, tropospheric aerosols, and solar activity to substantially impact on decadal climatic variability. However, uncertainties and gaps of knowledge in the characterization of forced decadal climate responses remain large, and only a few studies have systematically tackled the implication of these forcing agents for decadal predictability and prediction. For all forcing agents, major limitations in understanding arise from incompleteness and shortness of the instrumental observations concerning the forcing as well as the climate response. Further issues concern the deficient representation of key processes in climate models and limitations inherent to reconstructed evidence.
Zuidema et al., 2017Most contemporary coupled atmosphere–ocean general circulation models (CGCMs) produce a climate that is significantly more symmetric about the equator than in observations (Mechoso et al. 1995; Davey et al. 2002; Biasutti et al. 2006; de Szoeke and Xie 2008; Richter et al. 2016; Richter 2015; Siongco et al. 2015). Outstanding features include positive sea surface temperature (SST) errors south-southeast of the equator (Fig. 1a), collocated in part with an intertropical convergence zone (ITCZ) precipitation band (Fig. 1b) much stronger than that observed in nature. The “double ITCZ” error is further implicated in the simulated Hadley circulation, seasonal cycle and winds on the equator, and equatorial modes of variability, such as El Niño–Southern Oscillation (ENSO) in the Pacific, casting doubt on the ability to model and predict both regional and global climate. … OAFlux allows for more ocean warming than is observed, an error that implies the CMIP5 model net flux biases are even larger, by at least 10 W m−2 … Mean CMIP5 net CRE biases are very large, up to 40 W m−2, relative to CERES values. … The CMIP5 models generally continue to underestimate subtropical stratocumulus cloud cover relative to observations, similar to CMIP3 (Klein et al. 2013) … The history in understanding the wind contribution to SST error growth is closely tied to that of model resolution. …The wind bias is linked to incorrect model-dependent distributions of tropical precipitation (Biasutti et al. 2006; Richter and Xie 2008; Richter et al. 2012; Siongco et al. 2015).
Ahlström et al., 2017Our results suggest that climate biases could be responsible for a considerable fraction of the large uncertainties in ESM [Earth system models]simulations of land carbon fluxes and pools, amounting to about 40% of the range reported for ESMs. We conclude that climate bias-induced uncertainties must be decreased to make accurate coupled atmosphere-carbon cycle projections.
Zhang et al., 2017[R]obust projections for extreme short-duration rainfall is challenging … because of our poor understanding of its past and future behaviour. The characterization of past changes is severely limited by the availability of observational data. Climate models, including typical regional climate models, do not directly simulate all extreme rainfall producing processes, such as convection. … [T]he observed precipitation–temperature scaling relationships have been established almost exclusively by linking precipitation extremes with day-to-day temperature variations. These scaling relationships do not appear to provide a reliable basis for projecting future precipitation extremes.
Zhou et al., 2017The evaluation results show that 5 out of 30 climate models can well capture the observed APO [Asian-Pacific Oscillation]-related features in a comprehensive way, including the strengthened South Asian high (SAH), deepened North Pacific trough (NPT) and northward East Asian jet (EAJ) in the upper troposphere. [83% of climate models cannot capture the APO features comprehensively.]
Stouffer et al., 2017There are a number of systematic model biases that appear in all phases of CMIP that remain a major climate modeling challenge. These biases need increased attention to better understand their origins and consequences through targeted experiments. Improving understanding of the mechanisms’ underlying internal climate variability for more skillful decadal climate predictions and long-term projections remains another challenge for CMIP6.
Oka and Watanabe, 2017The warming rate of global-mean surface temperature slowed down during 1998-2012. Previous studies pointed out role of increasing ocean heat uptake during this global warming slowdown, but its mechanism remains under discussion.
Zhou and Penner, 2017Observation-based studies have shown that the aerosol cloud lifetime effect or the increase of cloud liquid water path (LWP) with increased aerosol loading may have been overestimated in climate models.
Barcikowska et al., 2017How global temperature will evolve over the next decade or so remains unclear (Knutson et al. 2016), although the most recent warming hiatus, observed in surface temperature records over the period 1998–2014, has challenged the scientific community in terms of consistency of models versus observations and in the attribution of the phenomena (Kosaka and Xie 2013; England et al. 2014; McGregor et al. 2014; Fyfe et al. 2012). … [N]ot only cooling over the North Atlantic but also preceding cooling over the tropical Pacific appears to be related to the three reconstructed global SST stagnation periods (1880–1900s, 1940s–60s, and 2000s–10s). The results suggest that the observed decadal SST stagnation periods (including the recent pause) stem from more than one climate component (internal variability and/or radiatively forced).
Cionco and Soon, 2017We found important relative differences up to ± 5%, which correspond to errors of 2.5 W m −2 in the daily mean insolation, for exactly the same calendar day and set of astro-climatic parameters. This previously unrecognized error could have a significant impact in both the initial and boundary conditions for any climate modeling experiment. … A close inspection from the United Nations Fifth Assessment Report tells us that STOF [short-term orbital forcing] isindirectly assumed to be unimportant and play no climatic role. The primary argument and assumption in neglecting changes in orbital forcing for climatic changes over the last few thousand years, last century or even last decade seemed to be from the claim that globally-averaged radiative forcing is small or negligible. … We … wish to call for a more direct accounting for STOF, as a true boundary condition, in all climatic simulations in that the effects from local and regional perspective are clearly not negligible nor unimportant in terms of seasonal dynamical evolution of the coupled air-sea-land system.
Hope et al., 2017We evaluate GMST using two approaches: analysis of archived output from atmospheric, oceanic general circulation models (GCMs) and calculations conducted using a computational framework developed by our group, termed the Empirical Model of Global Climate (EM-GC). Comparison of the observed rise in GMST over the past 32 years with GCM output revealsthese models tend to warm too quickly, on average by about a factor of two. Most GCMs likely represent climate feedback in a manner that amplifies the radiative forcing of climate due to greenhouse gases (GHGs) too strongly.
Smith et al., 2017Here, we used coupled atmosphere-biosphere simulations using the Community Earth System Model (CESM) to assess how acclimation-induced changes in photosynthesis influence global climate under present-day and future (RCP 8.5) conditions. … In the present-day simulations, the photosynthetic response was not as strong and cooling in highly vegetated regions was less than warming elsewhere, leading to a net global increase in temperatures of 0.04°C. Precipitation responses were variable and rates did not change globally in either time period. These results, combined with carbon-cycle effects, suggest that models without acclimation may be overestimating positive feedbacks between climate and the land surface in the future.
Molteni et al., 2017It is widely accepted thatnaturaldecadal variability played a major role in the slowdown in global warming observed in the 21st century, with sea-surface cooling in the tropical Pacific recognized as a major contributor. However, the warming pause was most pronounced during boreal winter, with northern-hemisphere flow anomalies also playing a role. Here we quantify the contribution of extra-tropical heat exchanges by comparing geopotential and temperature anomalies simulated by ensembles of seasonal forecasts with similar ocean temperature but different heat fluxes north of 40 N, as a result of planetary-wave variability. We show that an important part of heat flux anomalies is associated with decadal variations in the phase of a specific planetary-wave pattern. In model simulations covering the last three decades, this variability pattern accounts for a decrease of 0.35 °C/decade in the post-1998 wintertime temperature trend over northern continents.
Kravtsov, 2017 Global and regional warming trends over the course of the twentieth century have been nonuniform, with decadal and longer periods of faster or slower warming, or even cooling. Here we show that state-of-the-art global models used to predict climate fail to adequately reproduce such multidecadal climate variations. In particular, the models underestimate the magnitude of the observed variability and misrepresent its spatial pattern. Therefore, our ability to interpret the observed climate change using these models is limited.
Zhou and Wang, 2017Land surface air temperature (Ta) is one of the fundamental variables in weather and climatic observations, modeling, and applications. Despite the ongoing increase in atmospheric greenhouse gases, the global mean surface temperature (GMST) has remained rather steady and has even decreased in the central and eastern Pacific since 1998. This cooling trend is referred to as the global “warming hiatus”
Coats and Karnauskas, 2017 None of the 83 simulations have a positive trend in the SST gradient, a strengthening of the climatological SST gradient with more warming in the western than eastern tropical Pacific, as large as the mean trend across the five observational data sets.If the observed trends are anthropogenically forced, this discrepancy suggests that state-of-the-art climate models are not capturing the observed response of the tropical Pacific to anthropogenic forcing, with serious implications for confidence in future climate projections. … [C]onfident validation of anthropogenic SST gradient trends in climate models will require further emergence of anthropogenic trends. Regardless, the differences in SST gradient trends between climate models and observational data sets are concerning and motivate the need for process-level validation of the atmosphere-ocean dynamics relevant to climate change in the tropical Pacific.
O’Reilly et al., 2017Seasonal hindcast experiments, using prescribed sea surface temperatures (SSTs), are analyzed for Northern Hemisphere winters from 1900 to 2010.Ensemble mean Pacific/North American index (PNA)[climate model] skill varies dramatically, dropping toward zero during the mid-twentieth century, with similar variability in North Atlantic Oscillation (NAO) hindcast skill. … Overall, negative PNA [Pacific/North American] events are less predictable and seem likely to arise more from internal atmospheric variability than positive PNA events.
Dommenget and Rezny, 2017 State-of-the-art coupled general circulation models (CGCMs) have substantial errors in their simulations of climate. In particular, these errors can lead to large uncertainties in the simulated climate response (both globally and regionally) to a doubling of CO2. Currently, tuning of the parameterization schemes in CGCMs is a significant part of the developed. It is not clear whether such tuning actually improves models. The tuning process is (in general) neither documented, nor reproducible. Alternative methods such as flux correcting are not used nor is it clear if such methods would perform better. In this study, ensembles of perturbed physics experiments are performed with the Globally Resolved Energy Balance (GREB) model to test the impact of tuning. The work illustrates that tuning has, in average, limited skill given the complexity of the system, the limited computing resources and the limited observations to optimize parameters. While tuning may improve model performance (such as reproducing observed past climate), it will not get closer to the ‘true’ physics nor will it significantly improve future climate change projections. Tuning will introduce artificial compensating error interactions between sub-models that will hamper further model development.
Exarchou et al., 2017The substantial warm sea surface temperature bias in the eastern Tropical Atlantic reported in most CMIP5 climate simulations with various models, in particular along the coast of Namibia and Angola, remains an issue in more recent and CMIP6-ready versions of climate models such as EC-Earth. A complete and original set of experiments with EC-Earth3.1 is performed to investigate the causes and mechanisms responsible for the emergence and persistence of this bias. … Our study points ata need for better representation of clouds in the vicinity of eastern boundaries in atmosphere models, and better representation of solar penetration and turbulent mixing in the ocean models in order to eliminate the Tropical Atlantic biases.
Failing Renewable Energy, Climate Policies (12)
Janković and Shultz, 2017[A] preindustrial climate may remain a policy goal, but it is unachievable in reality. … In 2011, the nonprofit science and outreach organization Climate Communication—whose staff and science advisors include, among others, Richard Sommerville, Jerry Melillo, Ken Kaldeira, Kerry Emanuel, Michael Mann, and Michael Oppenheimer—issued the following statement: “As the climate has warmed, some types of extreme weather have become more frequent and severe in recent decades, with increases in extreme heat, intense precipitation, and drought. … All weather events are now influenced by climate change because all weather now develops in a different environment than before.” Yet, this statement, as well as numerous others in the popular literature and media stories, contradicts the scientific evidence. [R]educing the complexity of climate change (as if a single outcome were known) into the soundbite of “climate change means more extreme weather” is a massive oversimplification—if not misstatement—of the true state of the science. … With such events seemingly outside the expected natural range of possibilities, the media increasingly turned to blaming climate change for the severe weather (e.g., Janković 2006; Hulme 2014). … Reducing carbon emissions, regardless of how effective, cannot of itself reduce weather impacts (e.g., Schultz and Janković 2014). … Climate change is not a discrete problem independent of development imperatives, nor is it manageable by a policy based on a mere scientific consensus (Prins et al. 2010). [E]ven if anthropogenic climate change were effectively stopped, extreme weather would continue. Members of the public and governmental representatives who had been sold on the idea that “stopping climate change will reduce extreme weather events” would understandably question their bill of goods, reducing scientific credibility.
Harris, 2017China’s Paris pledge on climate change: inadequate and irresponsible … China’spledge is little more than business as usual. Significant ethical obligations arise from China’s role as the largest national source of greenhouse gas pollution and home to hundreds of millions of affluent consumers. The Paris Agreement disregards such obligations. The inadequacy and irresponsibility of China’s Paris pledge exposes some fundamental flaws in the international climate change negotiations and agreements, demonstrating that science and environmental studies cannot be disconnected from ethics and justice.
Clack et al., 2017The scenarios of [Jacobson et al., 2015, “Low-cost solution to the grid reliability problem with 100% penetration of intermittent wind, water, and solar for all purposes”] can, at best, be described as a poorly executed exploration of an interesting hypothesis. The study’s numerous shortcomings and errors render it unreliable as a guide about the likely cost, technical reliability, or feasibility of a 100% wind, solar, and hydroelectric power system. It is one thing to explore the potential use of technologies in a clearly caveated hypothetical analysis; it is quite another to claim that a model using these technologies at an unprecedented scale conclusively shows the feasibility and reliability of the modeled energy system implemented by midcentury. From the information given by [Jacobson et al., 2015], it is clear that both hydroelectric power and flexible load have been modeled in erroneous ways and that these errors alone invalidate the study and its results.
Heard et al., 2017While many modelled scenarios have been published claiming to show that a 100% renewable electricity system is achievable, there is no empirical or historical evidence that demonstrates that such systems are in fact feasible. Of the studies published to date, 24 have forecast regional, national or global energy requirements at sufficient detail to be considered potentially credible. We critically review these studies using four novel feasibility criteria for reliable electricity systems needed to meet electricity demand this century. [N]one of the 24 studies provides convincing evidence that these basic feasibility criteria can be met. Of a maximum possible unweighted feasibility score of seven, the highest score for any one study was four. … On the basis of this review, efforts to date seem to have substantially underestimated the challenge and delayed the identification and implementation of effective and comprehensive decarbonization pathways. … To date, efforts to assess the viability of 100% renewable systems, taking into account aspects such as financial cost, social acceptance, pace of roll-out, land use, and materials consumption, have substantially underestimated the challenge of excising fossil fuels from our energy supplies. This desire to push the 100%-renewable ideal without critical evaluation has ironically delayed the identification and implementation of effective and comprehensive decarbonization pathways. We argue that the early exclusion of other forms of technology from plans to decarbonize the global electricity supply is unsupportable, and arguably reckless. … The realization of 100% renewable electricity (and energy more broadly) appears diametrically opposed to other critical sustainability issues such as eradication of poverty, land conservation and reduced ecological footprints, reduction in air pollution, preservation of biodiversity, and social justice for indigenous people.
Vass, 2017 Renewable energies cannot compete with forest carbon sequestration to cost-efficiently meet the EU carbon target for 2050 … [T]he average cost per unit emissions reduction is more than twice as high for renewables as for forest carbon sequestration. Hence, the results indicate that renewables are unable to compete with forest carbon sequestration unless they receive continued government support.
Emery et al., 2017Although climate change mitigation and energy security policies are generally expected to be compatible with air pollution and health cost reductions (McCollum et al., 2013), there is evidence that first-generation alternative fuels such as corn ethanol lead to higher health costs due to air pollution than conventional fuels [gasoline] (Hill et al., 2009). … We find that life-cycle non-GHG air pollutant emissions, particularly NOX [nitrous oxides] and PM [particulates], are higher for corn ethanol and other biofuel blends than conventional petroleum fuels. Emissions of volatile organic compounds (VOCs) and carbon monoxide (CO) increase by 9–50% per 100 km traveled for high-ethanol blends from corn grain and combined grain and stover feedstocks. NOX, PM [particulates], and SOX [sulfur dioxides] increase by 71–124% from corn grain and 56–110% from combined grain and stover, relative to conventional gasoline. Biodiesel blends show an increase of 1–11% (B20) and 4–55% (B100) in air pollution, with the largest increases in VOC [volatile organic compounds] and SOX [sulfur dioxides] emissions. … The total social costs of ethanol blends are higher than that of gasoline, due in part to higher life-cycle emissions of non-GHG pollutants and higher health and mortality costs per unit.
Mahapatra and Ratha, 2017 The Paris deal is founded on a voluntary basis without any legally binding caps. The Paris Agreement is a relatively toothless one, which does not bind countries to actual emission limits, and has no mechanisms to impose actions. No sanctions will fall on any country that fails to come up to these intentions. The poor nations want clear promises to increase the aid for them, while the USA and other rich nations favour vaguer wording. Professor James Hansen—credited as being the father of climate change awareness— said that ‘the deal is worthless words’ (Wente, 2015). The final text contains only bland platitudes. There is no necessary connection between the legally binding nature of an international agreement and its effectiveness in producing outcomes (Lake, 2015). The agreement delineates an aim for reducing temperatures to a 2°C above pre-industrial levels, but does not commit.
Richardson and Kumar, 2017A growing human population creates a larger demand for food products and makes conservation of resources and increased efficiency of agricultural production more vital. … These results conclude that feed production systems are more energy efficient and less environmentally costly than corn-based ethanol. … [A]ccording to the findings of this study, biofuels, derived for the purpose of producing energy with little environmental impacts, actually use more energy at a higher environmental cost than the alternative crop use. As technology stands now, in terms of energy and environmental sustainability, the benefits of switching land uses to the production of corn-based transportation biofuels are not as favorable as continuing to produce corn for feed/food consumption.
Onn et al., 2017EVs [electric vehicles] running with Malaysian electricity grid produce substantial GHG emissions. … [T]he benefits of grid-dependent EVs can only be harvested under the condition that their use is coupled with a low carbon electricity grid. Thus, it is an additional challenge for Malaysia’s that are largely dependent on fossil fuels for electricity generation. … Overall the GHG emissions produced through the usage of EVs are substantial based on the well-to-wheel analysis, as the environmental profile of EVs is linked with the national grid.
Ensslen et al., 2017Our results indicate that charging in France causes only about ten percent of the carbon dioxide emissions compared to Germany, where the carbon intensity is more diverse [due to heavy fossil fuel dependency]. During the evaluation period of six months about 3.2 tons of CO2 were emitted. As the major part of the electricity generated in France is based on “carbon-free” nuclear power, specific PTW CO2 emissions are substantially lower for the EV (16.4 g CO2/km in France compared to 147.1 g CO2/km for Germany). … PTW [plant-to-wheel] CO2 emissions for charging EV in France are consequently about 10 times lower than CO2 emissions of comparable ICEV [internal combustion engine vehicle] and about 10 times lower than charging in Germany. These results underline the effects of the different electricity generation mixes in France and Germany on operational, charging and time dependent CO2 emissions of EV. … Comparing CO2 emissions according to norm consumption of a conventional Nissan NV200 [a commercial petrol-powered van with low-average fuel efficiency] also having an identical chassis (128 g CO2/km) with the CO2 emissions calculated based on the norm energy consumption of the project EV (11 g CO2/km in France and 108 g CO2/km in Germany) leads to the conclusion that EV usage in France (Germany) is – with regard to CO2 – more environmentally friendly than usage of comparable ICEV [internal combustion engine vehicle]. CO2 emission reduction potentials in France (Germany) consequently amount to 91.4 [France]% (15.6% [Germany]). However, additional efficiency losses in the batteries and the AC/DC charging unit (charging efficiency) increases the amount of energy needed for charging. This consequently also increases CO2 emissions and results in reduction potentials compared to ICEV [internal combustion engine vehicle] of about 90.7% in France and 8.7% in Germany. [EV use in Germany only results in a potential reduction of only 8.7% in CO2 emissions relative to fossil-fuel powered vehicles.]
Qiao et al., 2017 In this study, the life cycle energy consumption and greenhouse gas emissions of vehicle production are compared between battery electric and internal combustion engine vehicles in China’s context. … Greenhouse gas emissions of battery electric vehicles are 50% higher than internal combustion engine vehicles [in China]. … Electric Drive Vehicles (EDVs) are considered to be environmentally-friendly and have attracted much attention worldwide, and Battery Electric Vehicles (BEVs) are the most popular vehicles among all kinds of EDVs. In China, the country with the world’s largest automotive market, the government is determined to develop BEV industry and produced over 250 thousand BEVs in 2015, and the annual growth rate was 420%. In addition, according to the production plan, the cumulative output of BEVs in China will reach 5 million in 2020, meaning that BEVs will gradually replace Internal Combustion Engine Vehicles (ICEVs). BEVs [Battery Electric Vehicles] are designed to obtain more environmental benefits, but the energy consumption and GHG emissions of BEV production are much larger than those of ICEV [Internal Combustion Engine Vehicles] production in China.
Victor et al., 2017All major industrialized countries are failing to meet the pledges they made to cut greenhouse-gas emissions.Wishful thinking and bravado are eclipsing reality. Countries in the European Union are struggling to increase energy efficiency and renewable power to the levels that they claimed they would. Japan promised cuts in emissions to match those of its peers, but meeting the goals will cost more than the country is willing to pay.
Wind Power Harming The Environment, Biosphere (8)
Gortsas et al., 2017Infrasound, low frequency noise and soil vibrations produced by large wind turbines might disturb the comfort of nearby structures and residents. In addition repowering close to urban areas produces some fears to the nearby residents that the level of disturbance may increase. Due to wind loading, the foundation of a wind turbine interacts with the soil and creates micro-seismic surface waves that propagate for long distances and they are able to influence adversely sensitive measurements conducted by laboratories located far from the excitation point.
Frick et al., 2017Large numbers of migratory bats are killed every year at wind energy facilities. However, population-level impacts are unknown as we lack basic demographic information about these species. We investigated whether fatalities at wind turbines could impact population viability of migratory bats, focusing on the hoary bat (Lasiurus cinereus), the species most frequently killed by turbines in North America. Using expert elicitation and population projection models, we show that mortality from wind turbines may drastically reduce population size and increase the risk of extinction. For example, the hoary bat population could decline by as much as 90% in the next 50 yearsif the initial population size is near 2.5 million bats and annual population growth rate is similar to rates estimated for other bat species (λ = 1.01). Our resultssuggest that wind energy development may pose a substantial threat to migratory bats in North America. If viable populations are to be sustained, conservation measures to reduce mortality from turbine collisions likely need to be initiated soon. Our findings inform policy decisions regarding preventing or mitigating impacts of energy infrastructure development on wildlife.
Liu and Barlow, 2017 Wind energy has developed rapidly over the last two decades to become one of the most promising and economically viable sources of renewable energy. Although wind energy is claimed to provide clean renewable energy without any emissions during operation, but it is only one side of the coin. The blades, one of the most important components in the wind turbines, made with composite, are currently regarded as unrecyclable. With the first wave of early commercial wind turbine installations now approaching their end of life, the problem of blade disposal is just beginning to emerge as a significant factor for the future. … The research indicates that there will be 43 million tonnes of blade waste worldwide by 2050 with China possessing 40% of the waste, Europe 25%, the United States 16% and the rest of the world 19%.
Ramirez-Tejeda et al., 2017Globally, more than seventy thousand wind turbine blades were deployed in 2012 and there were 433 gigawatts (GW) of wind installed capacity worldwide at the end of 2015. Moreover, the United States’ installed wind power capacity will need to increase from 74 GW to 300 GW3 to achieve its 20% wind production goal by 2030. … The wind turbine blades are designed to have a lifespan of about twenty years, after which they would have to be dismantled due to physical degradation or damage beyond repair. …Estimations have suggested that between 330,000 tons/year by 2028 and 418,000 tons/year by 2040 of composite material from blades will need to be disposed worldwide. That would be equivalent to the amount of plastics waste generated by four million people in the United States in 2013. This anticipated increase in blade manufacturing and disposal will likely lead to adverse environmental consequences. … Despite its negative consequences, landfilling has so far been the most commonly utilized wind turbine blade disposal method. … Landfilling is especially problematic because its high resistance to heat, sunlight, and moisture means that it willtake hundreds of years to degrade in a landfill environment. The wood and other organic material present in the blades would also end up in landfills, potentially releasing methane, a potent greenhouse gas, and other volatile organic compounds to the environment.
Hammerson et al, 2017Conservationists are increasingly concerned about North American bats due to the arrival and spread of the White-nose Syndrome (WNS) disease and mortality associated with wind turbine strikes. To place these novel threats in context for a group of mammals that provides important ecosystem services, we performed the first comprehensive conservation status assessment focusing exclusively on the 45 species occurring in North America north of Mexico. Although most North American bats have large range sizes and large populations, as of 2015, 18–31% of the species were at risk (categorized as having vulnerable, imperiled, or critically imperiled NatureServe conservation statuses) and therefore among the most imperiled terrestrial vertebrates on the continent.
Vasilakis et al., 2017Numerous wind farms are planned in a region hosting the only cinereous vulture population in south-eastern Europe. We combined range use modelling and a Collision Risk Model (CRM) to predict the cumulative collision mortality for cinereous vulture under all operating and proposed wind farms. Four different vulture avoidance rates were considered in the CRM. Cumulative collision mortality was expected to be eight to ten times greater in the future (proposed and operating wind farms) than currently (operating wind farms), equivalent to 44% of the current population (103 individuals) if all proposals are authorized (2744 MW). Even under the most optimistic scenario whereby authorized proposals will not collectively exceed the national target for wind harnessing in the study area (960 MW), cumulative collision mortality would still be high (17% of current population) andlikely lead to population extinction.
Ferrão da Costa et al., 2017 Over the last 15 years, more than 900 wind turbines were built inside the range of the Portuguese wolf. Due to the endangered status of this large carnivore in Portugal, several monitoring plans were conducted, resulting in a reasonable amount of information being collected on the effects of wind farms on wolves. We reviewed the methodological approaches, compiled major findings and summarised the mitigation/compensation measures used in Portuguese wind farms. The overall outcomes show increasing human disturbance in wind farm areas, resulting in lower wolf reproduction rates during construction and the first years of operation, as well as shifts in denning site locations of more than 2.5 km away from the wind farm. … According to a review by Lovich and Ennen (2013), the construction and operation of wind farms have both potential and known impacts on terrestrial vertebrates, such as: (i) increase in direct mortality due to traffic collisions; (ii) destruction and modification of the habitat, including road development, habitat fragmentation and barriers to gene flow; (iii) noise effects, visual impacts, vibration and shadow flicker effects from turbines; (iv) electromagnetic field generation; (v) macro and microclimate change; (vi) predator attraction; and (vii) increase in fire risks.
Krekel and Zerrahn, 2017We show that the construction of wind turbines close to households exerts significant negative external effects on residential well-being … In fact, beyond unpleasant noise emissions (Bakker et al., 2012; McCunney et al., 2014) and impacts on wildlife (Pearce-Higgins et al., 2012; Schuster et al., 2015), most importantly, wind turbines have been found to have negative impacts on landscape aesthetics (Devine-Wright, 2005; Jobert et al., 2007; Wolsink, 2007). … We show that the construction of a wind turbine within a radius of 4,000 metres has a significant negative and sizeable effect on life satisfaction. For larger radii, no negative externalities can be detected.
Elevated CO2 Greens Planet, Enhances Crop Yields (14)
Bastos et al., 2017 The sustained increasing vegetation activity trend (greening) in the Northern Hemisphere (NH) has been a prominent feature in satellite observations since the 1980s and is consistently simulated by models. The trend in vegetation greenness has been linked to increasing growing season length at high latitudes and enhanced terrestrial CO2 uptake in northern ecosystems. The greening pace has been associated with asymmetric effects of climate trends in vegetation activity or variations in the climate forcing. It has also been shown that regional greening trends are further attributed to land use change, land management, CO2 fertilization, and nitrogen deposition.
Li et al., 2017[M]aternal CO2 environment modulated the response of wheat plants to drought stress in terms of biomass production, [such that]plants reared from seeds harvested from the e[levated CO2] maternal growth environment eliminated the negative impact of drought stress on DM [dry biomass]. … [T]ransgenerational exposure to e[CO2] also attenuated the negative impact of drought on evapotranspiration in wheat plants. … [T]ransgenerational exposure of wheat plants to e[CO2] could attenuate the negative impact of drought stress in terms of DM and WUE [water use efficiency].
Brandt et al., 2017 Here we used a passive microwave Earth observation data set to document two different trends in land area with woody cover for 1992–2011: 36% of the land area (6,870,000 km2) had an increase in woody cover largely in drylands, and 11% had a decrease (2,150,000 km2), mostly in humid zones. Increases in woody cover were associated with low population growth, and were driven by increases in CO2 in the humid zones and by increases in precipitation in drylands, whereas decreases in woody cover were associated with high population growth.
[press release] Africa has become greener in the last 20 years… [M]ore CO2 in the atmosphere together with a wetter, warmer planet, provides conditions that help trees and bushes to grow.
Bastin et al., 2017We show that in 2015, 1327 million hectares of drylands had more than 10% tree-cover, and 1079 million hectares comprised forest. Our estimate is 40 to 47% higher than previous estimates, corresponding to 467 million hectares of forest that have never been reported before. This increases current estimates of global forest cover by at least 9%.
Thinh et al., 2017 In summer experiment, yamvine length, leaf area, leaf dry weight (DW), and total DW were significantly higher under elevated [CO2] than ambient [CO2] in both temperature regimes. Additionally, number of leaves, vine DW, and root DW were significantly higher under elevated [CO2] than under ambient [CO2] in the low-temperature regime. In autumn experiment, tuber DW was significantly higher under elevated [CO2] than under ambient [CO2] in the high-temperature regime. These results demonstrate that yam shows positive growth responses to elevated [CO2].
Nakano et al., 2017[T]he improvement of source activity byincreased atmospheric CO2 concentrations can lead to enhanced grain yieldin rice lines that have a large sink capacity. Therefore, introducing alleles that increase sink capacity into conventional varieties represents a strategy that can be used to develop high-yielding varieties under increased atmospheric CO2concentrations, such as those predicted in the near future.
Pandey et al., 2017 Impact of elevated CO2 (free air CO2 enrichment) was studied on wheat (Triticum aestivum L. var Kundan) growth, yield and proteome. Elevated CO2 significantly impacted both underground (+24%) and aboveground (+15%) biomass.Grain weight/plant and harvest index were increased by 35% and 11.4%, respectively under high CO2.
Pretzsch et al., 2017Based on tree ring analyses in ten metropolises worldwide, we show that, in general,urbantrees have undergone accelerated growth since the 1960s. In addition, urban trees tend to grow more quickly than their counterparts in the rural surroundings. However, our analysis shows that climate change seems to enhance the growth of rural trees more than that of urban trees. The benefits of growing in an urban environment seem to outweigh known negative effects.
Karthykeyan, 2017 The rooted stem cuttings of C. equisetifolia inoculated with Frankia showed a higher number of nodules under 900 ppm of CO2 and cuttings without Frankia inoculation exhibited poor growth. Tissue Nitrogen (N) content was also higher under 900 ppm of CO2 than ambient control and 600 ppm levels. The photosynthetic rate was higher (17.8 μ mol CO2 m−2 s−1) in 900 ppm of CO2than in 600 ppm (13.2 μ mol CO2 m−2 s−1) and ambient control (8.3 μ mol CO2 m−2 s−1). This study showed that Frankia can improve growth, N fixation and photosynthesis of C. equietifoliarooted stem cuttings under extreme elevated CO2 level conditions (900 ppm).
Verhage et al., 2017Carbon dioxide fertilization offsets negative impacts of climate change on Arabica coffee yield in Brazil … The model projects that yield losses due to high air temperatures and water deficit will increase, while losses due to frost will decrease. Nevertheless, extra losses are offset by the CO2 fertilization effect, resulting in a small net increase of the average Brazilian Arabica coffee yield of 0.8% to 1.48 t ha−1 in 2040–2070, assuming growing locations and irrigation remain unchanged. … A major failure of nearly all climate change impact studies of future crop yields rests in their poor construct and design, where they near-unanimously fail to incorporate thebeneficial effects of atmospheric CO2 enrichment on plant growth. As a result, yield projections in such studies are almost always shown to decline as a result of anticipated future temperature- and moisture-related stresses.
Bourgault et al., 2017 Atmospheric CO2 concentrations ([CO2]) are predicted to increase from current levels of about 400 ppm to reach 550 ppm by 2050. Elevated[CO2] increased lentil yields by approximately 0.5 t ha−1 [18% to 168%]. The greatest response of grain yield to elevated [CO2] was during a terminal drought. Biomass accumulation post-flowering was increased considerably by elevated [CO2].
Yadav, 2017A significant (F= 9.800; P<0.02) change was noticed in the post-harvest index of rice. However, there no change was noticed in the post-harvest percentage of maize. Leaf area of rice (P<0.01) and maize (P<0.005) increased significantly at flowering stage of plants under enriched CO2 environment over the ambient. Under elevated CO2 condition, biological yields of rice and maize were improved by 14.3% and 17.2% respectively. Carbon dioxide enrichment exposure improved the grain yield by 16. 2% (P<0.02) and 13.8% ( P<0.02) for rice and maize respectively.
Pau et al., 2017 Long-term increases in tropical flowering activity across growth forms in response to rising CO2 and climate change … We show that a multidecadal increase in flower activity is most strongly associated with rising atmospheric CO2 concentrations using yearly aggregated data. Compared to significant climatic factors, CO2 had on average an approximately three-, four-, or fivefold stronger effect than rainfall, solar radiation, and the Multivariate ENSO Index, respectively. Peaks in flower activity were associated with greater solar radiation and lower rainfall during El Niño years.
Szoboszlay et al., 2017The effect of elevated atmospheric CO2 concentration [CO2 ] on the diversity and composition of the prokaryotic community inhabiting the rhizosphere of winter barley (Hordeum vulgare L.) was investigated in a field experiment, using open-top chambers. … Above-ground plant biomass was not affected by elevated [CO2 ] at anthesis, butplantsexposed to elevated [CO2] had significantly higher grain yield.
Warming Beneficial, Does Not Harm Humans, Wildlife (8)
Fan et al., 2017Summer insolation [surface solar radiation] in the Northern Hemisphere began to increase 12,000 yr ago and reached a maximum (7% greater than the present value) from 10,000 to 9000 yr ago (Laskar et al., 2004). … We suggest that hydrological and ecological changes in the EASM margin during the Holocene were closely related to the combined effects of regional precipitation and temperature which were ultimately controlled by the Northern Hemisphere summer insolation [solar radiation], the boundary conditions and the physical environment of ocean current. Our data suggest that future global warming scenarios would potentially be beneficial for the hydrological and ecological conditions of the EASM margin, while small decreases in the precipitation and temperature superimposed on the long-term deteriorated climate may cause large declines in the hydrology and ecology in the semi-arid regions of northern China.
Crockford, 2017Data collected between 2007 and 2015 reveal that polar bear numbers have not declined as predicted and no subpopulation has been extirpated. Several subpopulations expected to be at high risk of decline have remained stable and at least one showed a marked increase in population size over the entire period. Another at-risk subpopulation was not counted but showed marked improvement in reproductive parameters and body condition with less summer ice. As a consequence, the hypothesis that repeated summer sea ice levels of below 5 mkm2 will cause significant population declines in polar bears is rejected. This result indicates that the ESA and IUCN judgments to list polar bears as threatened based on future risks of habitat loss were hasty generalizations that were scientifically unfounded, which suggests that similar predictions for Arctic seals and walrus may be likewise flawed, while the lack of a demonstrable ‘sea ice decline = population decline’ relationship for polar bears invalidates updated survival model outputs that predict catastrophic population declines should the Arctic become ice-free in summer.
Baresel et al., 2017 The Earth has known several mass extinctions over the course of its history. One of the most important happened at the Permian-Triassic boundary 250 million years ago. Over 95% of marine species disappeared and, up until now, scientists have linked this extinction to a significant rise in Earth temperatures. But researchers have now discovered that this extinction took place during a short ice age which preceded the global climate warming. It’s the first time that the various stages of a mass extinction have been accurately understood and that scientists have been able to assess the major role played by volcanic explosions in these climate processes.
(press release) Analysis of the newly dated layers showed a significant reduction of seawater levels during the [Permian] extinction event. The only explanation for such a dramatic decrease in water levels is a sudden increase in ice. The ice age lasted just 80,000 years, but theextreme cold was enough to kill off the majority of marine species.
Wang et al., 2017Numerous previous studies have reported that human health risk is extremely sensitive to temperature. …At the community level,the mean value of relative extreme cold risk (1.63) of all 122 communities was higher than that of extreme high temperature (1.15). … A prolonged impact of low temperature [cold] on human health was observed in China.
Wong et al., 2017 Strong and transparent relationships between polar bear researchers and Inuit communities are necessary to overcome persisting research (and community) misconceptions. For community members, most types of research have been viewed as inseparable from government agendas through funding and consulting programmes (Bocking 2007) and past histories and power relations have politicised views of scientific research as a whole (Reed and McIlveen 2006). …All [Inuit] participants reported having more bear encounters in recent years than in the past. Some participants indicated that the bears they have encountered are healthy. … Last year he said that there’s more bears that are more fat … they rarely see unhealthy bears … the only time they would see one is when it’s pretty old … it won’t hunt—hunt as much … and it’s skinny. (AB9) … Our elders, they say, they migrate, into other area… for years, and then they come back … that’s what we’re experiencing now … back in early 80s, and mid 90s, there were hardly any bears … there’s too many polar bears now. (AR16) Bears can catch seals even—even if the—if the ice is really thin … they’re great hunters those bears … they’re really smart … they know how to survive … Though dietary changes have been attributed to sea ice changes limiting access to primary prey (ringed and harp seal; Thiemann and others 2008a), evidence for bears foraging on land-based foods (Dyck and Romberg 2007; Rockwell and Gormezano 2009; Gormezano and Rockwell 2013a) – reported astypical behaviour by most participants here – might also suggest an opportunistic feeding strategy (Thiemann and others 2008a). This suggests that bears pursue readily available food sources even in the presence of preferred ones (Gormezano and Rockwell 2013b). Bears foraging for land-based foods have been reported in the literature prior to recent concerns over climate change (Russell 1975; Derocher and others 1993; Gormezano and Rockwell 2013a). Observations of bears consuming garbage are not uncommon (Russell 1975; Lunn and Stirling 1985; Gormezano and Rockwell 2013b)
Bårdsen et al., 2017We investigated the population dynamics of Swedish semi-domestic reindeer from 1945 to 2012 at the reindeer herding district-level (Sameby) to identify possible population collapses or declines […] but found no evidence of large-scale reindeer population declines and no visible synchrony across adjacent populations. Our findings were unexpected as both reindeer populations and the pastoral lifestyle face increased habitat loss, predation, fragmentation and climate change.
Che-Castaldo et al., 2017[A]ggregated abundance [for 267 Adélie penguin colonies] across all sites in this region showed extended periods of both increasing and decreasing abundance over the last three decades [1982-2015]. We also find a long-term decline in abundance in the South Orkney Islands, following an initial period of increase in the early 1980s. In contrast, we founda marked and steady increase in abundance around the rest of the Antarctic continent, including both Eastern Antarctica and the Ross Sea. … Commensurate with other studies [Lynch et al., 2013], we find that the population of Adélie penguins on the Antarctic Peninsula declined between 2000 and 2008, though we found an unexpected rebound in abundance starting in 2008. This regional increase in abundance may, in part, be driven by sites in the Marguerite Bay area, where Adélie penguins are stable or even increasing. However, this increase may also reflect a cessation of regional warming on the Antarctic Peninsula since the late 1990s [Turner et al., 2016], which may benefit ice-dependent species like the Adélie penguin. We find that while Eastern Antarctica appears to have been increasing steadily in abundance since at least 1982, the increasing abundance of Adélie penguins in the Ross Sea is more recent, beginning in 2002.
Aars et al., 2017The number and distribution of polar bears in the western Barents Sea … In August 2015, we conducted a survey in the Norwegian Arctic to estimate polar bear numbers and reveal population substructure. … Mainly by aerial survey line transect distance sampling methods, we estimated that 264 (95% CI = 199 – 363) bears were in Svalbard, close to 241 bears estimated for August 2004. The pack ice area had an estimated 709 bears (95% CI = 334 – 1026). The pack ice and the total (Svalbard + pack ice, 973 bears [in 2015], 95% CI = 334 – 1026) both had higher estimates compared to August 2004 (444 and 685 bears [in 2004], respectively), but the increase was not significant. … There is no evidence that the fast reduction of sea-ice habitat in the area has yet led to a reduction in population size.
Warming, Acidification Not Harming Oceanic Biosphere (18)
McElhany, 2017 Documenting an effect of OA [ocean acidification] involves showing a change in a species (e.g. population abundance or distribution) as a consequence of anthropogenic changes in marine carbonate chemistry. To date, there have been no unambiguous demonstrations of a population level effect of anthropogenic OA[ocean acidification], as that term is defined by the IPCC. … [I]t is important to acknowledge that there are no studies that directly demonstrate modern day effects of OA [ocean acidification] on marine species.
Cooper et al., 2017We determined tolerances of E. pacifica to prolonged exposure to pH levels predicted for 2100 by maintaining adults at two pCO2 levels (380 and 1200 µatm) for 2 months.Rates of survival and moulting were the same at both pCO2 levels. High pCO2 slowed growth in all size classes.
Toyofuku et al., 2017Ongoing ocean acidification is widely reported to reduce the ability of calcifying marine organisms to produce their shells and skeletons. Whereas increased dissolution due to acidification is a largely inorganic process, strong organismal control over biomineralization influences calcification and hence complicates predicting the response of marine calcifyers. Here we show that calcification is driven by rapid transformation of bicarbonate into carbonate inside the cytoplasm, achieved by active outward proton pumping. Moreover, this proton flux is maintained over a wide range of pCO2 levels. We furthermore show that a V-type H+ ATPase is responsible for the proton flux and thereby calcification. External transformation of bicarbonate into CO2 due to the proton pumping implies that biomineralization does not rely on availability of carbonate ions, but total dissolved CO2 may not reduce calcification, thereby potentially maintaining the current global marine carbonate production.
(press release) [A] group of scientists discovered to their own surprise that some tiny unicellular shellfish (foraminifera) make better shells in an acidic environment. This is a completely new insight.
Schaum et al., 2017Here, we use a decade-long experiment in outdoor mesocosms to investigate mechanisms of adaptation to warming (+4 °C above ambient temperature) in the green alga Chlamydomonas reinhardtii, in naturally assembled communities. Isolates from warmed mesocosms had higher optimal growth temperatures than their counterparts from ambient treatments. Consequently, warm-adapted isolates were stronger competitors at elevated temperature and experienced a decline in competitive fitness in ambient conditions, indicating adaptation to local thermal regimes. Higher competitive fitness in the warmed isolates was linked to greater photosynthetic capacity and reduced susceptibility to photoinhibition. These findings suggest that adaptive responses to warming in phytoplankton could help to mitigate projected declines in aquatic net primary production by increasing rates of cellular net photosynthesis.
Ollier, 2017 The coast contains ‘carbonate sand factories’ where organisms produce vast amounts of sand by fixing carbon dioxide as carbonates. Far from dissolving carbonate by acidification, carbon dioxide is an essential part of carbonate production and the continued maintenance and growth of coasts and reefs. Government policies to adapt renewable energy are unlikely to affect the system.
Mardones et al., 2017Exposure of the toxigenic dinoflagellate Alexandrium catenella to variations in pCO2/pH, comparable to current and near-future levels observed in Southern Chilean fjords, revealed potential functional adaptation mechanisms. Under calculated conditions for pH (total scale) and pCO2 ranging from 7.73–8.66 to 69.7–721.3 μatm, respectively, the Chilean strain Q09 presented an optimum growth rate and dissolved inorganic carbon (DIC) uptake at near-equilibrium pCO2/pH conditions (∼8.1). … We suggest that A. catenella Chilean strains are highly adapted to spatio-temporal pCO2/pH fluctuations in Chilean fjords, becominga resilient winner from expected climate change effects.
Glandon et al., 2017No effect of high pCO2 on juvenile blue crab, Callinectes sapidus, growth and consumption despite positive responses to concurrent warming … Our study is the first to examine the effect of multiple climate stressors on blue crab and therefore basic responses, including the growth per molt (GPM), inter-molt period (IMP), and food consumption, were quantified. GPM [growth per molt] was not affected by either increased temperature or pCO2.
Poulton et al., 2017For the first time, this study investigated the independent and combined impacts of elevated carbon dioxide (CO2) and anthropogenic noise [produced by shipping, seismic surveys, and pile-driving] on the behaviour of a marine fish, the European sea bass (Dicentrarchus labrax). … ElevatedCO2 did not alter the ventilation rate response to noise. Furthermore, there was no interaction effect between elevated CO2 and pile-driving noise, suggesting that OA [ocean acidification] is unlikely to influence startle or ventilatory responses of fish to anthropogenic noise.
Hassenrück et al., 2017 Our results suggest that on mature settlement surfaces in situ, pH does not have a strong impact on the composition of bacterial biofilms. Other abiotic and biotic factors such as light exposure and interactions with other organisms may be more important in shaping bacterial biofilms on mature surfaces than changes in seawater pH.
Lee and Kim, 2017High atmospheric CO2 dissolves into the surface of the ocean and lowers the pH of seawater and is thus expected to pose a potential threat to various marine organisms. We investigated the physiological and behavioural responses of adult Manila clams, Venerupis philippinarum (n = 96, shell length 25.32 ± 1.66mm and total wet weight 3.10 ± 0.54 g),to three levels (400, 700, and 900 μatm) of CO2 partial pressure (pCO2) for 48 days. There were no significant differences in mortality, growth, respiration rate, or emergence from the sediment between the three levels, indicating that nearfuture atmospheric levels of CO2 do not seem to have a serious effect on the physiology and behaviour of adult Manila clams.
Page et al., 2017 Here, we test the hypotheses that elevated pCO2 will differently impact the relative concentrations of divalent cations (Ca2+, Mg2+, Sr2+, and Mn2+) in four closely related species of porcelain crabs … Overall, the effect of reduced pH/elevated pCO2 on exoskeleton mineral composition was muted in mid-intertidal species relative to low-intertidal species, indicating that extant adaptation to the variable intertidal zone may lessen the impact of ocean acidification (OA) on maintenance of mineralized structures.
Long et al., 2017In this study, we determine the effects of decreased pH on the morphology, growth, and survival of juvenile blue king crab, Paralithodes platypus. Crabs were reared at three pH levels: ambient (control, pH ∼8.1), pH 7.8, and pH 7.5, for 1 year and monitored for morphological changes, survival, and growth. Exposure to seawater at pH 7.8 had no effect on morphology or mortality and had only a minor effect on growth compared with the ambient treatment.
Comeau et al., 2017 Here, we tested the response of net photosynthesis, gross photosynthesis, dark respiration, and light-enhanced dark respiration (LEDR) of eight coral taxa and seven calcified alga taxa to six different pCO2 levels (from 280 to 2000 µatm). Organisms were maintained during 7–10 days incubations in identical conditions of light, temperature, and pCO2 to facilitate comparisons among species. Net photosynthesis was not affected by pCO2 in seven of eight corals or any of the algae; gross photosynthesis did not respond to pCO2 in six coral taxa and six algal taxa; dark respiration also was unaffected by pCO2 in six coral and six algae; and LEDR did not respond to pCO2 in any of the tested species. Overall, our results show that pCO2 levels up to 2000 µatm likely will not fertilize photosynthesis or modify respiration rates of most of the main calcifiers on the back reef of Moorea, French Polynesia.
Bailey et al., 2017Early life stages of the Arctic copepod Calanus glacialis are unaffected by increased seawater pCO2 … In this study, we investigated the effect of increased pCO2 on the early developmental stages of the key Arctic copepod Calanus glacialis. Eggs from wild-caught C. glacialis females from Svalbard, Norway (80°N), were cultured for 2 months to copepodite stage C1 in 2°C seawater under four pCO2 treatments (320, 530, 800, and 1700 μatm). … All endpoints were unaffected by pCO2 levels projected for the year 2300. These results indicate that naupliar development in wild populations of C. glacialis isunlikely to be detrimentally affected in a future high CO2 ocean.
Kwan et al., 2017Neither constant nor oscillating CO2-induced acidification affected blacksmith individual light/dark preference, inter-individual distance in a shoal or the shoal’s response to a novel object, suggesting that blacksmiths are tolerant to projected future OA conditions.
Kienzle et al., 2017Rising temperatures increased recruitment of brown tiger prawn (Penaeus esculentus) in Moreton Bay (Australia)
Barkley et al., 2017[C]alcification rates of two reef-building coral genera (Porites and Favia) do not change across Palau’s steep Ωar gradient (Ωar = 3.7 to 2.3) [a pH range of 7.84 to 8.04]. … [R]egardless of reef of origin, corals in the CO2 manipulation experiment showed no calcification sensitivity to Ωar after eight weeks in experimental conditions. … [C]orals in Palau are not living close to their Ωar threshold and are tolerant to acidification levels far below those to which they are currently exposed.
Ern et al., 2017[T]he effect of elevated CO2 on oxygen supply capacity is either absent, or insufficient to cause a significant change in the oxygen limit for thermal tolerance. … [O]cean acidification is therefore unlikely to act as a significant synergistic stressor with hypoxia on the upper thermal limits of this species. … [T]he lack of significant change in CTmax of C. atripectoralis in normoxia suggests that the thermal tolerance of the physiological mechanisms responsible for setting CTmax is also not affected by elevated CO2.
Decreases In Extreme, Unstable Weather With Warming (3)
Zhang et al., 2017Based on continuous and coherent severe weather reports from over 500 manned stations, for the first time,this study shows a significant decreasing trend in severe weather occurrence across China during the past five decades. The total number of severe weather days that have either thunderstorm, hail and/or damaging wind decrease about 50% from 1961 to 2010. It is further shown that the reduction in severe weather occurrences correlates strongly with the weakening of East Asian summer monsoon which is the primary source of moisture and dynamic forcing conducive for warm-season severe weather over China.
Kawamura et al., 2017Numerical experiments using a fully coupled atmosphere-ocean general circulation model with freshwater hosing in the northern North Atlantic showed that climate becomes most unstable in intermediate glacial conditions associated with large changes in sea ice and the Atlantic Meridional Overturning Circulation. Model sensitivity experiments suggest that the prerequisite for the most frequent climate instability with bipolar seesaw pattern during the late Pleistocene era is associated with reduced atmospheric CO2 concentration via global cooling and sea ice formation in the North Atlantic, in addition to extended Northern Hemisphere ice sheets. [Cooling elicits more climate instability.]
Heller, 2017 The hurricane analysis conducted by Burn and Palmer (2015) determined that hurricane activity was subdued during the [warm] Medieval Climate Anomaly (MCA) (~900-1350 CE) and became more produced during the [cold] Little Ice Age (LIA) (~1450-1850 CE), followed by a period of variability occurred between ~1850 and ~1900 before entering another subdued state during the industrial period (~1950-2000 CE). In general, the results of this study corroborate these findings … [W]hile hurricane activity was greater during the LIA, it also had more frequent periods of drought compared to the MCA (Burn and Palmer 2014), suggesting that climate fluctuations were more pronounced in the LIA compared to the MCA. The changes in the diatom distribution and fluctuations in chl-a recorded in this study starting around 1350 also indicate that variations in climate have become more distinct during the LIA and from ~1850-1900. … [C]limate variability has increased following the onset of the Little Ice Age (~1450-1850 CE), howeverit is difficult to distinguish the impacts of recent anthropogenic climate warming on hurricane activity from those of natural Atlantic climate regimes, such as ENSO.
Parker and Ollier 2017 The global reconstructions as GISS (Hansen et al. 2010, GISTEMP Team 2017) are artificially biased upwards to reproduce the carbon dioxide emission trend, but the strong natural oscillation signal prevails. The very likely overrated warming rate since 1880 is 0.00654°C/year or 0.654°C/century. … Because the GISS temperature record is biased upwards, as many supporting stations have upwards biased temperatures rather than the actual thermometer reading … As there is no way to perform a better measurement going back in the past, there is no legitimate way to correct recorded data of the past. Therefore, we should stick to the raw data. … The climate trend maps compiled by Bureau of Meteorology in their climate change section are completely unreliable, as the alleged increasing temperature is obtained by lowering temperatures of the past by “adjustments”.The longest of the Australian temperature records that were considered the most reliable by Bureau of Meteorology on February 2009 (BOM 2009) are still available as raw temperatures in the climate data online section andconsistently show no warming and no increased extreme events within the limit of accuracy of measurements.
Levermore et al., 2017The increasing trend of the urban heat island intensity …The urban heat island intensity in Manchester has a highly significant rising trend which by the end of the century could add 2.4 K to the average annual urban temperature, on top of the predicted climate change increase. An analysis of the urban morphology showed that the urban site had indeed become more urban over 9 years of the study, losing green spaces which mitigate against the UHII.
Liao et al., 2017 We examine the urban effect on surface warming in Eastern China, where a substantial portion of the land area has undergone rapid urbanization in the last few decades. Daily surface air temperature records during the period 1971–2010 at 277 meteorological stations are used to investigate temperature changes. Owing to urban expansion, some of the stations formerly located in rural areas are becoming increasingly influenced by urban environments. To estimate the effect of this urbanization on observed surface warming, the stations are dynamically classified into urban and rural types based on the land use data for four periods, i.e. 1980, 1990, 2000 and 2010. After eliminating the temperature trend bias induced by time-varying latitudinal distributions of urban and rural stations, the estimated urban-induced trends in the daily minimum and mean temperature are 0.167 and 0.085 °C decade−1, accounting for 33.6 and 22.4% of total surface warming, respectively. The temperature difference between urban and rural stations indicates that urban heat island intensity has dramatically increased owing to rapid urbanization, and is highly correlated with the difference in fractional coverage of artificial surfaces between these two types of stations. This study highlights the importance of dynamic station classification in estimating the contribution of urbanization to long-term surface warming over large areas.
Kyriakodis and Santamouris, 2017UHI is the most studied phenomenon of climate change and refers to the increased ambient temperature of cities compared to rural settings. Implementation of reflective materials to urban structures, such as roads and pavements, reduces the surface and ambient temperature and contributes to counterbalance the impact of the phenomenon. … Conclusion:[T]he use of cool non-aged asphalt can reduce the ambient temperature by up to 1.5 °C and the maximum surface temperature reduction could reach 11.5 °C… Surface temperatures reduction up to 7.5 °C and 6.1 °C respectively in the summer period.
Dienst et al., 2017 We here assess these influences and demonstrate that even in villages urban heat island biases might affect the temperature readings. … Due to the station movement from the village centre to the outskirts, the net correction results in an additional warming trend over the past 155 years. The trend increase is most substantial for minimum temperatures (+0.03 °C /10 years−1) [+0.3°C per century] . … An increase in trend is even more severe if the 20th century is regarded exclusively, displaying a rise in annual mean temperature trend by +0.03 °C /10 years−1 and +0.07 °C /10 years−1 in annual minimum temperatures, respectively. … The adjustment of the Haparanda station record results in an increased warming trend.
No Increasing Trends In Intense Hurricanes (4)
Choi et al., 2017 This study analysed the time series of tropical cyclone (TC) frequency during October–December (OND) for 32 years (1980–2011). There was a strong decreasing trend of TCs [tropical cyclones]until recently, and the TC sharply decreased from 1996 after the statistical change-point analysis was applied to this time series.
Chen et al., 2017Results indicate that the midlatitude summer cyclone activity over East Asia exhibits decadal changes in the period of 1979–2013 and is significantly weakened after early 1990s. … Moreover, there is a close linkage between the weakening of cyclonic activity after the early 1990s and the nonuniform surface warming of the Eurasian continent. Significant warming to the west of Mongolia tends to weaken the north–south temperature gradient and the atmospheric baroclinicity to its south and eventually can lead to weakening of the midlatitude cyclone activity over East Asia.
Wellford et al., 2017 Since the late 1800s, in contrast to much of the Southeastern USA, the Georgia coast has experienced infrequent hurricane landfalls, particularly in recent decades. As a result, coastal storm preparedness complacency appears to be rampant along the Georgia coastline. Both local and state governments were unprepared for shadow evacuation during Hurricane Floyd in 1999. The study described here includes an examination of temporal and spatial trends in hurricane landfall along the Georgia coast from 1750 to 2012. Since 1750, 18 of the 24 recorded hurricanes that made landfall along the Georgia coast occurred between 1801 and 1900, yet the hurricane intensities have declined since 1851.
Yoshida et al., 2017Projected future changes in global tropical cyclone (TC) activity are assessed using 5,000 year scale ensemble simulations for both current and 4 K surface warming climates with a 60 km global atmospheric model. The global number of TCs [tropical cyclones] decreases by 33% in the future projection. Although geographical TC occurrences decrease generally, they increase in the central and eastern parts of the extra tropical North Pacific. Meanwhile, very intense (category 4 and 5) TC occurrences increase over a broader area including the south of Japan and south of Madagascar. The global number of category 4 and 5 TCs [tropical cyclones] significantly decreases, contrary to the increase seen in several previous studies.
No Increasing Trends In Drought/Flood Frequency, Severity (3)
McAneney et al., 2017[A] 122-year record of major flooding depths at the Rarawai Sugar Mill on the Ba River in the northwest of the Fijian Island of Viti Levu is analysed. … It exhibits no statistically significant trends in either frequency or flood heights, once the latter have been adjusted for average relative sea-level rise. This is despite persistent warming of air temperatures as characterized in other studies. There is a strong dependence of frequency (but not magnitude) upon El Niño-Southern Oscillation (ENSO) phase, with many more floods in La Niña phases. The analysis of this long-term data series illustrates the difficulty of detecting a global climate change signal from hazard data, even given a consistent measurement methodology (cf HURDAT2 record of North Atlantic hurricanes) and warns of the strong dependence of any statistical significance upon choices of start and end dates of the analysis.
McCabe et al., 2017In this study, a monthly water-balance model is used to simulate monthly runoff for 2109 hydrologic units (HUs) in the conterminous United States (CONUS) for water-years 1901 through 2014. … Results indicated that … the variability of precipitation appears to have been the principal climatic factor determining drought, and for most of the CONUS,drought frequency appears to have decreased during the 1901 through 2014 period.
Hodgkiins et al., 2017 In the current study, trends in major-flood occurrence from 1961 to 2010 and from 1931 to 2010 were assessed using a very large dataset (>1200 gauges) of diverse catchments from North America and Europe … Overall, the number of significant trends in major-flood occurrence across North America and Europe was approximately the number expected due to chance alone. Changes over time in the occurrence of major floods were dominated by multidecadal variability rather than by long-term trends. There were more than three times as many significant relationships between major-flood occurrence and the Atlantic Multidecadal Oscillation than significant long-term trends. … The Intergovernmental Panel on Climate Change (IPCC) concluded (Hartmann et al., 2013) that globally there is no clear and widespread evidence of changes in flood magnitude or frequency in observed flood records. … North American trends in … frequency of extremes in the 1980s and 1990s were similar to those of the late 1800s and early 1900s. There was no discernible trend in the frequency of extreme events in Canada. The results of this study, for North America and Europe, provide a firmer foundation and support the conclusion of the IPCC (Hartmann et al., 2013) that compelling evidence for increased flooding at a global scale is lacking.
Natural CO2, Methane Sources Out-Emit Human Source (4)
Harde, 2017The anthropogenic contribution to the actual CO2concentration is found to be 4.3%, its fraction to the CO2 increase over the Industrial Era is 15% and the average residence time 4 years. … Under present conditions the natural emissions contribute 373 ppm and anthropogenic emissions 17 ppm to the total concentration of 390 ppm (2012). For the average residence time we only find 4 years. … The stronger increase of the concentration over the Industrial Era up to present times can be explained by introducing a temperature dependent natural emission rate as well as a temperature affected residence time. With this approach not only the exponential increase with the onset of the Industrial Era but also the concentrations at glacial and cooler interglacial times can well be reproduced in full agreement with all observations. So, different to the IPCC’s interpretation the steep increase of the concentration since 1850 finds its natural explanation in the self accelerating processes on the one hand by stronger degassing of the oceans as well as a faster plant growth and decomposition, on the other hand by an increasing residence time at reduced solubility of CO2 in oceans. … Together this results in a dominating temperature controlled natural gain, which contributes about 85 % to the 110 ppm CO2 increase over the Industrial Era, whereas the actual anthropogenic emissions of 4.3 % only donate 15 %. These results indicate that almost all of the observed change of CO2 during the Industrial Era followed, not from anthropogenic emission, but from changes of natural emission.
Carey et al., 2017While scientists and policy experts debate the impacts of global warming, Earth’s soil is releasing roughly nine times more carbon dioxide to the atmosphere than all human activities combined.
Ruppel and Kessler, 2017 On the contemporary Earth, gas hydrate is dissociating in specific terrains in response to post-LGM [last glacial maximum] climate change and probably also due to warming since the onset of the Industrial Age. Nevertheless, there is no conclusive proof that the released methane is entering the atmosphere at a level that is detectable against the background of ~555 Tg yr−1 CH4 [natural] emissions. The IPCC estimates are not based on direct measurements of methane fluxes from dissociating gas hydrates, and many numerical models adopt simplifications that do not fully account for sinks, the actual distribution of gas hydrates, or other factors, resulting in probable overestimation of emissions to the ocean-atmosphere system.
Turner et al., 2017We conclude that the current surface observing system does not allow unambiguous attribution of the decadal trends in methane without robust constraints on OH variability, which currently rely purely on methyl chloroform data and its uncertain emissions estimates.
[press release] [M]ethane emissions might not have increased dramatically in 2007 after all. Instead, the most likely explanation has less to do with methane emissions and more to do with changes in the availability of the hydroxyl (OH) radical, which breaks down methane in the atmosphere. As such, the amount of hydroxyl in the atmosphere governs the amount of methane. If global levels of hydroxyl decrease, global methane concentrations will increase — even if methane emissions remain constant, the researchers say. … When atmospheric concentrations of methane increase, it may not be correct to chalk it up solely to an increase in methane emissions.
Increasing Snow Cover Since The 1950s (3)
Coleman and Schwartz, 2017Data revealed 713 blizzards over the 55 years, with a mean of 13 events per season. Seasonal blizzard frequency ranged from one blizzard in 1980/81 to 32 blizzards in 2007/08. Federal disaster declarations resulting from blizzards totaled 57, with more than one-half of them occurring in the twenty-first century. Storm Data attributed 711 fatalities during the 55-yr study period, with an average of one individual per event; 2044 injuries were reported, with a mean of nearly three per blizzard. Property damage totaled approximately $9.11 billion in unadjusted dollars, with an approximate mean of $12.6 million per storm. Seasonal blizzard frequencies displayed a distinct upward trend, with a more substantial rise over the past two decades. … The modeled increase in blizzard activity showed a nearly fourfold upsurge between the start and end of the study period at 5.9 and 21.6 blizzards, respectively. On the basis of current model trends, the expected blizzard total for a season is 32 blizzards by 2050; uncertainty exists on whether the linear trend will continue or stabilize in the near future.
Changnon, 2017Heavy 30-day snowfall amounts were evaluated to identify spatial and temporal characteristics east of the Rockies in the United States during the period 1900-2016. An extensive data assessment identified 507 stations for use in this long-term climate study. The top 30-day heavy snowfall amount and the average of the top five 30-day heavy snowfall amounts were examined. … The northern Great Plains, Great Lakes, Midwest, and Northeast experienced more top five periods [more snow] in the second half of the 117-year period [1958-2016], where most of the southern states experienced top five periods throughout the study period. Examining extremes at periods beyond the daily event and less than the season contributes to our knowledge of climate and provides useful information to snow-sensitive sectors.
Hatchett et al., 2017Winter Snow Level Rise in the Northern Sierra Nevada from 2008 to 2017. … Positive SST anomalies offshore of California were associated with reductions in observed winter snow fractions. … If such a connection between SSTs, moisture plume strength, and snow fractions does exist, it suggests that snow accumulation may further decline with continued regional warming.
Miscellaneous (7)
Stenhouse et al., 2017American Meteorological Society [m]embers who said the global warming of the last 150 years was mostly caused by human activity (53% of full sample) … Members who are convinced of largely human-caused climate change expressed that debate over global warming sends an unclear message to the public. Conversely, members who are unconvinced of human-caused climate change often felt that their peers were closed-minded and suppressing unpopular views. These two groups converged, however, on one point: politics was seen as an overwhelmingly negative influence on the debate.
Remy et al., 2017We compared palaeofire and simulated climatic data over the last 7000 years to assess causes of large wildfire events in three coniferous boreal forest regions in north-eastern Canada. These regions span an east-west cline, from a hilly region influenced by the Atlantic Ocean currently dominated by Picea mariana and Abies balsamea to a flatter continental region dominated by Picea mariana and Pinus banksiana. The largest wildfires occurred across the entire study zone between 3000 and 1000 cal. BP. In western and central continental regions these events were triggered by increases in both the fire-season length and summer/spring temperatures, while in the eastern region close to the ocean they were likely responses to hydrological (precipitation/evapotranspiration) variability.
Pearce et al., 2017 There is little evidence here that supports the notion shared by Cook, Oreskes and various fossil fuel companies: that disinformation about scientific consensus begets public opposition to policy. Despite this evidence, Cook (2017) and Oreskes (2017) appear convinced that public understanding of scientific consensus is essential for developing effective climate policies. Even if this “gateway belief model” could be proved in laboratory studies, it holds questionable significance in the real worldwhere sources of competing information always exist (Kahan & Carpenter, 2017). … First, the debate over the hiatus/pause in global temperature increase was not invented by fossil fuel interests, but is a subject of genuine scientific disagreement (Medhaug, Stolpe, Fischer, & Knutti, 2017). Second, there is increasing expert debate regarding how much carbon dioxide can be emitted while keeping global temperature rise below 1.5°C (Millar et al., 2017a, 2017b; Peters, 2017; Rathi, 2017). For climate scientists, there is no obvious consensus about questions such as these. On the other hand, Cook, Oreskes and others persist in messaging the minimalist fact that human influence on a changing climate is uncontroversial amongst scientists. … Cook (2017) interprets our argument as playing into the hands of climate disinformers. Far from it. It is the insistent demand that publics will only engage in relevant policy debates once they have adopted a “gateway belief” that is playing into the hands of those who wish to slow-down climate policy design and implementation.
Ivy et al., 2017Recent research has demonstrated that the concentrations of anthropogenic halocarbons have decreased in response to the worldwide phaseout of ozone depleting substances. Yet, in 2015 the Antarctic ozone hole reached a historical record daily average size in October. Model simulations with specified dynamics and temperatures based on a reanalysis suggested that the record size was likely due to the eruption of Calbuco, but did not allow for fully-coupled dynamical or thermal feedbacks. We present simulations of the impact of the 2015 Calbuco eruption on the stratosphere using the Whole Atmosphere Community Climate Model with interactive dynamics and temperatures. Comparisons of the interactive and specified dynamics simulations indicate that chemical ozone depletion due to volcanic aerosols played a key role in establishing the record-sized ozone hole of October 2015. The analysis of an ensemble of interactive simulations with and without volcanic aerosols suggests that the forced response to the eruption of Calbuco was an increase in the size of the ozone hole by 4.5 million km2.
Alcock et al., 2017The rise in greenhouse gas emissions from air travel could be reduced by individuals voluntarily abstaining from, or reducing, flights for leisure and recreational purposes. In theory, we might expect that people with pro-environmental value orientations and concerns about the risks of climate change, and those who engage in more pro-environmental household behaviours, would also be more likely to abstain from such voluntary air travel, or at least to fly less far. … [W]e found that, after accounting for potential confounders, there was no association between individuals’ environmental attitudes, concern over climate change, or their routine pro-environmental household behaviours, and either their propensity to take non-work related flights, or the distances flown by those who do so.
Maibach et al., 2017Nearly half of weathercasters (49%) are convinced that the climate change over the past 50 years has been mostly or entirely due to human activity.
Kretschmer et al., 2017 Despite global warming,recent winters in the Northeastern United States (US), Europe and especially in Asia were anomalously cold. Some mid-latitude regions like Central Asia and eastern Siberia even show a downward temperature trend in winter over the past decades (Cohen et al. 2014a; McCusker et al. 2016). … [O]ver the last 37 years, the frequency of weak vortex states in mid to late winter (January and February) has increased which were accompanied by subsequent cold extremes in mid-latitude Eurasia. For this region 60% of the observed cooling in the era of Arctic amplification, i.e. since 1990, can be explained by the increased frequency of weak stratospheric polar vortex states, a number which increases to almost 80% when El Niño/Southern Oscillation (ENSO) variability is included as well.
Scientists: We Don’t Know (3)
McKinley et al., 2017 That the growth of the partial pressure of CO2 gas in the atmosphere ( pCO2 atm) drives a growing oceanic sink is consistent with our basic understanding that, as the globally averaged atmosphere-to-ocean pCO2 gradient increases, carbon accumulation in the ocean will occur at an increasing rate (Section 3). Thisbehavior has been illustrated clearly with models [not observations] forced with only historically observed increases in pCO2 atm and no climate variability or change (Graven et al. 2012, Ciais et al. 2013). Nonetheless, critical mysteries remain and weigh heavily on our ability to quantify relationships between the perturbed global carbon cycle and climate change. … The current inability to accurately quantify the mean CO2 sink regionally or locally also suggests that present-day observational constraints are inadequate to support a detailed, quantitative, and mechanistic understanding of how the ocean carbon sink works and how it is responding to intensifying climate change. This lack of mechanistic understanding implies that our ability to model (Roy et al. 2011, Ciais et al. 2013, Frolicher et al. 2015, Randerson et al. ¨ 2015), and thus to project the future ocean carbon sink, including feedbacks caused by warming and other climate change, is seriously limited. … The sum of the available evidence indicates that variability in the ocean carbon sink is significant and is driven primarily by physical processes of upwelling, convection, and advection. Despite evidence for a growing sink when globally integrated (Khatiwala et al. 2009, 2013; Ciais et al. 2013; DeVries 2014), this variability, combined with sparse sampling, means that it is not yet possible to directly confirm from surface observations that long-term growth in the oceanic sink is occurring. … [T]his CESM-LE analysis further illustrates that variability in CO2 flux is large and sufficient to prevent detection of anthropogenic trends in ocean carbon uptake on decadal timescales.
Kitaba et al., 2017Debate continues over whether changes in the galactic cosmic ray (GCR) flux may induce climate change. Weakening of the geomagnetic field and its shielding properties leads to an increase in GCR flux, and this increased GCR may induce more active low cloud formation (Svensmark effect), which in turn increases albedo and hence reduces temperature. Two possible mechanisms have been proposed for how GCR affects clouds: one theory argues that the highly-charged GCR ionises a number of atmospheric molecules, leading to combination and nucleation of aerosol particles which grow into cloud condensation nuclei (CCN); the other proposes that GCR affects clouds through the modulation of the global electric circuit. …Interest is strong in proving or disproving the Svensmark effect as an important factor affecting climate because, if the hypothesis is correct, it would comprise an important mechanism in which solar variation may control climate through the modulation of GCR flux. … Significant GCR change, however, occurs rarely and on geological time scales and is not suitable for direct observation. Therefore, the GCR linkage to climate change is accordingly difficult to assess within a manageable time frame. Numerous experiments and modelling studies have examined the production and growth of cloud condensation nuclei by the atmospheric ionisation generated by GCR. These studies, however, have been inconclusive because the physical scale and complexity of this process is too large to be reproduced experimentally or in model simulation.
Kent et al., 2017 The term SST has typically been used to describe the mean temperature of the upper few meters of the ocean. Historically measurements taken at depths from the surface and down to about 20 m have all been assumed representative of the SST. Under well-mixed conditions this is a good assumption. However, there are well-known variations of ocean temperature with depth, especially at low wind speeds and sunny conditions (Kawai and Wada 2007). … SST has been measured in different ways over the past 200 years. The observations record real variations in temperature but also contain an imprint of how they were measured. Both the real variations and the biases are affected by the ambient environmental conditions, making them hard to disentangle. … The earliest observations were probably made by sampling seawater in a bucket. Maury (1858) recommended wooden buckets, which were likely used around this time.
Detailed information on the ships and the different methods of measurement, now known to be of immense value to assess changes, has been lost. … Reconciling all of this to make consistent estimates of SST changes would be a challenge with good documentation. The patchy availability of observational and platform metadata, and sparse sampling in some regions and periods, makes it even harder. … Although ICOADS [International Comprehensive Ocean–Atmosphere Data Set] is often thought of as “raw” data, it is derived from a larger, more heterogeneous underlying databank from diverse sources. Further reprocessing of the databank could help to better resolve duplicate observations, incomplete ship identifiers, scale conversions, missing metadata, and positional errors among other basic problems. … [C]omplete authoritative archives of data and metadata do not exist for moored buoys, ocean weather ships, or research vessels. Land-based coastal observations are difficult to identify in global and regional archives, and multivariate records are often fragmented (Thorne et al. 2017). … SST biases are statistically and computationally challenging. … The data are of varied quality. Metadata are sometimes incomplete or conflicting. Reference observations are few and not always of unimpeachable quality. … Older ICOADS acquisitions are often lacking metadata and are compromised by legacy deficiencies in data management and storage formats. … The comparison shows we are yet to fully reconcile the biases in all types of SST observations throughout the historical record.
By continuing to use the site, you agree to the use of cookies. more information
The cookie settings on this website are set to "allow cookies" to give you the best browsing experience possible. If you continue to use this website without changing your cookie settings or you click "Accept" below then you are consenting to this. More information at our Data Privacy Policy
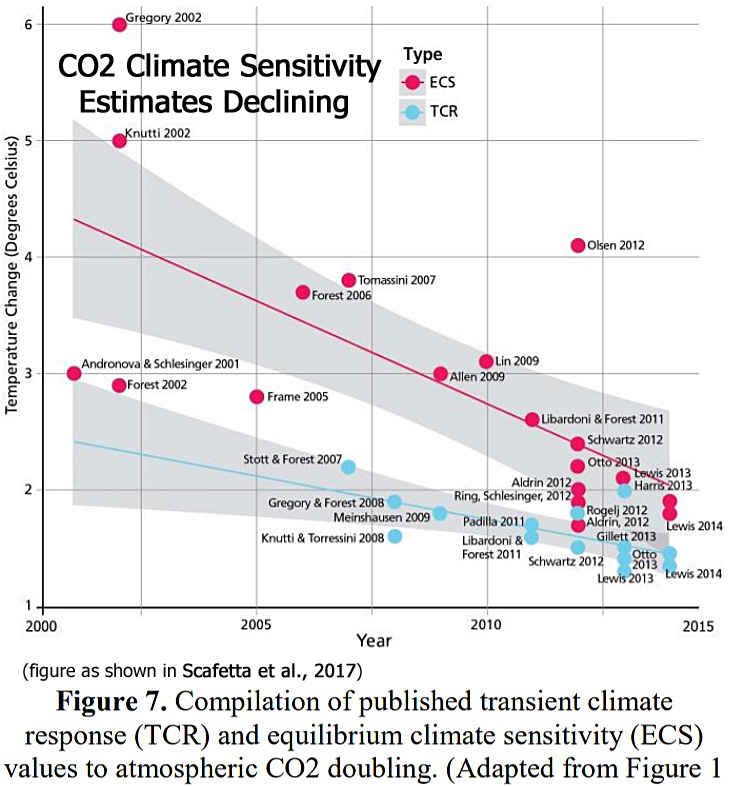
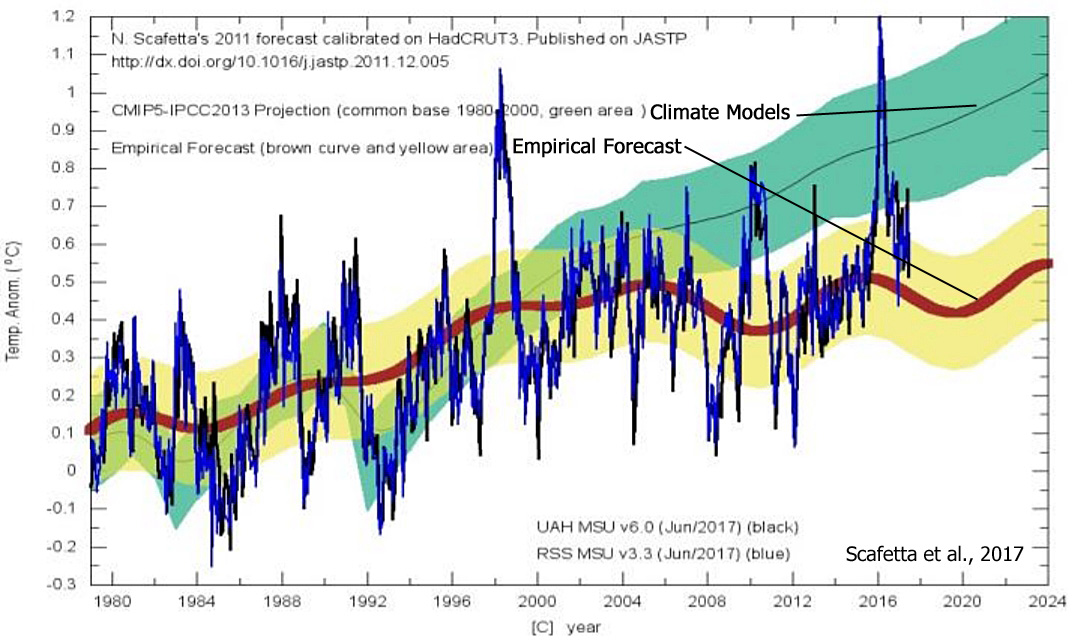
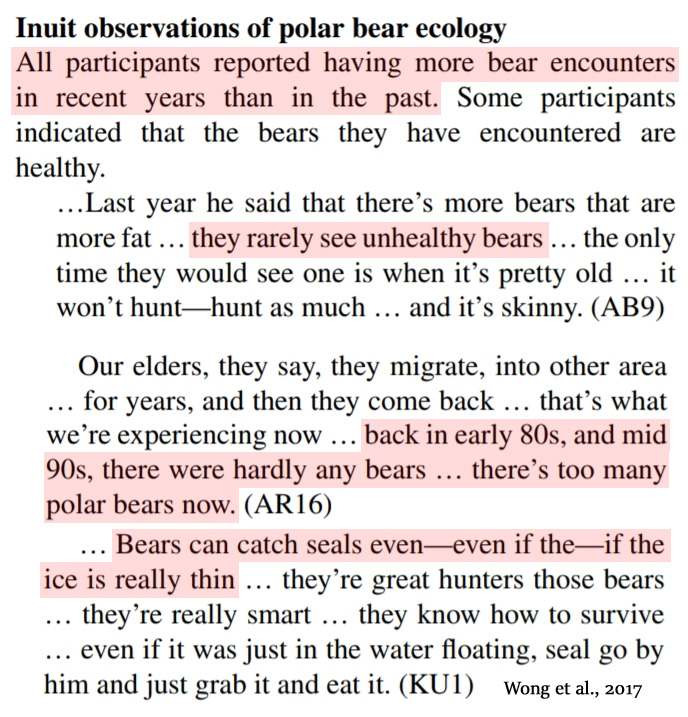
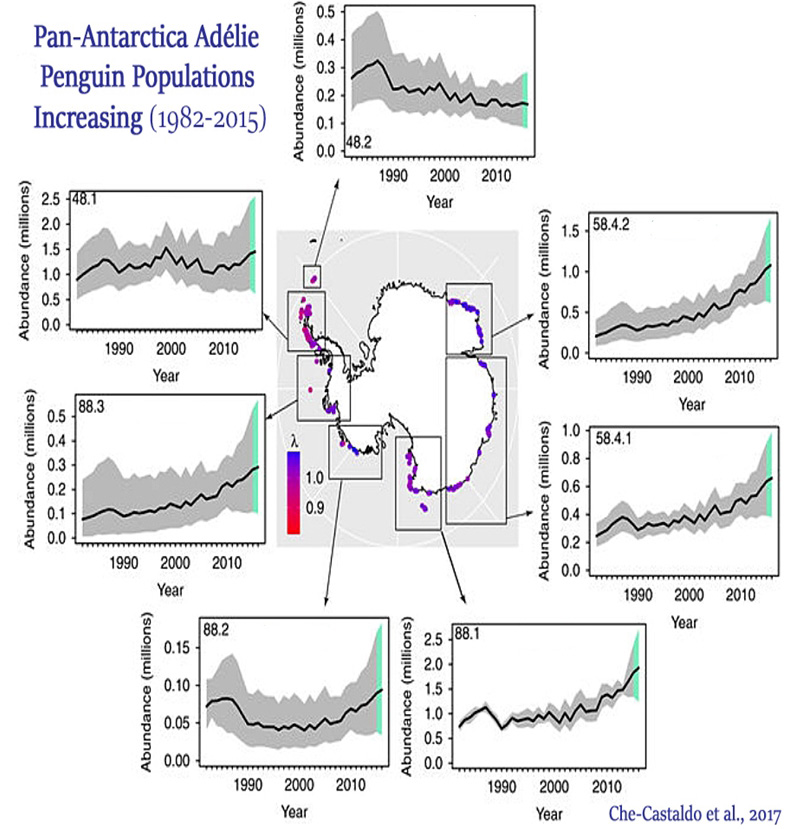
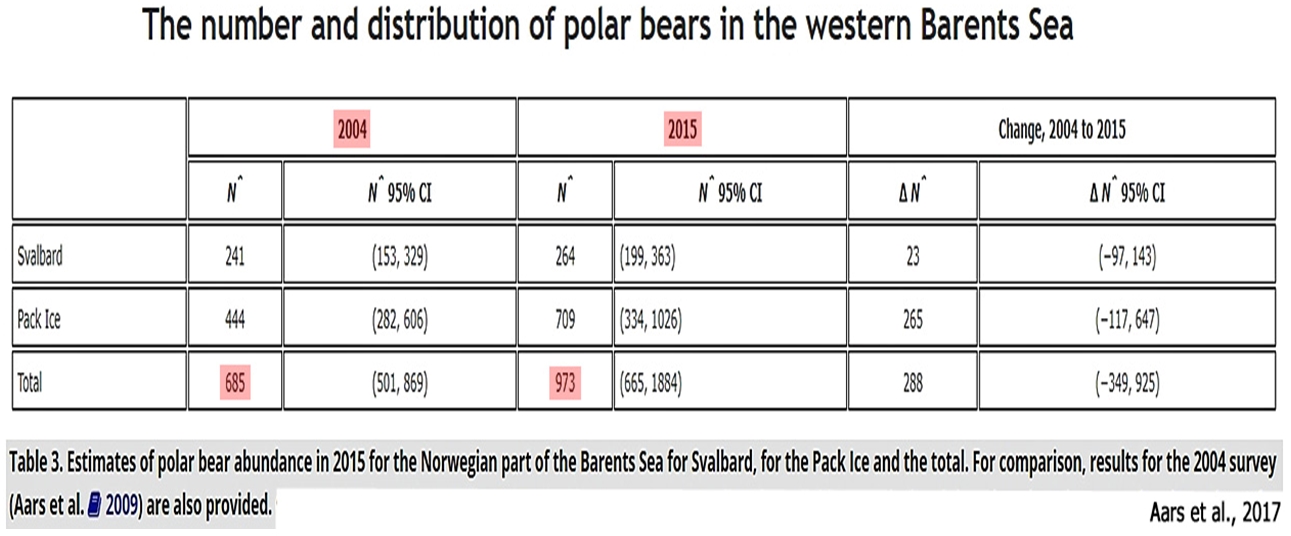
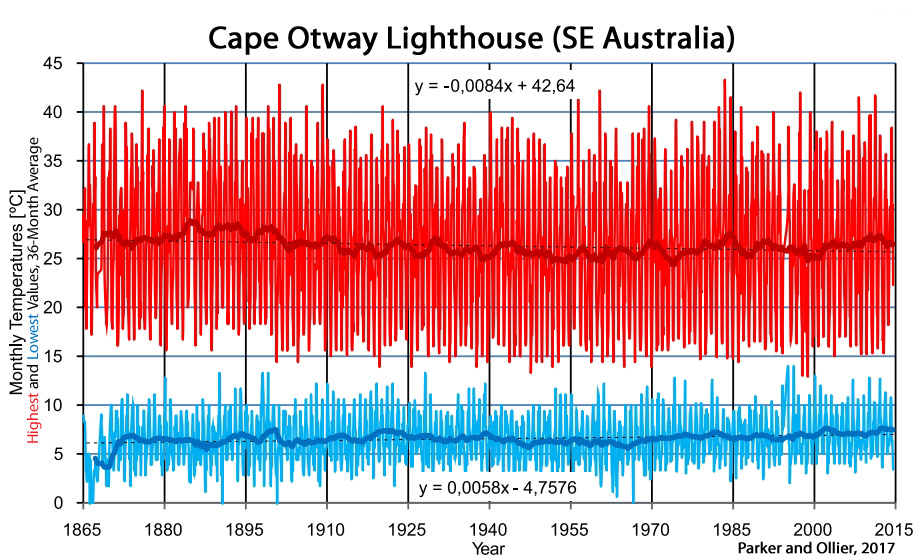
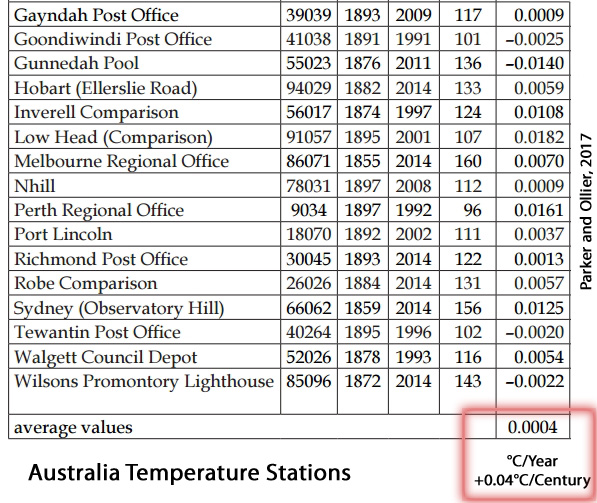

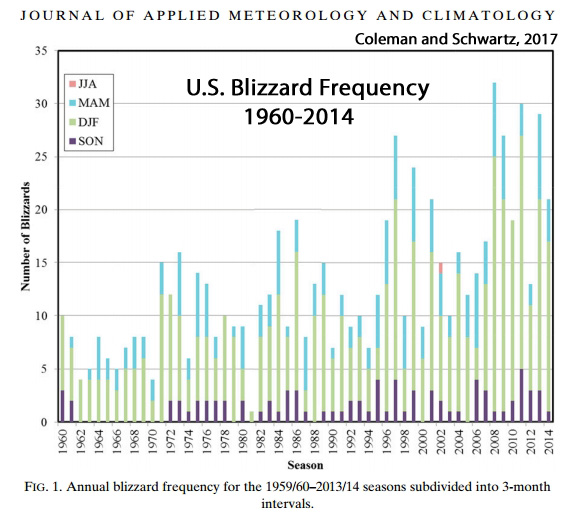
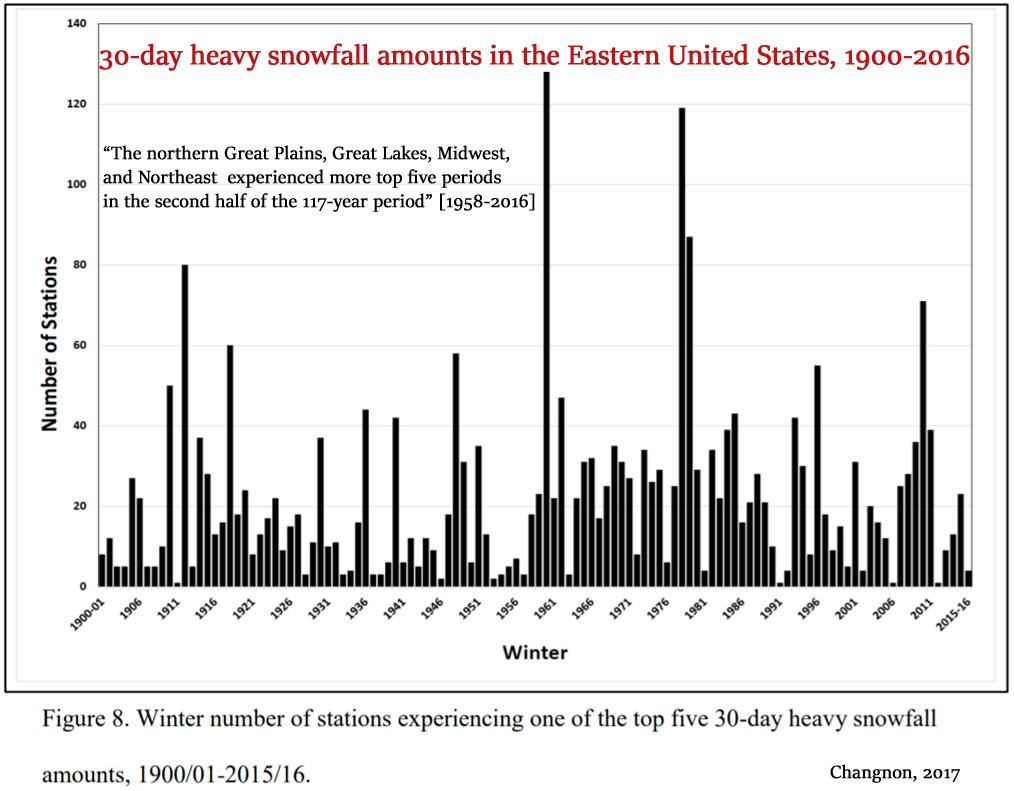

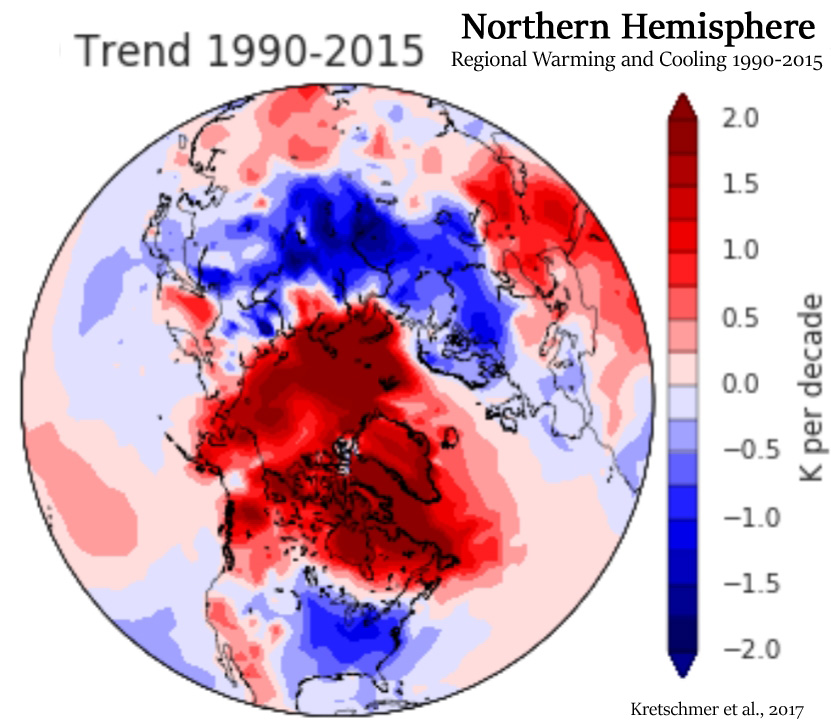


Recent Comments