Solar Influence On Climate (121) ENSO, NAO, AMO, PDO Climate Influence (44) Modern Climate In Phase With Natural Variability (13) Cloud/Aerosol Climate Influence (10) Volcanic/Tectonic Climate Influence (6) The CO2 Greenhouse Effect – Climate Driver? (15)
Part 1. Natural Mechanisms Of Weather, Climate Change
Solar Influence On Climate (121)
Yan et al., 2017Morpho- and hydrodynamic variations seem to coincide with northern hemispheric solar forcing. The Medieval Warm Period (MWP) until about 1270 CE displays generally moist and warm climate conditionswith minor fluctuations [stability], likely in response to variations in summer monsoon intensity. The three-partite period of the Little Ice Age (LIA), shows hydrologically unstable conditions between 1350 and 1530 CE with remarkably colder periods, assigned to a prolonged seasonal ice cover. … Seasonal freezing periods in excess of the average time of frozen water bodies also occurred in periods of the well-known grand solar minima and indicate stronger seasonality, possibly independent from variations in summer monsoon strength but with links to global northern hemispheric climate.
Li et al., 2017We suggest that solar activity may play a key role in driving the climatic fluctuations in NC [North China] during the last 22 centuries, with its quasi ∼100, 50, 23, or 22-year periodicity clearly identified in our climatic reconstructions. …It has been widely suggested from both climate modeling and observation data that solar activity plays a key role in driving late Holocene climatic fluctuations by triggering global temperature variability and atmospheric dynamical circulation… In short, the mechanism of the climatic variations in NC can be likely summarized as follows. The strengthened solar activity could be significantly amplified by the variations in ultraviolet radiation as well as clouds (e.g., Haigh, 1996; Tinsley, 2000), resulting in the marked variability in global surface temperature. … Additionally, increased El Nino-Southern Oscillation (ENSO) strength (possibly El Niño-like phases) during drying periods, increased volcanic eruptions and the resulting aerosol load during cooling periods, as well as high volumes of greenhouse gases such as CO2 and CH4 during the recent warming periods, may also play a role in partly affecting the climatic variability in NC, superimposing on the overall solar-dominated long-term control (e.g., Wanner et al., 2008; Tan et al., 2011; Kobashi et al., 2013; Chen et al., 2015a,b).
Yndestad and Solheim, 2017Deterministic models based on the stationary periods confirm the results through a close relation to known long solar minima since 1000 A.D. and suggest a modern maximum period from 1940 to 2015. The model computes a new Dalton-type sunspot minimum from approximately 2025 to 2050 and a new Dalton-type period TSI minimum from approximately 2040 to 2065. … Periods with few sunspots are associated with low solar activity and cold climate periods. Periods with many sunspots are associated with high solar activity and warm climate periods. … Studies that employ cosmogenic isotope data and sunspot data indicate that we are currently leaving a grand activity maximum, which began in approximately 1940 and is now declining (Usoskin et al., 2003; Solanki et al., 2004; Abreu et al., 2008). Because grand maxima and minima occur on centennial or millennial timescales, they can only be investigated using proxy data, i.e., solar activity reconstructed from 10Be and 14C time-calibrated data. The conclusion is that the activity level of the Modern Maximum (1940–2000) is a relatively rare event, with the previous similarly high levels of solar activity observed 4 and 8 millennia ago (Usoskin et al., 2003). Nineteen grand maxima have been identified by Usoskin et al. (2007) in an 11,000-yr series. … Twenty-seven grand minima are identified with a total duration of 1900 years, or approximately 17% of the time during the past 11,500 years (Usoskin et al., 2007). An adjustment-free reconstruction of the solar activity over the last three millennia confirms four grand minima since the year 1000: Maunder (1640–1720), Spörer (1390–1550), Wolf (1270–1340) and Oort (1010–1070) (Usoskin et al., 2007). … A cold period was also observed during the time of the Dalton minimum. The Maunder and the Dalton minima are associated with less solar activity and colder climate periods. In this investigation, minimum solar activity periods may serve as a reference for the identified minimum irradiations in the TSI oscillations.
Smith, 2017Yearly mean temperatures in the CET [Central England Temperature] record show an increase in temperature of approximately 1.3°C degrees from the end of the 17th Century to the end of the 20th Century/beginning of 21st Century. … Subtle difference in timing between the warming/cooling phases between the Central England record and the other localities may reflect local climate variation, but the similarity in events between continents suggests the CET [Central England Temperature] record is recording global temperature patterns. Records of sunspot numbers began in 1610 such that detailed estimates of solar variation for the years covered by the CET record can be made without resort to the use of proxy data. Reconstructions of TSI [e.g. 16-18] differ in magnitude (Table 1), but there is agreement in form with 4 peaks and 4 to 6 troughs occurring over the time-scale of the CET record (Fig. 4). These are: a minimum in TSI associated with the Maunder Sunspot Minimum in the latter half of the 17th Century; a peak, possibly bi-modal approaching modern TSI values during the 18th Century; a well-defined trough corresponding with the Dalton Sunspot Minimum between 1800- 1820; a poorly defined TSI peak in the mid 19th Century; a reduction in TSI during the late 19th Century; increasing TSI during the early 20th Century; a decrease in TSI from around 1950- 1975; and a second phase of TSI increase in the late 20th Century. There is good correspondence with TSI throughout the CET record, with warm events correlating with high TSI and cool phases correlating with plateaus or decreases in TSI (Fig. 4). … However, for temperature increases from the beginning of the Industrial Revolution (Maunder Minimum and Dalton Minimum to end of 20th Century), high TSI models can account for only 63-67% of the temperature increase. This would suggest that onethird of Global Warming/Climate Change can be attributed to AGW. … Approximately two-thirds [0.8°C to 0.9°C] of climate warming since the mid-late 18th Century [1.3°C] can be attributed to solar causes, suggesting warming due to anthropogenic causes over the last two centuries is 0.4 to 0.5°C.
Nan et al., 2017The SST variation shows a millennial period of ~ 1500-yr and centennial periods of 131-yr and 113-yr. The ~ 1.5 kyr cycle dominated the period of 8.9–5.5 cal. kyr BP, suggesting a tele-connection between the Yellow Sea SST and global climate changes, might through the Kuroshio current.Centennial periods dominated almost all of cold periods recorded in core BY14, implying the signature of solar irradiance cycles by means of the strengthened East Asia Winter Monsoon (EAWM).
Nurtaev and Nurtaev, 2017A reconstruction of total solar irradiance since 1610 to the present estimated by various authors an increase in the total solar irradiance since the Maunder Minimum of about 1.3 W/m² [2]. This is a huge amount of energy, taking into account the Earth’s total land mass. … More sunspots deliver more energy to the atmosphere, by way of increased brightness of the Sun and solar wind what tend to warm the Earth. Solar activity affects the Earth in many ways, some which we are still coming to understand. In accordance with National Geophysical Data Center (NGDC) forecasting the solar cycles 24 and 25 will be very weak: averaged sunspot numbers W-35 for the solar cycle 24 and for the solar cycle 25 less than W-35 , NGDC (2009). Total Solar Irradiance will equal -1365 [during solar cycle 25]. (23 cycle -1366). This actually will lead to a decrease of the temperature on 0.5 – 0.7°C in both averaged solar cycles, in Geneva will decrease to 1.5 °C. Temperature of air will be lower in the Northern Hemisphere. Precipitation rate in Caucasus will be more in average on 100-150 mm in dependence from location. The World Ocean level also will be lower, due to more snow and glacier accumulation on continents.
Kawakubo et al., 2017 Annual mean SSTs show interdecadal variations, notably cold intervals between 1670-1700 during the Maunder Minimum (MM) and between 1766-1788 characterized by a negative phase of the North Atlantic Oscillation (NAO). Cold summers in 1783 and 1784 coincide with the long-lasting Laki eruption that had a profound impact on the northern hemisphere climate, including the severe ‘Tenmei’ famine in Japan. The decades between 1855-1900 are significantly cooler than the first half of the 20th century, while those between 1700-1765, following the MM, are warmer than average. … Although the impact of the solar cycle on the global climate is small (Schurer et al., 2014), an amplified regional response to the variability in ultraviolet solar irradiance through atmospheric teleconnections is now widely accepted (e.g. Meehl et al., 2009). … Spring-summer climate south of Japan is mainly controlled by solar radiation and surface heat fluxes, with lesser ocean current influence on SST, with a few exceptions as mentioned above for the summers of 1998 and 2001. … The cold period between 1660-1700 in the coral record aligns with the minimum total solar irradiance that defines the Maunder Minimum (MM) ca. 1645-1715 (Steinhilber et al., 2009).
Sun et al., 2017 The contrast analysis between the periodic movement of the planetary system and the periodicity of solar activity shows that the two phenomena exhibit a period change rule of 179.5 years. Moreover, orderly orbits correspond to high periods of solar activity and disorderly orbits correspond to low periods of solar activity. … Therefore,a certain relationship exists between the movement of the planetary system, solar activity, and global climate change. The movement of the planetary system can thus be used to interpret the periodic trends of the movement of the Sun and global climate change. … A period change rule of a 179.5-year cycle is observed. This period change rule is consistent with the change that takes place once every 2 centuries (about 160 to 210 years) for solar activity and global climate change. … The Sun is headed into a grand minimum, that is, a period of unusually low solar activity. A relatively low number of or nonexistent sunspots are observed during the protracted solar minimum. Since 1000 AD, there have been six protracted solar minimums, namely, the Oort minimum (1040–1080 AD), Medieval Minor minimum (1150 1200 AD), Wolf minimum (1270–1350 AD), Spörer minimum (1430–1520 AD), Maunder minimum (1620–1710 AD), and Dalton minimum (1787–1843 AD). [A]ll the orbits of the planetary system are in disorder during the six protracted solar minimums. The planet juncture index and heliocentric longitude are also in disorder during the six protracted solar minimums. The numerical simulation results show a high number of sunspots and strong solar activity during the orderly orbit and a low number of sunspots, low solar activity, and the occurrence of a protracted solar minimum or little ice age during the disorderly orbit. … [T]he results indicate that the solar minimum and little ice ages correspond to the planetary system’s disorderly orbit.
Carlson , 2017 The Holocene includes six warm periods (including the current one) and five cool periods, some of which have been named. Named warm periods include Holocene Climate Optimum, first portion, 6200 to 7700 years before present (BP); Holocene Climate Optimum, second portion, 3500 to 4700 BP; Roman Climate-Optimum, 300 BC to 400 anno domini (AD); and Medieval Warm Period, 700 to 1300 AD. Named cool periods include Dark Age, 400 to 700 AD; and Little Ice Age, 1300 to 1850 AD. Another unnamed period is a cool period that was between 750 and 300 BC. The question to consider is how similar is each of the periods to the current Modern Warm Period in terms of temperature and concentrations of greenhouse gas and other measured properties as recorded in either ice cores, cave formations, or fossils. … It appears that the current warm period has statistically significant higher concentrations of greenhouse gases than earlier warm periods. However, the temperature data appear to be more equivocal.Overall, it appears that solar irradiance has had more of an effect on temperature than greenhouse gases.
Oliveira et al., 2017 [T]he millennial-scale vegetation changes in SW Iberia under warm interglacial climate conditions might be essentially generated by hydrological changes primarily induced by insolation [solar variability], as they are reproduced in the simulations despite the absence of ice sheet dynamics and all associated feedbacks in our experiments. … The transient simulations under the combined effect of insolation and CO2 indicate that the interglacial vegetation and climate dynamics over SW Iberia have no apparent relationship to atmospheric CO2 concentration, as suggested by the pollen-based reconstructions (Fig. 8a, b). Although the direct impact of CO2 changes on the vegetation growth is not included in the model, a prominent example for this negligible CO2 forcing is given by its relatively high concentrations over the end of the interglacials, in particular for MIS 1 and MIS 11c, while the forest cover, annual temperature and annual precipitation achieved minimum values (Fig. 8a, b). We find that the vegetation and climate changes at this time scale are mainly driven by astronomical forcing, in particular precession [solar variability], in agreement with the strong impact of precession on the climate of the Mediterranean region south of 40°N
Lüning et al., 2017 The Medieval Climate Anomaly (MCA) is a well-recognized climate perturbation in many parts of the world, with a core period of 1000-1200 AD. Here we present a palaeotemperature synthesis for the MCA in Africa and Arabia, based on 44 published localities. … Offshore cores from outside upwelling systems mostly show warm MCA conditions. The most likely key drivers of the observed medieval climate change are solar forcing and ocean cycles. Conspicuous cold spikes during the earliest and latest MCA may help to discriminate between solar (Oort Minimum) and ocean cycle (Atlantic Multidecadal Oscillation, AMO) influence.
Mörner, 2017 There is a total absence of data supporting the notion of a present sea level rise; on the contrary all available facts indicate present sea level stability. On the centennial timescale, there was a +70 cm high level in the 16th and 17th centuries, a -50 cm low in the 18th century and a stability (with some oscillations) in the 19th, 20th and early 21st centuries. This is almost identical to the sea level change documented in the Maldives, Bangladesh and Goa (India). … The Intergovernmental Panel on Climate Change has claimed that sea level is rising and that an additional acceleration is soon to be expected as a function of global warming. This proposition only works if the present warming would be a function of increased CO2 content in the atmosphere (a hypothesis termed AGW from Anthropogenic Global Warming). On a longer-term basis, it seems quite clear, however, that the dominant factor of global changes in temperature is changes in solar variability.
Ollila, 2017 In this paper, the author describes a semi empirical climate model (SECM) including the major forces which have impacts on the global warming namely Greenhouse Gases (GHG), the Total Solar Irradiance (TSI), the Astronomical Harmonic Resonances (AHR), and the Volcanic Eruptions (VE). The effects of GHGs have been calculated based on the spectral analysis methods. The GHG effects cannot alone explain the temperature changes starting from the Little Ice Age (LIA). The known TSI variations have a major role in explaining the warming before 1880. There are two warming periods since 1930 and the cycling AHR effects can explain these periods of 60 year intervals. The warming mechanisms of TSI and AHR include the cloudiness changes and these quantitative effects are based on empirical temperature changes. The AHR effects depend on the TSI, because their impact mechanisms are proposed to happen through cloudiness changes and TSI amplification mechanism happen in the same way. Two major volcanic eruptions, which can be detected in the global temperature data, are included. The author has reconstructed the global temperature data from 1630 to 2015 utilizing the published temperature estimates for the period 1600 – 1880, and for the period 1880 – 2015 he has used the two measurement based data sets of the 1970s together with two present data sets. The SECM [semi empirical climate model] explains the temperature changes from 1630 to 2015 with the standard error of 0.09°C, and the coefficient of determination r 2 being 0.90. The temperature increase according to SCEM [semi empirical climate model] from 1880 to 2015 is 0.76°C distributed between the Sun 0.35°C, the GHGs 0.28°C (CO2 0.22°C), and the AHR 0.13°C. [CO2 accounts for less than 1/3rd of 1880-2015 warming.] The AHR effects can explain the temperature pause of the 2000s. The scenarios of four different TSI trends from 2015 to 2100 show that the temperature decreases even if the TSI would remain at the present level. … The TSI variation is the major driving force of the temperature increase having the contribution of 71-73% during 19th and 20th centuries. Lean et al. (1995) have carried out the correlation analysis between the NH surface temperature and the reconstructed solar irradiation and they found that a solar induced warming was 0.51°C from the LIA in the 1990’s and the correlation was 0.86.
Kong et al., 2017 The general SST [sea surface temperatures] variation pattern matches well with total solar irradiance (TSI) changes. Relatively warm period between 800 and 1400 AD and cool period 1400-1850 AD could be identified, in agreement with the commonly defined periods of Medieval Warm Period and Little Ice Age. Within chronological uncertainty, notable short cooling events at 640-670 AD, 1030-1080 AD, 1260-1280 AD and 1420-1450 AD, coincide with large volcanic eruption events. The general coincidence of SST changes with TSI and volcanic eruption events suggests strong impact of external forcing on sea surface conditions in the studied area.
Dong et al., 2017 Our composite record shows that solar forcing dominated hydroclimatic changes regionally, including an intensified monsoon at the Holocene Optimum from the termination of Younger Dryas to 6.5 ka BP, and a subsequent multi-millennial weakening monsoon, that agrees with cave records in central and southern China.
Deng et al., 2017The results indicate that the climate of the Medieval Climate Anomaly (MCA, AD 900–1300) was similar to that of the Current Warm Period (CWP, AD 1850–present), which contradicts previous studies. … As for the Little Ice Age (LIA, AD 1550–1850), the results from this study, together with previous data from the Makassar Strait, indicate a cold and wet period compared with the CWP and the MCA in the western Pacific. The cold LIA period agrees with the timing of the Maunder sunspot minimum and is therefore associated with low solar activity.
Koutsodendris et al., 2017Thhttps://notrickszone.com/wp-content/uploads/2017/04/Holocene-Cooling-South-China-Sea-Deng-17-.jpge record represents the southernmost annually laminated (i.e., varved) archive from the Balkan Peninsula spanning the Little Ice Age, allowing insights into critical time intervals of climate instability such as during the Maunder and Dalton solar minima. … [W]et conditions in winter prevailed during 1740–1790 AD, whereas dry winters marked the periods 1790–1830 AD (Dalton Minimum) and 1830–1930 AD, the latter being sporadically interrupted by wet winters. This variability in precipitation can be explained by shifts in the large-scale atmospheric circulation patterns over the European continent that affected the Balkan Peninsula (e.g., North Atlantic Oscillation). … Representing one of the strongest global climate instabilities during the Holocene, the Little Ice Age (LIA) is marked by a multicentennial-long cooling (14the19th centuries AD) that preceded the recent ‘global warming’ of the 20th century. The cooling has been predominantly attributed to reduced solar activity and was particularly pronounced during the 1645-1715 AD and 1790-1830 AD solar minima, which are known as Maunder and Dalton Minima, respectively.
Tejedor et al., 2017 Reconstructed long-term temperature variations match reasonably well with solar irradiance changes since warm and cold phases correspond with high and low solar activity, respectively. … The main driver of the large-scale character of the warm and cold episodes may be changes in the solar activity. The beginning of the reconstruction starts with the end of the Spörer minimum. The Maunder minimum, from 1645 to 1715 (Luterbacher et al., 2001) seems to be consistent with a cold period from 1645 to 1706. In addition, the Dalton minimum from 1796 to 1830 is detected for the period 1810 to 1838. However, a considerably cold period from 1778 to 1798 is not in agreement with a decrease in the solar activity. Four warm periods – 1626–1637, 1800–1809, 1845– 1859, and 1986–2012 – have been identified to correspond to increased solar activity.
Zawiska et al., 2017The chironomid-based temperature reconstruction from Lake Atnsjøen in Eastern Norway with mean resolution of 30 years provided evidence that large-scale processes, such as the NAO fluctuations and solar activity modified local climate, and subsequently affected lakes functioning. The three minor cooling periods were reconstructed in the first half of the Millennium: 1050–1150, 1270–1370, 1440–1470 CE, that coincide with solar activity minima: Oort, Wulf, and Spörer respectively. Furthermore, a two peaked cooling period in the second half of the Millennium was identified that coincided with the LIA. These changes co-occurred with the prevailing negative NAO index. … The beginning of the 1270–1370 CE cooling coincide with Wulf solar activity minimum suggesting that the climate was responding to Sun activity. The climate cooling synchronous to this solar minimum had almost global range and it has been recorded from Europe, Arctic, North America and Antarctica (Osborn and Briffa, 2006; PAGES 2k Consortium, 2013) but again not in Greenland (Osborn and Briffa, 2006). … The beginning of the 1440–1470 CE cold period is synchronous to the pronounce negative NAO phase (Trouet et al., 2009). … Maunder solar minimum caused a very deep negative NAO index phase (Shindell et al., 2001), which consecutively lead to significant drop in the reconstructed temperature. … The temperature reconstruction from Lake Atnsjøen indicates that recent and ongoing climate warming began already in 1800 CE following the LIA. Temperatures increased very fast, from 8.5 to 12.8 °C during the first 75 years [1800-1875], but in the 20th century the increase became less pronounced. … The warming at the beginning of 19th century in the region of Lake Atnsjøen coincides with a reconstruction from Southern Finland (Luoto, 2013), and a record from Northern Sweden (Osborn and Briffa, 2006). Its onsetcorrelates with the positive NAO index and increased solar activity.
Rydval et al., 2017 [T]he recent summer-time warming in Scotland is likely not unique when compared to multi-decadal warm periods observed in the 1300s, 1500s, and 1730s … All six [Northern Hemisphere] records show a warmer interval in the period leading up to the 1950s, although it is less distinct in the CEU reconstruction. [E]xtreme cold (and warm) years observed in NCAIRN appear more related to internal forcing of the summer North Atlantic Oscillation. … There is reasonable agreement in general between the records regarding protracted cold periods which occur during the LIA and specifically around the Maunder solar minimum centred on the second half of the seventeenth century and to some extent also around the latter part of the fifteenth century coinciding with part of the Spörer minimum (Usoskin et al. 2007).
Abrantes et al., 2017Reconstructed cold conditions in Iberia, with an average 0.5 ºC colder SST in the northern sites and 1.2ºC in the southern sites, characterize most of the 15th to 18th centuries. The transition from warm to colder climatic conditions occurs around 1300 CE associated with the Wolf solar minimum. The coldest SSTs are detected between 1350 and 1850 CE, on Iberia during the well-known Little Ice Age (LIA) (Bradley and Jones, 1993), with the most intense cooling episodes related with other solar minima events, and major volcanic forcing and separated by intervals of relative warmth (e.g. (Crowley and Unterman, 2013; Solanki et al., 2004; Steinhilber et al., 2012; Turner et al., 2016; Usoskin et al., 2011). During the 20th century, the southern records show unusually large decadal scale SST oscillations in the context of the last 2 millennia, in particular after the mid 1970’s, within the Great Solar Maximum (1940 – 2000 (Usoskin et al., 2011)) and the “greater salinity anomaly” event in the northern Atlantic (Dickson et al., 1988), or yet the higher global temperatures of the last 1.4 ky detected by (Ahmed et al., 2013).
Cui e thal, 2017 According to Chinese history, the Ming dynasty (1368-1644) was subjected to intensive environmental and economic crises that accompanied the unfavorable climate of the Little Ice Age (LIA). This situation likely led to the collapse of the Ming dynasty. … During this period, central China experienced frequent periods of increased desertification and decreased biological productivity, which limited the expansion of the Ming domain northward and the dynasty’s control over western China. [G]enerally weak monsoons [occurred] from the 14th to the 19th centuries punctuated by four severe droughts during 1476-1502, 1509-1537, 1577-1590 and 1604-1653. These drought events are evident in all three time series, indicating that the climatic trends were regional rather than local. These dry periods are correlated with reduced summer insolation [solar minima] in the Northern Hemisphere, a southward displacement of the Intertropical Convergence Zone (ITCZ) and a weak EASM [East Asian Summer Monsoon].
Williams et al., 2017 Reconstructed SSTs significantly warmed 1.1 ± 0.30°C … from 1660s to 1800 (rate of change: 0.008 ± 0.002°C/year), followed by a significant cooling of 0.8 ± 0.04°C … until 1840 (rate of change: 0.02 ± 0.001°C/year), then a significant warming of 0.8 ± 0.16°C from 1860 until the end of reconstruction in 2007 (rate of change: 0.005 ± 0.001°C/year).” [Sea surface temperatures warmed faster from 1660s-1800 than they did from 1860-2007.] … In fact, the SST reconstruction significantly co-varied with a reconstruction of solar irradiance [Lean, 2000] on the 11-year periodicity only from ~1745 to 1825. In addition,the reconstructed SSTs were cool during the period of lower than usual solar irradiance called the Maunder minimum(1645–1715) but then warmed and cooled during the Dalton minimum (1795–1830), a second period of reduced solar irradiance. … The Dalton solar minimum and increased volcanic activity in the early 1800s could explain the decreasing SSTs from 1800 to 1850 … [T]hese data suggest a complex combination of solar irradiance, volcanic activity, internal ocean dynamics and external anthropogenic forcing explain the variability in Aleutian SSTs for the past 342 years.
Didkovsky et al., 2017Radiative forcing of the Earth’s atmosphere plays a significant role in its thermal and chemical balance (Haigh, 1994; Haigh et al., 2010). Effects of heating and cooling are influenced by long-term solar-cycle changes. One example of such change compiled from sources that show sensitivity to the changes of solar activity (Hoyt and Schatten, 1998) is the Maunder Minimum of 1645 to about 1715 (Maunder, 1890). These observations demonstrate the effects of solar-activity changes during the Maunder Minimum for which low to near-zero sunspot numbers persisted for about six solar cycles (SC) with a SC-averaged period (for SC 1 to 22) of 11 years (Hathaway, 2010).
Nan et al., 2017 Furthermore, our temperature records, within age uncertainty, coincides with the changes of the solar irradiance changes, suggesting a possible link between solar forcing and climate variability. … The relationship between the solar irradiance and climate change has been demonstrated by lots of studies (He et al., 2013; Kroonenberg et al., 2007; Sagawa et al., 2014; Soon et al., 2014). It was suggested that thesolar activity was a primary driving force of climatic variations in the Holocene(Bond et al., 2001; Wang et al., 2005). Small solar perturbations can be magnified by different feedback mechanisms and may ultimately lead to climatic oscillations on several time scales, such as annual to decadal and/or centennial scales, as well as millennial scales (Haigh, 1996; Bond et al., 2001).
Pandey and Dubey, 2017 The Maunderminimum (1645-1715) refers to a period when very few sunspots were observed. During this period, theEarth climate was cooler than normal. This period mimics the solar cycle climate change connections. The particles and electromagnetic radiations flowing from solar activity outbursts are important for long-term climate variations. There is an abrupt and drastic cooling in the climate can be possible in near future due to large scale melting of global ice by global warming, and prolonged sunspot minima. There is aclose correlation between variations in the 11-year sunspot cycle and Earth’s climate. Solar activity varies on shorter-time scales, including the 11- year sunspot cycle and longer-term as Milankovitch cycle.
Park, 2017Late Holocene climate change in coastal East Asia was likely driven by ENSO variation. Our tree pollen index of warmness (TPIW) shows important late Holocene cold events associated with low sunspot periods such as Oort, Wolf, Spörer, and Maunder Minimum. Comparisons among standard Z-scores of filtered TPIW, ΔTSI, and other paleoclimate records from central and northeastern China, off the coast of northern Japan, southern Philippines, and Peru all demonstrate significant relationships [between solar activity and climate]. This suggests that solar activity drove Holocene variations in both East Asian Monsoon (EAM) and El Niño Southern Oscillation (ENSO). In particular, the latter seems to have predominantly controlled the coastal climate of East Asia to the extent that the influence of precession was nearly muted during the late Holocene.
Chapanov et al., 2017DECADAL CYCLES OF EARTH ROTATION, MEAN SEA LEVEL AND CLIMATE, EXCITED BY SOLAR ACTIVITY … But recently, another mechanism of climate variations, due to cosmic rays was proposed (Kilifarska and Haight, 2005; Kilifarska, 2008, 2011; Velinov et al., 2005). According to the new models, thecosmic rays produce a ionization of the atmosphere, changes of atmosphere conductivity, lightning, and an increase of ozone concentration. The ozone plays significant role in climate variations, so the new models of cosmic ray influences on Earth atmosphere may explain the observed correlation between cosmic rays and climate variations. … The shape of solar cycles is rather different from sinusoidal form, so they affect geosystems by many short-term harmonics. A possible solar origin of decadal variations of Earth rotation, mean sea level and climate indices is investigated by the harmonics of Jose, de Vries and Suess cycles with centennial periods of 178.7, 208 and 231 years. The common decadal cycles of solar-terrestrial influences are investigated by long time series of Length of Day (LOD), Mean Sea Level (MSL) variations at Stockholm, ElNiño/Southern Oscillation (ENSO), temperature and precipitation over Eastern Europe, Total Solar Irradiance (TSI), Wolf’s Numbers Wn and North-South solar asymmetry. A good agreement exists between the decadal cycles of LOD [length of day], MSL [mean sea level], climate and solar indices whose periods are between 12-13, 14-16, 16-18 and 28-33 years. … The Total Solar Irradiance (TSI), Wolf’s Numbers (Wn) and North-South (N-S) solar asymmetry expose different spectral peaks, amplitude modulation and phases from these bands. These solar time series represent thermal heating over the Earth, solar wind (space weather) and solar magnetic field variations. The decadal cycles of N-S [North-South] solar asymmetry strongly affect corresponding cycles of El Nino/Southern Oscillation (ENSO).
Helama et al., 2017 (full) Solar proxy data (Steinhilber et al., 2009) consistently illustrate low activity between AD 400 and 700, with a notable seventh-century solar minimum, the millennial-scale solar changes culminating over these centuries and thus during the DACP [Dark Ages Cold Period] (Scafetta, 2012). Interestingly, there is multiple proxy evidence showing thatreduced solar activity may modulate the North Atlantic Oscillation (NAO) towards its negative phase(Gray et al., 2010). Since the NAO is a leading pattern of climate variability in the global atmosphere, and the negative NAO phase is generally associated with cooler temperaturesparticularly over western Europe and eastern North-America for both the winter (Wanner et al., 2001; Hurrell and Deser, 2010) and summer seasons (Folland et al., 2009), a prolonged negative NAO phase could thus result in cold temperatures at least over some parts of the Northern Hemisphere continents.
Yukimoto et al., 2017 A delayed response of the winter North Atlantic oscillation (NAO) to the 11-year solar cycle has been observed and modeled in recent studies. The result of this study supports a previous hypothesis that suggests that the 11-year solar cycle signals on the Earth’s surface are produced through a downward penetration of the changes in the stratospheric circulation. … The importance of the North Atlantic oscillation (NAO) for the European weather and climate conditions has been known for a long time (Walker and Bliss 1932; van Loon and Rogers 1978; Hurrell et al. 2003). NAO is the dominant intrinsic mode of atmospheric variability over the Atlantic sector (Hurrell and Deser 2009). … The present result confirms the previous hypothesis reported by Kodera et al. (2016), which stated that the major solar influence on the Earth’s surface can be produced through changes in stratospheric circulation, and the spatial structure of the solar signal at the Earth’s surface is largely conditioned by atmosphere’s interaction with the ocean.
Wang et al., 2017 The identification of causal effects is a fundamental problem in climate change research. Here, a new perspective on climate change causality is presented using the central England temperature (CET) dataset, the longest instrumental temperature record, and a combination of slow feature analysis and wavelet analysis.The driving forces of climate change were investigated and the results showed two independent degrees of freedom —a 3.36-year cycle and a 22.6-year cycle, which seem to be connected to the El Niño–Southern Oscillation cycle and the Hale sunspot cycle, respectively.
Gray et al., 2017There are several proposed mechanisms through which the 11-year solar cycle (SC) could influence the Earth’s climate, as summarised by Figure 1. These include: (a) the direct impact of solar irradiance variability on temperatures at the Earth’s surface, characterised by variation in the total incoming solar irradiance (TSI); (b) the indirect impact of variations through the absorption of Ultra-Violet (UV) radiation in the upper stratosphere associated with the presence of ozone, with accompanying dynamical responses that extend the impact to the Earth’s surface; (c) the indirect impact of variations in energetic particle fluxes into the thermosphere, mesosphere and upper stratosphere at high geomagnetic latitudes; and (d) the impact of variations in the generation of ions by galactic cosmic ray (GCR) penetration into the troposphere. Although different in their nature, these four pathways may not work in isolation but their influence could be synergetic.
Zharkova et al., 2017 “Using a summary curve of two eigen vectors of solar magnetic field oscillations derived with Principal Components Analysis (PCA) from synoptic maps for solar cycles 21-24 as a proxy of solar activity, we extrapolate this curve backwards three millennia revealing 9 grand cycles lasting 350-400 years each. The summary curve shows a remarkable resemblance to the past sunspot and terrestrial activity: grandminima – Maunder Minimum (1645-1715 AD), Wolf minimum (1280-1350 AD), Oort minimum (1010-1050 AD) and Homer minimum (800 900 BC);grand maxima – modern warm period (1990-2015), medieval warm period (900-1200 AD), Roman warm period (400-10 BC)and others. We verify the extrapolated activity curve by the pre-telescope observations of large sunspots with naked eye, by comparing the observed and simulated butterfly diagrams for Maunder Minimum (MM), by a maximum of the terrestrial temperature and extremely intense terrestrial auroras seen in the past grand cycle occurred in 14-16 centuries.”
We confirm the occurrence of upcoming Modern grand minimum in 2020-2053, which will have a shorter duration (3 cycles) and, thus, higher solar activity compared to MM [Maunder Minimum]. … One of the examples of fitting incorrectly the oscillating function with a linear regression approach is shown by Akasofu (2010) (see her Fig. 9), when explaining the modern era recovery of the Earth from the little ice period and the incorrect use of a linear part of the temperature variations for theextremely incorrect prediction of the terrestrial temperature growth in the next century.
Harde, 2017[A] naturally generated [CO2 emission] contributes more than 95% to the overall emission, and its generation rate and the respective absorption rate sensitively respond on global temperature variations. … [The] well known delayed response of CO2 and methane (CH4) to sea and air temperature changes (see, e.g., Petit et al. [2]; Monnin et al. [3]; Caillon et al. [4]; Torn and Harte [5]; Humlum et al. [6]; Salby [7]) are not considered in AR5. … As long as any natural variations in the CO2 concentrations are not accurately known, the ECS [equilibrium climate sensitivity to CO2 doubling] cannot be used as a reliable indicator only for an anthropogenic global warming. … The IPCC denies any noticeable solar influence on the actual climate, although strong evidence of an increasing solar activity over the last century exists (see, e.g., Hoyt & Schatten [8]; Willson & Mordvinov [9]; Shapiro et al. [10]; Ziskin & Shaviv [11]; Scafetta & Willson [12]; Usoskin et al. [13]; Zhao & Feng [14]; Soon et al. [15]). … From these studies we conclude that the measured temperature increase of 0.74∘ C over the time 1880–2000 and the observed cloud changes of −4% over the period 1983– 2000 can best be explained by a cloud feedback mechanism, which is dominated by the solar influence. Therefore, it seems quite reasonable to use a model mean of [climate sensitivity to doubled CO2] = 0.7°C, yielding a CO2 initiated warming of 0.3°C [1880-2000] and a solar contribution of 0.44°C [1880-2000].
Pande et al., 2017Ozone is a highly reactive, naturally occurring ingredient of the stratosphere that is produced from oxygen by sunlight. It is one of the most important chemicals in both the stratosphere and troposphere. Apart from absorbing the harmful ultaviolet radiation from the sun, it [ozone] also plays an important role in determining earth’s climate. Solar variability affects ozone through radiative heating in atmosphere. Solar UV radiation is absorbed by atmospheric ozone. It is responsible for both the creation and destruction of ozone. … The total ozone was found to be enhanced during magnetically disturbed conditions which are associated with peak solar activity periods. Angell and Korshover (1976) concluded that there is nearly in-phase relationship between sunspot number and total ozone.
Le Mouël et al., 2017[S]olar activity contains an important component that has undergone clear oscillations of ≈90 years over the past three centuries, with some small but systematic longer-term evolution of “instantaneous” period and amplitude. Half of the variance of solar activity on these time scales can be satisfactorily reproduced as the sum of a monotonous multi-secular increase, a ≈90 -year Gleissberg cycle, and a double-peaked (≈10.0 and 11.0 years) Schwabe cycle (the sum amounts to 46% of the total variance of the signal). The Gleissberg-cycle component definitely needs to be addressed when attempting to build dynamo models of solar activity. The first SSA component offers evidence of an increasing long-term trend in sunspot numbers, which is compatible with the existence of the modern grand maximum.
Wen et al., 2017A warmer and wetter climate prevailed since ∼4800 a BP and was interrupted by a sharp cold reversal at approximately 3300 a BP that was likely caused by solar irradiance forcing, which resulted in a global cold climatic change and glacier advance.
Munz et al., 2017 Decadal resolution record of Oman upwelling indicates solar forcing of the Indian summer monsoon (9–6 ka) … We use geochemical parameters, transfer functions of planktic foraminiferal assemblages and Mg / Ca palaeothermometry, and find evidence corroborating previous studies showing that upwelling intensity varies significantly in coherence with solar sunspot cycles. The dominant ∼ 80–90-year Gleissberg cycle apparently also affected bottom-water oxygen conditions.
Allan et al., 2017Speleothem is now regarded as valuable archive of climatic conditions on the continents, offering a number of advantages relative to other continental climate proxy recorders such as lake sediments and peat cores. … [T]race elements in speleothems have the potential to provide high resolution insights into palaeoclimatic variability during the Holocene. A deeper analysis reveals several periods of significant rapid climate change during the Holocene (at 10.7-9.2 ka, 8.2-7.9 ka, 7.2-6.2 ka, 4.8-4.5 ka, and 3-2.4 ka BP), which are similar to the cold events detected from different natural paleoclimate archivers. A comparison between the geochemical analysis of Père Noël speleothem and solar activity (sunspot number) reveals a significant correlation. Spectral analysis methods reveal common solar periodicities (Gleissberg cycle, de Vries cycle, unnamed 500 year, Eddy cycles, and Hallstatt cycle). The geochemical analyses have the potential to prove that PN speleothem is sensitive to changes in solar activity on centennial and millennial timescales during the Holocene.
Woodson et al., 2017The last ca. 1000 years recorded the warmest SST averaging 28.5°C. We record, for the first time in this region, a cool interval, ca. 1000 years in duration, centered on 5000 cal years BP concomitant with a wet period recorded in Borneo. The record also reflects a warm interval from ca. 1000 to 500 cal years BP that may represent the Medieval Climate Anomaly. Variations in the East Asian Monsoon (EAM) and solar activity are considered as potential drivers of SST trends. However, hydrology changes related to the El Nino-Southern Oscillation (ENSO) variability, ~ shifts of the Western Pacific Warm Pool and migration of the Intertropical Convergence Zone are more likely to have impacted our SST temporal trend. … The SA [solar activity] trends (Steinhilber et al., 2012) are in general agreement with the regional cooling of SST (Linsley et al., 2010) and the SA [solar activity] oscillations are roughly coincident with the major excursions in our SST data.
Li et al., 2017The main driving forces behind the Holocene climatic changes in the LYR [Lower Yangtze Region, East China] area are likely summer solar insolation associated with tropical or subtropical macro-scale climatic circulations such as the Intertropical Convergence Zone (ITCZ), Western Pacific Subtropical High (WPSH), andEl Niño/Southern Oscillation (ENSO).
Chen et al., 2017 The 11-year cycle suggests the influence of sunspot activity (Hale, 1924) on streamflow variations in the Tien Shan. The impact of variations in solar activity on streamflow series and other climate phenomena have been reported from North America and Europe, based on instrumental records (Zanchettin et al., 2008; Perry, 2006 ; Prokoph et al., 2012). A strong positive correlation was also found between solar activity and streamflow in South American rivers (Mauas et al., 2011). … To further investigate the links between the solar activity and streamflow of the Tien Shan, we examined the relationship between PC1 and the number of sunspots, using correlation and wavelet coherency analyses. A significant linkage was found at the quasi-11-year scale from the 1700–2000s.
Kuroda, 2017The Polar-night Jet Oscillation (PJO) is the dominant mode of stratospheric variability in the Southern Hemisphere (SH), and persists from mid-winter to spring. The influence of the 11-year solar cycle on modulation of the PJO from late winter to spring is examined using observations and three 42-year simulations from a chemistry-climate model. … We suggest that UV modulation of the interactions between planetary waves and zonal-mean flow in the stratosphere, rather than direct diabatic processes as suggested in a previous study, is the source of solar cycle modulation of the PJO.
Shi et al., 2017 Meanwhile, the stronger (weaker) EASM/ASM during the MCA (LIA) was associated with expansion (retreat) of the local Intertropical Convergence Zone and an enhanced (reduced) zonal temperature gradient over the equatorial Pacific. Our results imply that the synchronous change in the Asian–Australian monsoon may be caused by inherent solar variations, further strengthening previous findings.
Xiao et al., 2017Spectral analysis of Tsuga and evergreen oak pollen percentages shows statistically significant periodicities of ~1500 and ~200 years at the ≥95% confidence level, which suggests that insolation and feedback interactions on millennial to centennial scales are the primary forcing mechanisms of the southwest monsoon and past climatic change during the Holocene in northwestern Yunnan Province, southwestern China.
Chang et al., 2017 The chironomid-based record from Heihai Lake shows a summer temperature fluctuation within 2.4°C in the last c. 5000 years from the south-east margin of the QTP [Qinghai–Tibetan Plateau]. … The summer temperature changes in this region respond primarily to the variation in the Asian Summer Monsoon. The variability of solar activity is likely an important driver of summer temperatures, either directly or by modifying the strength and intensity of the Indian Ocean Summer Monsoon. … We observed a relatively long-lasting summer cooling episode (c. 0.8°C lower than the 5000-year average) between c. 270 cal. BP and AD c. 1956. … The record shows cooling episodes occurred at c. 3100, 2600, 2100 and 1600 cal. BP. This is likely related to the period defined as the Northern Hemisphere Little Ice Age (LIA; c. AD 1350–1850, equivalent to 600–100 cal. BP). These possibly relate to the 500-year quasi-periodic solar cycle. Cooling stages between c. 270 and 100 cal. BP were also recorded and these are possibly linked to the LIA suggesting a hemisphere-wide forcing mechanism for this event.
Lei et al., 2017The precipitation variability on decadal to multi-centurial generally always reflects changes in solar activity and large-scale circulation, e.g., the ENSO and the EASM [East Asian Summer Monsoon] (Chen et al., 2011; Vleeschouwer et al., 2012; Feng et al., 2014). [D]uring the MWP [Medieval Warm Period], the wetter climate in this region was consistent with more frequent ENSO events, stronger EASM and higher solar activity, whereas the opposite was found for the LIA. In particular, d13Cac fluctuations on multi-decadal to centennial scales is consistent with the changes in solar activity, with fewer dry intervals corresponding to periods of minimum solar activity within dating errors, which are referred to as the Oort Minimum (AD 1010-1050), Wolf Minimum (AD 1280-1340), Sporer Minimum (AD 1420-1530), Maunder Minimum (AD 1645-1715) and Dalton Minimum (AD 1795-1820). These results suggest that climate change in southeastern China is sensitive to ENSO and the EASM, which may be driven by solar activity.
Zhang et al., 2017 The record suggests the summer temperature varies by ~2.5 °C across the entire period. A generally warmer period occurred between c.8500 and c.6000 cal yr BP and a cooling trend was initiated from c.5500 cal yr BP. The overall pattern broadly matches the summer insolation at 30N and the Asian Summer Monsoon records from the surrounding regions suggesting that summer temperatures from the southeast margin of the QTP respond to insolation forcing and monsoon driven variability on a multi-millennial time scale. Modifications of this overall trend are observed on the finer temporal resolution and we suggest that solar activity could be an important mechanism driving the centennial-scale variability. It may have a strengthened effect in the late Holocene when the monsoon influence weakened.
Luoto and Nevalainen, 2017Here, we use completely synchronized paleolimnological proxy-based records of air temperature and effective precipitation from two Scandinavian lakes with ∼2000-year sediment profiles. We show that the relationship between air temperature and precipitation (T/P ratio) is synchronous in both study sites throughout the records suggesting warm and dry conditions at ∼300–1100 CE and cold and wet conditions at ∼1200–1900 CE. Owing to the significantly increased air temperatures, the most recent T/P ratio has again turned positive. During the first millennium of the Common Era, the T/P mimics patterns in Southern Oscillation index, whereas the second millennium shows response to the NAO index but is also concurrent with solar irradiance shifts. [T]he causes for the LIA [Little Ice Age[1200-1900 CE], are not well defined owing to its highly variable nature (Wanner et al. 2011; Luoto and Nevalainen 2016; Zawiska et al. 2017). Yet, in addition to a persistent strongly negative NAO index phase during the LIA, it was most likely forced by decreased solar irradiance (including Spörer, Maunder and Dalton solar minima), increased volcanic activity (aerosols), and changes in Atlantic Ocean circulation patterns (Grove 2001; Goosse et al. 2005; Wanner et al. 2011).
Li et al., 2017 Correlations between paleotemperature records from the North Atlantic and solar activity suggest that changes in solar output may cause significant shifts in the climate of the North Atlantic region. To test the role of solar activity on summer SST at our study site in West Greenland, we conducted a cross-correlation analysis between our reconstructed summer SST record and a total solar irradiance (TSI) series. The results indicate that the maximum correlation coefficient (0.284) of summer SST [sea surface temperatures] and TSI [total solar irradiance] records is obtained at nearly zero time-lag (-6 time-lag), which means that variations in solar activity affected the summer SST variability in the study area. … A significant positive relationship between summer SSTs on the North Icelandic shelf and solar irradiance reconstructed from 10Be and 14C records during the Holocene was also demonstrated by Jiang et al. This finding is also supported by recent climate model simulations using the Community Climate System Model version 4 (CCSM4). The model results show a strong positive correlation between SST and solar irradiance in the pathway of the IC, indicating that a reduced frequency of Atlantic blocking events during periods of high solar irradiance promotes warmer and saltier conditions in the pathway of the IC due to stronger circulation of the subpolar gyre. … Spectral analyses indicate that significant centennial-scale variations are superimposed on the long-term orbital trend. The dominant periodicities are 529, 410, and 191 years, which may be linked to the well-known 512- and 206-year solar cycles. Cross-correlation analyses between the summer SSTs and total solar irradiance through the last 5000 years indicate that the records are in phase, providing evidence that variations in solar activity impacted regional summer SST variability. Overall, the strong linkage between solar variability and summer SSTs is not only of regional significance, but is also consistent over the entire North Atlantic region.
Orme et al., 2017The north-south index shows that storm tracks moved from a southern position to higher latitudes over the past 4000 yr, likely driven by a change from meridional to zonal atmospheric circulation, associated with a negative to positive North Atlantic Oscillation shift. We suggest that gradual polar cooling (caused by decreasing solar insolation in summer and amplified by sea-ice feedbacks) and mid-latitude warming (caused by increasing winter insolation)drove a steepening of the winter latitudinal temperature gradient through the late Holocene, resulting in the observed change to a more northern winter storm track.
Serykh and Sonechkin, 2017 The global climate is a quasi-periodically forced dynamic system [1, 2]. In addition to the annual cycle of the heat transport from the Sun and the diurnal cycle of the Earth’s rotation, other external periodical forces exist, which are potentially able to cause climate fluctuations. The lunar and solar tides are such causes on the time scales of the order of one day. On the decadal scale, these causes are 11-year variations in the Sun spots (the Wolf cycle) and its double period manifested in the changes in the heliospheric field polarity (the Hale cycle). The existence of secular solar cycles is also possible (Gleissberg and Suess cycles found in a number of Sun spots). Calculations indicate that an approximately 180-year cycle exists in the rotation of the Sun around the center of mass of the Solar system. The authors of [3] suggest that it is related to the sequence of significant decreases in the solar activity in the last millennium known as the Oort, Wolf, Spörer, Maunder, and Dalton periods. Paleoclimatic evidence of climate cooling during these periods exists. We can conclude on this basis that the ONI [ENSO index] dynamics [are] governed predominantly by two periodical external forces (the annual heat transport to the climatic system from the Sun and the Chandler wobble of the Earth’s poles) and that the system is not chaotic. This fact indicates that a principal possibility exists for long-term (many years in advance) ENSO forecasts.
Kitaba et al., 2017The weakening of the geomagnetic field causes an increase in galactic cosmic ray (GCR) flux. Some researchers argue that enhanced GCR flux might lead to a climatic cooling by increasing low cloud formation, which enhances albedo (umbrella effect). Recent studies have reported geological evidence for a link between weakened geomagnetic field and climatic cooling. … Greater terrestrial cooling indicates that a reduction of insolation [solar radiation reaching the surface] is playing a key role in the link between the weakening of the geomagnetic field and climatic cooling. The most likely candidate for the mechanism seems to be the increased albedo of the umbrella effect.
Allan et al., 2017 The occurrence of significant solar periodicities (i.e., cycles of Gleissberg, de Vries, unnamed 500 years, Eddy and Hallstat) supports for an impact of solar forcing on PN speleothem trace elements contents. Moreover, several intervals of significant rapid climate change were detected during the Holocene at 10.3, 9.3-9.5, around 8.2, 6.4-6.2, 4.7-4.5, and around 2.7 ka BP. Those intervals are similar to the cold events evidenced in different natural paleoclimate archivers, suggesting common climate forcing mechanisms related to changes in solar irradiance.
Ramos-Román et al., 2017In turn, thisrecord shows centennial-scale climate oscillations in temperature that correlate with well-known climatic events during the Late Holocene in the western Mediterranean region,synchronous with variability in solar and atmospheric dynamics. … Enhanced arid conditions, co-occurring with overall positive NAO conditions and increasing solar activity, are observed between ~ 1550 to ~ 450 cal yr BP (~ 400 to ~ 1400 CE) and colder and warmer conditions happened during the Dark Ages and Medieval Climate Anomaly, respectively. Slightly wetter conditions took place during the end of the MCA and the first part of the Little Ice Age, which could be related to a change towards negative NAO conditions and minima in solar activity.
Lüdecke and Weiss, 2017The Sun as climate driver is repeatedly discussed in the literature but proofs are often weak. In order to elucidate the solar influence, we have used a large number of temperature proxies worldwide to construct a global temperature mean G7 over the last 2000 years. The Fourier spectrum of G7 shows the strongest components as ~1000-, ~460-, and ~190 – year periods whereas other cycles of the individual proxies are considerably weaker. The G7 temperature extrema coincide with the Roman, medieval, and present optima as well as the well-known minimum of AD 1450 during the Little Ice Age. We have constructed by reverse Fourier transform a representation of G7 using only these three sine functions, which shows a remarkable Pearson correlation of 0.84 with the 31-year running average of G7 [global temperature over the last 2000 years]. The three cycles are also found dominant in the production rates of the solar-induced cosmogenic nuclides 14C and 10Be, most strongly in the ~190 – year period being known as the De Vries/Suess cycle. By wavelet analysis, a new proof has been provided that at least the ~190-year climate cycle has a solar origin. … G7 [global temperature over the last 2000 years], and likewise the sine representations have maxima of comparable size at AD 0, 1000, and 2000. We note that the temperature increase of the late 19th and 20th century is represented by the harmonic temperature representation, and thus is of pure multiperiodic nature [it is of natural solar origin]. It can be expected that the periodicity of G7, lasting 2000 years so far, will persist also for the foreseeable future. It predicts a temperature drop from present to AD 2050, a slight rise from 2050 to 2130, and a further drop from AD 2130 to 2200, upper panel, green and red curves).
Warrier et al., 2017Climatic periodicities recorded in lake sediment magnetic susceptibility data: Further evidence for solar forcing on Indian summer monsoon … The results obtained from this study show thatsolar variations are the main controlling factor of the southwest monsoon and, like other archives from different regions in India, the TK [Thimmannanayakanakere –a small lake in southern India] sediments have also recorded these solar signatures.
Malik et al., 2017We find robust statistical evidence that Atlantic multi-decadal oscillation (AMO) has intrinsic positive correlation with solar activity in all datasets employed. The strength of the relationship between AMO and solar activity is modulated by volcanic eruptions and complex interaction among modes of ocean variability. The observational dataset reveals that El Niño southern oscillation (ENSO) has statistically significant negative intrinsic correlation with solar activity on decadal to multi-decadal timescales (16–27-year)
Yukimoto et al., 2017 For the Pacific internal mode (Pacific Decadal Oscillation), the power is largest for the longer periods of the 15−25 year band (Minobe 1999). As the NAO has some power near the 11-year cycle, resonance may take place more easily. In fact, the numerical simulation of Thiéblemont et al. (2015) suggested a phase locking of the NAO with the 11-year solar cycle. The present result confirms the previous hypothesis reported by Kodera et al. (2016), which stated that the major solar influence on the Earth’s surface can be produced through changes in stratospheric circulation, and the spatial structure of the solar signal at the Earth’s surface is largely conditioned by atmosphere’s interaction with the ocean.
Ge et al., 2017 This paper presents new high-resolution proxies and paleoclimatic reconstructions for studying climate changes in China for the past 2000 years. Multi-proxy synthesized reconstructions show that temperature variation in China has exhibited significant 50–70-yr, 100–120-yr, and 200–250-yr cycles. Results also show that the amplitudes of decadal and centennial temperature variation were 1.3°C and 0.7°C, respectively, with the latter significantly correlated with long-term changes in solar radiation, especially cold periods, which correspond approximately to sunspot minima. The most rapid warming in China occurred over AD 1870–2000, at a rate of 0.56◦ ± 0.42◦C (100 yr)−1; however, temperatures recorded in the 20th century may not be unprecedented for the last 2000 years, as data show records for the periods AD 981–1100 and AD 1201–70 are comparable to the present.
Usoskin, 2017Another aspect is the link between solar-activity variations and the Earth’s climate … [I]t should be noted that the modern epoch was characterized, until the earlier 2000s by high solar activity dominated by an 11-year cyclicity … contrary to some predictions, a Grand minimum of activity has not started. Thus, we may experience, in the near future, the interplanetary conditions quite different with respect to those we got used to during the last decades. … The longest direct series of solar activity is the 400-year-long sunspot-number series, which depicts the dramatic contrast between the (almost spotless) Maunder minimum andthe modern period of very high activity.
Lu et al., 2017 Ozone absorption of solar radiation in the ultraviolet (UV) band is known to affect upper atmospheric chemistry and temperature, and thus its circulation via photochemical, radiative and dynamical interactions (Brasseur and Solomon 2005). The enhanced UV forcing during high solar (HS hereafter) activity years leads to a 2-4% increase of annual mean stratospheric ozone and ~1 K increase of annual mean temperaturein the equatorial upper stratosphere and lower mesosphere (e.g. Haigh 1994; Scaife et al. 2000; Hood 2004; Frame and Gray 2010; Chiodo et al. 2012; Hood and Soukharev 2012; Remsberg 2014; Mitchell et al. 2014, Hood et al. 2015). … Studies show that a regional circulation pattern in the Northern Hemispheric (NH) winter that resembles the positive phase of the North Atlantic Oscillation (NAO) occur during HS [high solar activity] winters (e.g. Ruzmaikin and Feynman 2002; Kodera 2002; Woollings et al. 2010a; Lockwood et al. 2010; Ineson et al. 2011; Gray et al. 2013; 2016). A number of different mechanisms have been proposed to explain the solar-NAO connection. A ‘top-down’ mechanism, first proposed by Hines (1974) and later developed by Kodera (1995), is often invoked to account for the downward transfer of a solar UV signal from the upper stratosphere (e.g. Kodera and Kuroda 2002; Matthes et al. 2004; 2006; Ineson et al. 2011; Thiéblemont et al. 2016).
Ogurtsov et al., 2017It is widely accepted also that this global warming is caused primarily by anthropogenic increase of greenhouse gases concentration . However debates on this question still continues. Some experts maintain that current warming does not exceed the natural fluctuations of climate. Evidence of appreciable contribution to global warming of non-greenhouse factors has been obtained by many authors. Soon et al., 2015 noted that if the urbanization effect is properly taken into account, one can conclude that solar variability is the dominant factor of Northern Hemisphere long-term temperature changes since at least 1881. Zhao and Feng, 2014 reported that variations in solar activity play an important role in changes of climate over global scaleduring the last more than 100 years. According to Harde (2014), the Sun is the main contributor to global warming of the last century. … [I]t is reasonable to regard the global warming as a phenomenon exceptional from the point of view of intrinsic climatic oscillations, which need an additional external forcing factor for explanation. On the other hand, the statistical experiments showed that an appreciable part of the global warming might be a result of natural fluctuations of climatic system. … [O]ur results show that the contribution of these external factors (including greenhouse effect) to the global warming could be less than is often believed. … Changes in the solar radiation at the Earth’s surface (global brightening) might be important source of the warming of the last decades(Ogurtsov et al., 2012).
Arppe et al., 2017 These negative shifts overlap with the latter part of a cooling known as the Dark Ages Cold Period (DACP, ca. 1500–1000 cal. yr BP; Bianchi and McCave, 1999; McDermott et al., 2001). Theevent is directly preceded by a minimum in total solar irradiation (Renssen et al., 2006; Steinhilber et al., 2009) … A wealth of proxy evidence testifies to the LIA [Little Ice Age] cooling, thought to have been triggered by reduced solar irradiance, extended volcanism, and internal characteristics of the ocean–atmosphere system (Miller et al., 2010, 2012; Wanner et al., 2011). … Factoring in respective age-model uncertainties, it appears that all major negative shifts, that is, ‘cold’ periods, in the δ18Olw record are roughly synchronous with periods of major negative anomalies in total solar irradiation and high modeled probabilities for extremely cold years in the Nordic Seas (Renssen et al., 2006), and widespread evidence of North Atlantic ‘cold spells’ (Bond et al., 2001; Sarnthein et al., 2003; Solomina et al., 2015; Wanner et al., 2008) linked to solar forcing.
Wang et al., 2017The driving forces of climate change were investigated and the results showed two independent degrees of freedom —a 3.36-year cycle and a 22.6-year cycle, which seem to be connected to the El Niño–Southern Oscillation cycle and the Hale sunspot cycle, respectively. … Solar variability has been shown to be a major driver of climate in central Europe during the past two millennia using Δ14C records. Furthermore, this result is essentially in good agreement with the findings of Scafetta (2007, 2012, 2016), who found that the climate system was mostly characterized by a specific set of oscillations and these oscillations (61, 115, 130 and 983 years) appeared to be synchronous with major astronomical oscillations (solar system, solar activity and long solar/lunar tidal cycles).
Huo and Xiao, 2017 This paper uses the sunspot number (SSN) index and the El Niño modoki index (EMI) to examine the possible modulation of El Niño Modoki events by variations in solar activity. A significant positive correlation was found between SSN and EMI with a lag of two years, and both SSN and EMI have an obvious period of about 11–12 years. … Two possible mechanisms are proposed, one is the direct mechanism that the solar radiation warms up the tropical pacific with a geographical difference, due to the cloud distribution. The warming response in the central Pacific is amplified by the coupled positive feedback between the ocean and atmosphere with 1–2 years lag. Another possible way can be described as follows: the solar heating effect propagating from the upper atmosphere modulates the strength and variation of atmospheric anomaly at high and mid-latitudes in the northern hemisphere winter, which results in an anomalous subtropical cyclone over the northeastern Pacific in the winter seasons following the solar peak years. The anomalous cyclone reduces the cloud cover over the northeastern Pacific and enhances the local input of solar radiation. As a result, a positive sea surface temperature (SST) anomaly occurs over the northeastern Pacific and extends towards the central tropical Pacific along the path of anomalous southwesterly winds, which may trigger an El Niño Modoki event in the following years.
Li et al., 2017Studies on Sun-climate connection have been carried out for several decades, and almost all of them focused on the effects of solar total irradiation energy. As the second major terrestrial energy source from outer space, the solar wind energy flux exhibits more significant long-term variations. … Here we investigate the possible modulation of the total energy flux input from the solar wind into the Earth’s magnetosphere on the global tropical cyclone activity during 1963–2012. From a global perspective, the accumulated cyclone energy increases gradually since 1963 and start to decrease after 1994. Compare to the previously frequently used parameters, e,g., the sunspot number, the total solar irradiation, the solar F10.7 irradiation, the tropical sea surface temperature, and the south oscillation index, the total solar wind energy flux input exhibits a better correlation with the global tropical cyclone activity. Furthermore, the tropical cyclones seem to be more intense with higher geomagnetic activities. A plausible modulation mechanism is thus proposed to link the terrestrial weather phenomenon to the seemly-unrelated solar wind energy input.
Ning et al., 2017 Our findings suggest that changes in solar activity may have primarily controlled the fluctuations of ISM [Indian Summer Monsoon] intensity on the multi-decadal to centennial time-scale. Cooling of the North Atlantic climate and the interactions between tropical-ocean and atmosphere may have amplified the solar signal.
Schwander et al., 2017Weather types and reanalysis data show that the 11-year solar cycle influences the late winter atmospheric circulation over central Europe with colder (warmer) conditions under low (high) solar activity.
Bauchi Danladi and Akçer-Ön, 2017 Periods of higher lake levels are consistent with solar maxima in total solar irradiance and vice versa. Moreover, the Lake Salda records clearly show dry Dark Ages Cold Period (DACP), humid Medieval Climatic Anomaly (MCA), dry Little Ice Age (LIA), and humid Modern Warm Period (MoWP). These records suggest that the solar forcing, through its influence on the atmospheric circulation, is the main mechanism of climate change during theDACP [Dark Ages Cold Period], MCA [Medieval Climate Anomaly], LIA [Little Ice Age] and MoWP [Modern Warm Period] in this region. … The dry periods, within age uncertainties, correlates well with high authigenic carbonate precipitation (Ca, cps) which correspond to time-intervals with lower lake water levels and low solar activity such as Grand Minimum, Oort Minimum, Wolf Minimum, Sporer Minimum, Maunder Minimum, and Dalton Minimum. On the other hand, the wet periods in Lake Salda correspond to higher lake water levels, and high solar activity such as Medieval Maximum and Modern Maximum. … The climate records of Lake Salda over the last 1400 years are closely linked to the solar activity, possibly through its influence on atmospheric circulations.
Ön et al., 2017[T]he abrupt decline in both precipitation and temperature around 3.5 ka, 2.8 ka and 1.8 ka BP, which were also documented in the seismic records (Eris¸ et al., submitted), may have been the result of a coincidence of the strengthening of the Siberian high pressure system during winters (Rohling et al., 2002; Çagatay et al., 2014), and the gradual decrease in solar irradiance, especially around 2.8 ka BP (Roth and Joos, 2013), in accordance with changes in the North Atlantic (Bond et al., 2001). For the Holocene, the most striking result is that the spikes in precipitation and temperature records appear to closely follow the North Atlantic Bond events, whereas the trends do not. If the cause of the Bond events is indeed solar forcing, as claimed by Bond et al. (2001), thenwe can also state that the climate oscillations in the region were also greatly influenced by solar forcing.
Shekhar et al., 2017 [T]he Hindu Kush-Himalaya (HKH) harbors ~50% (by area) of all the glaciers outside of the polar regions. … Our research is the maiden attempt to reconstruct the longest regional scale glacier mass balance records for the Western Himalaya based on tree-ring sampling at an unprecedented scale. Another highlight of our study is that it presents valid evidence of the significant mass loss experienced by the Himalayan glaciers even during the LIA [1500-1850]. … [W]e believe that the episodes of significantly negative mass balances … were the result of an enhanced El Niño affecting the ISM [Indian Summer Monsoon] and increasing the temperatures … [and] a more direct relationship between the high TSI and more negative mass balances during the LIA in the years with potentially weaker El Niño … In the case of the Himalaya, the […] phase of rising regional temperatures, and the start of the strong solar cycles that in later years (since the 1970s), started showing substantial coupling with strong El Niño episodes. … [M]ass balance periodicities of 9–12 years during ~1970–1990 [are] a representation of the response to a few of the strongest consecutive solar cycles in past 400 years. In fact, we see that ~50% of the years since 1970 experienced an exceptionally high TSI of >1361 W m−2, ~40% of which also underwent warm phases of ENSO. … Although, the study acknowledges the contributions of anthropogenic drivers of climate change in the Himalayan region, it also highlights a strong effect from the increased yearly concurrence of extremely high TSI with El Niño in the past five decades, resulting in severe glacial mass loss. … Although external anthropogenic forcing can partly control the glacial regime in the Himalaya, the natural climate variability still emerges as the key deciding element governing the Himalayan glacier mass balances. Similar to several other studies for the region, our study also identifies ENSO, NAO, and AMO as the primary drivers of the regional mass balance variability. The fact that the past few decades have experienced intensified episodes of NAO, closely correlating with rising temperature, also suggestsa robust natural climatic control over the Himalayan glaciers.
Ogurtsov et al., 2017Significant correlation was found between SST [sea surface temperatures] in NA [the North Atlantic] and solar activity (both instrumental data and proxies) during AD 1716–1986. … Thus, the connection between Northern Fennoscandian climate and solar activity, which has been previously established at century-scale (Ogurtsov et al., 2001, 2002, 2013) and millennial-scale (Helama et al., 2010), is confirmed for AD 1716–1986 over the entire frequency range using unfiltered records (with the exception for AMO reconstruction after Mann et al. (2009)). … Changes in solar ultra-violet (UV) radiation might provide a solar-climatic link over Northern Europe. Actually, modeling work by (Ineson et al., 2011) showed that that solar UV (200-320 nm) decadal variability drives appreciable temperature changes in mesosphere and upper stratosphere largely through absorption of UV by ozone. This variation results in a corresponding change in the pattern of stratospheric winds, which propagates downwards and appreciably influences atmospheric circulation over the North Atlantic basin. Studies using an atmosphere–ocean coupled climate model have shown thatsolar-induced changes in atmospheric circulation also influence changes of heat storage in North Atlantic Ocean that can integrate and amplify solar effect(Ineson et al., 2011; Scaife et al., 2013).
Perșoiu et al., 2017Throughout the Holocene, the subterranean ice block in Scărișoara Ice Cave responded sensitively to changes in both winter temperature and moisture source. During this time period, winter temperature in ECE [East Central Europe] was mainly controlled by insolation [solar radiation] changes. The interplay between insolation variability, SST changes in the North Atlantic, and the influence of the lingering Laurentide Ice Sheet modulated the dynamics of large-scale atmospheric circulation.
Luthardt and RößlerThe 11 yr solar cycle, also known as Schwabe cycle, represents the smallest-scaled solar cyclicity and is traced back to sunspot activity (Douglass, 1928; Lean, 2000), which has a measurable effect on the Earth’s climate, as indicated by the Maunder minimum (Usoskin et al., 2015). Global climate feedback reactions to solar irradiance variations caused by sunspots are complex and hypothesized to be triggered by (1) variation in total energy input (Cubasch and Voss, 2000), (2) the influence of ultraviolet light intensity variation on composition of the stratosphere (Lean and Rind, 2001), (3) the effect of cosmic rays on cloud formation (Marsh and Svensmark, 2000; Sun and Bradley, 2002), and/or (4) the effect of high-energy particles on the strato- and mesosphere (Jackman et al., 2005). … [L]ike today, sunspot activity caused fluctuations of cosmic radiation input to the atmosphere, affecting cloud formation and annual rates of precipitation
Cosentino et al., 2017 A review of the literature indicates that the climate was significantly less stable than previously supposed during the Holocene, since its warming trend was characterized by relevant short-term cooling events occurring at decennial and centennial scale (Dansgaard et al., 1993; Bond et al., 1999; Mayewski et al., 2004). The most recent cold phase was the Little Ice Age (LIA), which caused the expansion of glaciers in the alpine regions at lower latitudes. Several authors have linked this cooler climatic condition to a period of reduced solar activity (Mauquoy et al., 2002), which caused a decrease in summer insolation (Wanner et al., 2011). … [T]he cooling event known as Little Ice Age (LIA)… persisted more or less from the 13th to the 19th century (Perry and Hsu, 2000). … Furthermore, the fluctuations occurring in the frequency curve of H. balthica could be related to several brief cooling events which characterize the LIA, namely Wolf, Sporer, Maunder and Dalton [solar minimum periods] (Lamb, 1984; Mauquoy et al., 2002).
Huo and Xiao, 2017 In this paper, the authors investigate a particular feature, the ocean heat content (OHC) anomaly, in different phases of the total solar irradiance (TSI) cycle. The results show that almost opposite spatial patterns appear in the tropical Pacific during the ascending and declining phases of the TSI cycle. Further analysis reveals the presence of the quasi-decadal (~11-year) solar signal in the SST [sea surface temperature], OHC [ocean heat content] and surface zonal wind anomaly field over the tropical Pacific with a high level of statistical confidence (>95%). … In Misios and Schmidt (2012), the ensemble simulations from an AOGCM showed that the tropical SST oscillates almost in-phase with the 11-year solar cycle. White and Liu (2008) also found the fluctuation of the upper ocean warming to be in-phase with TSI on the decadal scale during the twentieth century, governed by a resonant excitation of the tropical delay action oscillator and solar forcing, and the warming stage lagged the solar peak year by one to three years. … [P]atterns of OHC and potential temperature anomalies in the tropical Pacific are quite spatially symmetric in the ascending and declining phases, which seems phase-locked with the phases of the TSI cycle. The most significant regions of the OHC anomaly are locate just in the high correlation areas (beyond the 95% confidence level), which are ‘solar-sensitive’ regions with a clear quasi-11-year period.
Stein et al., 2017 The causes that are controlling the decrease in sea ice are still under discussion. In several studies changes in extent, thickness and drift of Arctic sea ice are related to changes in the overall atmospheric circulation patterns as reflected in the North Atlantic Oscillation (NAO) and Arctic Oscillation (AO). The NAO and AO are influencing changes of the relative position and strength of the two major surface-current systems of the Arctic Ocean. … The increase in sea ice extent during the late Holocene seems to be a circum-Arctic phenomenon, coinciding with major glacier advances on Franz Josef Land, Spitsbergen and Scandinavia. The increase in sea ice may have resulted from the continuing cooling trend due to decreased solar insolation and reduced heat flow from the Pacific. … The increase in sea ice extent during the late Holocene seems to be a circum-Arctic phenomenon as PIP25-based sea ice records from the Fram Strait, Laptev Sea, East Siberian Sea and Chukchi Sea display a generally quite similar evolution, all coinciding with the decrease in solar radiation … The main factors controlling the millennial variability in sea ice and surface-water productivity are probably changes in surface water and heat flow from the Pacific into the Arctic Ocean as well as the long-term decrease in summer insolation, whereas short-term centennial variability observed in the high-resolution middle Holocene record was possibly triggered by solar forcing.
Schmutz, 2017For the first time, model calculations show a plausible way that fluctuations in solar activity could have a tangible impact on the climate. Studies funded by the Swiss National Science Foundation expect human-induced global warming to tail off slightly over the next few decades. A weaker sun could reduce temperatures by half a degree.
Yamamoto et al., 2017 Millennial to multi-centennial variability in the quartz / feldspar ratio (the BG [Beaufort Gyre] circulation) is consistent with fluctuations in solar irradiance, suggesting that solar activity affected the BG [Beaufort Gyre] strength on these timescales. … The intensified BSI [Bering Strait in-flow] was associated with decrease in sea-ice concentrations and increase in marine production, as indicated by biomarker concentrations, suggesting a major influence of the BSI on sea-ice and biological conditions in the Chukchi Sea. Multi-century to millennial fluctuations, presumably controlled by solar activity, were also identified in a proxy-based BSI record characterized by the highest age resolution. … Proxy records consistent with solar forcing were reported from a number of paleoclimatic archives, such as Chinese stalagmites (Hu et al., 2008), Yukon lake sediments (Anderson et al., 2005), and ice cores (Fisher et al., 2008), as well as marine sediments in the northwestern Pacific (Sagawa et al., 2014) and the Chukchi Sea (Stein et al., 2017).
Rimbu et al., 2017 The River Ammer discharge during summer shows no significant linear trend from 1926 to 2015. The frequency of flood days >125m3 /s discharge shows pronounced decadal variations within the period 1926-2015. … Previous studies (Wirth et al., 2013; Glur et al., 2015; Czymzik et al., 2016) have identified connections between solar activity changes and flood variability in the Alpine realm and, in particular, the Ammer region. A higher frequency of floods in the Alpine region is associated with reduced solar activity as well as with colder conditions. … Flood days are relatively frequent during the periods 1950-1980 and 2000-2015 [reduced solar activity], but less frequent from 1980 to 2000. [enhanced solar activity]… [T]here is a clear increase in blocking frequency over northeastern Europe during summers with reduced solar activity … Analysis of Holocene flood reconstructions in the European Alps (Wirth et al., 2013) reveals a rich spectrum of periodicities at multidecadal (87yr), centennial (104, 150, 208, 350, 500 and 265 710yr) and millennial (900-1200 and 2500-3000yr) time scales. Similar periodicities characterize solar activity reconstructions (e.g. Stuiver and Braziunas, 1989). It was shown that flood frequency in the Alpine region was higher during cool periods in the Alpine region, coinciding with lows in solar activity (Wirth et al., 2013). … One modeled Sun-climate connection is the so-called solar top-down mechanism (Haigh, 1996; Gray et al., 2010; Ineson et al., 2011). Thereby, during periods of reduced solar activity, comparably large reductions in solar UV emissions are expected to induce reduced meridional pressure gradients favoring atmospheric blocking and meridional airflow, consistent with our results (e.g. Haigh, 1996; Ineson et al., 280 2011). Therefore, this mechanism might have also caused the detected changes in flood frequency in the Ammer region.
Sha et al., 2017 The reconstruction indicates warm conditions with reduced sea-ice cover, associated with the HoloceneThermal Maximum, from ca. 6700 to 5000 cal. yr BP. … A distinct increase in sea-ice cover began at 1750 cal. yr BP, with absolute maximum values during the last millennium. … In order to assess the contribution of different potential forcing factors to sea-ice conditions off West Greenland, we evaluated the relationship between our sea-ice reconstruction and solar activity, as well as with the strength of ocean circulation. The observed agreement between the sea-ice record and solar activity suggests that solar forcing may have been an important trigger for sea-ice variability off West Greenland during the last 5000 yr.
Huang et al., 2017 (full paper)Various scientific studies have investigated the causal link between solar activity (SS) and the earth’s temperature (GT). [T]he corresponding CCM [Convergent Cross Mapping] results indicate increasing significance of causal effect from SS [solar activity] to GT [global temperature] since 1880 to recent years, which provide solid evidences that may contribute on explaining the escalating global tendency of warming up recent decades. … The connection between solar activity and global warming has been well established in the scientific literature. For example, see references [1–10]. … Among which, the SSA [Singular Spectrum Analysis] trend extraction is identified as the most reliable method for data preprocessing, while CCM [Convergent Cross Mapping] shows outstanding performance among all causality tests adopted.The emerging causal effects from SS [solar activity] to GT [global temperatures], especially for recent decades, are overwhelmingly proved, which reflects the better understanding of the tendency of global warming.
Matveev et al., 2017An increase in atmospheric moisture for the warm period of the year (May–September) since 1890s, and mean annual temperatures since the 1950s was identified. During the same time period, there was a marked increase in amplitude of the annual variations for temperature and precipitation. … These fluctuations are consistent with 10–12-years Schwabe–Wolf, 22-years Hale, and the 32–36-years Bruckner Solar Cycles. There was an additional relationship found between high-frequency (short-period) climate fluctuations, lasting for about three years, and 70–90-years fluctuations of the moisture regime in the study region corresponding to longer cycles.
Schwander et al., 2017Influence of solar variability on the occurrence of Central European weather types from 1763 to 2009 … Weather types and reanalysis data show that the 11-year solar cycle influences the late winter atmospheric circulation over Central Europe with colder (warmer) conditions under low (high) solar activity. … The 247-year long analysis [1763-2009] of the 11-year solar cycle impact on late winter European weather patterns suggest a reduction in the occurrence of westerly flow types linked to a reduced mean zonal flow under low solar activity. Following these observation, we estimate the probability to have coldconditions in winter over Europe to be higher under low solar activity than under high activity. Also similar [cold] conditionscan occur during periods of prolonged reduced total solar irradiance. … Solar activity can have effects on the atmospheric circulation through three different mechanisms. These effects may arise from direct changes in total solar irradiance (TSI), from changes in stratospheric ozone induced by changes in solar UV, or from changes in stratospheric ozone induced by energetic particles, whose flux is modulated by solar activity. The ~1 Wm-2 variation in TSI over an 11-yr sunspot cycle corresponds to a change in the radiation forcing of about ~0.17 Wm-2.
Fu et al., 2017The influences of solar activity and large-scale climate modes (e.g. the El Niño/Southern Oscillation — ‘ENSO’) have been identified in many geophysical processes. The combined influences of solar activity and ENSO on the first leaf and bloom dates of lilacs were identified for most of the stations with records spanning ≥ 33 years. In the 11-year band, both increasing solar activity (SSN) and El Niño caused delays in the first leaf and bloom events of the cloned lilac during the 1980s in the northeastern United States.
Zielhofer et al., 2017Western Mediterranean Holocene record of abrupt hydro-climatic changes … Imprints of North Atlantic meltwater discharges, NAO and solar forcing …Early Holocene winter rain minima are in phase with cooling events and millennial-scale meltwater discharges in the sub-polar North Atlantic. … [A] significant hydro-climatic shift at the end of the African Humid Period (∼5 ka) indicates a change in climate forcing mechanisms. The Late Holocene climate variability in the Middle Atlas features a multi-centennial-scale NAO-type pattern, with Atlantic cooling and Western Mediterranean winter rain maxima generally associated with solar minima.
Sun et al., 2017 [A]t least six centennial droughts occurred at about 7300, 6300, 5500, 3400, 2500 and 500 cal yr BP. Our findings are generally consistent with other records from the ISM [Indian Summer Monsoon] region, and suggest that the monsoon intensity is primarily controlled by solar irradiance on a centennial time scale. This external forcing may have been amplified by cooling events in the North Atlantic and by ENSO activity in the eastern tropical Pacific, which shifted the ITCZ further southwards. The inconsistency between local rainfall amount in the southeastern margin of the QTP and ISM intensity may also have been the result of the effect of solar activity on the local hydrological cycle on the periphery of the plateau.
Zhai, 2017ENSO is negatively/positively correlated with SSN [sunspot number] when SSN is large/small. … [S]olar activity may take effect on the ENSO, and such an impact should undergo an accumulation procedure (phase delay). XWT also indicates the existence of the impact. It is found that the index is negatively correlated with SSN when SSN is large during a certain long-term interval, and positively when SSN is small. Strong El Niño is inferred to be taken place in decade(s) to come.
Fischel et al., 2017On a Holocene timescale, we conclude that the northeastern Caribbean SST [sea surface temperatures] and circulation regime have been mainly dependent on the position of the ITCZ [inter-tropical convergence zone], which, in turn, is controlled by changes in hemispheric solar insolation. Caribbean climate is directly controlled by the position of the inter-tropical convergence zone (ITCZ), where converging NE and SE trade winds creates a lowpressure convection zone with high precipitation rates (Philader et al., 1996; Schmidt et al., 2006). In addition to the seasonal variations in the position of the ITCZ, the long-term N–S migration of the ITCZ is largely determined by decadal to millennial changes in solar forcing (Haug et al., 2001; Schneider et al., 2014).
Zhu et al., 2017 Abrupt enhancements in the flux of pedogenic magnetite in the stalagmite agree well with the timing of known regional paleofloods and with equatorial El Niño−Southern Oscillation (ENSO) patterns, documenting the occurrence of ENSO-related storms in the Holocene. Spectral power analyses reveal that the storms occur on a significant 500-y cycle, coincident with periodic solar activity and ENSO variance, showing that reinforced (subdued) storms in central China correspond to reduced (increased) solar activity and amplified (damped) ENSO. Thus, the magnetic minerals in speleothem HS4 preserve a record of the cyclic storms controlled by the coupled atmosphere−oceanic circulation driven by solar activity.
Du et al., 2017Although the global warming has been successfully attributed to the elevated atmospheric greenhouses gases, the reasons for spatiotemporal patterns the warming rates are still under debate. In this paper, we report surface and air warming based on observations collected at 1,977 stations in China from 1960 to 2003. Our results show that the warming of daily maximum surface (Ts-max) and air (Ta-max) temperatures showed a significant spatial pattern, stronger in the northwest China and weaker in South China and the North China Plain. These warming spatial patterns are attributed to surface shortwave solar radiation (SSR) and precipitation, the key parameters of surface energy budget.
Zhai, 2017The time series of sunspot number and the precipitation in the north-central China (108° ∼ 115° E, 33° ∼ 41° N) over the past 500 years (1470–2002) are investigated, through periodicity analysis, cross wavelet transform and ensemble empirical mode decomposition analysis. The results are as follows: the solar activity periods are determined in the precipitation time series of weak statistical significance, but are found in decomposed components of the series with statistically significance; the Quasi Biennial Oscillation (QBO) is determined to significantly exist in the time series, and its action on precipitation is opposite to the solar activity; the sun is inferred to act on precipitation in two ways, with one lagging the other by half of the solar activity period.
Malik et al., 2017[W]e investigate the impact of internal climate variability and external climate forcings on ISMR on decadal to multi-decadal timescales over the past 400 years. The results show that AMO, PDO, and Total Solar Irradiance (TSI) play a considerable role in controlling the wet and dry decades of ISMR [Indian summer monsoon rainfall]. Resembling observational findings most of the dry decades of ISMR occur during a negative phase of AMO and a simultaneous positive phase of PDO.
Xiao et al., 2017 Solar wind and electric-microphysical process is the key mechanism that affects climate … We investigated the influencing mechanism of high-energetic particle precipitation modulated by solar wind on the Arctic Oscillation (AO) and North Atlantic Oscillation (NAO). On a day-to-day time scale, Zhou, Tinsley, and Huang (2014) and Huang et al. (2013) found that the minima in AO and NAO indices only lagged 0~2 days of the solar wind speed (SWS) minima during years of high stratospheric aerosol loading, which suggests a much faster mechanism of solar influence on the atmospheric system compared to the ozone destruction process. From the perspective of year-to-year variation, Xiao and Li (2016) and Zhou et al. (2016) showed a robust relationship between SWS [solar wind speed] and NAO in boreal winter. These aforementioned studies indicate that the wintertime Iceland Low in the North Atlantic was very sensitive to solar wind variations and played an important role in the process of solar wind and electric-microphysical effects on climate. Moreover, under the condition of a weak electric field, we have demonstrated the marked impact of cloud droplet electricity on the collision efficiency of cloud condensation nuclei. This, in turn, suggests that the collision in a cloud microphysics process constitutes the core link between atmospheric electricity and climate (Tinsley and Leddon 2013; Tinsley and Zhou 2013, 2014). Furthermore, Tinsley and Zhou (2015) improved the collision and parameterization scheme that varied with electric quantity in a cloud microphysics process and quantitatively evaluated the effects of high-energetic particle flux on cloud charge. This achievement not only supports the marked association of solar activity with weather and climate change on various time scales, but also but also avails the quantitative accession of solar impacts on climate. It is worth noting that the successful establishment development of a theoretical model regarding of the influencing process of solar energetic particles on the atmosphere improves the development of global climate models.
Vyklyuk et al., 2017Hurricane genesis modelling based on the relationship between solar activity and hurricanes … There are a number of works concerning the Sun–Earth connections and their influence on atmospheric motions. There are a number of observations which show that within a few days after energetic solar eruptions (flares, coronal mass ejections and eruptive prominences), there are diverse meteorological responses of considerable strength (Gomes et al. 2012). … Conclusion: [T]here are several indications which are in favor that the beginning of violent cyclonic motions in Earth’s atmosphere may be caused by charged particles from the solar wind.
Katsuki et al., 2017 Typhoon frequency in East Asia is synchronous with the solar irradiance. … Several studies documented typhoon pattern changes in response to the El Niño/Southern Oscillation (ENSO). … The fluctuation of the solar activity plays a key role in regulating the westerly jet movement. The multi-centennial scale of the typhoon frequency in mid-latitude East Asia is therefore caused by changes in the solar activity and ENSO conditions.
Moreno et al., 2017Understanding the Sun-Earth’s climate coupling system is both an essential and an urgent issue, with great progress achieved over the last decades (e.g., Haigh, 2007; Soon et al., 2014 for a review). Recently, Brugnara et al. (2013) referred that the Euro–Atlantic sector, in which Portugal is located, seems to be a region with a particularly strong solar influence on the troposphere, finding a significant change in the mean late winter circulation over Europe, which culminates in detectable impacts on the near-surface climate. Jiang et al. (2015) suggested that (i)climate in the northern North Atlantic regions follows SA[solar activity]fluctuations on multidecadal to centennial time scales, and (ii) it is more susceptible to the influence of those fluctuations throughout cool periods with, for instance, less vigorous ocean circulation. Similar results were found by Gómez-Navarro et al. (2012) in the context of climate simulations for the second millennium over the Iberian Peninsula, recognizing thattemperature and precipitation variability is significantly affected at centennial time scales by variations in the SA[solar activity]. … Grand Minima and Dalton-type Minimum scenarios are broadly characterized by (i) lower TSI (i.e., lower available PAR) (Lean, 1991, and references therein), (ii) development of cloudiness (e.g., Usoskin and Kovaltsov, 2008), and (iii) decreased global/regional air surface temperatures (e.g., Neukom et al., 2014) in tandem with greater regional precipitation variability. … The connections between solar phenomena and the lower atmosphere processes can be explained by two kind of mechanisms: (i) “top-to-down”, influencing the pole-to-equator temperature gradient and exerting an impact on the modulation of the atmospheric circulation cells, weakening or strengthening the zonal winds, and (ii) “bottom-to up” that directly impact on the radiation fluxes, energy balance and temperatures on the ground. Both finally impact the atmospheric circulation modes responsible for the global/regional precipitation and temperature patterns (e.g., Gray et al., 2010; Martin-Puertas et al., 2012; Thiéblemont et al., 2015).
Douglass et al., 2017Using a newly reported Pacific sea surface temperature data set, we extend a prior study that assigned El Niño episodes to distinct sequences. Within these sequences the episodes are phase-locked to subharmonics of the annual solar irradiance cycle having two- or three-year periodicity. There are 40 El Niño episodes occurring since 1872, each found within one of eighteen such sequences. Our list includes all previously reported events. Three El Niño episodes have already been observed in boreal winters of 2009, 2012 and 2015, illustrating a sequence of 3-year intervals that began in 2008. If the climate system remains in this state, the next El Niño is likely to occur in boreal winter of 2018.
Zhang et al., 2017The frequencies represent the influence of the Pacific Decadal Oscillation (PDO) and solar activity on the precipitation from the southwestern United States. In addition, solaractivity has exerted a greater effect than PDO on the precipitation in the southwestern United States over the past 120 years. By comparing the trend of droughts with the two fundamental frequencies, we find that both the droughts in the 1900s and in the 21st century were affected by the PDO and solar activity, whereas the droughts from the 1950s to the 1970s were mainly affected by solar activity.
Hood, 2017QBO/Solar Modulation of the Boreal Winter Madden-Julian Oscillation: A Prediction for the Coming Solar Minimum … The Madden-Julian Oscillation (MJO), also known as the 30-60 day oscillation, is the strongest of the intraseasonal climate oscillations in the tropics and has significant derivative effects on extratropical circulation and intraseasonal climate. … Here, evidence is presented that tropical upwelling changes related to the 11-year solar cycle also modulate the boreal winter MJO. Based on 37.3 years of MJO amplitude data, the largest amplitudes and occurrence rates, and the weakest static stabilities in the tropical lower stratosphere, occur during the QBOE phase under solar minimum (SMIN) conditions while the smallest amplitudes and strongest static stabilities occur during the QBOW phase under solar maximum (SMAX) conditions.
Orme et al., 2017Past changes in the North Atlantic storm track driven by insolation and sea-ice forcing … We suggest that gradual polar cooling (caused by decreasing solar insolation in summer and amplified by sea-ice feedbacks) and mid-latitude warming (caused by increasing winter insolation) drove a steepening of the winter latitudinal temperature gradient through the late Holocene, resulting in the observed change to a more northern winter storm track.
Page, 2017 Data related to the solar climate driver are discussed and the solar cycle 22 low in the neutron count (high solar activity) in 1991 is identified as a solar activity millennial peak and correlated with the millennial peak – inversion point – in the RSS temperature trend in about 2004. The cyclic trends are projected forward and predict a probable general temperature decline in the coming decades and centuries. Estimates of the timing and amplitude of the coming cooling are made. If the real climate outcomes follow a trend which approaches the near term forecasts of this working hypothesis, the divergence between the IPCC forecasts and those projected by this paper will be so large by 2021 as to make the current, supposedly actionable, level of confidence in the IPCC forecasts untenable. … Unless the range and causes of natural variation, as seen in the natural temperature quasi-periodicities, are known within reasonably narrow limits, it is simply not possible to even begin to estimate the effect of anthropogenic CO2 on climate. Given the lack of any empirical CO2-climate connection reviewed earlier and the inverse relationship between CO2 and temperature [during the Holocene, when CO2 rose as temperatures declined] seen in Figure 2, and for the years 2003.6–2015.2 in Figure 4, during which CO2 rose 20 ppm, the simplest and most rational working hypothesis is thatthe solar ‘activity’ increase is the chief driver of the global temperature increase since the LIA.
Huhtamaa and Helama, 2017Throughout the written history of Finland, delayed onset of summer and night frost have been named as the main reasons for crop failure and famine. … Our reconstruction suggests that in the 8th–10th centuries AD, when continuous crop cultivation was established in Finland, the risk of temperature-driven crop failure was notably lower and the crops were generally higher than during the historical period (c. 13th century ad onwards).The continuous period of high crop yields coincides with an episode of multi-centennial summer season warmth, associated with the MCA[Medieval Climate Anomaly] in the region and around north-west Europe (Goosse et al., 2012; Luoto and Helama, 2010; Ogilvie et al., 2000; Sundqvist et al., 2010). … The rapid mid-15th century cooling, which followed a major atmospheric circulation change over the North Atlantic (Dawson et al., 2007; Meeker and Mayewski, 2002)and coincided with the culmination of the Spörer solar minimum(Miyahara et al., 2006), has been evidenced in various summer and winter season reconstructions of the region (Haltia-Hovi et al., 2007; Helama et al., 2009b; Klimenko and Solomina, 2010; Luoto and Helama, 2010; Zhang et al., 2015). … The culmination of the ‘LIA’ [Little Ice Age] in Finland has been commonly dated to the late 17th and early 18th centuries ad (Luoto, 2013; Luoto and Helama, 2010; Tiljander et al., 2003), which is synchronous with the onset of the phase of the lowest yield ratios in our reconstruction. TheMaunder solar minima (c. 1645–1715) and several volcanic eruptions preceded the culmination (Shindell et al., 2003).
Svensmark et al., 2017 In conclusion, a mechanism by which ions condense their mass onto small aerosols and thereby increase the growth rate of the aerosols, has been formulated theoretically and shown to be in good agreement with extensive experiments. The mechanism of ion-induced condensation may be relevant in the Earth’s atmosphere under pristine conditions, and able to influence the formation of CCN [clouds]. It is conjectured that this mechanism could be the explanation for the observed correlations between past climate variations and cosmic rays, modulated by either solar activity or supernova activity in the solar neighborhood on very long time scales. The theory of ion-induced condensation should be incorporated into global aerosol models, to fully test the atmospheric implications.
(press release) The impact of changes in solar activity on Earth’s climate was up to seven times greater than climate models suggested according to new research published today in Nature Communications. Researchers have claimed a breakthrough in understanding how cosmic rays from supernovas react with the sun to form clouds, which impact the climate on Earth. The findings have been described as the “missing link” to help resolve a decades long controversy that has big implications for climate science.
Gray et al., 2017There is growing evidence that variability associated withthe 11-year solar cycle has an impact at the Earth’s surface and influences its weather and climate. Although the direct response to the Sun’s variability is extremely small, a number of different mechanisms have been suggested that could amplify the signal, resulting in regional signals that are much larger than expected. In this paper the observed solar cycle signal at the Earth’s surface is described, together with proposed mechanisms that involve modulation via the total incoming solar irradiance and via modulation of the ultra-violet part of the solarspectrum that influences ozone production in the stratosphere.
Hood, 2017 QBO/Solar Modulation of the Boreal Winter Madden-Julian Oscillation … The Madden-Julian Oscillation (MJO), also known as the 30-60 day oscillation, is the strongest of the intraseasonal climate oscillations in the tropics and has significant derivative effects on extratropical circulation and intraseasonal climate. … Here, evidence is presented that tropical upwelling changes related to the 11-year solar cycle also modulate the boreal winter MJO. Based on 37.3 years of MJO amplitude data, the largest amplitudes and occurrence rates, and the weakest static stabilities in the tropical lower stratosphere, occur during the QBOE phase under solar minimum (SMIN) conditions while the smallest amplitudes and strongest static stabilities occur during the QBOW phase under solar maximum (SMAX) conditions. Conversely, when the QBO and solar forcings are opposed (QBOW/SMIN and QBOE/SMAX), the difference in occurrence rates becomes statistically insignificant.
Gan et al., 2017 Temperature responses to the 11-year solar cycle in the mesosphere from the 31-year (1979-2010) … Atmospheric response to the solar cycle (SC) here refers to atmospheric variability induced by the 11-year solar activity cycle. The SC [solar cycle] response originates mainly from large (4-8%) solar UV spectral irradiance change (in the range of 200-250 nm) from solar minimum to maximum condition, while the total solar flux stays nearly constant (0.1%) [Donnelly, 1991; Lean et al., 1997; Woods and Rottman, 1997; Beig et al., 2008; Gary et al., 2010].The variability of the solar UV spectral irradiance affects the thermal structure of the atmosphere by directly changing the total energy deposited and indirectly modifying the photochemistry and dynamics of the atmosphere. In addition to the equatorial Quasi-Biennial Oscillation (QBO) [Baldwin et al., 2011] and the El Niño-Southern Oscillation (ENSO) [Li et al., 2013], the 11-year SC is also a significant source to the inter-annual variability in the mesosphere and lower (MLT) region.
Lihua, 2017 The modulation action from solar activity plays an important role in the temperature change, and there is a possible association existing in the global land-ocean temperature and solar activity on decade time scales. … About 11-year period, a remarkable oscillation of solar activity, continually exists in wavelet transform of solar variation. According to the cross wavelet transform, solar activity influences global land-ocean temperature change on ~11-year time scales during 1935-1995 with above the 5 % significance level.
Utomo, 2017A similar result was also found for the relationship between solar activity and cosmic ray flux with a negative correlation, i.e. 0.69/year.When solar activities decrease, the clouds cover rate increasedue-0.61/month and – to secondary ions produced by cosmic rays. The increase in the cloud cover rate causes the decrease in solar constant value and solar radiation on the earth’s surface [cooling]. … The increase in the formation rate of cloud would affect the decrease in the intensity of solar radiation reaching the Earth’s surface. The relationship between cosmic rays and solar constant is an “opposite” relationship because of the negative correlation type (r < 0). The phenomenon of “opposite” is in a good agreement with the result by Svensmark (1997) who founda correlation between temperature and global cloud coverage with the cosmic rays. … [T]he climate also depends on variations in the flux of solar energy received by the earth’s surface. Variation in the solar energy flux is caused by variations in solar activity cycle. Thus the climate is a manifestation of how solar radiation is absorbed, redistributed by the atmosphere, land and oceans, and ultimately radiated back into space.Every variation of solar energy received at the earth’s surface and reradiated by the earth into space will have a direct impact on climate change on Earth.
Biktash, 2017The effects of total solar irradiance (TSI) and volcanic activity on long-term global temperature variations during solar cycles 19–23 [1954-2008] were studied. It was shown that a large proportion of climate variations can be explained by the mechanism of action of TSI [total solar irradiance] and cosmic rays (CRs) on the state of the lower atmosphere and other meteorological parameters. … Recent studies by Pudovkin and Raspopov, Tinsley, and Swensmark have shown that the Earth’s cloud coverage is strongly influenced by cosmic ray intensity. Conditions in interplanetary space, which can influence GCRs and climate change, have been studied in numerous works. As has been demonstrated by Biktash,the long-term CR count rate and global temperature variations in 20–23 solar cycles are modulated by solar activity and by the IMF (interplanetary magnetic field). A possible geophysical factor which is able to affect the influence of solar activity on the Earth’s climate is volcanism. The effects of volcanism can lead to serious consequences in the atmosphere and the climate.
Sokeland, 2017The scattering of solar energy due to the small particles of supernova debris is also reflected in TSI data as shown in Fig. 3 [which] shows an excellent correspondence between sunspot minimums, irradiance depressions, and supernova impact times. … It was the debris stream of Nova WZ Sagittae that started our current global warming episode near 1966. … [T]he duration of a single supernova debris stream flowing past our planet is at least 50 years and at times more than 100 years. … Incoming supernova debris streams cause warming and melting ice caps that produce increased sea levels. … Termination of the last ice age results due to melting of numerous supernova impacts that correlate time of impact by changing sea level and geothermal energy released for 2,800 years. … Supernova 393 debris impacted earth near 857 AD and started the Medieval Warming Period. … Two supernovas, G299 and G296.7-0.9, impacted the earth to produce first the Roman warming period. … It should be concluded that the increase in CO2 caused by supernovas 1006 and 1054 that is currently being observed is a boon to mankind and will protect us from the coming cold phase that will be caused by these currently impacting supernovas. … Since supernovas 1054 and 1006 are currently incoming, the planet’s average temperatures should continue to increase, global warming. Global warming will not be reduced by reducing man made CO2 emissions
Tartakovsky et al., 2017 Along with its direct impact, the Sun regulates other effects on the geospheres. It modulates the flows of cosmic charged particles and the solar wind, which then change the conditions of energy conversion in the troposphere. As the Earth passes through the regions of the interplanetary magnetic field, it changes the radiation balance, which leads to changes in the temperature and pressure in the surface atmosphere, with large variability mainly in the ultraviolet part of the solar radiation spectrum which, due to photochemical reactions, regulates the formation of ozone in the stratosphere affecting the surface temperature … There is a theory that the effect of solar forcing on the geosphere is insufficient and, therefore, it is not able to change the climate. However, there are mechanisms through which a small energy of the regulator can initiate substantial climatic processes. … The mechanisms of solar energy transformations in the atmosphere are still subjects of debate. The physical nature of the solar-terrestrial connections has not been fully understood yet, and additional research is required for its clarification.
Warming Trend Since 1980s Explained By Surface Solar Radiation (Cloud Cover Reduction)
Sanchez-Lorenzo et al., 2017 Trends of all-sky downward surface solar radiation (SSR) from satellite-derived data over Europe (1983–2010) are first presented. The results show a widespread (i.e., non-local dimension) increase in the major part of Europe, especially since the mid-1990s in the central and northern areas and in springtime. There is a mean increase of SSR of at least 2 W m− 2 per decade from 1983 to 2010 over the whole Europe, which, taking into account that the satellite-derived product lacks of aerosol variations, can be mostly related to a decrease in the cloud radiative effects over Europe. … Downward surface solar radiation (SSR) is a critical part of the Global Energy Balance and the climate system … A widespread decrease of SSR from the 1950s to the 1980s [when global cooling occurred] has been observed (Liepert, 2002; Stanhill and Cohen, 2001; Wild, 2009), followed by an increase of SSR since the mid-1980s [when global warming occurred]… Pinker et al. (2005) used a different product (2.5° resolution) and found that the derived global mean SSR [surface solar radiation] series underwent a significant increase of 1.6 W m−2 per decade from 1983 to 2001. … On the other hand, Hatzianastassiou et al. (2005) derived a SSR product from 1984 to 2000 (2.5° resolution) and reported a significant increase of +2.4 W m−2 per decade in the global mean series, which is considerably higher than the results from Pinker et al. (2005) and Hinkelman et al. (2009).
Urban et al., 2017An important work that covered as many as 237 stations grouped into the five climatic regions and concerned, inter alia, sunshine duration trends from 1961 to 2004 in six South American countries, was published by Raichijk (2012). The results of that study confirm downward trends in sunshine duration from the 1950s until the 1980s and upward ones since the beginning of the 1990s, which were also observed in other regions of the world. Satellite short-wave radiation data spanning the period from 1984 to 2005 confirm the results obtained at ground sunshine duration measurement stations in all five climatic regions of South America. Upward sunshine duration trends are associated with an increase in the intensity of solar radiation and a decrease in cloud cover (Raichijk 2012).
Boers et al., 2017A 50-year [1966-2015] hourly dataset of global shortwave radiation, cloudiness and visibility over the Netherlands was used to quantify the contribution of aerosols and clouds to trends in all-sky radiation. The trend in all-sky radiation was expressed as a linear combination of trends in fractional cloudiness, clear-sky radiation and cloud-base radiation (radiation emanating from the bottom of clouds). All three trends were derived from the data records. The results indicate that trends in all three components contribute significantly to the observed trend in all-sky radiation. Trends (per decade) in fractional cloudiness, all-sky, clear-sky and cloud-base radiation were respectively 0.0097 ± 0.0062, 1.81 ± 1.07 W m−2, 2.78 ± 0.50 W m−2, and 3.43 ± 1.17 W m−2.
Antón et al., 2017This study focuses on the analysis of the daily global solar radiation (GSR) reconstructed from sunshine duration measurements at Madrid (Spain) from 1887 to 1950. Additionally, cloud cover information recorded simultaneously by human observations for the study period was also analyzed and used to select cloud-free days. First, the day-to-day variability of reconstructed GSR data was evaluated, finding a strong relationship between GSR and cloudiness. The second step was to analyze the long-term evolution of the GSR data which exhibited two clear trends with opposite sign: a marked negative trend of − 36 kJ/m2 per year for 1887–1915 period and a moderate positive trend of + 13 kJ/m2 per year for 1916–1950 period, both statistically significant at the 95% confidence level. Therefore, there is evidence of “early dimming” and “early brightening” periods in the reconstructed GSR [global solar radiation] data for all-sky conditions in Madrid from the late 19th to the mid-20th centuries.
Sanchez-Lorenzo et al., 2017 Clouds play a major role in the climate system, but large uncertainties remain about their decadal variations. Here we report a widespread decrease in cloud cover since the 1970 s over the Mediterranean region, in particular during the 1970 s–1980s, especially in the central and eastern areas and during springtime. Confidence in these findings is high due to the good agreement between the interannual variations of cloud cover provided by surface observations and several satellite-derived and reanalysis products, although some discrepancies exist in their trends.
Alexandri et al., 2017In this work, the spatiotemporal variability of surface solar radiation (SSR) is examined over the Eastern Mediterranean region for a 31-year period (1983–2013). … The satellite-based data from CERES (Cloud and the Earth’s Radiant Energy System), GEWEX (Global Energy and Water Cycle Experiment) and ISCCP (International Satellite Cloud Climatology Project) underestimate SSR while the reanalysis data from the ERA-Interim overestimate SSR compared to CM SAF SARAH. Using a radiative transfer model and a set of ancillary data, these biases are attributed to the atmospheric parameters that drive the transmission of solar radiation in the atmosphere, namely, clouds, aerosols and water vapor [CO2 not mentioned].. … The CM SAF SARAHSSR trend was found to be positive (brightening) and statistically significant at the 95% confidence level (0.2 ± 0.05 W/m2/year [2 W m-2 per decade].”
Hukuba et al., 2017At 36 locations worldwide, we estimate the cloud radiative effect (CREatm) on atmospheric solar absorption (ASRatm) by combining ground-based measurements of surface solar radiation (SSR) with collocated satellite-derived surface albedo and top-of-atmosphere net irradiance under both all-sky and clear-sky conditions. To derive continuous clear-sky SSR from Baseline Surface Radiation Network (BSRN) in-situ measurements of global and diffuse SSR, we make use of the Long and Ackerman (2000) algorithm that identifies clear-sky measurements and empirically fits diurnal clear-sky irradiance functions using the cosine of the solar zenith angle as the independent variable. The 11-year average (2000-2010) CREatm (all-sky minus clear-sky) is overall positive at around +11 Wm-2 using direct measurements form ground and space, and at 4 Wm−2 in the CERES EBAF dataset. This discrepancy arises from a potential overestimation in clear-sky absorption by the satellite product or underestimation by the combined BSRN/CERES dataset. The forcing ratio R shows that clouds enhance ASRatm most distinctly at desert-like locations that overall experience little occurrence of clouds. This relationship is captured by both the combined dataset and CERES EBAF.
Wild et al., 2017Detection of decadal changes in the downward shortwave radiation GEBA [Global Energy Balance Archive] has played a key role in the discovery that downward shortwave radiation at the Earth’s surface is not stable over time, but undergoes substantial multidecadal variations. Based on European GEBA sites, Ohmura and Lang (1989) identified a decline in downward shortwave radiation from the 1950s to the 1980s, later popularly known as “global dimming”. Follow-up studies found similar tendencies at GEBA sites around the world. When updating the GEBA records into the 2000s, Wild et al. (2005) noted a trend reversal and widespread recovery from previous dimming, which they coined “brightening”. Norris and Wild (2007, 2009) used the GEBA data and a satellite-derived regression method to estimate the effects of changes in cloud cover on dimming and brightening. A recent update of the trends in homogeneous European GEBA records is reported in Sanchez-Lorenzo et al. (2016).
Belohpetsky et al., 2017 It is well known that most short term global temperature variability is due to the well-defined ENSO natural oscillation (see: Wang and Fiedler, 2006). During strong El Niño events global average temperature rises by a few tenths Kelvin and reverts back subsequently. … The residual dynamics left after adjusting global surface temperature anomalies (1950-2014) for short-term variability from El Niño Southern Oscillation (ENSO) and volcanic eruptions have a staircase pattern. Linear trends for three quasi-stable periods 1950-1987, 1988-1997 and 1998-2014 are near zero with nearly all warming occurring during two step-like shifts in the years 1987/1988 and 1997/1998. A notable consequence of the staircase dynamics of recent warming is that observed temperature anomalies (HadCRUT4.5) from 1950 till 2014 could be almost reproduced as the linear sum of only two factors(!) : ENSO variability and the staircase function.
Jones and Ricketts, 2017[S]ince the mid-20th century,most observed warming has taken place in four events: in 1979/80 and 1997/98 at the global scale, 1988/89 in the Northern Hemisphere and 1968–70 in the Southern Hemisphere.Temperature is more step-like than trend-like on a regional basis. Satellite temperature is more step-like than surface temperature. … [S]tep-like changes are also present in tide gauge observations, rainfall, ocean heat content and related variables. [A]cross a selection of tests, a simple stepladder model better represents the internal structures of warming than a simple trend, providing strong evidence that the climate system is exhibiting complex system behaviour on decadal timescales. This model indicates that in situ warming of the atmosphere does not occur; instead, a store-and-release mechanism from the ocean to the atmosphere is proposed. It is physically plausible and theoretically sound. The presence of step-like – rather than gradual – warming is important information for characterising and managing future climate risk. [Climate models predicated on CO2 forcing indicate a gradual, not step-like warming.]
Park et al., 2017 According to our results, the central Mexican climate has been predominantly controlled by the combined influence of the 20-year Pacific Decadal Oscillation (PDO) and the 70-year Atlantic Multidecadal Oscillation (AMO). However, the AMO probably lost much of its influence in central Mexico in the early 20th century and the PDO has mostly driven climate change since.
Zhu et al., 2017This study analyzes the effects of fifteen major teleconnections on terrestrial ecosystem carbon fluxes during 1951-2012 using an ensemble of nine Dynamic Global Vegetation Models. We map the global pattern of the dominant teleconnections and find that these teleconnections significantly affect GPP variations over more than 82.1% of the global vegetated area, through mediating the global temperature, and regional precipitation and cloud cover.The El-Niño/Southern Oscillation, the Pacific Decadal Oscillation and the Atlantic Multidecadal Oscillation are strongly correlated with global, hemispherical, and continental carbon fluxes and climatic variables, while the Northern Hemisphere teleconnections have only regional influences.
Muñoz et al., 2017Temperature and humidity display rapid and significant changes over the Holocene. The rapid transition from a cold (mean annual temperature (MAT) 3.5°C lower than today) and wet Younger Dryas to a warm and dry early Holocene is dated at 11,410 cal yr BP. During the Holocene, MAT [mean annual temperature] varied from ca. 2.5°C below to 3.5°C above present-day temperature. Warm periods (11,410, 10,700, 9700, 6900, 4000, 2400 cal yr BP) were separated by colder intervals. The last 2.4 kyr of the record is affected by human impact [on the pollen proxy record]. The Holocene remained dry until 7500 cal yr BP. Then, precipitations increased to reach a maximum between 5000 and 4500 cal yr BP. A rapid decrease occurred until 3500 cal yr BP and the late Holocene was dry. … The highest rainfall intervals correlate with the highest activity of ENSO. Variability in solar output is possibly the main cause for this millennial to decadal cyclicity. We interpret ENSO [El Niño-Southern Oscillation] and ITCZ [Intertropical Convergence Zone] as the main climate change-driving mechanisms in Frontino. … From ca. 8000 cal yr BP, climate in both areas was under the dual influence of ENSO and ITCZ, thereby showing existing teleconnections between the tropical Pacific and Atlantic oceans.
Clarke et al., 2017Corresponding ~4-8 year periodicities identified from Wavelet analysis of particle size data from Pescadero Marsh in Central Coast California and rainfall data from San Francisco reflect established ENSO periodicity, as further evidenced in the Multivariate ENSO Index (MEI), and thus confirms an important ENSO control on both precipitation and barrier regime variability.
Douglass et al., 2017 Using a newly reported Pacific sea surface temperature data set, we extend a prior study that assigned El Niño episodes to distinct sequences. Within these sequences the episodes are phase-locked to subharmonics of the annual solar irradiance cycle having two- or three-year periodicity. There are 40 El Niño episodes occurring since 1872, each found within one of eighteen such sequences.
Macdonald and Sangster, 2017Statistically significant relationships between the British flood index, the Atlantic Meridional Oscillation and the North Atlantic Oscillation Index are identified. The use of historical records identifies that the largest floods often transcend single catchments affecting regions and that the current flood-rich period is not unprecedented. …Solar forcing can manifest itself in a variety of different ways on flood patterns through modification of the climate(Benito et al., 2004). Several series indicated increased flood frequency during the late eighteenth century corresponding to the Dalton Minimum (AD 1790–1830), with notable flooding across catchments in the 8-year period AD 1769 1779, which was a climatic period considered to include the sharpest phases of temperature variability during the “Little Ice Age” (Lamb, 1995; Wanner et al., 2008).
de Inglés and Jesús, 2017 The temperature in Azores depends on the position of the Gulf Stream (GS). A positive (negative) NAO phase enhances (reduces) the Gulf Stream (GS) velocity that increases (reduce) the amount of Eddies around Bermuda driving towards north (east) the GS and heating up high (medium) latitudes. Therefore, a negative phase of NAO favors the GS [Gulf Stream] heat to reach Azores. Since the temperature in Azores is modulated by the oceanic circulation, the AMO also plays an important role. The AMO is reflected in Ponta Delgada by the amplitude between maximum and minimum mean annual temperatures, which means an increase on seasonality. The AMO positive phase is reflected as an increase on temperatures in Lake Azul reconstruction. Otherwise, the AMO negative phase is masked by other climatic patterns. The precipitation in Azores is mainly triggered by the NAO phase
Muller et al., 2017 Over the past two decades, the number of paleotempestology records has increased substantially for sites along the Northwest Atlantic Ocean, Gulf of Mexico and Caribbean Sea, the South Pacific Ocean, and the Northwest Pacific and Indian Ocean regions. The most obvious characteristic of these records is that they reveal extended alternating periods of either greater or lesser tropical cyclone activity over centennial and millennial timescales. In these studies, researchers have shown that large-scale climatic features such as ENSO, sea surface temperatures (SSTs), the latitudinal position of the intertropical convergence zone (ITCZ), and the North Atlantic Oscillation (NAO) arelikely driving the alternating long-term behavior of tropical cyclones in global oceanic basins.
Lapointe et al., 2017 This paper investigates an annually-laminated (varved) record from the western Canadian Arctic and finds that the varves are negatively correlated with both the instrumental Pacific Decadal Oscillation (PDO) during the past century and also with reconstructed PDO over the past 700 years, suggesting drier Arctic conditions during high-PDO phases, and vice versa. These results are in agreement with known regional teleconnections, whereby the PDO is negatively and positively correlated with summer precipitation and mean sea level pressure respectively. This pattern is also evident during the positive phase of the North Pacific Index (NPI) in autumn. Reduced sea-ice cover during summer–autumn is observed in the region during PDO− (NPI+) and is associated with low-level southerly winds that originate from the northernmost Pacific across the Bering Strait and can reach as far as the western Canadian Arctic. These climate anomalies are associated with the PDO− (NPI+) phase and are key factors in enhancing evaporation and subsequent precipitation in this region of the Arctic.
Levine et al., 2017The Atlantic Multidecadal Oscillation (AMO) is the dominant mode of multi-decadal SST variability in the Atlantic Ocean. Changes in AMO-related tropical Atlantic SSTs are known to force changes in the Walker Circulation in the tropical Pacific Ocean. We show that these changes to the Walker Circulation modify ENSO stability on both annual and multi-decadal timescales leading to a distinctive pattern of multi-decadal ENSO variability that we find in observations, ocean reanalyses and conceptual and coupled model experiments.
Valdés-Pineda et al., 2017 This study analyzes these low-frequency patterns of precipitation in Chile (>30 years), and their relationship to global Sea Surface Temperatures (SSTs), with special focus on associations with the Pacific Decadal Oscillation (PDO) and the Atlantic Multi-decadal Oscillation (AMO) indices. … We conclude that a significant multi-decadal precipitation cycle between 40 and 60 years is evident at the rain gauges located in the subtropical and extratropical regions of Chile. This low-frequency variability seems to be largely linked to PDO and AMO modulation.
Liu et al., 2017 Land and sea surface temperatures, precipitation, and storm tracks in North America and the North Pacific are controlled to a large degree by atmospheric variability associated with the Pacific North American (PNA) pattern. … Our reconstruction shows that PNA has been strongly and consistently correlated with sea surface temperature variation, solar irradiance, and volcanic forcing over the period of record, and played a significant role in translating these forcings into decadal-to-multidecadal hydroclimate variability over North America.
Manatsa et al., 2017 ENSO has been known to influence the trends of summer warming over Southern Africa. In this work, we used observational and reanalysis data to analyze the relationship between ENSO and maximum surface air temperature (SATmax) trends during the three epochs created by the ENSO phase shifts around 1977 and 1997 for the period 1960 to 2014. We observed that while ENSO and cloud cover remains the dominant factor controlling SATmax [maximum surface air temperature] variability, the first two epochs had the predominant La Niña (El Niño)-like events connected to robust positive (negative) trends in cloud fraction.
Kozachek et al., 2017 No unusual recent change is detected in the isotopic composition or in the accumulation rate record, in contrast with the observed warming trend from regional meteorological data. The accumulation rate appears significantly related to the NAO index, in agreement with the earlier results for the Djankuat glacier (Shahgedanova et al., 2005). As a result, the isotopic composition of the ice cores appears mostly related to characteristics of large–scale atmosphere circulation such as the NAO index…. Tielidze (2016) reports a recent increase in the annual mean temperatures at different elevations in the Georgian Caucasus. The region experienced glacier area loss over the 20th century at an average annual rate of 0.4 %, with a higher rate in eastern Caucasus than in the central and western sections. The analysis of the temperature and radiation regime of glaciers at the ablation period has been performed in the vicinity of El’brus recently (Toropov et al., 2016). The authors prove that the observed waning of glaciers cannot be explained by an increase in temperature during the ablation period because of an increase in precipitation during the accumulation period.They concluded that the main driver of glacier retreat is the increase in the solar radiation balance by 4 % for the 2001–2010 period, which corresponds to the increase in ablation by 140 mm per ablation season (Toropov et al., 2016).
Lim et al., 2017 Our study demonstrated that floodfrequency and climate changes at centennial-to-millennial time scales in South Korea have been coupled mainly with ENSO activity, suggesting that the hydrologic changes, including flooding and drought, in East Asia are coupled to the centennial-to-millennial-scale atmospheric-oceanic circulation changes represented by the ENSO pattern.
Valdés-Pineda et al., 2017This study analyzes these low-frequency patterns of precipitation in Chile (>30 years), and their relationship to global Sea Surface Temperatures (SSTs), with special focus on associations with the Pacific Decadal Oscillation (PDO) and the Atlantic Multi-decadal Oscillation (AMO) indices. … We conclude that a significant multi-decadal precipitation cycle between 40 and 60 years is evident at the rain gauges located in the subtropical and extratropical regions of Chile. This low-frequency variability seems to be largely linked to PDO and AMO modulation.
Reynolds et al., 2017 Evidence derived from instrumental observations suggest that Atlantic variability, associated with changes in SSTs and fluctuations in the strength of the Atlantic Meridional Overturning Circulation (AMOC), is directly linked with broader scale climate variability, including Brazilian and Sahel precipitation (Folland et al., 1986 and Folland et al., 2001), Atlantic hurricanes and storm tracks (Goldenberg et al., 2001 and Emanuel, 2005), and North American and European temperatures (Sutton and Hodson, 2005, Knight et al., 2006 and Mann et al., 2009). Furthermore, evidence derived from palaeoceanographic records suggests that a reduction in the meridional heat transport through the surface components of the AMOC was in part responsible for the reductions in temperatures associated with the Medieval Climate Anomaly (MCA; 1000–1450) to Little Ice Age (LIA; 1450–1850) transition (Lund et al., 2006, Trouet et al., 2009, Trouet et al., 2012, Wanamaker et al., 2012 and Moffa-Sánchez et al., 2014).
Fan and Yang, 2017The wintertime Arctic temperature decreased from 1979 to 1997 and increased rapidly from 1998 to 2012, in contrast to the global mean surface air temperature [which] increased between 1979 and 1997, followed by a hiatus… A recent study suggests a possible role of the Pacific Ocean decadal oscillation in regulating wintertime climate in the Arctic (Screen and Francis 2016). … The ‘‘greenhouse effect’’ of water vapor and clouds [CO2 not mentioned as contributing to the GHE] may amplify the effect of winds on Arctic winter climate. … The objectives of this study are to assess how much natural–internal variability has contributed to climate changes in these [Arctic] regions from 1979 to 2012 … In summary, the correlation analyses presented in this paper shows a natural mode of Arctic winter variability resulting from the Nordic–Siberian seesaw of meridional winds […] is associated with two-thirds of the interannual variance [cooling-warming] of winter-mean Arctic temperature between 1979 and 2012, and possibly contributed a substantial fraction of the observed Arctic amplification [1998-2012 warming] in this period.
Myoung et al., 2017 This study examines the relationship between the North Atlantic Oscillation (NAO) and snowmelt in spring in the upper southwestern states of the US (UP_SW) including California, Nevada, Utah, and Colorado, using SNOTEL datasets for 34 years, 1980-2014. We find statistically significant negative correlations between NAO averages in the snowmelt period and timings of snowmelt, i.e., positive NAO phases in spring enhance snowmelt, and vice versa. … The underlying mechanism for this link is that a positioning of upper-tropospheric anticyclonic (cyclonic) circulations over the western US that are associated with development of the positive (negative) NAO phases tend to bring warmer-and-drier (colder-and-wetter) spring weather conditions to the region. The temperature variations related with the NAO phases also strongly modulate the snowfall-rainfall partitioning. The relationship between NAO and spring snowmelt can serve as key information for the warm season water resources management in the UP_SW.
Gao et al., 2017We find that negative correlations between the atmospheric temperature in the tropics and ENSO are observed at 17–30 km in the lower stratosphere at a lag of 1 to 4 months and at a lead of 1 month. Out-of-phase temperature variation is observed in the troposphere over the mid-latitude band and in-phase behaviour is observed in the lower stratosphere. Interestingly, we also find that there is a significant negative correlation at a lag of 1–3 months from 32 km to 40 km in the mid-latitude region of the Northern Hemisphere. The atmospheric temperature variations over mid-latitude regions in both hemispheres are closely related to the QBO [quasi-biennial oscillation].
Hao and He, 2017 Using long-term observational data and numerical model experiments, this study found that the Atlantic Multidecadal Oscillation (AMO) affects the influence of ENSO-like sea surface temperature anomalies (SSTAs, which contain variability of both El Niño-Southern Oscillation and Pacific Decadal Oscillation) on the interannual change in the East Asian winter monsoon (EAWM). In the observations, the out-of-phase relationship between the ENSO-like and EAWM was significantly intensified when the AMO and ENSO-like were in-phase. Warmer-than-normal winters occurred across East Asia when the ENSO-like and AMO were positively in-phase, with a significantly weakened Siberian High and anomalous anticyclones over the western North Pacific. The opposite patterns occurred under negatively in-phase conditions.
Zaitchik, 2017The Madden-Julian Oscillation (MJO) is the dominant mode of sub-seasonal climate variability in the global tropics. As such it represents an opportunity for intra-seasonal rainfall prediction and, perhaps, for explaining dynamics that underlie longer term variability and trends. … A number of studies have identified statistical links between MJO and sub-seasonal rainfall variability in West, East, and Southern Africa. … On longer time scales, there is evidence that MJO activity both modulates and is modulated by the El Niño Southern Oscillation and the Indian Ocean Dipole. The implications of these interactions for MJO connections to Africa require further research, as does the potential for trends in MJO behavior and impacts on Africa under global climate change.
Reischelmann et al., 2017 We document that long-term patterns in temperature and precipitation are recorded in dripwater patterns of Bunker Cave and that these are linked to the North Atlantic Oscillation (NAO).
Lopez et al., 2017This study reconstructs a century-long South Atlantic Meridional Overturning Circulation (SAMOC) index. The reconstruction is possible due to its covariability with sea surface temperature (SST). A singular value decomposition (SVD) method is applied to the correlation matrix of SST and SAMOC. The SVD is performed on the trained period (1993-present) for which Expendable Bathythermographs (XBT) and satellite altimetry observations are available. The joint modes obtained are used in the reconstruction of a monthly SAMOC timeseries from 1870 to present. The reconstructed index is highly correlated to the observational-based SAMOC timeseries during the trained period and provides a long historical estimate. It is shown that the Interdecadal Pacific Oscillation (IPO) is the leading mode of SAMOC-SST covariability, explaining ~85% with the Atlantic Niño accounting for less than 10%. The reconstruction shows that SAMOC has recently shifted to an anomalous positive period, consistent with a recent positive shift of the IPO.
Wu et al., 2017 The enhanced warming observed in the Eastern China Coastal Waters (ECCW) during the last half-century has received considerable attentions. However, the reason for this warming is still a subject of debate. Based on four different Sea Surface Temperature datasets, we found that the most significant warming occurred in boreal winter during 1982–1998, although the warming trends derived from these datasets differ in magnitude. We suggest that the rapid warming during winter is a result of the asymmetry in the El Niño–Southern Oscillation teleconnection, through whichEl Niño events induce significant warming over the ECCW at its peak, whereas La Niña events fail to do the opposite that would completely reverse the trends; in addition, there were more El Niño than La Niña events during the recent decades. All these contribute to the winter warming during 1982–1998.
Schwartz and Garfinkel, 2017European and eastern United States (U.S.) wintertime weather is strongly influenced by large-scale modes of variability in the Northern Hemisphere such as the Arctic Oscillation (AO) and North Atlantic Oscillation (NAO). The negative phase of the NAO has been linked to both the Madden Julian Oscillation (MJO) phase with convection in the West Pacific (phase 6 and 7) and to stratospheric sudden warmings (SSW), but the relative role of each phenomena is not clear, and the two phenomena are themselves linked, as more than half of SSW events were preceded by blackphases 6 and 7 of the MJO.
He et al., 2017 As pointed out by Cohen et al. (2014) that continental winter SAT [surface temperature] trends since 1990 exhibit cooling over the midlatitudes. The negative trends extend from Europe eastward to East Asia, with a center of maximum magnitude to the west of the Baikal. As reviewed above, the AO/NAO [Arctic Oscillation/North Atlantic Oscillation] shows an in-phase relationship with the SAT [surface temperatures] over Eurasia. …[T]he negative trend in the AO/NAO might explain the recent Eurasian winter cooling. … Additionally, the relationship between the winter AO and surface-climate anomalies in the following spring might be modulated by the 11-year solar cycle (Chen and Zhou, 2012). The spring temperature anomalies in northern China related to the previous winter AO were larger and more robust after high solar cycle winters. However, spring temperature anomalies became very small and insignificant after the low solar cycle winters. … Numerous atmospheric scientists have documented that the AO could impact significantly the climate over Europe and Far East. … It is evident that a positive winter AO causes warmer winters over East Asia through enhancing Polar westerly jet which prevents cold Arctic air from invading low latitudes.
Bianchette et al., 2017Seven periods of increased water level, varying in duration, occurred during the backbarrier period, with El Niño-Southern Oscillation (ENSO) likely the main climatic mechanism causing these periodic shifts in the paleo-precipitation levels. We suggest that the deepest water levels detected over the last ~3200 years correlate with periods of increased ENSO activity.
Lachniet et al., 2017[M]onsoon dynamics appear to be linked to low-frequency variability in the ENSO and NAO, suggesting that ocean-atmosphere processes in the tropical oceans drive rainfall in Mesoamerica. … Climate model output suggests decreasing rainfall as a consequence of anthropogenic greenhouse gas radiative forcing (Rauscher et al., 2008; Saenz-Romero et al., 2010). Our data show, however, thatthe response of the monsoon will be strongly modulated by the changes in ENSO and the NAO mean states … Our data also show that the magnitude of Mesoamerican monsoon variability over the modern era when the anthropogenic radiative forcing has dominated over solar and volcanic forcings (Schmidt et al., 2012) is within the natural bounds of rainfall variations over the past 2250 years. This observation suggests that if anthropogenic forcing has impacted the Mesoamerican monsoon, the signal has yet to be detected above the level of natural climate variability, and the monsoon response to direct radiative forcing and indirect ocean-atmosphere forcings may yet to be fully realized.
Cheung, 2017 The sea surface temperature (SST) of the Eastern Equatorial Pacific (EEP) exerts primary control on global surface temperature(e.g. Halpert and Ropelewski 1992; Wigley 2000)and regional climate(e.g. Ropelewski and Halpert 1987)through different modes of climate variability including the El Niño Southern Oscillation (ENSO) and the Pacific Decadal Oscillation (PDO). With such profound impacts, it is important to understand the evolution of SST in EEP, specifically the dynamics of these climate modes. Rigorous studies over the past decades have shed insights on these two climate modes. ENSO is known to affect regional and global climates on interannual timescales. During an El Niño event, a weakening of easterly trade wind stimulates propagation of Kelvin waves from the western equatorial Pacific to the EEP, which in turn reduces the slope of the thermocline and suppresses upwelling. The decrease in pressure gradient reinforces the weakening of the trade winds through the Bjerknes feedback and ultimately creates an El Niño condition (e.g. Collins et al. 2010).The reorganization of the ocean and the atmosphere due to El Niño raises the global mean surface temperature (e.g. Halpert and Ropelewski 1992; Wigley 2000) and alters regional climate, for example causing drought in Australia (Cai et al. 2011), pluvial in Southwest United States (Ropelewski and Halpert 1987), and changing tropical cyclone frequencies in the Western North Pacific (Camargo and Sobel 2005; Chan 1985). The opposite spatial pattern and teleconnections happen during a La Niña event.
Dieng et al., 2017 We can note that the correlation between GMST [global mean surface temperature] trends and AMO trends is quite high. It amounts 0.88 over the whole time span. At the beginning of the record, the correlation with PDO trends is also high (equal to 0.8) but breaks down after the mid-1980s. The GMST and AMO trends shown in Figure 6 show a low in the 1960s and high in the 1990s, suggestive of a 60-year oscillation, as reported for the global mean sea level by Chambers et al. (2012).Thus the observed temporal evolution of the GMST [global mean surface temperature] trends may just reflect a 60-year natural cycle driven by the AMO.
B et al., 2017The recent Indian Ocean (IO) warming and its relation with the El Niño Southern Oscillation (ENSO) is investigated using available ocean and atmospheric reanalyses. By comparing the events before and after 1976 (identified as a threshold separating earlier and recent decades with respect to global warming trends), our results indicate that the IO had experienced a distinct change in the warming pattern. After 1976, during the boreal summer season the cold anomalies in the IO [Indian Ocean] were replaced by warm anomalies in both warm (El Niño) and cold (La Niña) ENSO events. Strong sinking by upper level winds and the associated anomalous equatorial easterly winds created favourable conditions for the IO warming from 90°E towards the western IO. Our study highlights that after 1976, atmospheric and oceanic fields changed mostly during La Niña, with both ENSO phases contributing to the warming of the IO. Warm anomalies of 0.2 °C are seen over large areas of the IO in the post-1976 La Niña composites. Our analysis suggests that the IO warming during La Niña events after 1976 may have a relation to the warm anomalies persisting from the preceding strong El Niño events.
Mermelstein, 2017[T]he 1940-1978 decrease in CONUS [continental U.S.] temperatures was caused more by the negatively trending oscillatory modes of the AMO/PDO than other factors, and the 1978-2001 increase in temperatures was caused more by the positively trending oscillatory modes of the same oscillations. The small increase, or rather stagnant nature in U.S. CONUS temps since 2001, was likely due to peaking positive modes of the AMO/PDO. In the same way that the AMO and PDO can modify the regional temperatures, we see the same types of effects on precipitation, snowfall and drought in the different regions of the U.S. … It was not until 2003 (Anastasios, Swanson, & Kravtsov, 2003, 2007) that models were created that suggested that these cycles, namely the Pacific Decadal Oscillation (PDO) and the Atlantic Multidecadal Oscillation (AMO) synchronized with each other. Using this as a base, we can explain the major climate shifts that have occurred since scientists began collecting data in the late 1800’s: 1908, 1932, 1973, and 2000. While the most noticeable change in these shifts was on global temperature, effects on the regional, sensible weather in the U.S. were also identified in these same time frames. Through analysis it has been theorized that these shifts are caused by the oceans, and are in fact the main drivers of the climate, and the sensible weather experienced in the United States (Klotzbach & Gray, 2009).
Vaideanu et al., 2017 Here, we identify the global footprint of the Atlantic Multidecadal Oscillation (AMO) on high cloud cover, with focus on the tropical and North Atlantic, tropical Pacific and on the circum-Antarctic sector. In the tropical band, the sea surface temperature (SST) and high cloud cover (HCC) anomalies are positively correlated, indicating a dominant role played by convection in mediating the influence of the AMO-related SST anomalies on the HCC field. … Despite the inherent imperfection of the observed and reanalysis data sets, the AMO footprint on HCC is found to be robust to the choice of dataset, statistical method, and specific time period considered.
Kolling et al., 2017 [O]ur reconstructions reveal several oscillations with increasing/decreasing sea ice concentrations that are linked to the known late Holocene climate cold/warm phases, i.e. the Roman Warm Period, Dark Ages Cold Period, Medieval Climate Anomaly and Little Ice Age. The observed changes seem to be connected to general ocean atmosphere circulation changes, possibly related to North Atlantic Oscillation and Atlantic Multidecadal Oscillation regimes. Furthermore, we identify a cyclicity of 73–74 years in sea ice algae and phytoplankton productivity over the last 1.2 kyr, which may indicate a connection to Atlantic Multidecadal Oscillation mechanisms.
Bjørk et al., 2017 Changes in Greenland’s peripheral glaciers linked to the North Atlantic Oscillation… [W]e map glacier length fluctuations of approximately 350 peripheral glaciers and ice caps in East and West Greenland since 1890. Peripheral glaciers are found to have recently undergone a widespread and significant retreat at rates of 12.2 m per year and 16.6 m per year in East and West Greenland, respectively; these changes are exceeded in severity only by the early twentieth century post-Little-Ice-Age retreat. Regional changes in ice volume, as reflected by glacier length, are further shown to be related to changes in precipitation associated with the North Atlantic Oscillation (NAO), with a distinct east–west asymmetry; positive phases of the NAO increase accumulation, and thereby glacier growth, in the eastern periphery, whereas opposite effects are observed in the western periphery. Thus, with projected trends towards positive NAO in the future, eastern peripheral glaciers may remain relatively stable, while western peripheral glaciers will continue to diminish.
Starczak Weinberg, 2017 ENSO has been the predominant climate driver for the Eastern Pacific, affecting coastal Peru to varying degrees on a multi-decadal scalesince it onset at modern frequencies during the Middle Holocene. At local scales, geomorphological evidence and archaeological settlement pattern data suggest changes in precipitation, temperature, and climate variability, with specific relevance for human subsistence and resource access within the coastal desert.
Rossby Waves, Ozone Climate Modulation
Gong et al., 2017During the past three decades, the most rapid warming at the surface has occurred during the Arctic winter. By analyzing daily ERA-Interim data, we found that the majority of the winter warming trend north of 70°N can be explained by the trend in the downward infrared radiation (IR). This downward IR trend can be attributed to an enhanced poleward flux of moisture and sensible heat into the Arctic by poleward propagating Rossby waves, which increases the total column water and temperature within this region. This enhanced moisture flux is mostly due to changes in the planetary-scale atmospheric circulation rather than an increase in moisture in lower latitudes. The results of this study lead to the question of whether Arctic amplification has mostly arisen through changes in the Rossby wave response to greenhouse gas forcing and its impact on moisture transport into the Arctic.
Xie et al., 2017Antarctic stratospheric ozone depletion is thought to influence the Southern Hemisphere tropospheric climate. Recently, Arctic stratospheric ozone (ASO) variations have been found to affect the middle-high latitude tropospheric climate in the Northern Hemisphere. This paper demonstrates that the impact of ASO can extend to the tropics, with the ASO variations leading El Niño-Southern Oscillation (ENSO) events by about 20 months.
Rydbeck et al., 2017 Intraseasonal sea surface warming in the western Indian Ocean by oceanic equatorial Rossby waves … A novel process is identified whereby equatorial Rossby(ER) waves maintain warm sea surface temperature (SST) anomalies against cooling by processes related to atmospheric convection in the western Indian Ocean. As downwelling ER waves enter the western Indian Ocean, SST anomalies of +0.15°C develop near 60°E. These SST anomalies are hypothesized to stimulate convective onset of the Madden-Julian Oscillation. The upper ocean warming that manifests in response to downwelling ER [equatorial Rossby] waves is examined in a mixed layer heat budget using observational and reanalysis products, respectively. In the heat budget, horizontal advection is the leading contributor to warming, in part due to an equatorial westward jet of 80 cm s−1 associated with downwelling ER waves. When anomalous currents associated with ER waves are removed in the budget, the warm intraseasonal temperature anomaly in the western Indian Ocean is eliminated in observations and reduced by 55% in reanalysis.
Gonget al.,2017 The inter-annual relationship between the boreal winter Arctic Oscillation (AO) and summer sea surface temperature (SST) over the western tropical Indian Ocean (TIO) for the period from 1979 to 2015 is investigated. The results show that the January–February–March AO [Arctic Oscillation] is significantly correlated with the June–July–August SST and SST tendency. … The multi-month SST tendency, i.e., the SST difference of June–July–August minus April–May, is correlated with the winter AO at r = 0.75.Investigation of the regional air–sea fluxes and oceanic dynamics reveals that the net surface heat flux cannot account for the warming, whereas the oceanic Rossby wave plays a predominant role. During positive AO winters, the enhanced Arabian High causes stronger northern winds in the northern Indian Ocean and leads to anomalous cross-equatorial air-flow. … The winter AO-forced Rossby wave propagates westward and arrives at the western coast in summer, resulting in the significant SST increase.
Yuan et al., 2017On the timescale of decades, changes in MJO [Madden-Julien Oscillation]phases can result in temperature and sea ice changes in the polar regions of both hemispheres. Moreover, the long-term changes in SST of the western tropical Pacific, tropical Atlantic, and North Atlantic Ocean have been linked to the rapid winter warming around the Antarctic Peninsula, while SST changes in the central tropical Pacific have been linked to the warming in West Antarctica. Rossby wave trains emanating from the tropics remain the key mechanism for tropical and polar teleconnections from intraseasonal to decadal timescales. ENSO related tropical SST anomalies affect higher latitude annular modes, by modulating mean zonal winds in both the subtropics and mid-latitudes. Recent studies have also revealed the details of the interactions between the Rossby wave and atmospheric circulations in high latitudes. .. In addition to atmospheric Rossby waves forced from the tropics, large polar temperature changes and amplification, in part associated with variability in orbital configuration and solar irradiance, affected the low-high latitude connections.
Modern Climate In Phase With Natural Variability (13)
Seviour, 2017Weakening and shift of the Arctic stratospheric polar vortex: Internal variability or forced response? … By comparing large ensembles of historical simulations with pre-industrial control simulations for two coupled climate models, the ensemble mean response of the vortex is found to be small relative to internal variability. There is also no relationship between sea-ice decline and trends in either vortex location or strength. Despite this, individual ensemble members are found to have vortex trends similar to those observed, indicating that these trends may be primarily a result of natural internally-generated climate variability.
Xie and Zhang, 2017The North America continent experienced an extremely anomalous dipole climate in the 2014/2015 winter with record-breaking cold temperature anomalies in the east and warm anomalies in the west. … [W]e conclude that the 2014/2015 winter extreme dipole climate is a low-probability event that isprimarily caused by internal atmospheric variabilitybased on the single model CAM4.
Shi et al., 2017 Five of the six coupled ocean-atmosphere climate models of the Paleoclimate Modeling Intercomparison Project Phase III (PMIP3), can reproduce the south-north dipole mode of precipitation in eastern China, and its likely link with ENSO. However, there is mismatch in terms of their time development. This is consistent withan important role of the internal variability in the precipitation field changes over the past 500 years.
Conroy et al., 201720th century precipitation variability in southern Tibet falls within the range of natural variability in the last 4100 yr, and does not show a clear trend of increasing precipitation as projected by models. Instead, it appears that poorly understood multidecadal to centennial internal modes of monsoon variability remained influential throughout the last 4100 yr. … Until we have a predictive understanding of multidecade to multi-century variability in the Asian monsoon system, it would be wise to consider the risk of prolonged periods of anomalously dry and wet monsoon conditions to be substantial (Ault et al., 2014). Such variability may also explain why the predicted anthropogenic increase in Asian monsoon precipitation is not widely observed.
Macdonald and Sangster, 2017 The findings identify that whilst recent floods are notable, several comparable periods of increased flooding are identifiable historically, with periods of greater frequency (flood-rich periods). Statistically significant relationships between the British flood index, the Atlantic Meridional Oscillation and the North Atlantic Oscillation Index are identified. The use of historical records identifies that the largest floods often transcend single catchments affecting regions and that the current flood-rich period is not unprecedented.
Verdon-Kidd et al., 2017 Overall, the inter-annual and inter-decadal variability of rainfall and runoff observed in the modern record(Coefficient of Variation (CV) of 22% for rainfall, 42% for runoff)is similar to the variability experienced over the last 500 years (CV of 21% for rainfall and 36% for runoff). However, the modern period is wetter on average than the pre-instrumental (13% higher for rainfall and 23% higher for runoff). Figure 9 also shows that the reconstructions contain a number of individual years (both wet and dry) of greater magnitude than what has been recorded in the instrumental record.
Kostyakova et al., 2017 A nested July–June precipitation reconstruction for the period AD 1777–2012 was developed from multi-century tree-ring records of Pinus sylvestris L. (Scots pine) for the Republic of Khakassia in Siberia, Russia. … The longest reconstructed dry period, defined as consecutive years with less than 25th percentile of observed July–June precipitation, was 3 years (1861–1863). There was no significant difference in the number dry and wet periods during the 236 years of the reconstructed precipitation.
Hu et al., 2017[I]t was a challenge to predict the evolution of this warm event, especially for its growth. That is consistent with the fact that the SSTAs [sea surface temperature anomalies] in extratropical oceans are largely a consequence of unpredictable atmospheric variability. [T]he marked differences in both the spatial distribution and amplitude between Figs. 4 and 3 suggest that maybe only a fraction of the observed variability in NEPO was forced by the SSTA while a large amount of the observed variability may have been a consequence of the atmospheric internal variability (noise). That is consistent with the conclusion from some recent works in examining the climate variability in mid- and high latitudes of the Northern Hemisphere, such as Baxter and Nigam (2015), Hartmann (2015), Lee et al. (2015), Seager et al. (2015), Watson et al. (2016), and Jha et al. (2016). … The remarkable amplitude differences between the observations (Fig. 3) and the simulations (Fig. 4) plus the large fluctuation of the pattern correlation (Figs. 5a, 6a), are indicative of the importance of the atmospheric internal variability (noise) in driving the observed anomalies in NEPO [northeastern Pacific Ocean]. [I]t was a challenge to predict the persistent SST anomalies in the northeastern Pacific because the SST anomaly in NEPO [northeastern Pacific Ocean] is largely controlled by unpredictable stochastic [random] atmosphere variability. [CO2 and/or anthropogenic forcing is not mentioned once in the paper.]
Goldsmith et al., 2017The EAM [East Asian Monsoon] intensity and northern extent alternated rapidly between wet and dry periods on time scales of centuries. Lake levels were 60 m higher than present during the early and middle Holocene, requiring a twofold increase in annual rainfall [relative to today], which, based on modern rainfall distribution, requires a ∼400 km northward expansion/migration of the EAM.
Stegall and Kunkel, 2017These results indicate that there is potential skill in use of GCMs [climate models] to provide projections of hot and cold extremes on the 30-yr timescale. However,it is important to note that natural variability is comparable to the forced signalon this timescale and thus introduces uncertainty.
Bordbar et al,, 2017 The observed trends in the tropical Pacific surface climate are still within the range of the long-term internal variability spanned by the models but represent an extreme realization of this variability. Thus, the recent observed decadal trends in the tropical Pacific, though highly unusual, could be of natural origin. We note that the long-term trends in the selected PWC indices exhibit a large observational uncertainty, even hindering definitive statements about the sign of the trends.
Bhaskar et al., 2017Quantitative assessment of drivers of recent [1984-2005] global temperature variability … Measurements of greenhouse gases: CO2, CH4 and N2O; volcanic aerosols; solar activity: UV radiation, total solar irradiance (TSI) and cosmic ray flux (CR); El Niño Southern Oscillation (ENSO) and Global Mean Temperature Anomaly (GMTA) made during 1984–2005 are utilized to distinguish driving and responding signals of global temperature variability. Estimates of their relative contributions reveal that CO2 ( ∼24%), CH4 ( ∼19%) and volcanic aerosols ( ∼23%) are the primary contributors to the observed variations in GMTA [Global Mean Temperature Anomaly]. While UV ( ∼9%) and ENSO ( ∼12%) act as secondary drivers of variations in the GMTA, the remaining play a marginal role in the observed recent global temperature variability. Interestingly, ENSO and GMTA mutually drive each other at varied time lags. …[A]ll the constituents of natural forcings together seem to make contributions equal to the greenhouse gases in the context of recent global temperature variability.[76% of changes global temperatures are not driven by CO2. Water vapor and clouds, the dominant contributors to the greenhouse effect, are oddly excluded from consideration in this study.]
Abbot and Marohasy, 2017 The largest deviation between the ANN [artificial neural network] projections and measured temperatures for six geographically distinct regions was approximately 0.2 °C, and from this an Equilibrium Climate Sensitivity (ECS) of approximately 0.6 °C [for a doubling of CO2 from 280 ppm to 560 ppm plus feedbacks] was estimated. This is considerably less than estimates from the General Circulation Models (GCMs) used by the Intergovernmental Panel on Climate Change (IPCC), and similar to estimates from spectroscopic methods. … The proxy measurements suggest New Zealand’s climate has fluctuated within a band of approximately 2°C since at least 900 AD, as shown in Figure 2. The warming of nearly 1°C since 1940 falls within this band. The discrepancy between the orange and blue lines in recent decades as shown in Figure 3, suggests that the anthropogenic contribution to this warming could be in the order of approximately 0.2°C. [80% of the warming since 1940 may be due natural factors]. … Importantly, an upward trend is generally apparent for both the proxy measurements and the ANN model projection for the 20th century. This would suggest that the increase in temperature over the last 100 years can be largely attributed to natural phenomena.
(press release) [O]ur new technical paper in GeoResJ (vol. 14, pages 36-46) will likely be ignored. Because after applying the latest big data technique to six 2,000 year-long proxy-temperature series we cannot confirm that recent warming is anything but natural – what might have occurred anyway, even if there was no industrial revolution. … [E]ven if there had been no industrial revolution and burning of fossil fuels, there would have still been warming through the twentieth century – to at least 1980, and of almost 1°C.
Cloud/Aerosol Climate Influence (10)
Stozhkov et al., 2017 One of the most important problems facing humanity is finding the physical mechanism responsible for global climate change, particularly global warming on the Earth. … Summation of these periodicities for the future (after 2015) allows us to forecast the next few decades. The solid heavy line in Fig. 1 shows thatcooling (a drop in ΔT values) is expected in the next few decades. … Figure 2 shows the dependence between the annual average changes ΔT in the global temperature in the near-surface air layer and charged particle flux N in the interval of altitudes from 0.3 to 2.2 km. We can see there is a connection between values ΔТ [temperature] and N [charged particle flux]: with an increase in cosmic ray flux N, the values of changes of global temperature decrease. This link is expressed by the relation ΔT = –0.0838N + 4.307 (see the dashed line in Fig. 2), where the ΔT values are given in °C, and the N values (in particle/min units) are related to the charged particle flux measured at an altitude of 1.3 km. The correlation coefficient of the line with the experimental data is r = –0.62 ± 0.08. … Our results could be connected with the mechanism of charged particle fluxes influencing the Earth’s climate; it includes, first of all, the effect charged particles have on the accelerated formation of centers of water vapor condensation, and thus on the increase in global cloud cover. The total cloud cover is directly connected with the global temperature of the near surface air layer.
Tang et al., 2017The results show that aerosol direct effect cannot fully explain the decadal variations in the global radiation over China between 1980 and 2010, thoughit has a considerable effect on global radiation climatology. There are significant differences between the trends of clear-sky global radiation impacted by aerosols and those of all-sky global radiation impacted by aerosols and clouds, and the correlation coefficient for the comparison is very low. Therefore, the variations in all-sky global radiation over China are likely to be due to changes in cloud properties and to interactions between clouds and aerosols.
Glotfelty and Zhang, 2017Enhancements in cloud formation in the Arctic and Southern Ocean and increases of aerosol optical depth (AOD) in central Africa and South Asia dominate the change in surface radiationin both scenarios [during 2050 – 2100], leading to global average dimming of 1.1 W m−2 and 2.0 W m−2 in the RCP4.5 and RCP8.5 scenarios, respectively. Declines in AOD [aerosol optical depth], cloud formation, and cloud optical thickness from reductions of emissions of primary aerosols and aerosol precursors under RCP4.5 result in near surface warming of 0.2 °C from a global average increase of 0.7 W m−2 in surface downwelling solar radiation. This warming leads to a weakening of the Walker Circulation in the tropics, leading to significant changes in cloud and precipitation that mirror a shift in climate towards the negative phase of the El Nino Southern Oscillation. [Cloud and aerosols dominate the change in surface solar radiation, overwhelming the effects of anthropogenic CO2 emissions.]
Solomon et al., 2017A number of feedbacks are found that damp the warming effect of the clouds. Thin mixed-phase clouds increase the downward longwave fluxes by 100 W m−2, but upward daytime surface longwave fluxes increase by 20 W m−2 (60 W m−2 at night) and net shortwave fluxes decrease by 40 W m−2 (partially due to a 0.05 increase in surface albedo), leaving only 40 W m−2 available for melt. This 40 W m−2 is distributed between the turbulent and conductive ground fluxes, so it is only at times of weak turbulent fluxes (i.e., at night or during melt) that this energy goes into the conductive ground flux, providing energy for melt. From these results it is concluded that it is the integrated impact of the clouds over the diurnal cycle (the preconditioning of the snowpack by the clouds at night) that made melt possible during this 3-day period. These findings are extended to understand the pattern of melt observed over the GIS. … Mixed-phase clouds are common at Summit (Shupe et al. 2013) and play a critical role in the Arctic surface energy balance(Shupe and Intrieri 2004), radiatively warming the highly reflective surface at Summit year-round(Miller et al. 2015).
Nicolas et al., 2017 During the short Antarctic summer, strong onshore winds may by themselves raise the ice sheet’s surface temperature (Ts) up to the melting point (through exchange of sensible heat), especially at low elevations. However, Ts [surface temperature] is ultimately controlled by the full surface energy budget (SEB), being the net of radiative (short- and longwave) and turbulent (sensible and latent) heat fluxes. Clouds exert an important influence on the SEB by modulating the radiative fluxes, primarily by enhancing downwelling longwave radiation and attenuating incoming solar radiation. In particular, low-level liquid-bearing clouds can have a determinant role in either causing or prolonging melting conditions over ice sheets. … Positive (anticyclonic) geopotential height anomalies in the South Pacific, such as those observed in January 2016, are a typical signature of El Niño teleconnections, as seen both in observations and climate model simulations. This type of atmospheric pattern promotes warm air advection to the Ross sector, which explains why surface melt in this area tends to be associated with El Niño-like conditions. [CO2 not mentioned as a factor in West Antarctica ice melt]
Scott et al., 2017Clouds are an essential parameter of the surface energy budget influencing the West Antarctic Ice Sheet (WAIS) response to atmospheric warming and net contribution to global sea level rise. … Owing to perennial high-albedo snow and ice cover, cloud infrared emission dominates over cloud solar reflection and absorption leading to a positive net all-wave cloud radiative effect (CRE) at the surface …The annual-mean CRE [cloud radiative effect] at the WAIS [West Antarctic Ice Sheet] surface is 34 W m−2, representing a significant cloud-induced warming of the ice sheet. … In summer, clouds warm the WAIS by 26 W m−2, on average, despite maximum offsetting shortwave CRE.
Ott et al., 2017Understanding the earth’s energy balance is key to understanding global warming. The incoming solar radiation, and hence the energy received, is influenced by absorption and reflection processes during its travel through the atmosphere. Of particular interest is the effect of clouds on the reflection of solar radiation compared to a clear-sky situation, known as the cloud radiative effect (CRE). … Using the pre-industrial control run of the CMIP5 models for all BSRN sites, an overall annual variability in clear-sky radiation of 6.1 W/m2 between the 5th and 95th percentile was found. Extreme values reach up to 20 W/m2 in annual variability.
Yamasoe et al., 2017We analyzed the variability of downward solar irradiance reaching the surface at São Paulo city, Brazil, and estimated the climatological aerosol and cloud radiative effects. Eleven years of irradiance were analyzed, from 2005 to 2015. … Results showed that,climatologically, clouds can be 4 times more effective than aerosols. The cloud shortwave radiative effect presented a maximum reduction of about −170 W m−2 in January and a minimum in July, of −37 W m−2. [T]he 24 h radiative effect due to aerosol only was estimated to be −50 W m−2. Throughout the rest of the year, the mean aerosol effect was around −20 W m−2 and was attributed to local urban sources.
Jones et al., 2017 The net radiative forcing from clouds can be as high as four times as large as the radiative forcing from a doubling of CO2 levels in the atmosphere, which needs to be taken into account when ascribing coral bleaching events in the GBR solely to GHG warming. … The growth of CCN [cloud condensation nuclei] can lead to the formation of low level cloud (LLC) such as cumulous and stratocumulus clouds, decreasing solar radiation and sea surface temperatures (SST), thus influencing climate as a negative climate feedback.
Wong and Minnett, 2017 [T]he difference between cloudy and clear sky spectra has a much higher magnitude and broader spectral range compared to the difference between a 2 X CO2 or 3 X CO2 and clear sky spectra. Clouds generate a radiance difference of up to ~40 Wm-2 sr-1 (cm-1)-1, about 8 times that of the 3 X CO2 spectrum (5 mWm-2 sr-1 (cm-1)-1. Thus, we expect to see a much larger change in the heating rates for cloud forcing. The bottom plot of Figure 5 shows that the cloud forcing produces a total difference in absorbed radiation of ~9 Wm-2 sr-1 at the surface whereas 3 X CO2 forcing only gives 500 mWm-2 sr-1. In addition, CO2 forcing is observed to vary the top 0.01 mm of the TSL while the effect of cloud forcing extends much deeper (to about 0.09 mm). Thus, in comparison with greenhouse gas radiative forcing, cloud forcing amplifies the vertical temperature profile in the TSL [top surface layer] resulting in signals that are detectable in M-AERI sea-surface emission spectra. … Detecting changes in the downwelling IR irradiance resulting from increases in anthropogenic GHGs is difficult since consistent data sets with long timeframes and exceptionally good calibration are required to produce a significantly detectable signal, expected to be <1 Wm-2 over several decades (Levitus et al, 2012). Seeking indirect evidence of the effects of increasing IR radiation incident at the sea surface through changes in the SST is also very challenging. Ohring et al. (2005) have determined that an accuracy of 0.1 K and a stability of 0.04 K decade-1 are required for satellite-derived SST fields to detect climate change signals, and the situation is rendered more challenging by the sampling errors that are introduced by the presence of clouds (Liu et al., 2017; Liu & Minnett, 2016).
Volcanic/Tectonic Climate Influence (6)
Kelley, 2017Volcanology: Vulcan rule beneath the sea … Over 70% of the volcanism on Earth occurs beneath an ocean veil. … Satellite data reveal more than 100,000 extinct and active seamounts that mark sites of past and present volcanic activity. [O]bservations imply that submarine volcanoes may play an important role in cycling carbon and sulfur through the Earth, oceans and atmosphere. … [T]he flux of volatiles from these systems remains poorly quantified and the significance of these volcanoes as part of the deep carbon and sulfur cycles on a global scale is unknown.
Viterito, 2017 The Correlation of Seismic Activity and Recent Global Warming (CSARGW) demonstrated that increasing seismic activity in the globe’s high geothermal flux areas (HGFA) is strongly correlated with global temperatures (r=0.785) from 1979-2015. The mechanism driving this correlation is amply documented and well understood by oceanographers and seismologists. Namely, increased seismic activity in the HGFA (i.e., the mid-ocean’s spreading zones) serves as a proxy indicator of higher geothermal flux in these regions. The HGFA include the Mid-Atlantic Ridge, the East Pacific Rise, the West Chile Rise, the Ridges of the Indian Ocean, and the Ridges of the Antarctic/Southern Ocean. This additional mid-ocean heating causes an acceleration of oceanic overturning and thermobaric convection, resulting in higher ocean temperatures and greater heat transport into the Arctic. This manifests itself as an anomaly known as the “Arctic Amplification,” where the Arctic warms to a much greater degree than the rest of the globe. Applying the same methodology employed in CSARGW, an updated analysis through 2016 adds new knowledge of this important relationship while strengthening support for that study’s conclusions. The correlation between HGFA seismic frequency and global temperatures moved higher with the addition of the 2016 data: the revised correlation now reads 0.814, up from 0.785 for the analysis through 2015. This yields a coefficient of determination of .662, indicating thatHGFA [high geothermal flux area] seismicity accounts for roughly two-thirds of the variation in global temperatures since 1979.
Smirnov et al., 2017 Here we use the Wiener-Granger causality approach along with well-established cross-correlation analysis to investigate the causal relationship between solar activity, volcanic forcing, and climate as reflected in well-established Intertropical Convergence Zone (ITCZ) rainfall proxy records from Yok Balum Cave, southern Belize. Our analysis reveals a consistent influence of volcanic activity on regional Central American climate over the last two millennia. However, the coupling between solar variability and local climate varied with time, with a regime shift around 1000–1300 CE after which the solar-climate coupling weakened considerably.
Huhtemaa and Helama, 2017 Large tropical volcanic eruptions can have considerable impact on climates and societies far away from the physical source of the eruption. … [C]ooling caused by volcanism led to severe crop failures in seventeenth-century Ostrobothnia, Finland. … [M]ore than half of the agricultural crises in the study region can be associated with cooling caused by volcanism. …[A]gricultural crises were followed by impoverishment and hunger.
Slawinska and Robock, 2017 We evaluate different hypotheses of the origin of the Little Ice Age, focusing on the long-term response of Arctic sea ice and oceanic circulation to solar and volcanic perturbations. …We argue that large volcanic forcing is necessary to explain the origin and duration of Little-Ice-Age-like perturbations in the Last Millennium Ensemble. Other forcings might play a role as well. In particular, prolonged fluctuations in solar irradiance associated with solar minima potentially amplify the enhancement of the magnitude of volcanically-triggered anomalies of Arctic sea ice extent.
Herndon, 2017 Climate models evaluated by the IPCC are based on the assumptions that: (1) Heat derived from the Sun is constant; (2) Heat derived from within the Earth is constant; and, (3) Anthropogenic contributions to atmospheric warming stem mainly from heat retention by CO2 and other greenhouse gases. Geophysical evidence of variable earthquake activity and geological evidence of variable submarine volcanism presented here indicate that heat added to the oceans is variable. The increasing occurrences of earthquakes of magnitudes ≥6 and ≥7 during 1973-2015 indicate volcanic activity is increasing and therefore Earth-heat, as well as volcanic CO2 additions, is increasing. Moreover, increased heat additions to the ocean act to decrease seawater solubility of CO2, ultimately releasing additional CO2 to the atmosphere. Furthermore, increasing submarine volcanic activity implies increasing ocean acidification, but data are insufficient to make quantitative estimates. The validity of IPCC evaluations and assessments depends critically upon due consideration being given to all processes that potentially affect Earth’s heat balance. In addition to the geological and geophysical processes discussed, the scientific community, including IPCC scientists, has turned a blind eye to ongoing tropospheric geoengineering that in recent years has been occurring on a near-daily, near-global basis. Tropospheric aerosolized particulates, evidenced as coal fly ash, inhibit rainfall, heat the atmosphere, and cause global warming. Evidence obtained from an accidental air-drop release indicates efforts to melt glacial ice and enhance global warming. By ignoring ongoing tropospheric geoengineering, IPCC assessments are compromised, as is the moral authority of the United Nations.
Challenging The Theoretical CO2 Greenhouse Effect As Temperature Driver (15)
Hertzberg et al., 2017 This study examines the concept of ‘greenhouse gases’ and various definitions of the phenomenon known as the ‘Atmospheric Radiative Greenhouse Effect’. The six most quoted descriptions are as follows: (a) radiation trapped between the Earth’s surface and its atmosphere; (b) the insulating blanket of the atmosphere that keeps the Earth warm; (c) back radiation from the atmosphere to the Earth’s surface; (d) Infra Red absorbing gases that hinder radiative cooling and keep the surface warmer than it would otherwise be – known as ‘otherwise radiation’; (e) differences between actual surface temperatures of the Earth (as also observed on Venus) and those based on calculations; (f) any gas that absorbs infrared radiation emitted from the Earth’s surface towards free space. It is shown that none of the above descriptions can withstand the rigours of scientific scrutiny when the fundamental laws of physics and thermodynamics are applied to them.
Blaauw, 2017This paper demonstrates thatglobalwarming can be explained without recourse to the greenhouse theory. This explanation is based on a simple model of the Earth’s climate system consisting of three layers: the surface, a lower and an upper atmospheric layer. The distinction between the atmospheric layers rests on the assumption that the latent heat from the surface is set free in the lower atmospheric layer only. The varying solar irradiation constitutes the sole input driving the changes in the system’s energy transfers. All variations in the energy exchanges can be expressed in terms of the temperature variations of the layers by means of an energy transfer matrix. It turns out that the latent heat transfer as a function of the temperatures of the surface and the lower layer makes this matrix next to singular. The near singularity reveals a considerable negative feedback in the model which can be identified as the ‘Klimaversta¨rker’ presumed by Vahrenholt and Lu¨ning. By a suitable, yet realistic choice of the parameters appearing in the energy transfer matrix and of the effective heat capacities of the layers, the model reproduces the global warming: the calculated trend in the surface temperature agrees well with the observational data from AD 1750 up to AD 2000.
Nikolov and Zeller, 2017 Our analysis revealed that GMATs [global mean annual temperatures] of rocky planets with tangible atmospheres and a negligible geothermal surface heating can accurately be predicted over a broad range of conditions using only two forcing variables: top-of-the-atmosphere solar irradiance and total surface atmospheric pressure. The hereto discovered interplanetary pressure-temperature relationship is shown to be statistically robust while describing a smooth physical continuum without climatic tipping points. This continuum fully explains the recently discovered 90 K thermal effect of Earth’s atmosphere. The new model displays characteristics of an emergent macro-level thermodynamic relationship heretofore unbeknown to science that has important theoretical implications. A key entailment from the model is that the atmospheric ‘greenhouse effect’ currently viewed as a radiative phenomenon is in fact an adiabatic (pressure-induced) thermal enhancement analogous to compression heating and independent of atmospheric composition. Consequently, the global down-welling long-wave flux presently assumed to drive Earth’s surface warming appears to be a product of the air temperature set by solar heating and atmospheric pressure. In other words, the so-called ‘greenhouse back radiation’ is globally a result of the atmospheric thermal effect rather than a cause for it. … The down-welling LW radiation is not a global driver of surface warming as hypothesized for over 100 years but a product of the near-surface air temperature controlled by solar heating and atmospheric pressure … The hypothesis that a freely convective atmosphere could retain (trap) radiant heat due its opacity has remained undisputed since its introduction in the early 1800s even though it was based on a theoretical conjecture that has never been proven experimentally.
Allmendinger, 2017 The cardinal error in the usual greenhouse theory consists in the assumption that photometric or spectroscopic IR-measurements allow conclusions about the thermal behaviour of gases, i.e., of the atmosphere. They trace back to John Tyndall who developed such a photometric method already in the 19th century. However, direct thermal measurement methods have never been applied so far. Apart from this, at least twenty crucial errors are revealed which suggest abandoning the theory as a whole. In spite of its obvious deficiencies, this theory has so far been an obstacle to take promising precautions for mitigating the climate change. They would consist in a general brightening of the Earth surface, and in additional measures being related to this. However, the novel effects which were found by the author, particularlythe absorption of incident solar-light by the atmosphere as well as its absorption capability of thermal radiation, cannot be influenced by human acts.
Munshi, 2017 A key relationship in the theory of anthropogenic global warming (AGW) is that between annual fossil fuel emissions and annual changes in atmospheric CO2. The proposed causation sequence is that annual fossil fuel emissions cause annual changes in atmospheric CO2 which in turn intensifies the atmosphere’s heat trapping property. … A testable implication of the proposed causation sequence is that annual changes in atmospheric CO2 must be related to annual fossil fuel emissions at an annual time scale. This work is a test of this hypothesis. We find that detrended correlation analysis of annual emissions and annual changes in atmospheric CO2 does not support the anthropogenic global warming hypothesis because no evidence is found that changes in atmospheric CO2 are related to fossil fuel emissions at an annual time scale.
Reinhart, 2017 Our results permit to conclude that CO2 is a very weak greenhouse gas and cannot be accepted as the main driver of climate change. … The assumption of a constant temperature and black body radiation definitely violates reality and even the principles of thermodynamics. … [W]e conclude that the temperature increases predicted by the IPCC AR5 lack robust scientific justification. … A doubling [to 800 ppm] of the present level of CO2 [400 ppm] results in [temperature change] < 0.24 K. … [T]he scientific community must look for causes of climate change that can be solidly based on physics and chemistry. … The observed temperature increase since pre-industrial times is close to an order of magnitude higher than that attributable to CO2.
Lightfoot and Mamer, 2017Robust scientific evidence shows the sun angle controls water vapour content of the atmosphere, the main component of back radiation, as it cycles annually. Water vapour content measured as the ratio of the number of water molecules to CO2 molecules varies from 1:1 near the Poles to 97:1 in the Tropics. The effect of back radiation [water vapour] on Earth’s atmosphere is up to 200 times larger than that of CO2 and works in the opposite direction. Thus, if CO2 has any effect on atmospheric temperature and climate change we show it is negligible. Consequently, current government policies to control atmospheric temperature by limiting consumption of fossil fuels will have negligible effect. Measured data reported in IPCC report Climate Change 2013: The Physical Science Basis (AR5) indicate increased water vapour content of the atmosphere is the cause of the 0.5℃ temperature increase from the mid-1970s to 2011.
Pontius, 2017Using a Climate Sensitivity best estimate of 2°C,the increase in [global] temperature resulting from a doubling of atmospheric CO2 is estimated at approximately 0.009°C/yr which is insignificant compared to natural variability. … Estimates of climate sensitivity differ widely suggesting that this characteristic of the climate system is not well-understood (Schwartz et al., 2014). Judgments and arbitrary choices must be made in model construction to apply fundamental laws to describe turbulent fluid flow. The large size and complexity of the atmosphere prohibit the direct application of general theory. In general, ensemble model forecasts have been found unreliable for long-term climate prediction (Green and Armstrong, 2007, Mihailović et al., 2014). …Historical evidence of a significant increase in surface temperatures due to increases in atmospheric CO2 is absent from these data. [C]limate models are useful but limited in their representation of underlying physical processes. Uncertainties and other limitations discussed previously render such models unreliable for long-term global temperatures or local climate change prediction. … If atmospheric CO2 continues to increase at its current rate the small annual temperature increase expected at Riverside will likely be insignificant (e.g. < 0.01°C/yr) compared to natural temperature variability.
Kramm et al., 2017 The planetary radiation balance plays a prominent role in quantifying the effect of the terrestrial atmosphere (spuriously called the atmospheric greenhouse effect). Based on this planetary radiation balance, the effective radiation temperature of the Earth in the absence of its atmosphere of Te ≅ 255 K is estimated. This temperature value is subtracted from the globally averaged near-surface temperature of about ⟨Tns⟩≅ 288 K resulting in ⟨Tns⟩ − Te ≅ 33 K. This temperature difference [33 K] commonly serves to quantify the atmospheric effect. The temperature difference is said to be bridged by optically active gaseous gases, namely H2O (20.6 K); CO2 (7.2 K)… Since the “thought experiment” of an Earth in the absence of its atmosphere does not allow any rigorous assessment of such results, we considered the Moon as a testbed for the Earth in the absence of its atmosphere. […] Based on our findings, we may conclude that the effective radiation temperature yields flawed results when used for quantifying the so-called atmospheric greenhouse effect. … (1) Only a planetary radiation budget of the Earth in the absence of an atmosphere is considered [in the 288 K – 255 K = 33 K “thought experiment” greenhouse effect], i.e., any heat storage in the oceans (if at all existing in such a case) and land masses is neglected. … (2) The assumption of a uniform surface temperature for the entire globe is rather inadequate. … (3) The choice of the planetary albedo of αE=0.30 is rather inadequate… (4) Comparing Te [Earth’s temperature without an atmosphere] with ⟨Tns⟩ [Earth’s globally averaged near surface temperature] is rather inappropriate because the meaning of these temperatures is quite different. The former is based on an energy-flux budget at the surface even though it is physically inconsistent because of the non-uniform temperature distribution on the globe. Whereas the latter is related to globally averaging near-surface temperature observations made at meteorological stations (supported by satellite observations). … (Equation 1.4, [the 288 K – 255 K = 33 K “thought experiment” green house effect]) is based on physically irrelevant assumptions and its results considerably disagree with observations. Consequently, the difference of ΔTae ≅ 33 K [the alleged planetary temperature difference due to the greenhouse effect] lacks adequate physical meaning as do any contributions from optically active gaseous components calculated thereby.
Munshi, 2017 A study of regional temperature reconstructions of the instrumental record 1850-2016 for five global regions is presented. No evidence is found to relate warming of sea surface temperature (SST) in either hemisphere to global emissions. The rate of warming over land in the Northern Hemisphere appears to show some evidence of correlation with global emissions in five of the twelve calendar months but the statistical significance of the correlation could not be verified with station data from the region. No correlation with emissions could be found in regional temperature reconstructions for land in the Southern Hemisphere or for combined land and ocean in either hemisphere. These results taken together do not support the claim that the observed warming in surface temperatures worldwide since the Industrial Revolution is driven by fossil fuel emissions or that observed changes in tropical cyclone characteristics due to rising SST are anthropogenic.
Allmendinger, 2017 Besides a critical discussion of the convenient atmosphere theory profoundly questioning the greenhouse thesis by disclosing several basic errors,the here reported investigation reveals the discovery of direct absorption of shortwave IR-radiation by air. It is part of the incident solar light, but also of artificial light which enables a more exact detection. It is caused by another effect than the one which is responsible for the longer-wave absorption being observed at carbon dioxide, and it is not detectable by IR-spectroscopy since its absorption coefficient is too low. However, it is clearly detectable by means of the here applied apparatus leading to a distinct temperature elevation up to a limiting temperature which depends on the radiative emission. The limiting temperature depends on the gas kind, wherebypractically no difference between air and carbon-dioxide could be found. … Nevertheless, that direct absorption effect [shortwave] which was discovered thanks to this method probably contributes significantly to the warming up of the atmosphere while the warming-up due to carbon-dioxide can be neglected. … But since the direct absorption cannot be influenced, the surface albedo must be focused as the governing factor providing the only [anthropogenic] opportunity to mitigate the climate, or at least the microclimate, by changing colour and structure of the surface, particularly in urban areas. However, a prediction seems not feasible since the global climate is too complex. But the greenhouse theory turns out to be a phantasm delivering the wrong diagnosis for the climate change, and a wrong diagnosis cannot enable a healing.
Smirnov, 2017 It is shown that infrared emission of the atmosphere is determined mostly by atmospheric water. One can separate the flux of outgoing infrared radiation of the atmosphere from that towards the Earth. The fluxes due to rotation-vibration transitions of atmospheric CO2 molecules are evaluated. Doubling of the concentration of CO2 molecules in the atmosphere that is expected over 130 years leads to an increase of the average Earth temperature by (0.4±0.2) K mostly due to the flux towards the Earth if other atmospheric parameters are not varied.
Robertson and Chilingar, 2017 One can summarize our findings as follows:
• The anthropogenic impact on the global atmospheric temperature is negligible, i.e., 5% (Matthews, 1998).
• Changes in the solar irradiation (global temperature) precede the corresponding changes in the carbon dioxide concentration in the atmosphere.
• Any attempt to mitigate undesirable climatic changes using restrictive regulations are condemned to failure, because global forces of nature are at least 4 orders of magnitude greater than the available human controls
Christy and McNider, 2017 We identify and remove the main natural perturbations (e.g. volcanic activity, ENSOs) from the global mean lower tropospheric temperatures (TLT) over January 1979 – June 2017 to estimate the underlying, potentially human-forced trend. The unaltered value is +0.155 K dec−1 while the adjusted trend is +0.096 K dec−1, related primarily to the removal of volcanic cooling in the early part of the record. This is essentially the same value we determined in 1994 (+0.09 K dec−1, Christy and McNider, 1994) using only 15 years of data. If the warming rate of +0.096 K dec−1 represents the net TLT response to increasing greenhouse radiative forcings, this implies that the TLT tropospheric transient climate response (ΔTLT at the time CO2 doubles) is +1.10 ± 0.26 K which is about half of the average of the IPCC AR5 climate models of 2.31 ± 0.20 K. Assuming that the net remaining unknown internal and external natural forcing over this period is near zero, the mismatch since 1979 between observations and CMIP-5 model values suggests that excessive sensitivity to enhanced radiative forcing in the models can be appreciable.
Davis, 2017[I]f anthropogenic CO2 emissions continue at today’s levels or increase in the coming decades, the consequent increasing concentration of CO2 in the atmosphere from anthropogenic sources will have exponentially smaller forcing impact on global temperature. The half-decay of CO2marginal forcing (~337 ppmv) was surpassed in 1980, while the exponential marginal forcing decay constant (~367 ppmv) was exceeded in 1999. At the current atmospheric CO2 concentration, which is approaching 410 ppmv, atmospheric CO2 has lost nearly two-thirds of its cumulative marginal forcing power. … [A]s atmospheric CO2 concentration increases, any unit reductions in atmospheric CO2 concentration that may be achieved by deliberate mitigation of CO2 emissions will yield exponentially smaller reductions of temperature forcing. Diminishing returns in marginal forcing by atmospheric CO2 ensure, therefore, that efforts to mitigate global warming by reducing emissions of CO2, exemplified by carbon sequestration, will become relatively more expensive per unit of climate benefit returned. This consequence of atmospheric physics will increase the cost-benefit ratio of CO2 mitigation policies exponentially, at least insofar as the cost-benefit ratio is limited to climate. … Diminishing returns in the forcing power of atmospheric CO2 as its concentration increases ensure that in a CO2-rich environment like the Phanerozoic climate, large variations in CO2 exert little or negligible effects on temperature. Therefore, decoupling between atmospheric CO2 concentration and temperature is not only demonstrated empirically in Phanerozoic data, but is also expected from first principles. This straightforward consequence of atmospheric physics provides a simple physical explanation for the lack of correlation between atmospheric CO2 concentration and temperature across most of the Phanerozoic.
By continuing to use the site, you agree to the use of cookies. more information
The cookie settings on this website are set to "allow cookies" to give you the best browsing experience possible. If you continue to use this website without changing your cookie settings or you click "Accept" below then you are consenting to this. More information at our Data Privacy Policy
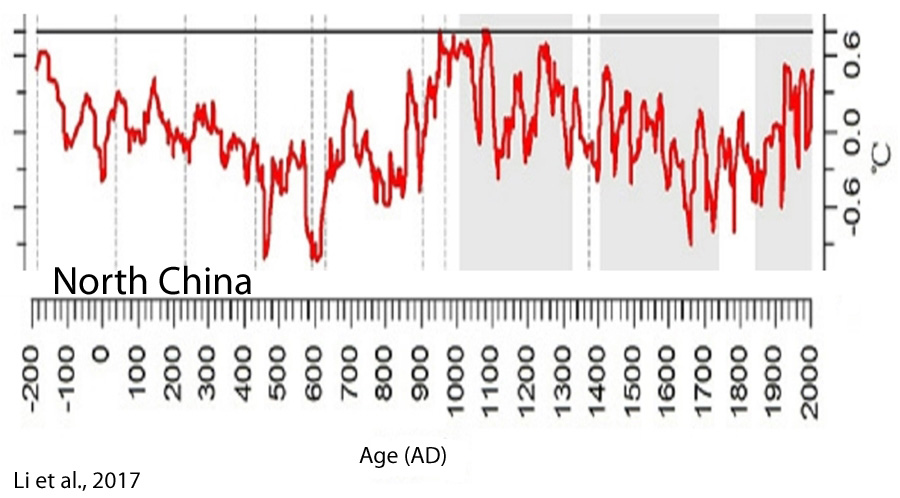
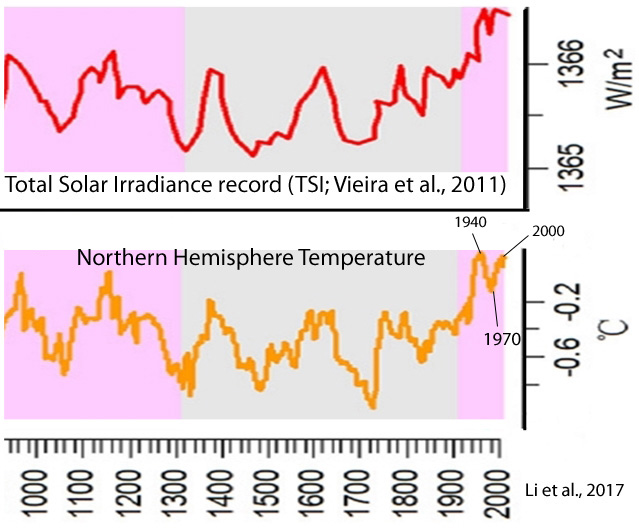
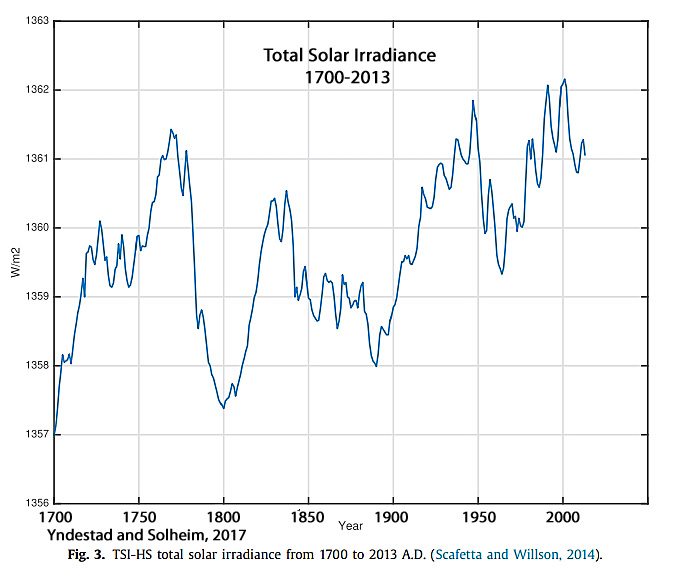
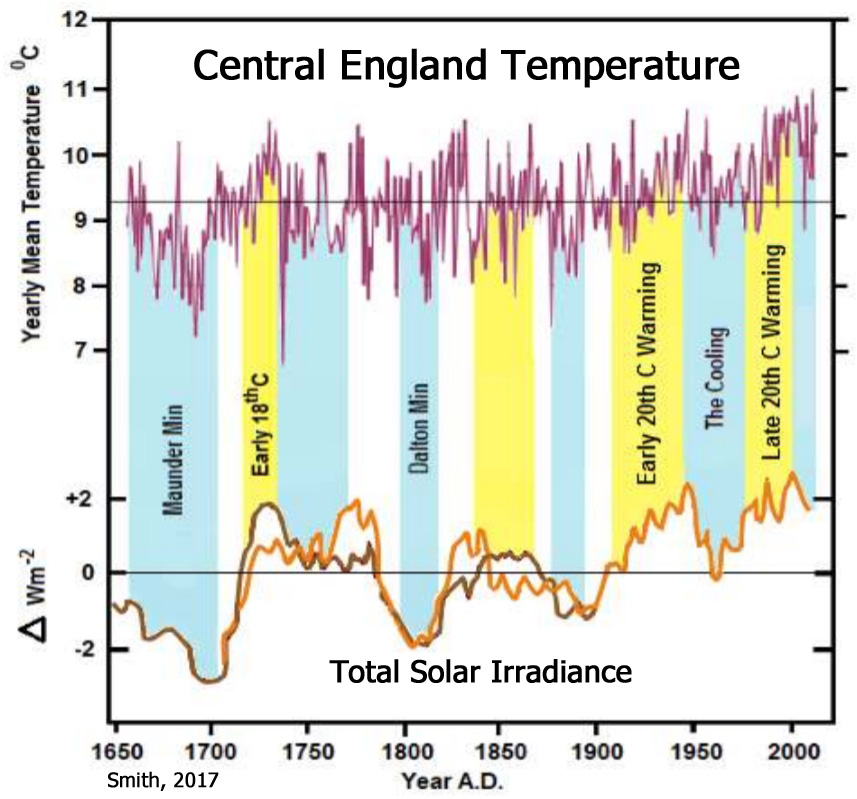
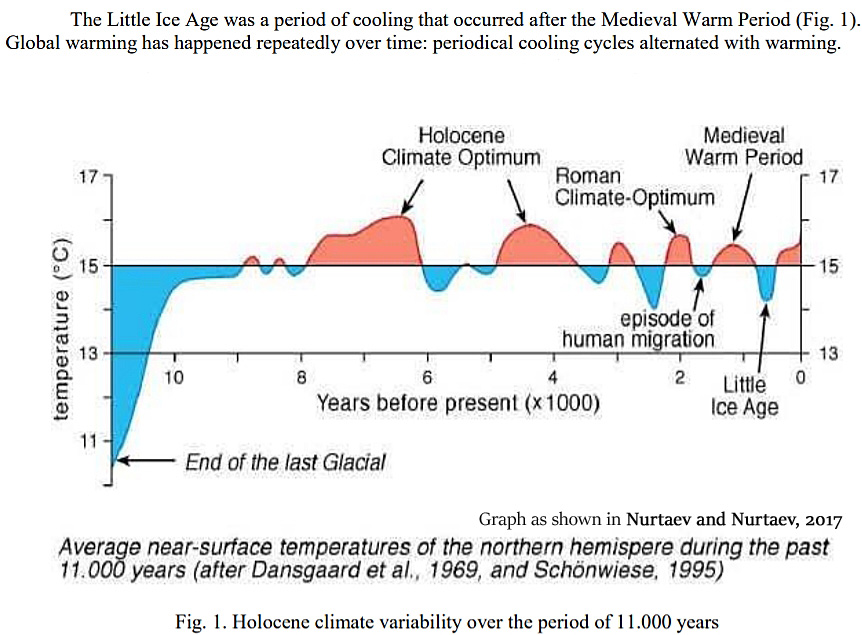
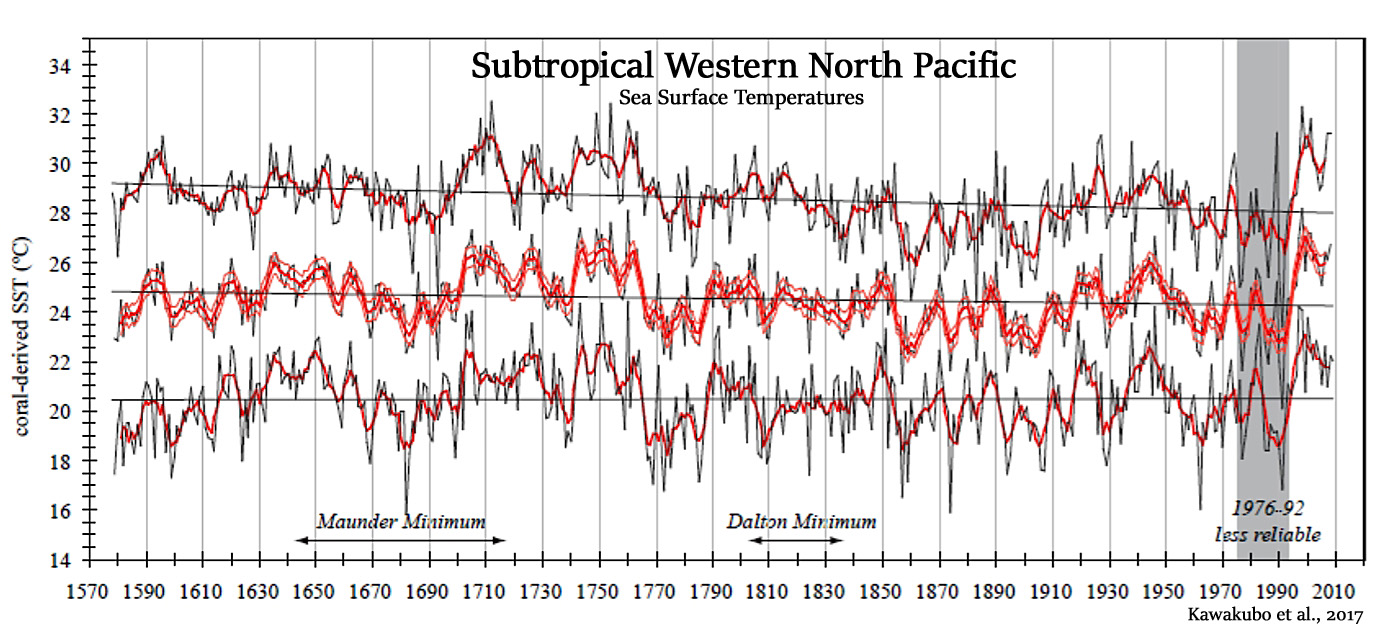
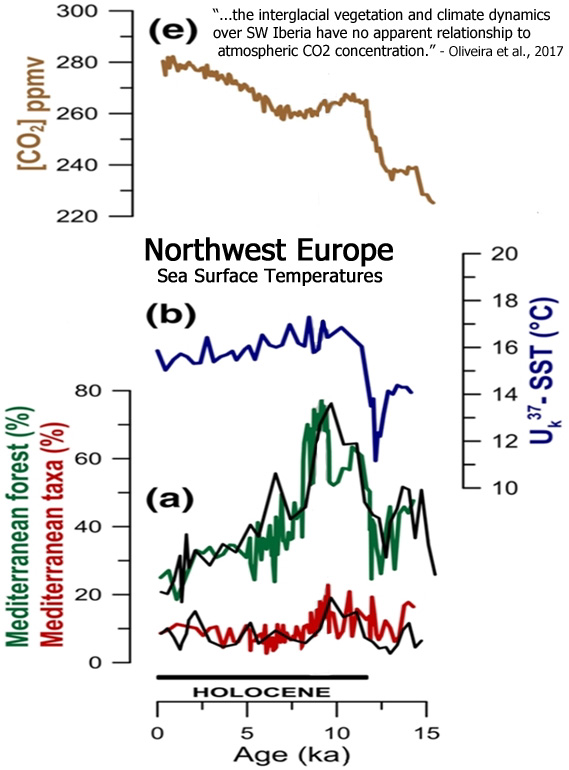


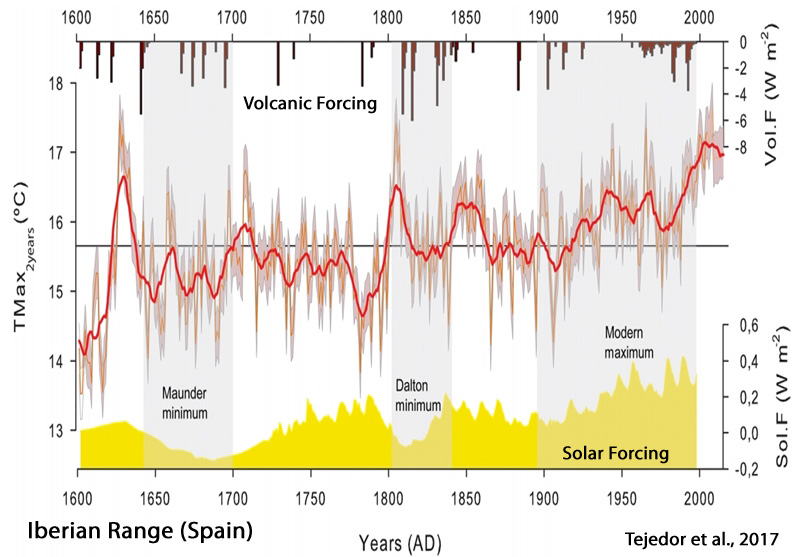

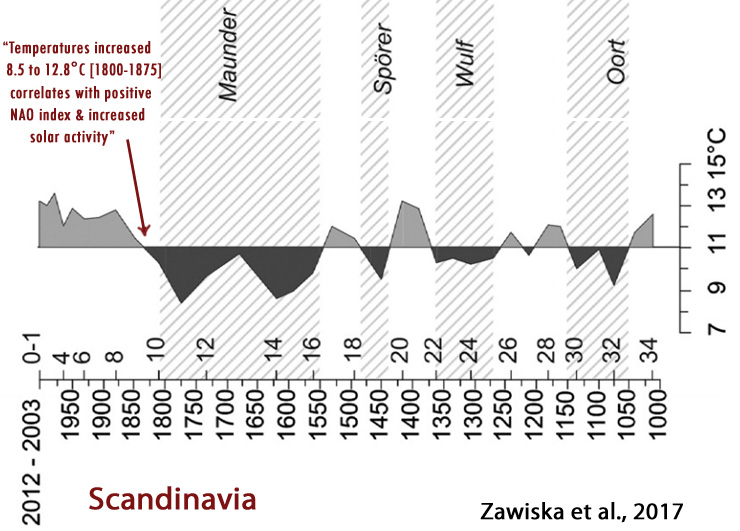


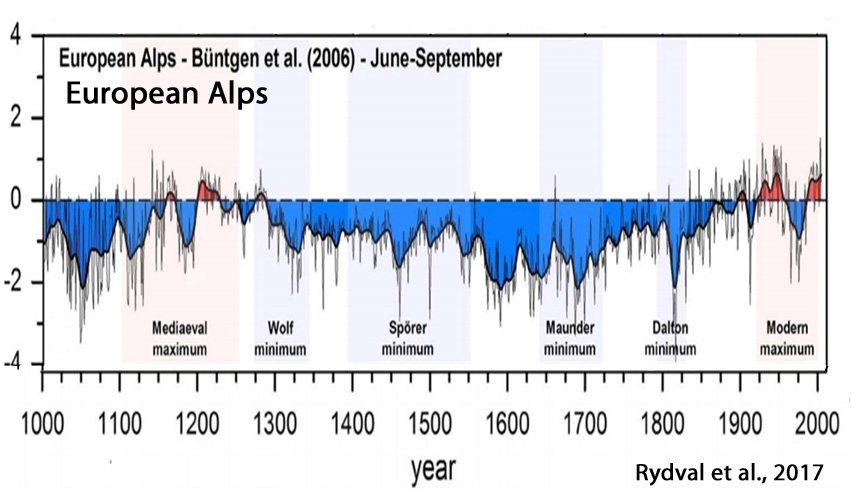
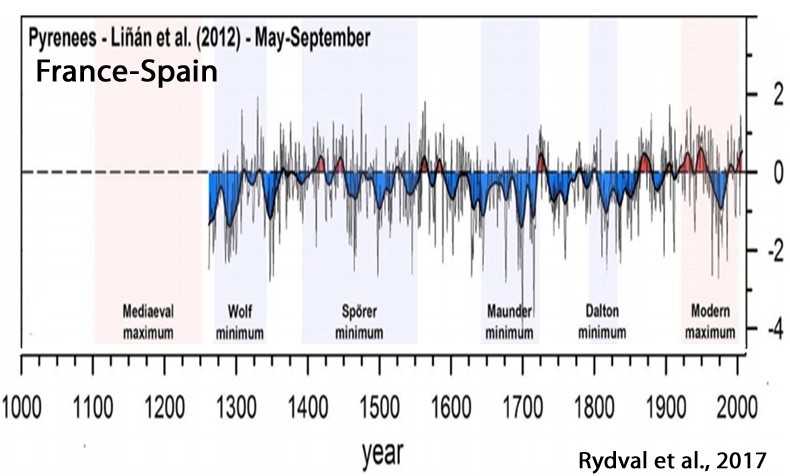
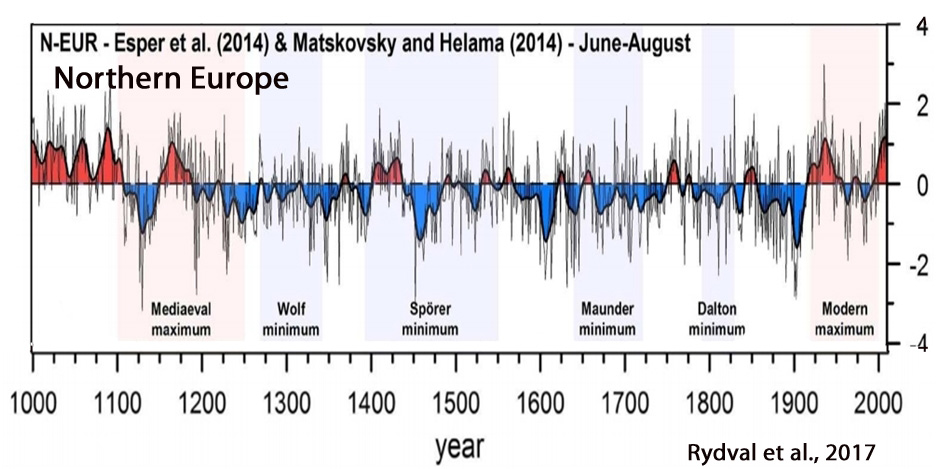
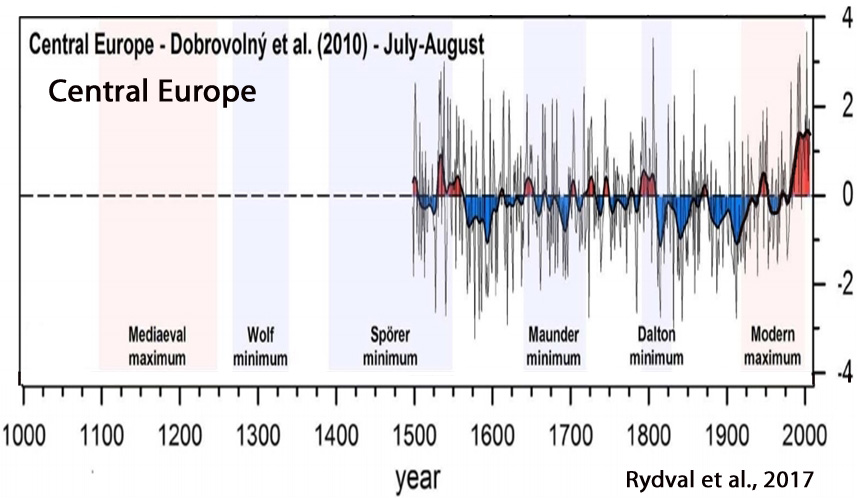
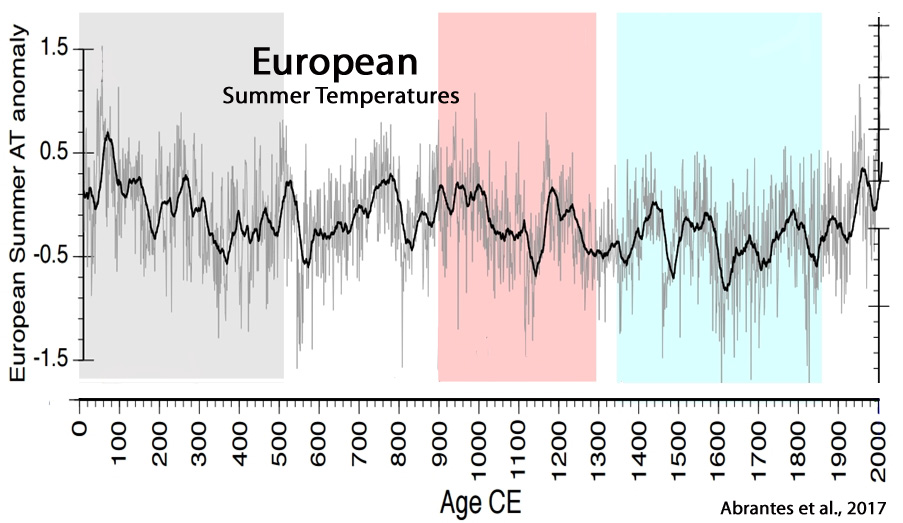
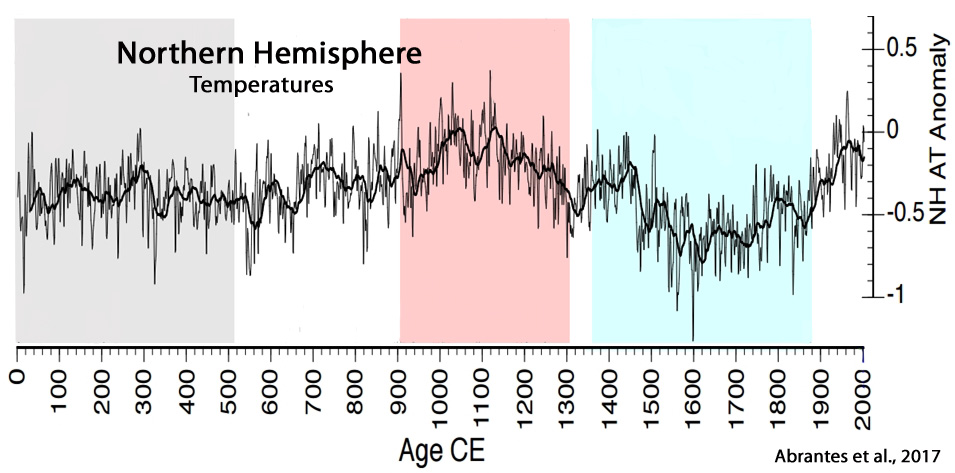
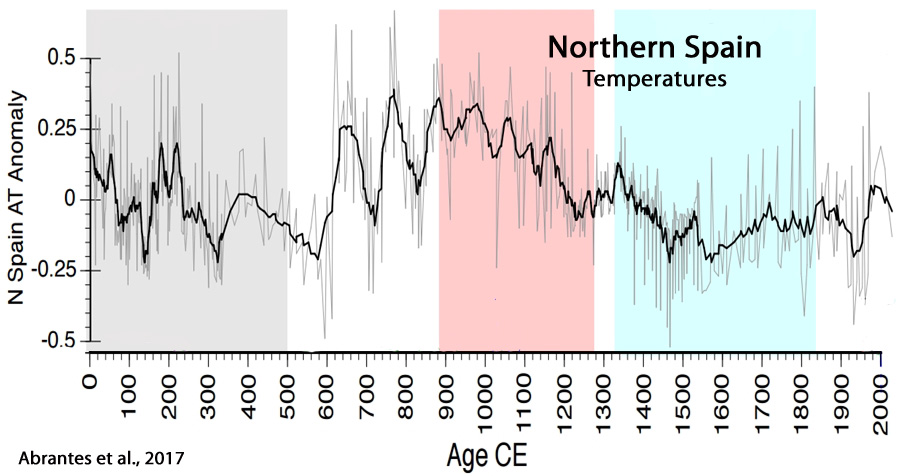
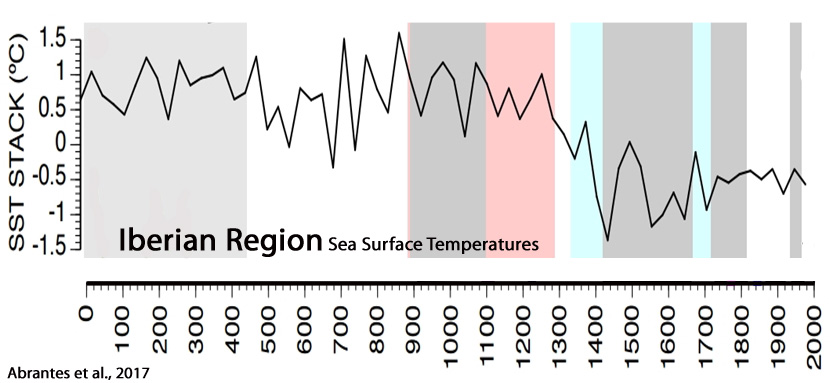
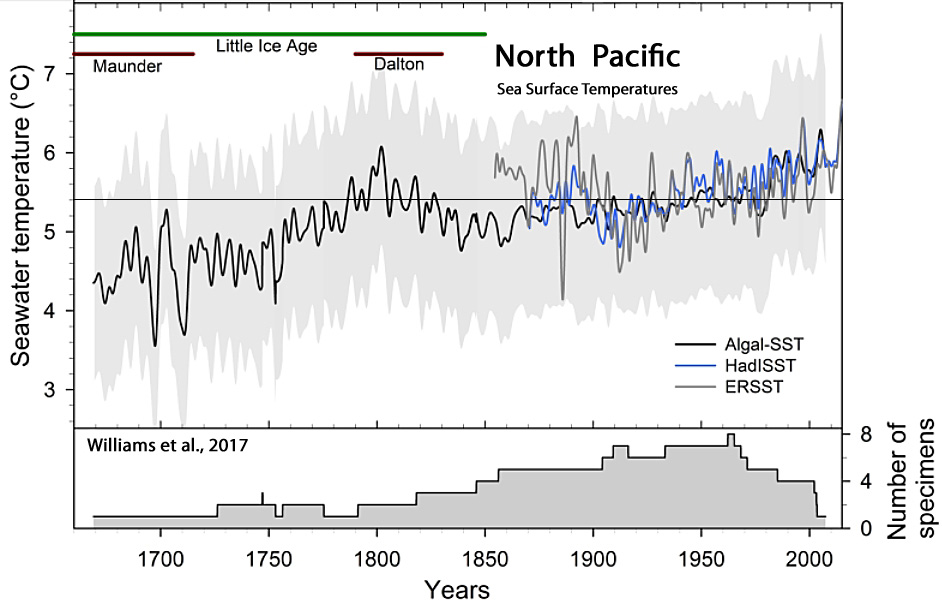
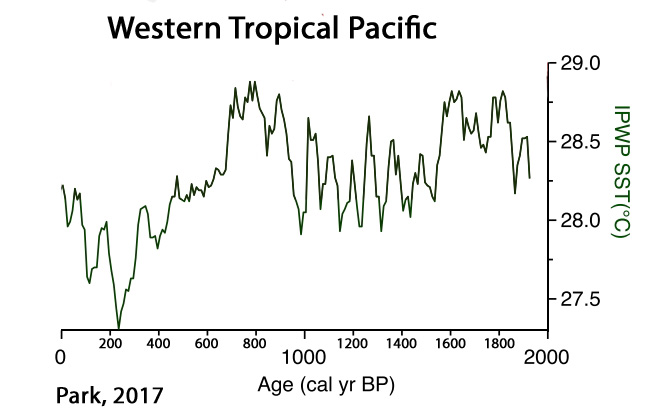
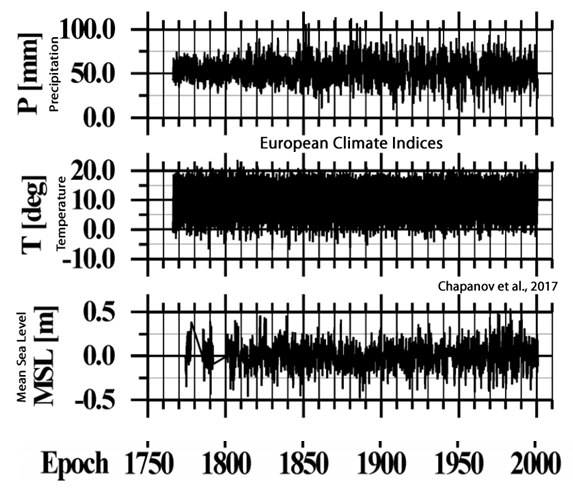
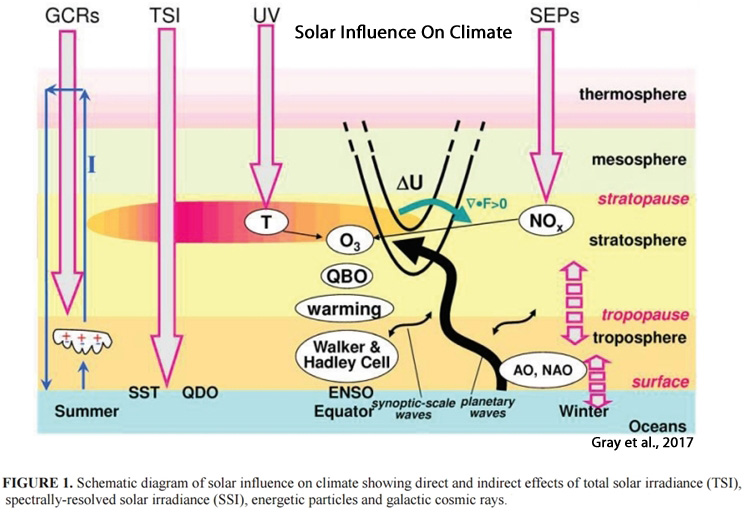
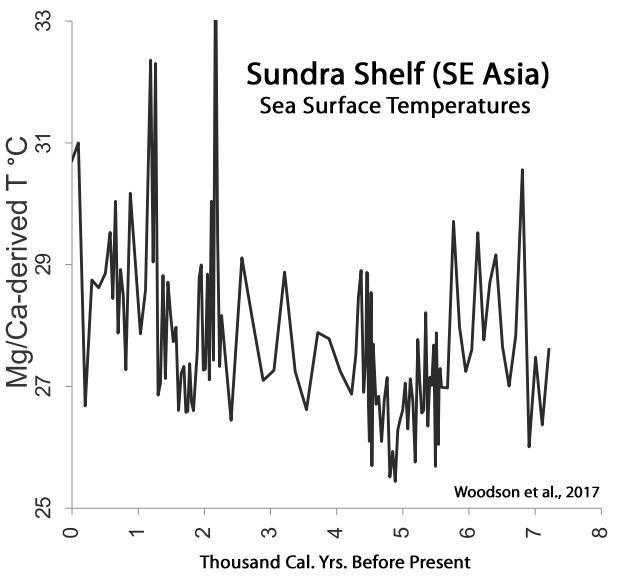

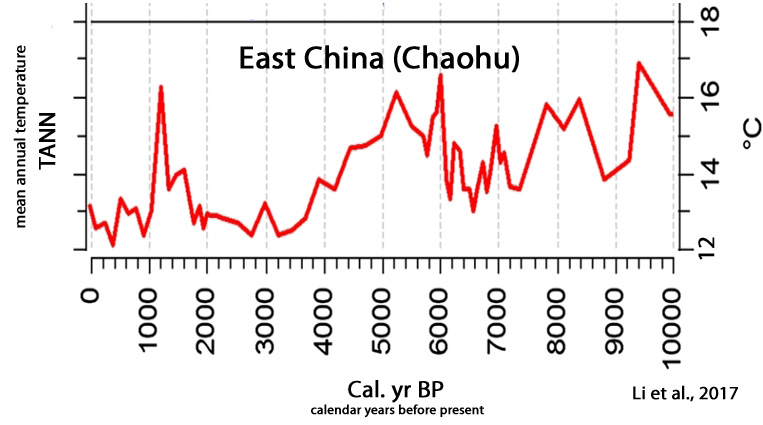
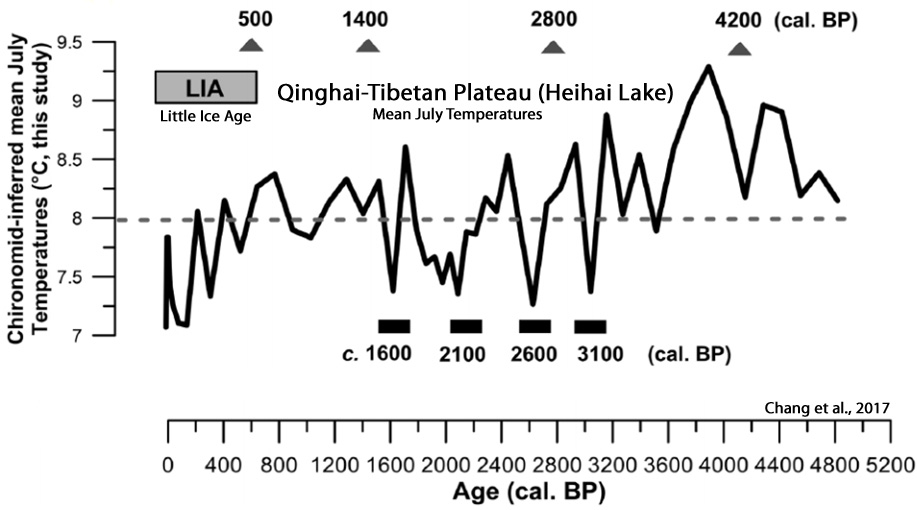
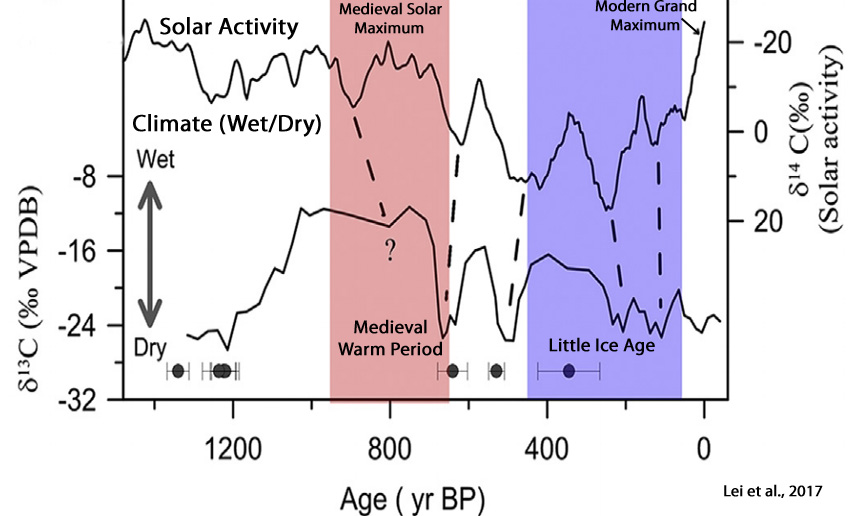
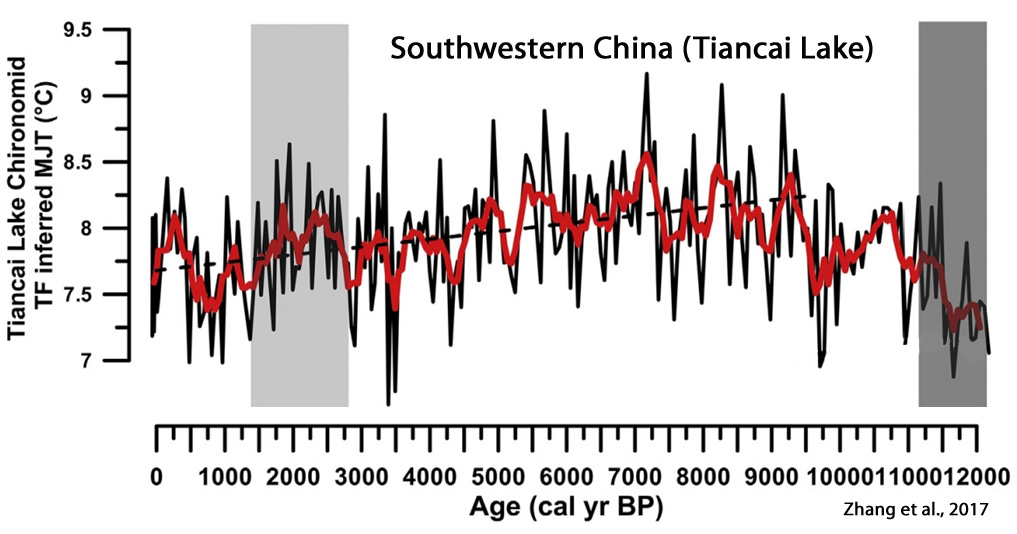
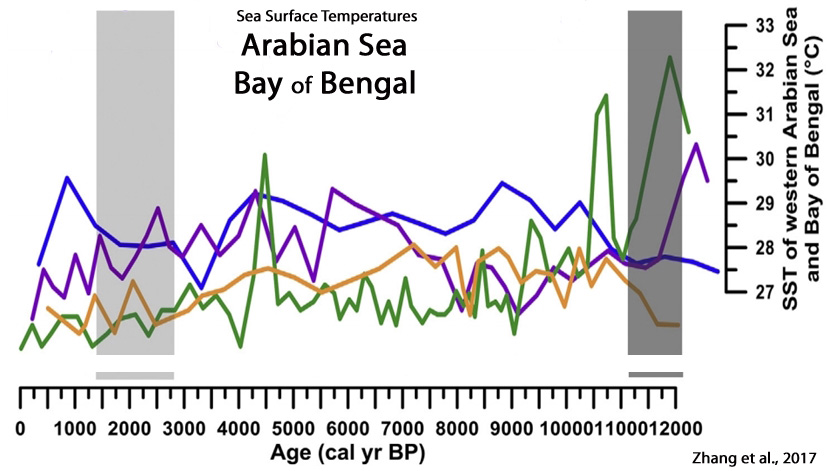
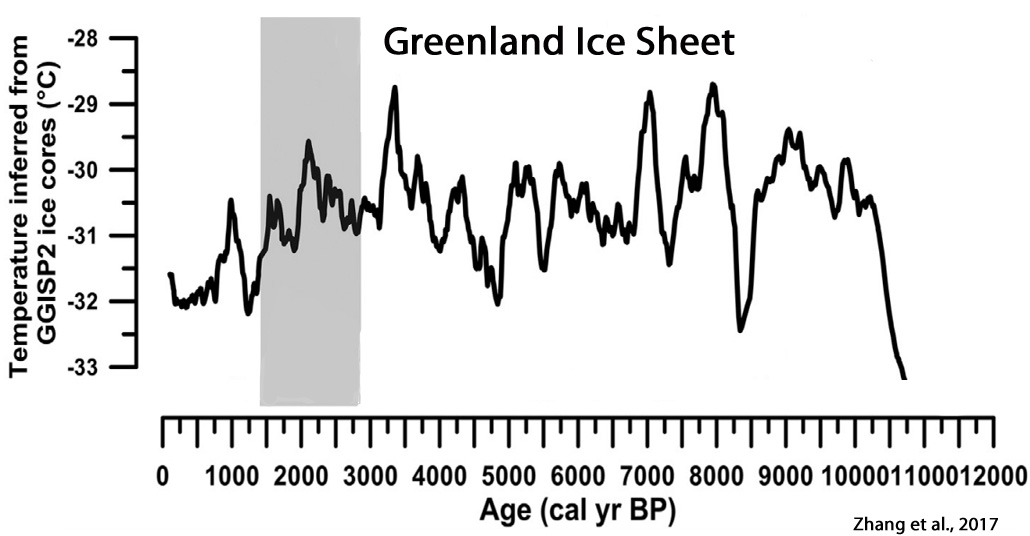


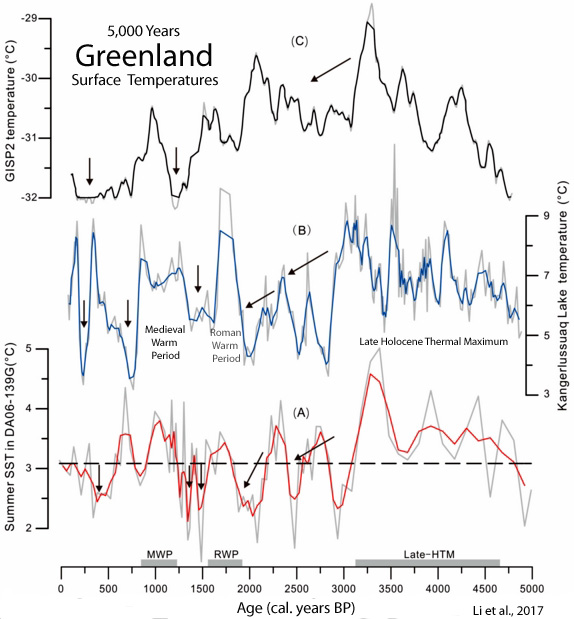
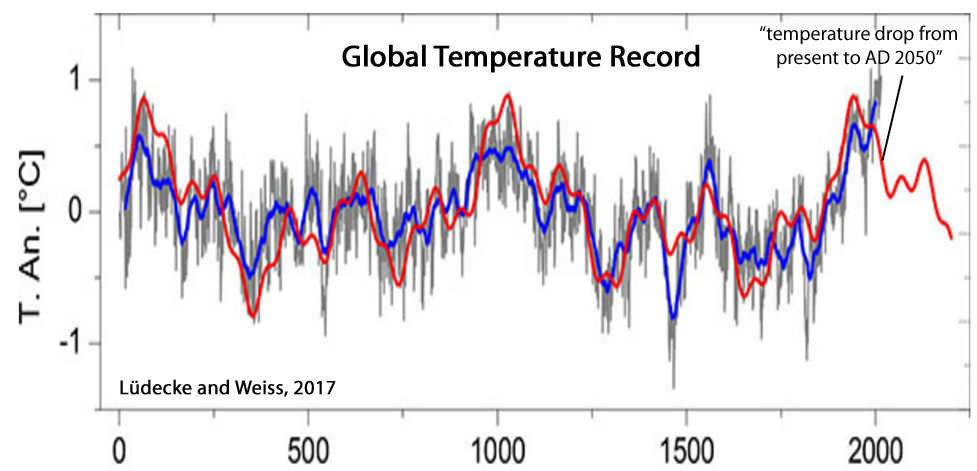
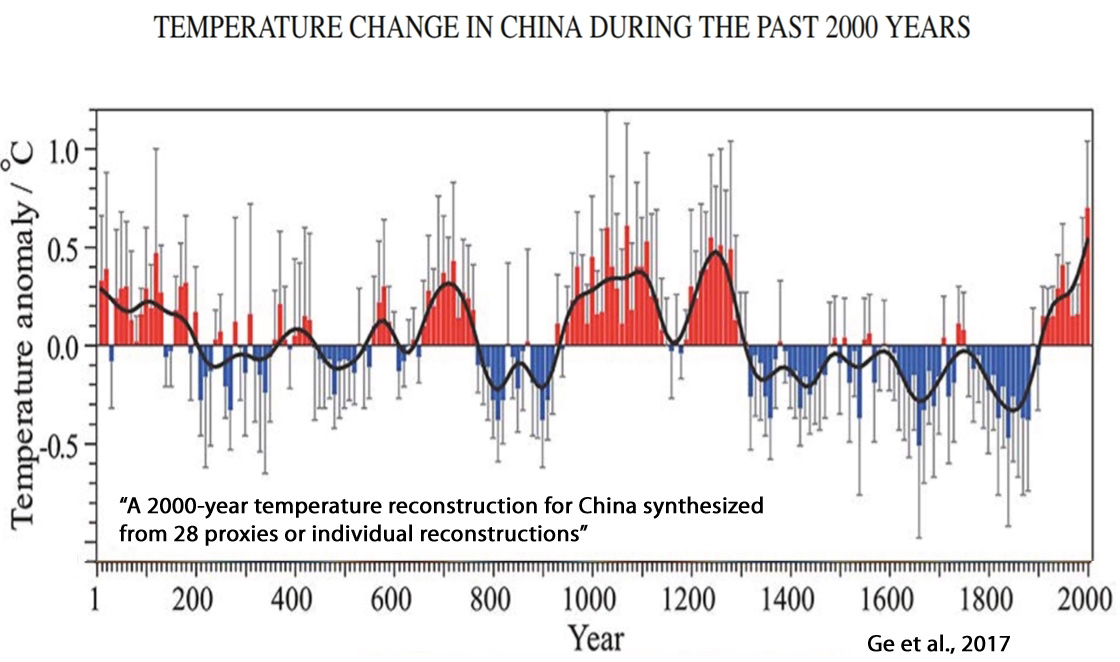
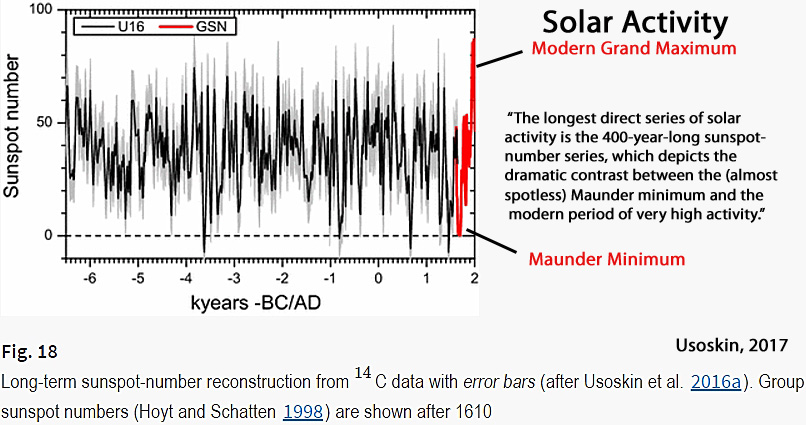
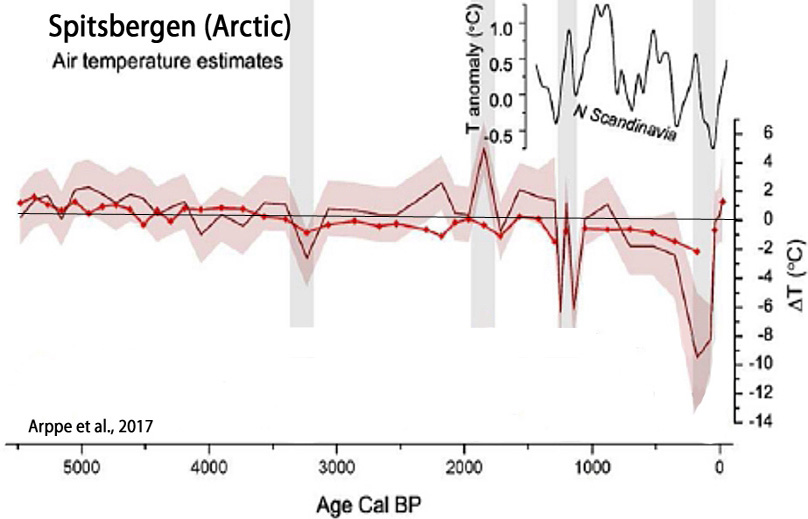
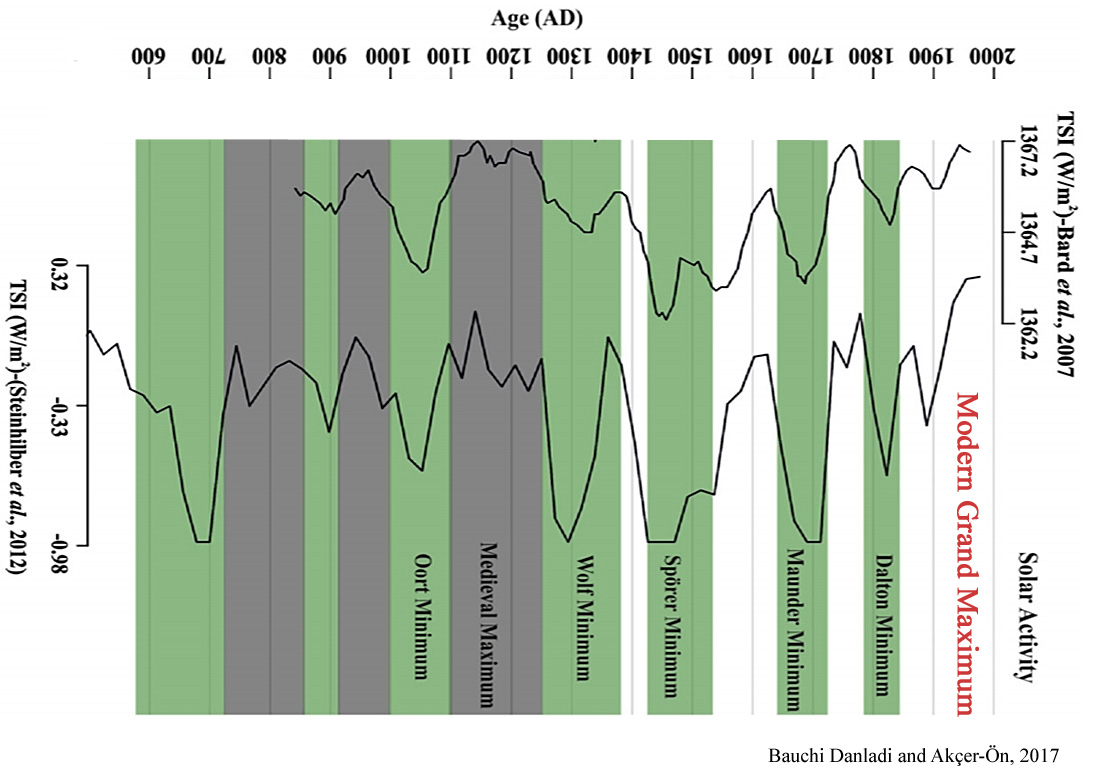
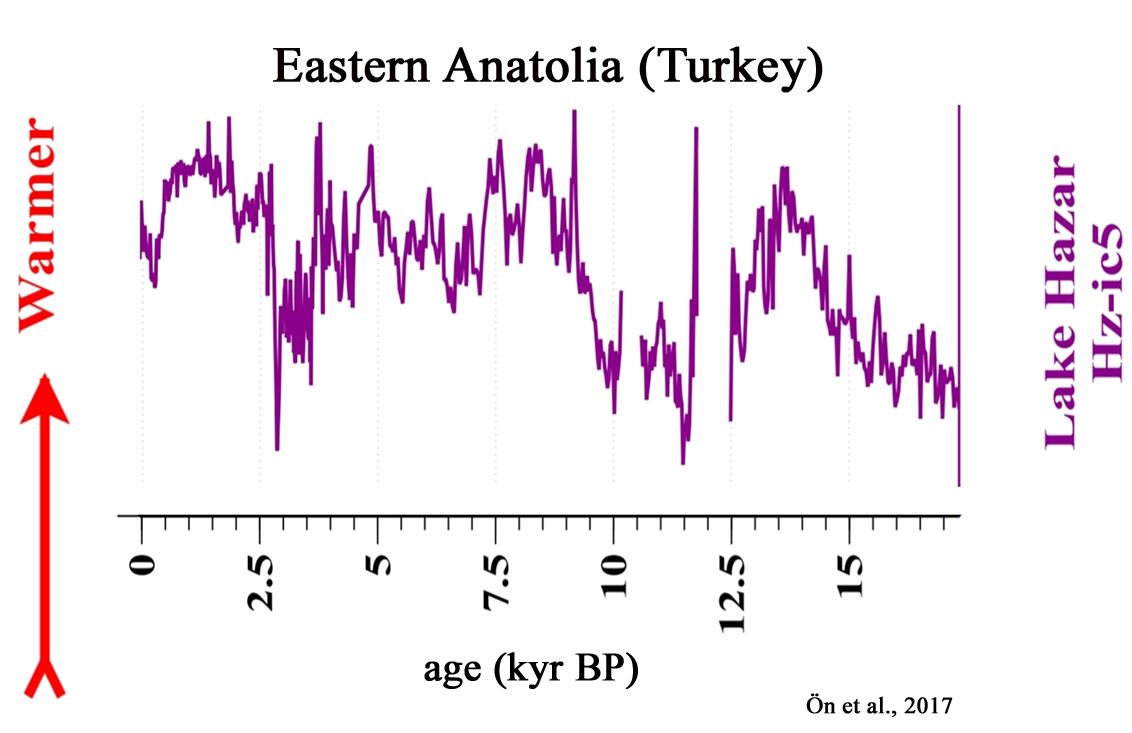
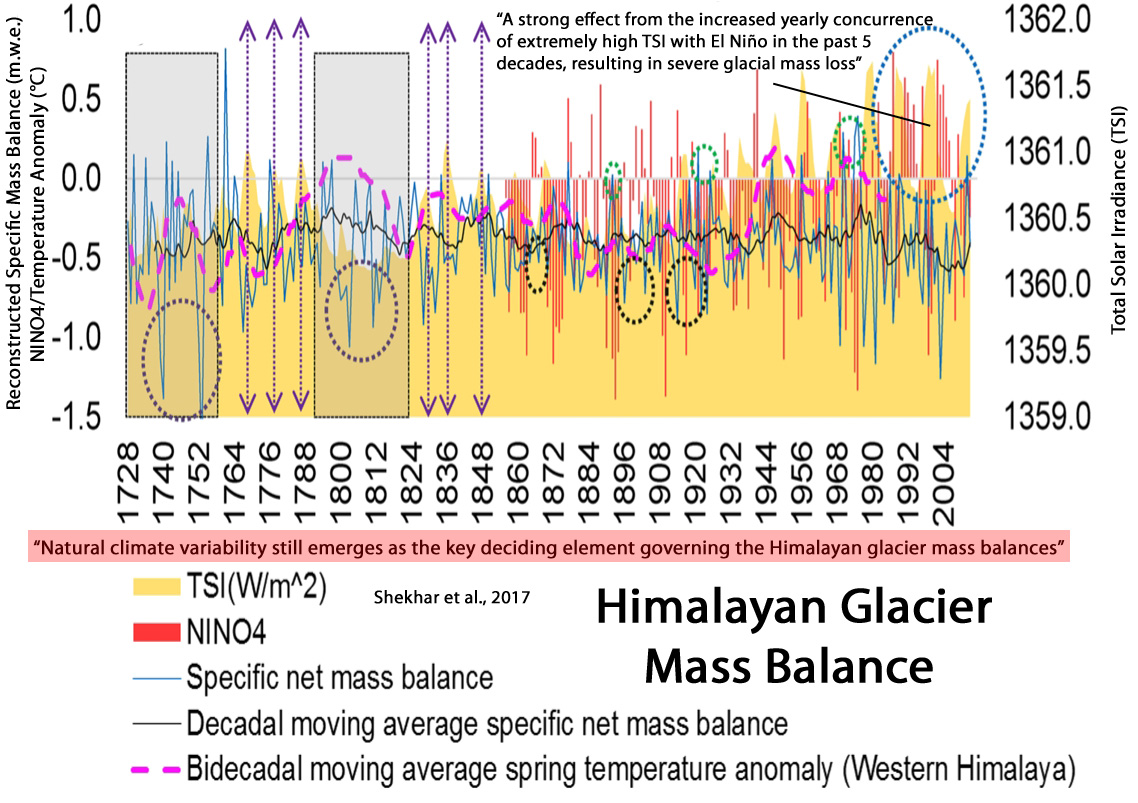
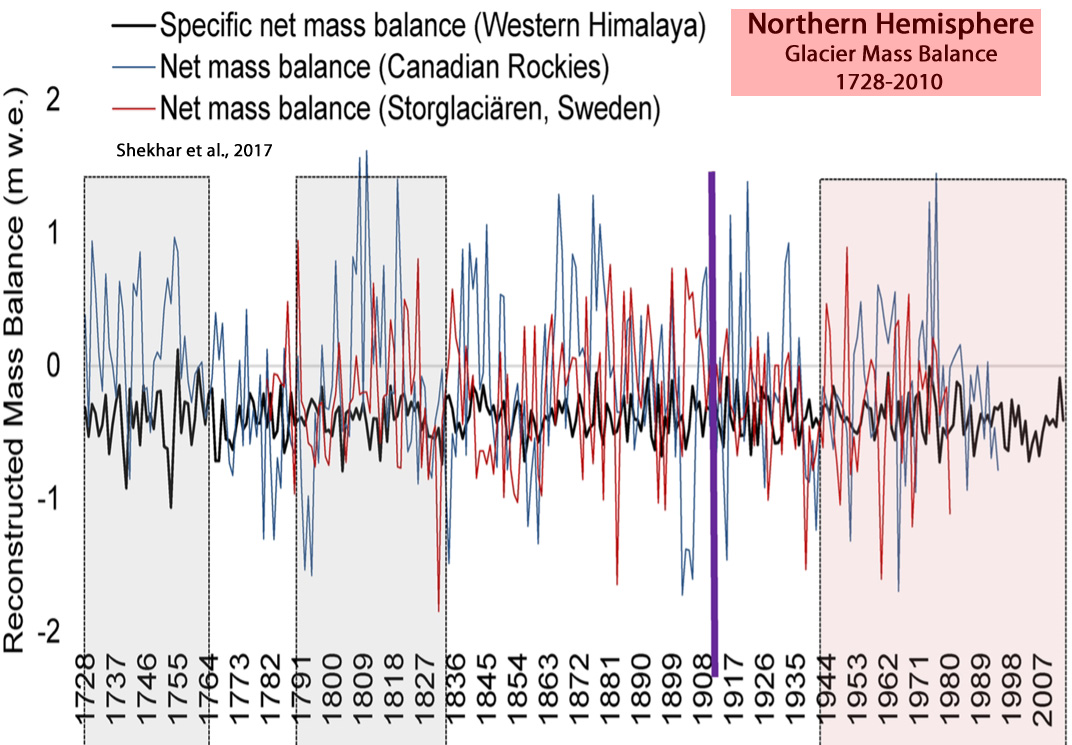
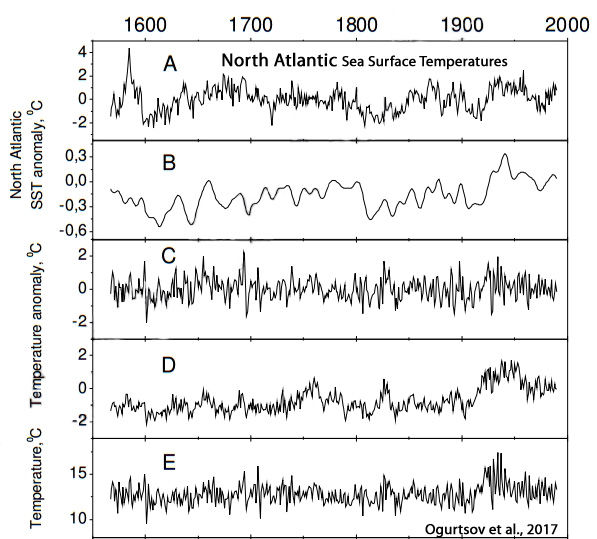
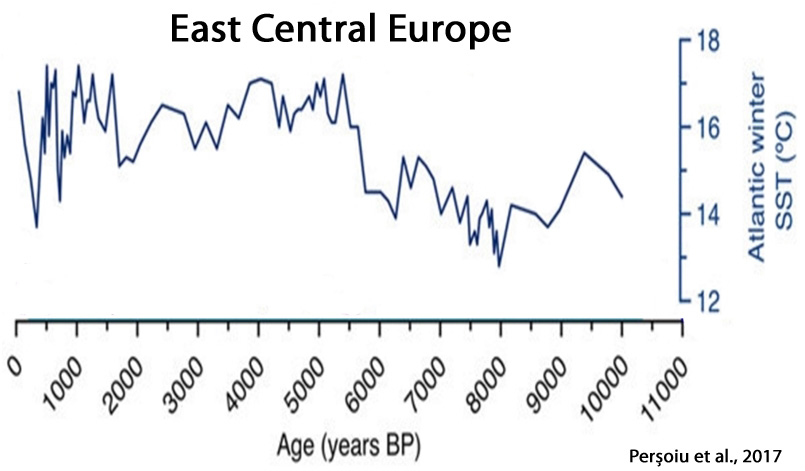
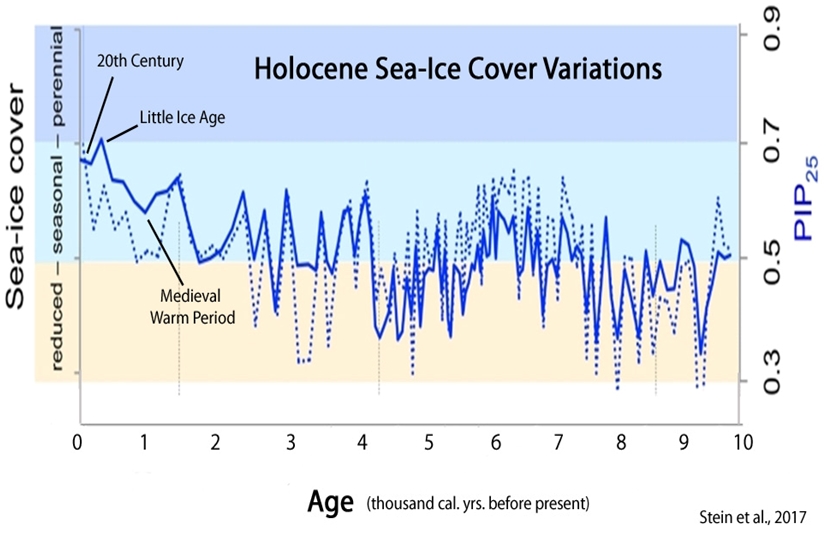
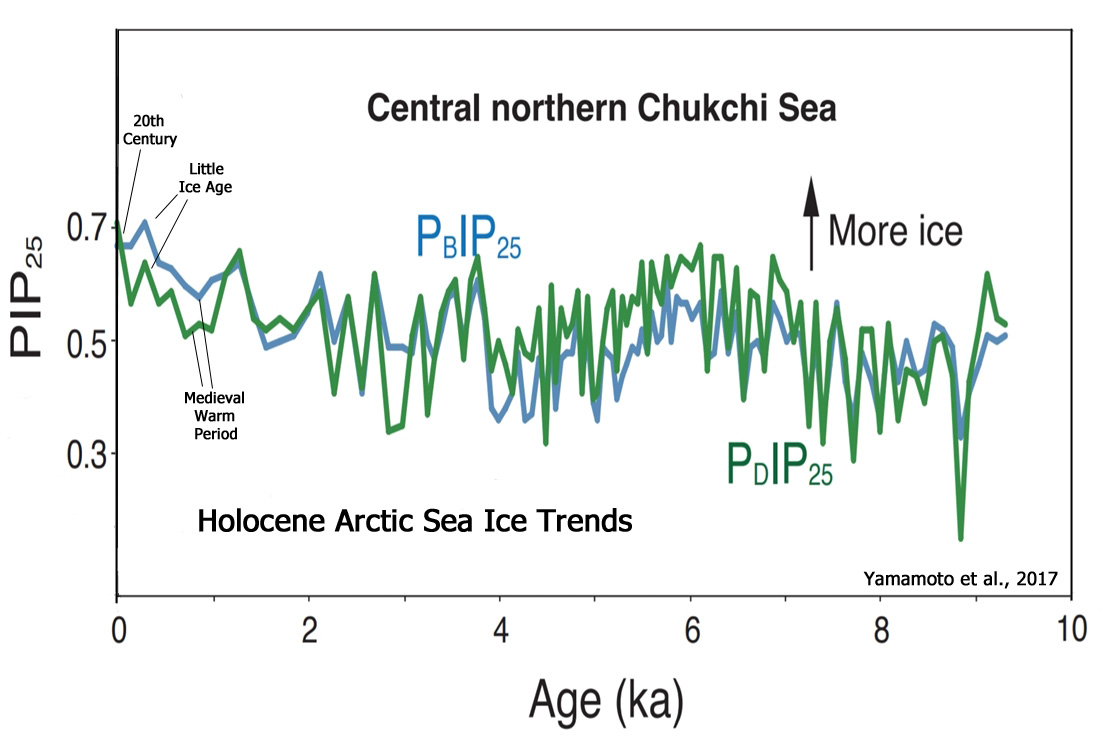


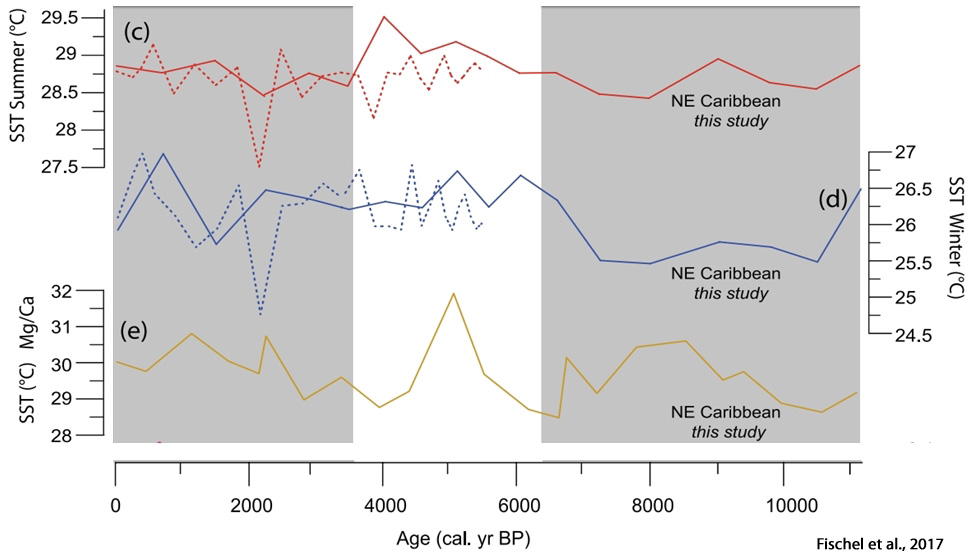
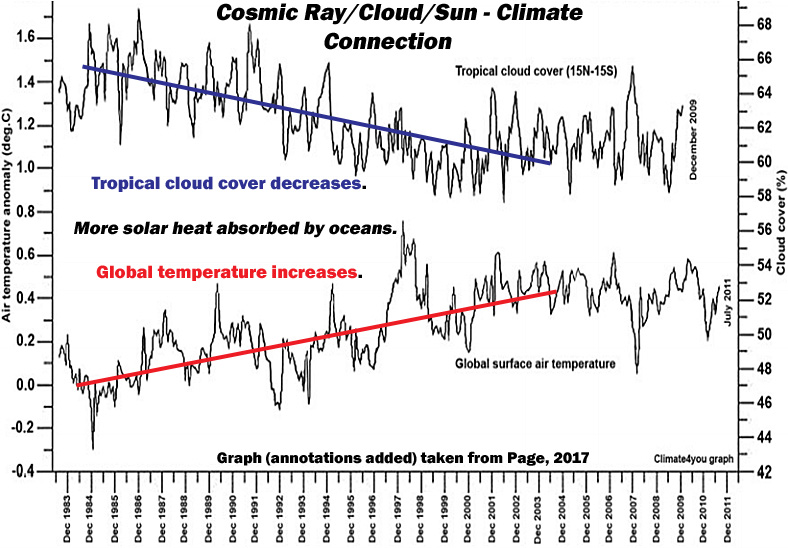
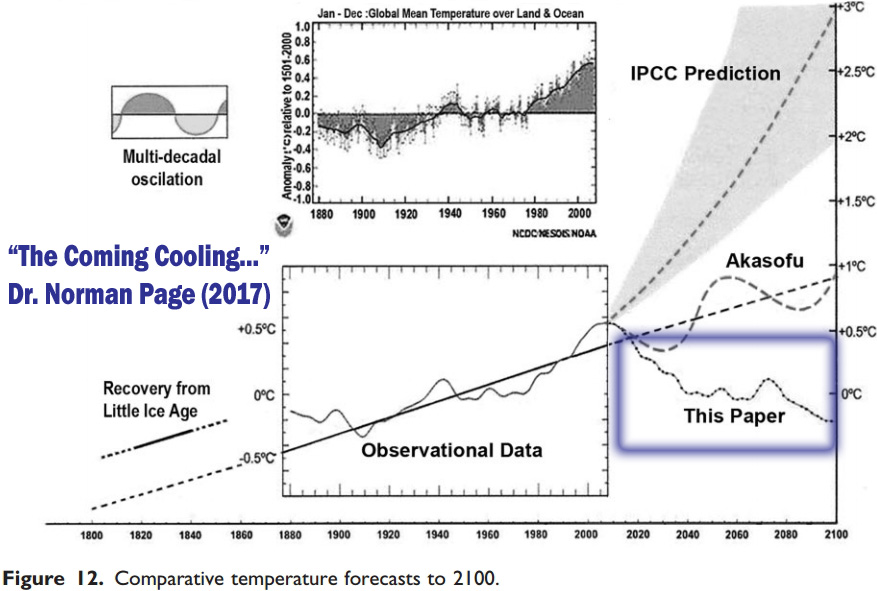
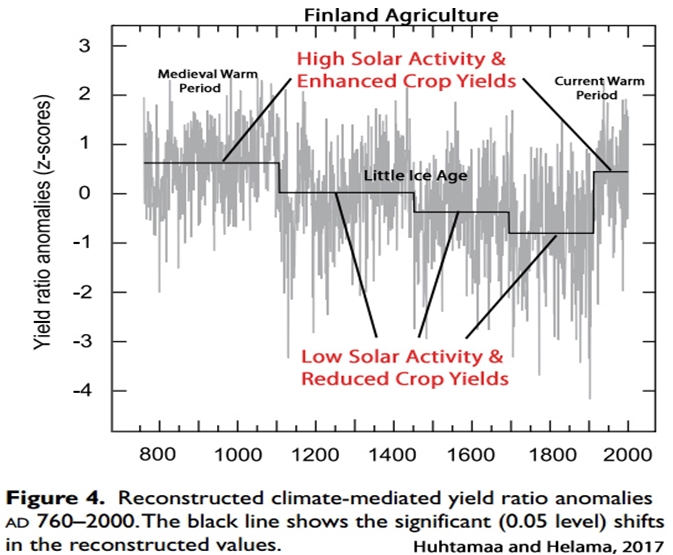
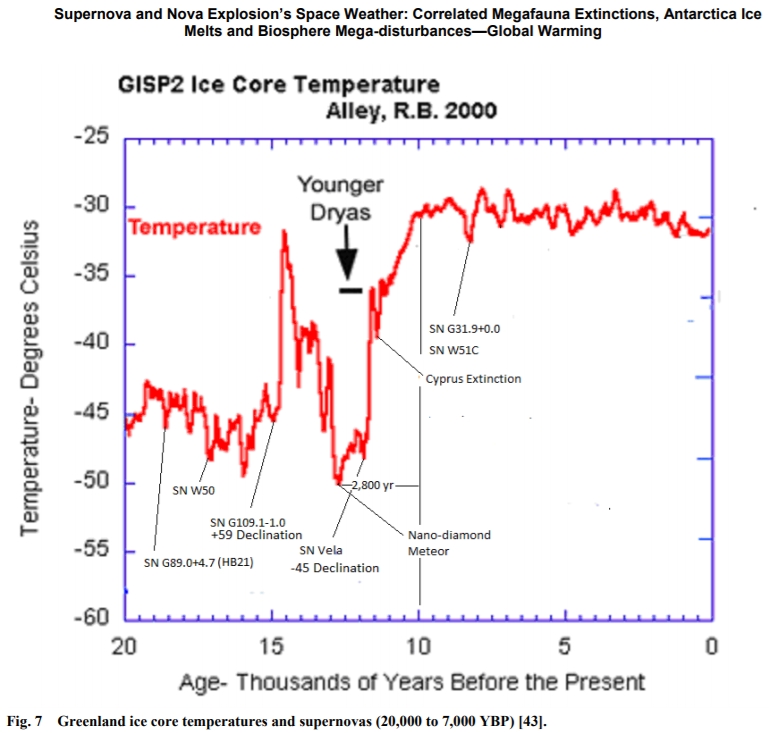
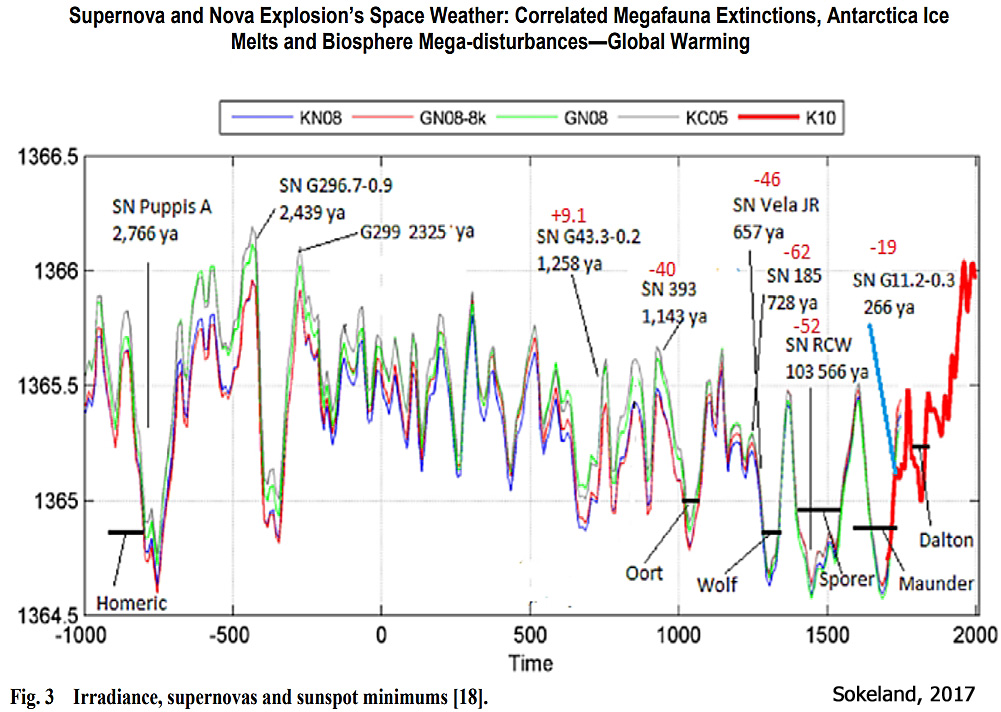
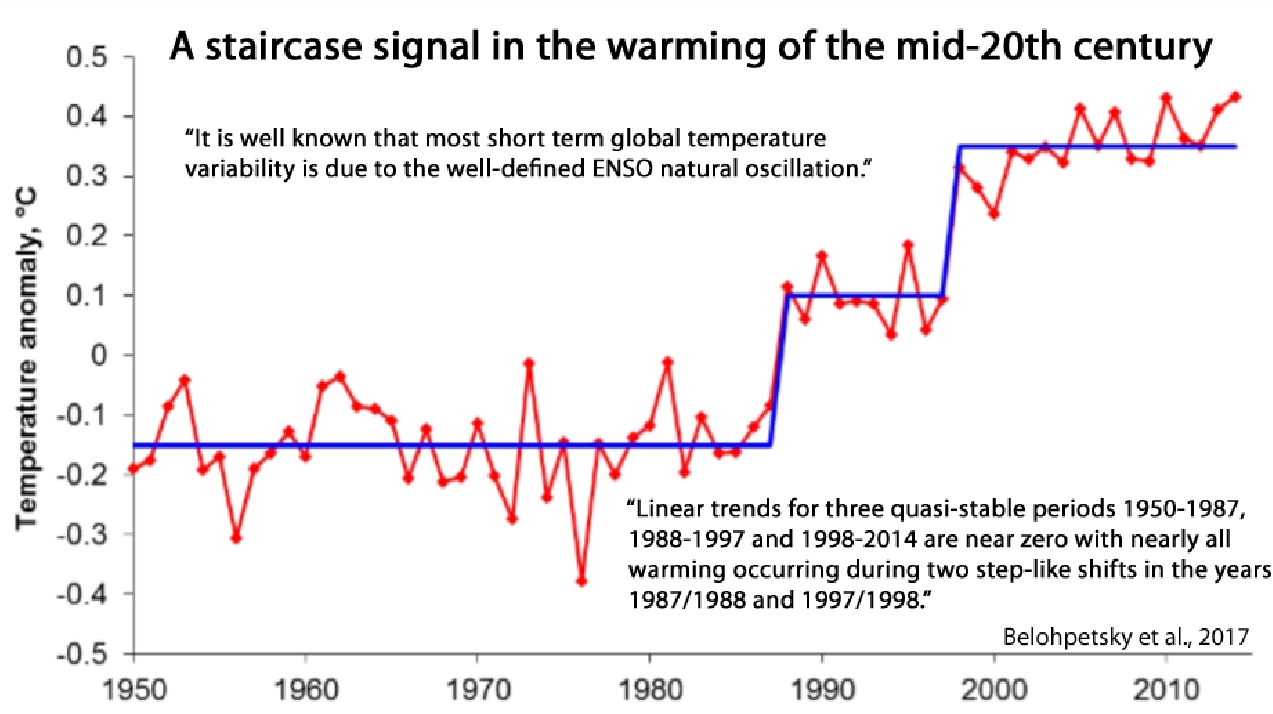
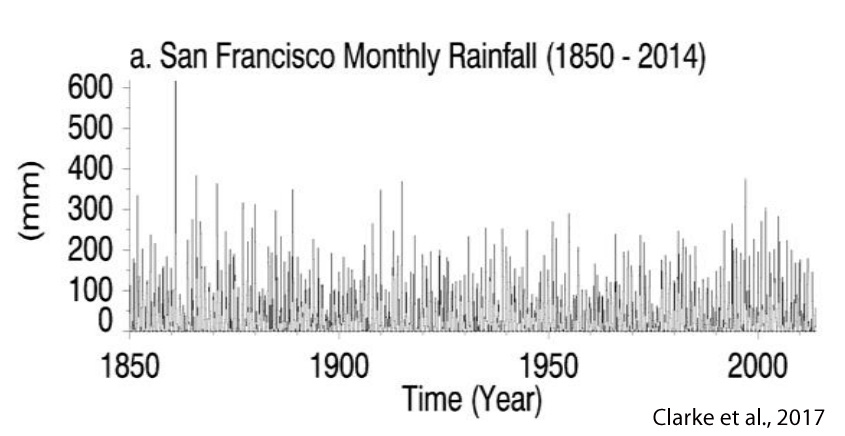
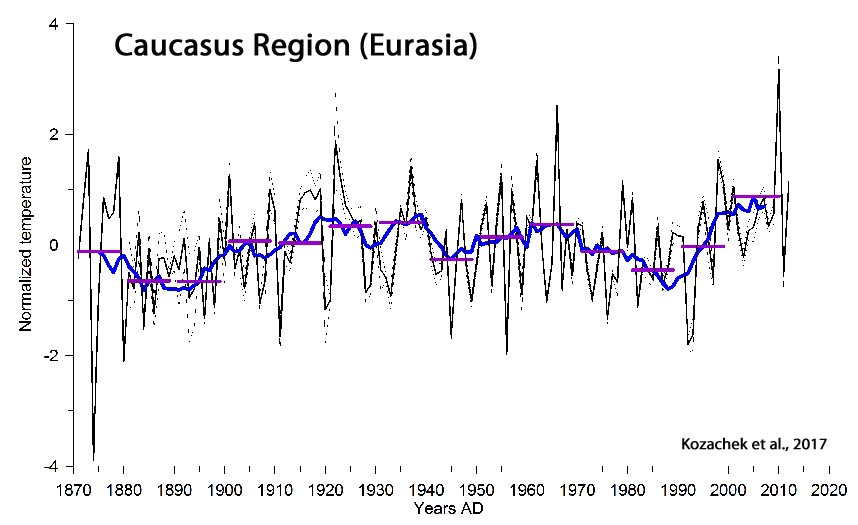
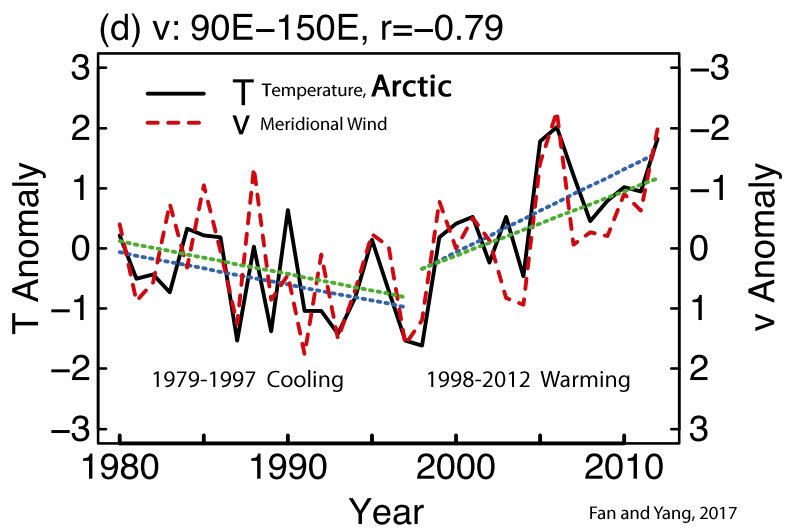
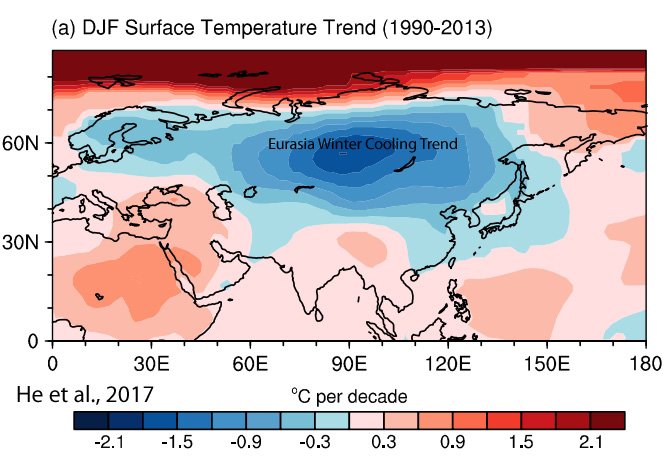
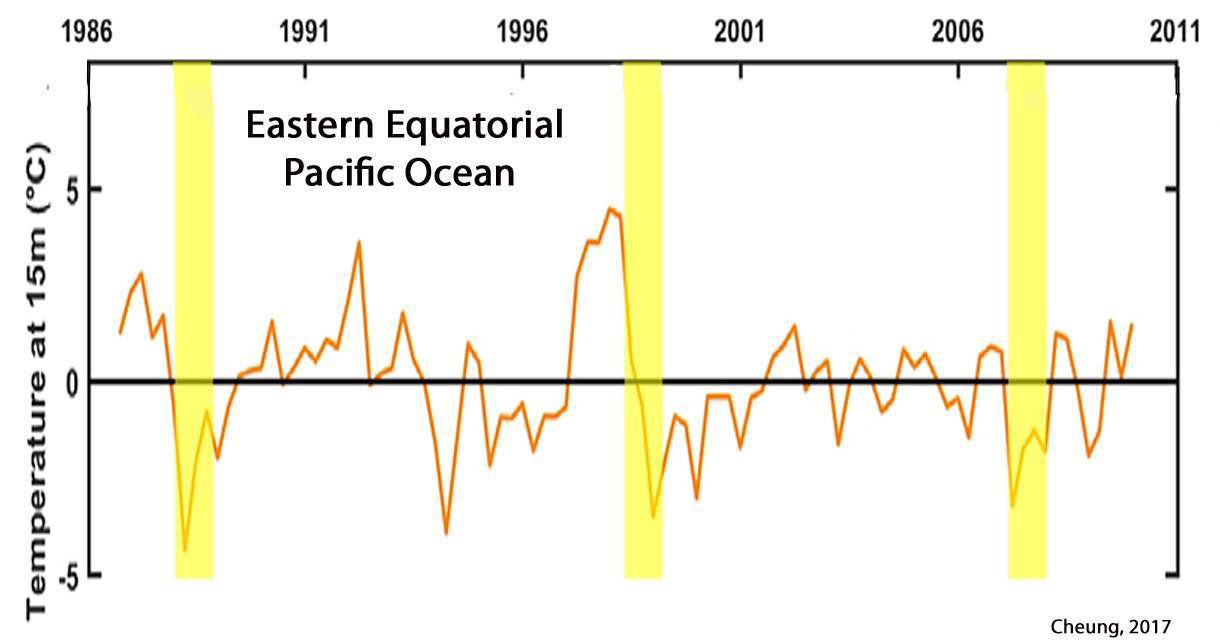
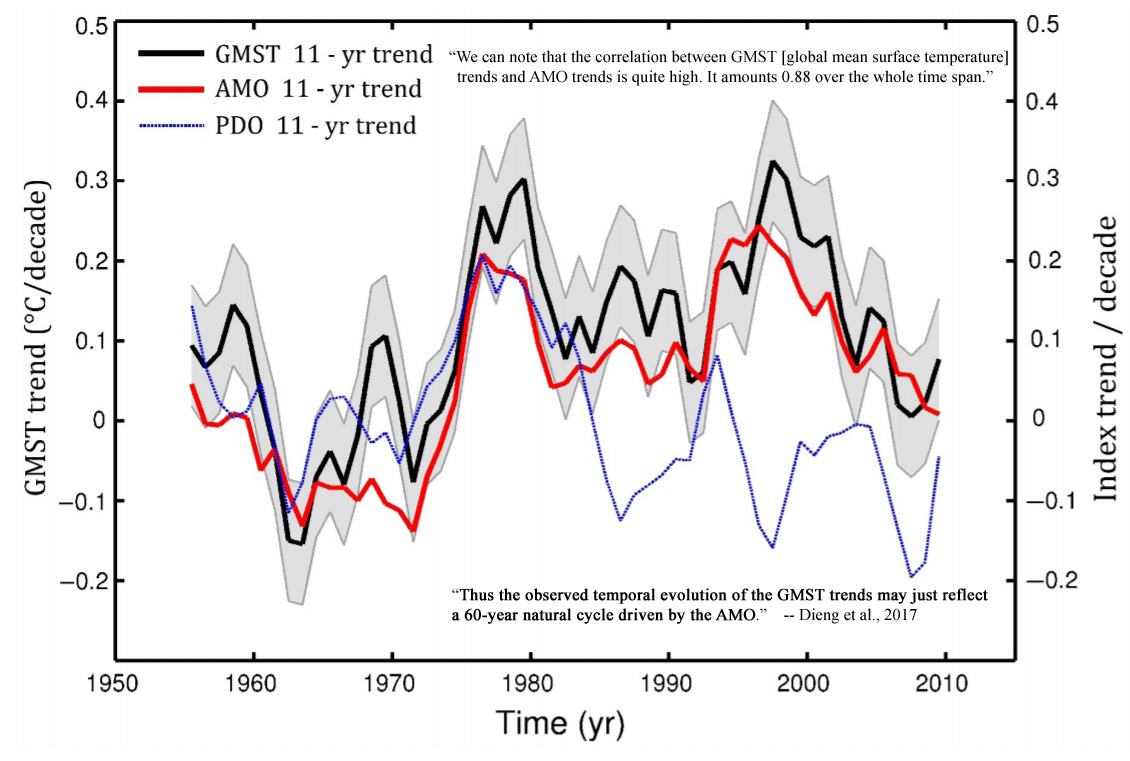
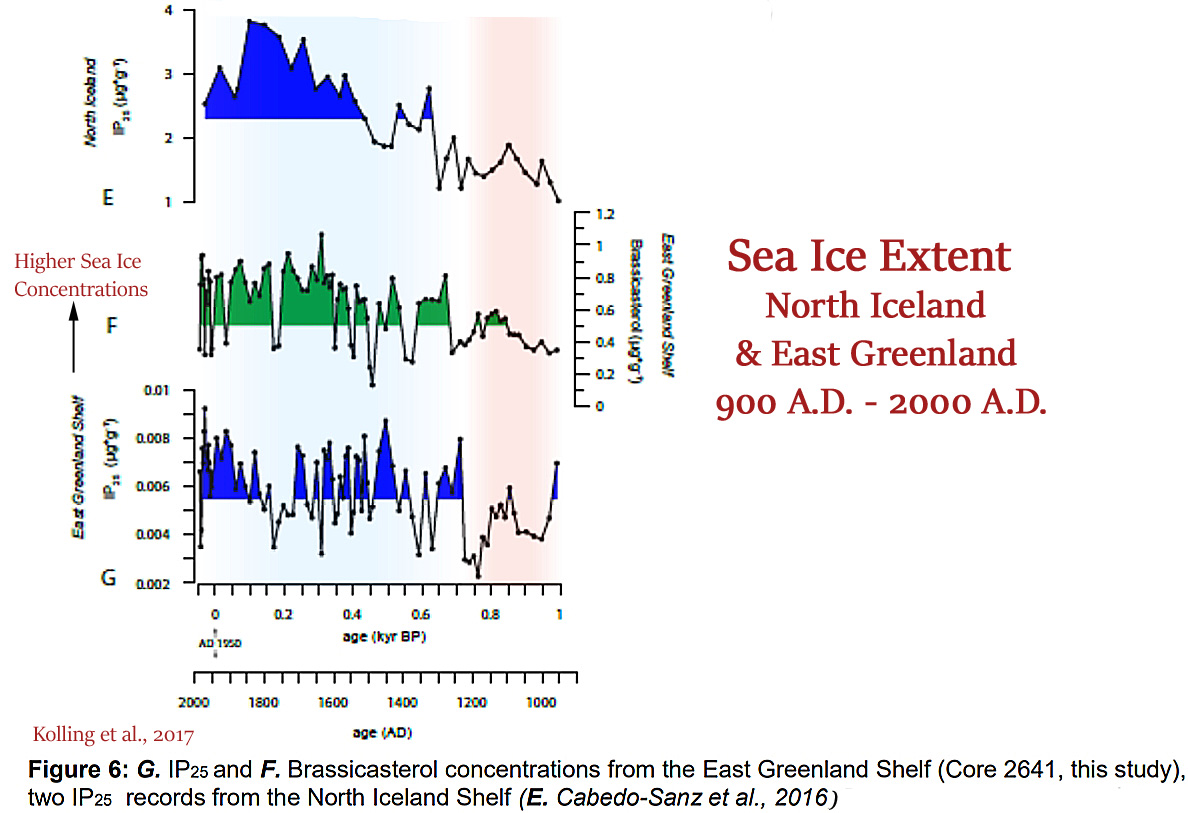
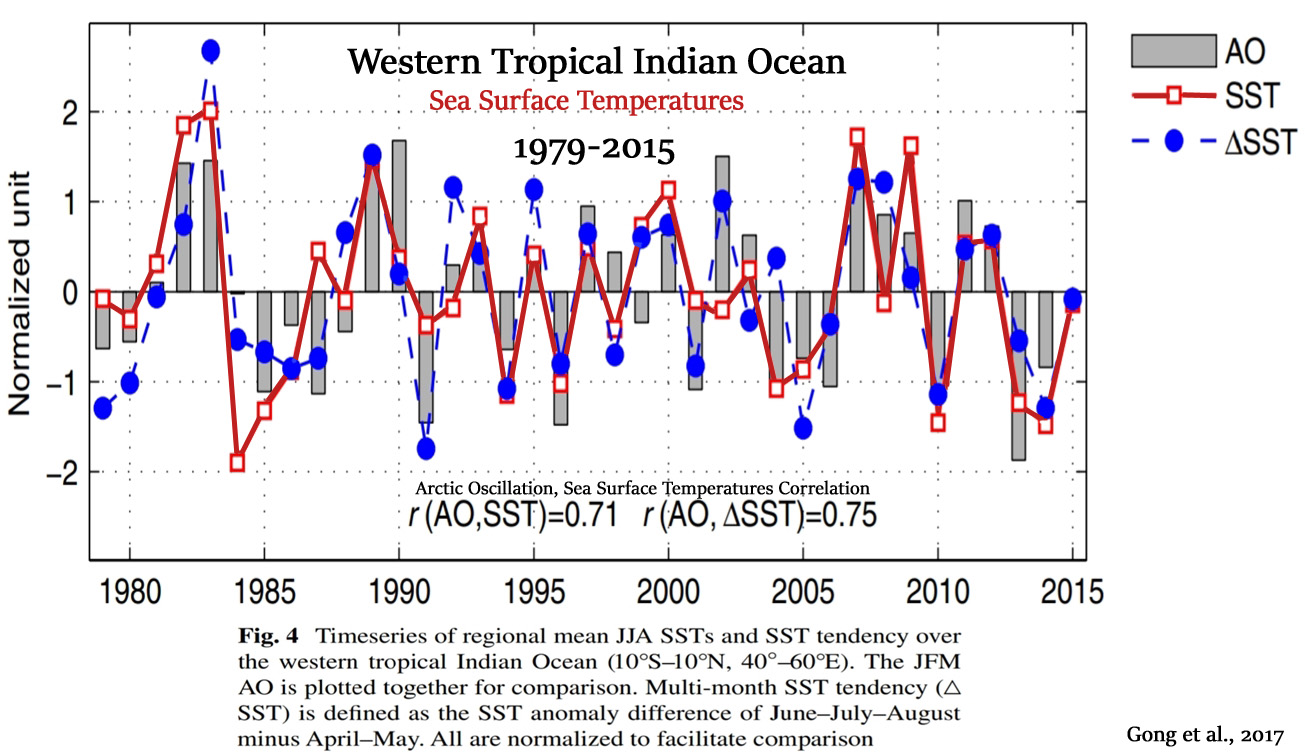
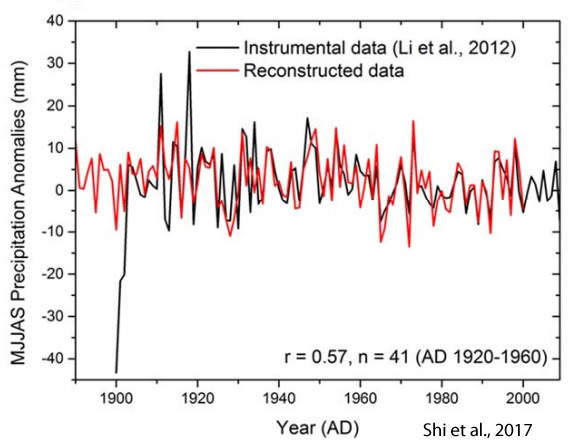
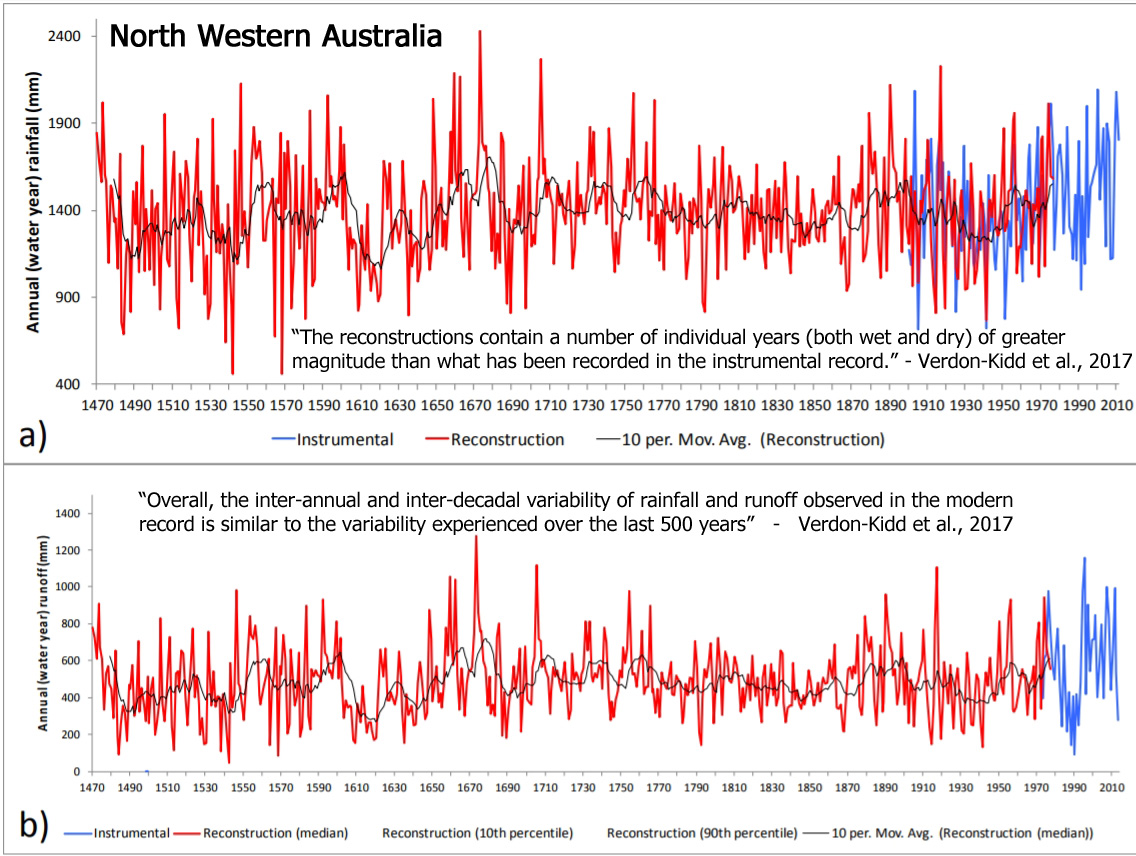
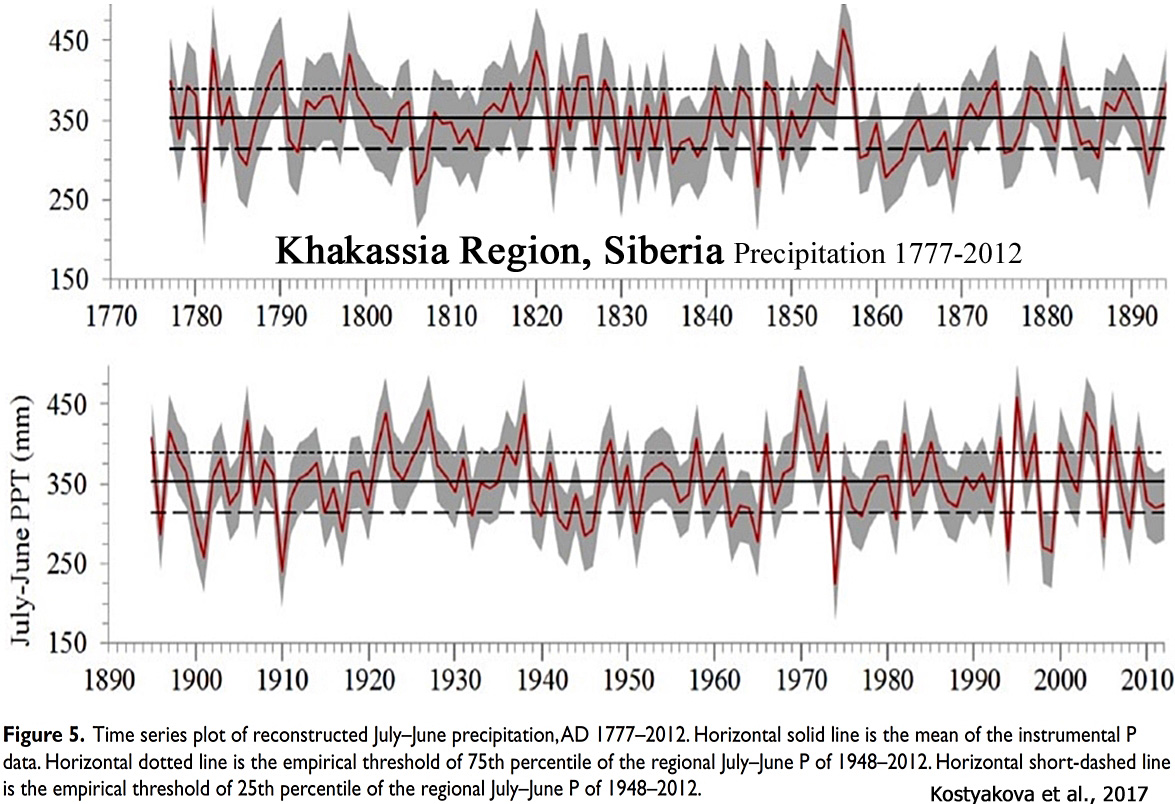
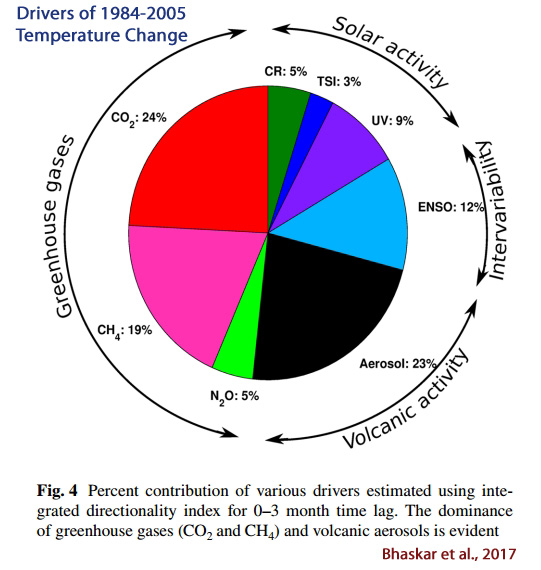
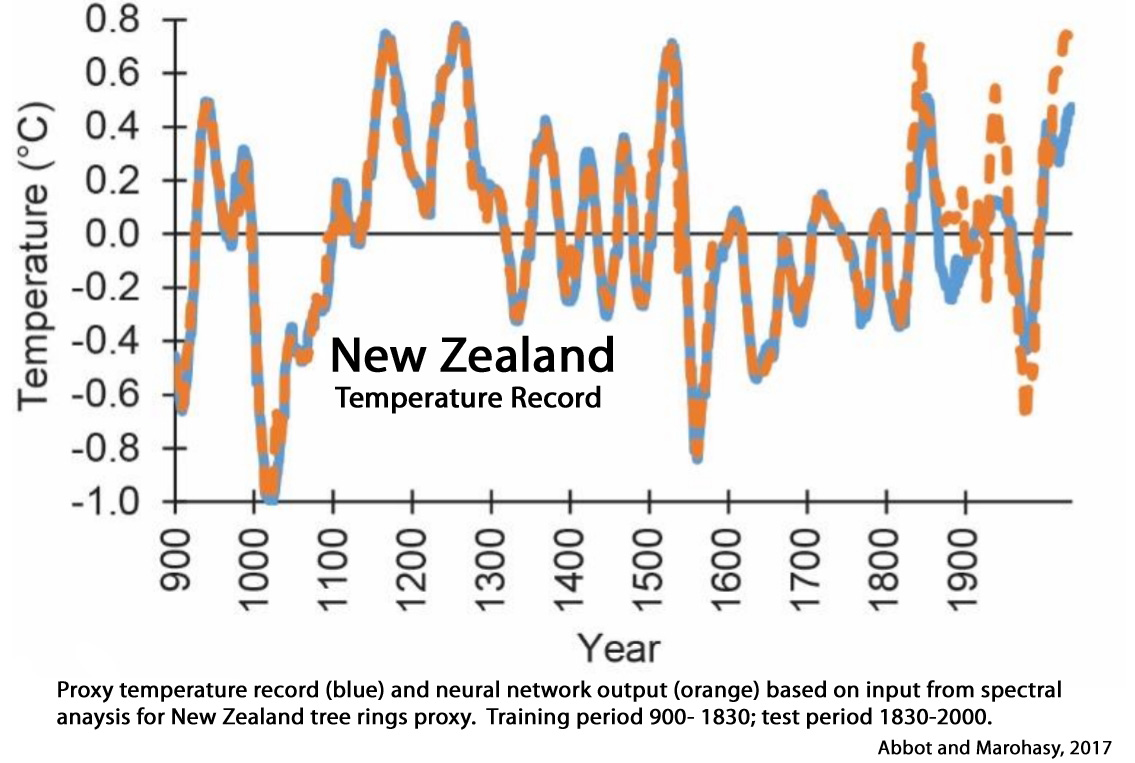
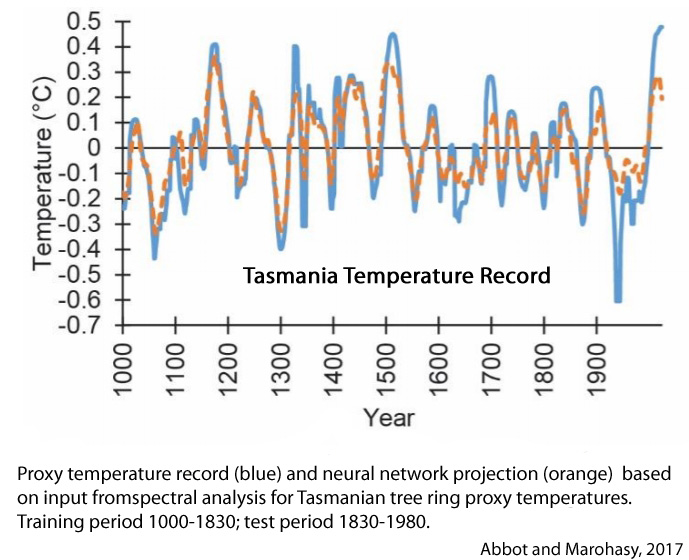
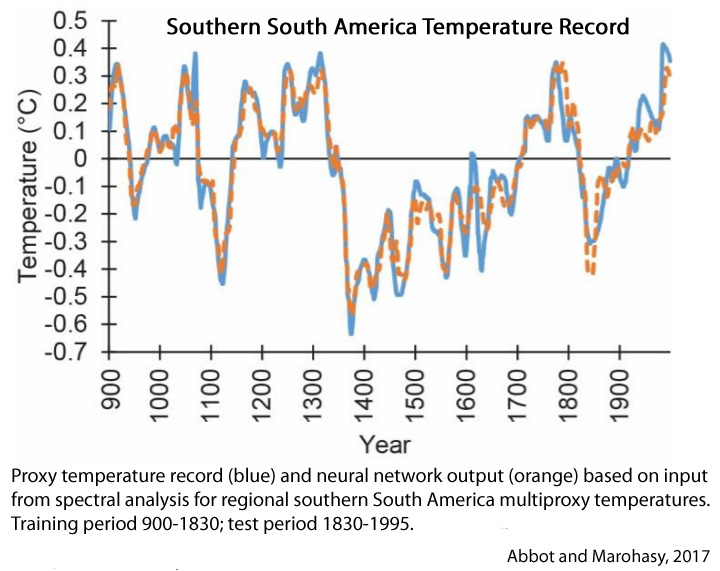
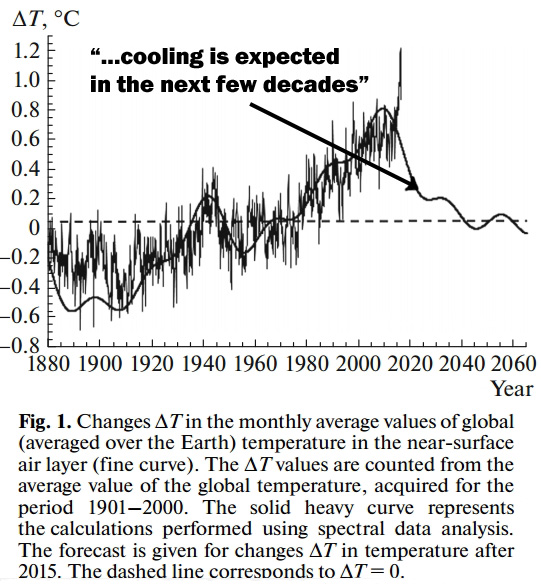
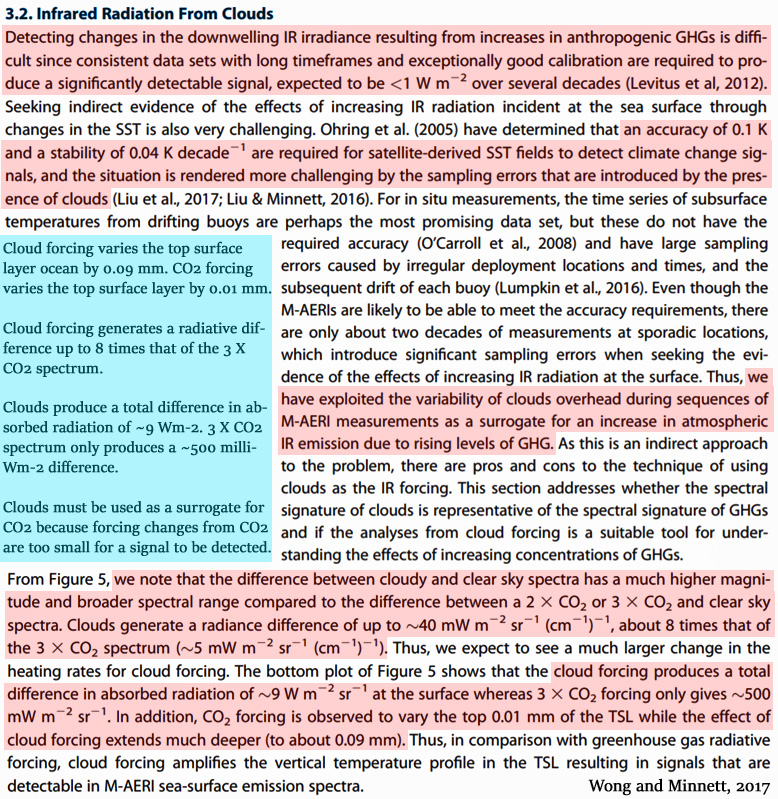

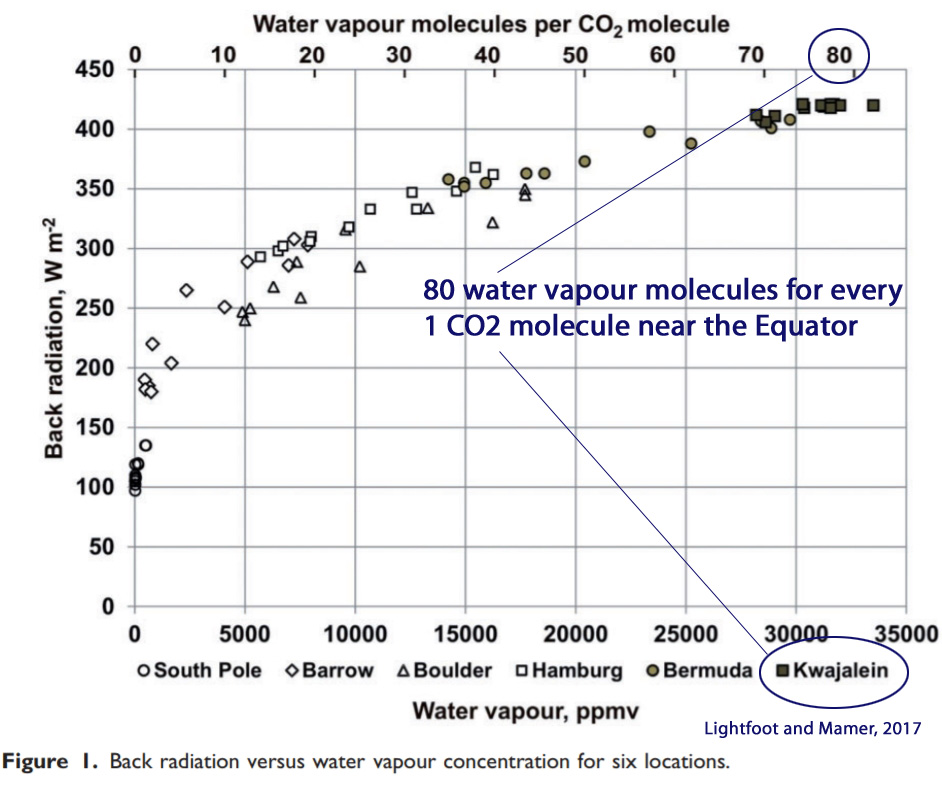
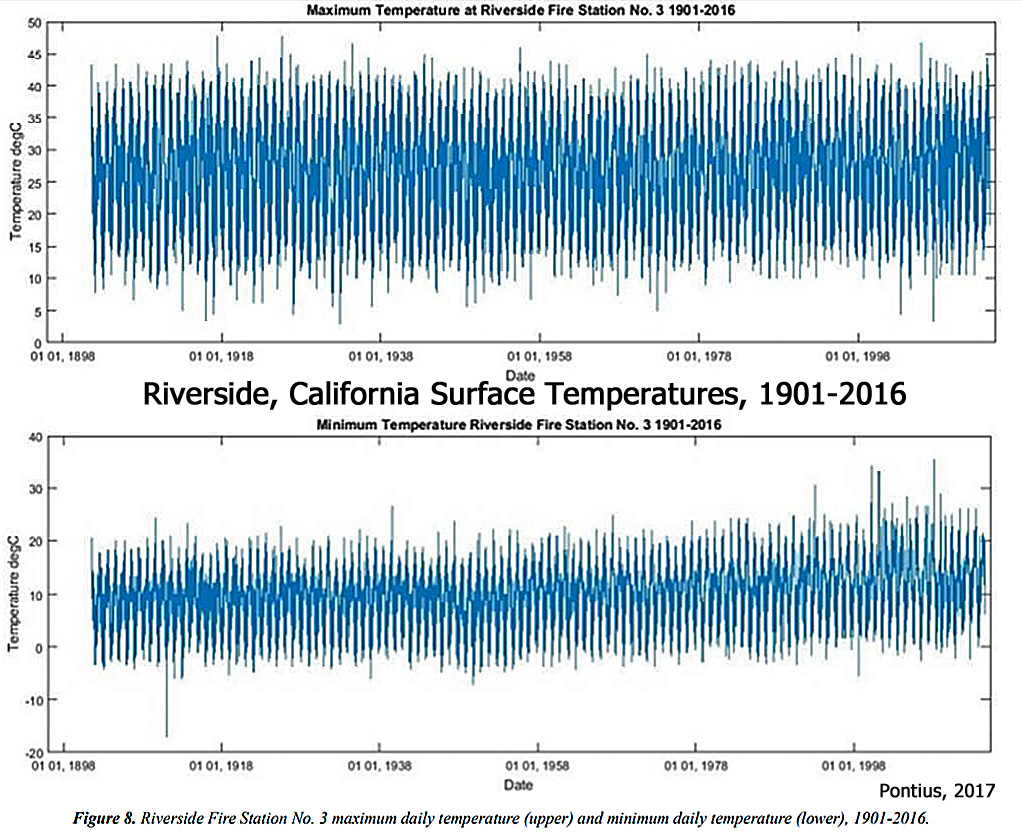
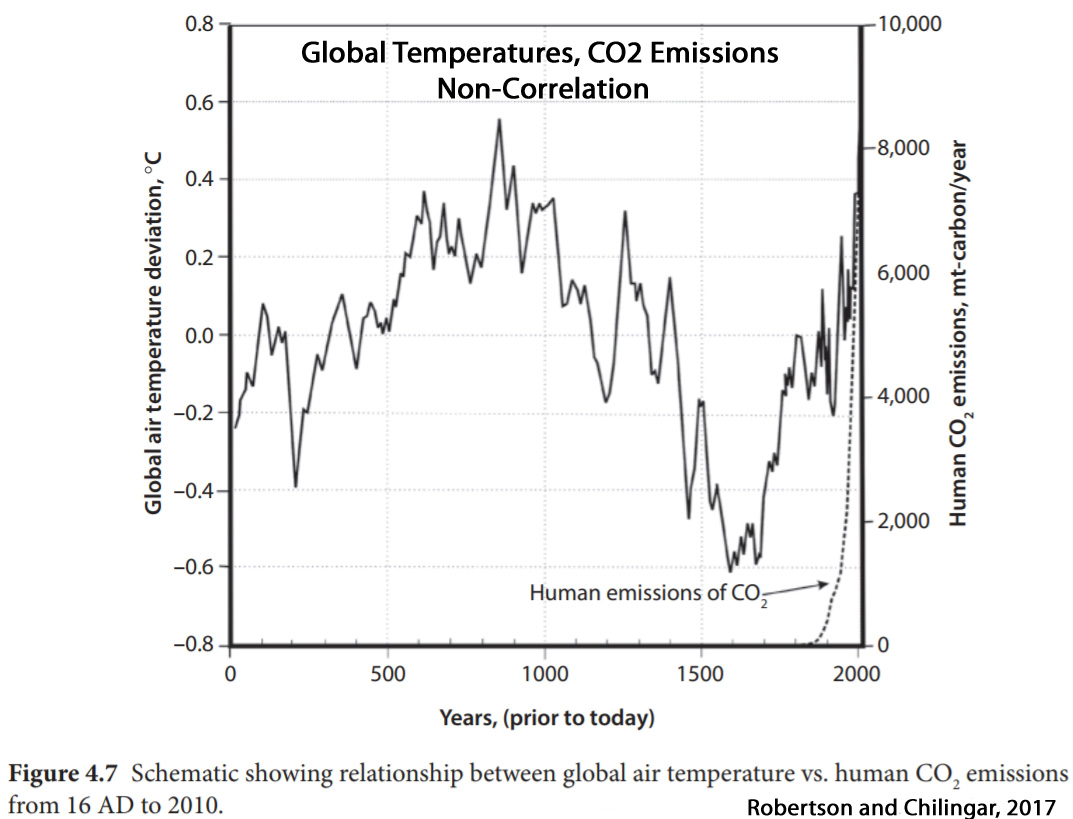
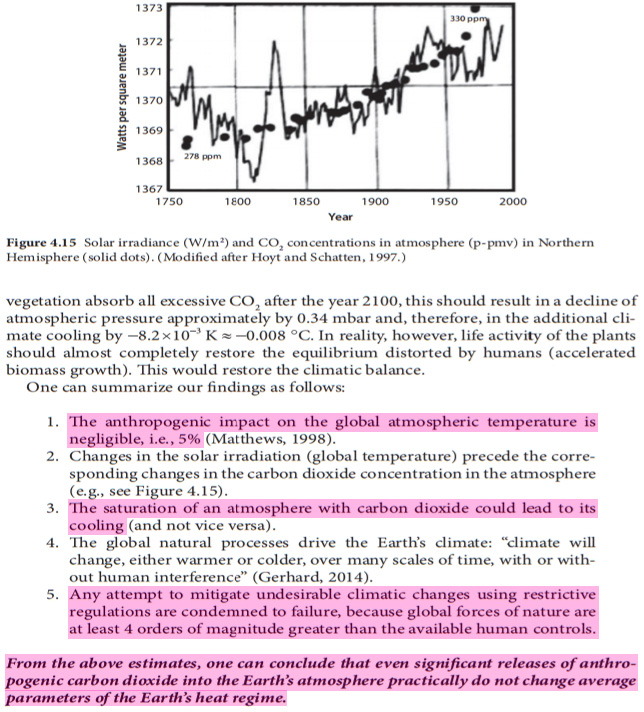


Recent Comments