According to the calculations of Dr. James Hansen, the radiative influence derived from the increase in CO2 during the last deglaciation was so negligible that it equated to “a third of energy required to power a honey bee in flight” (Ellis and Palmer, 2016).
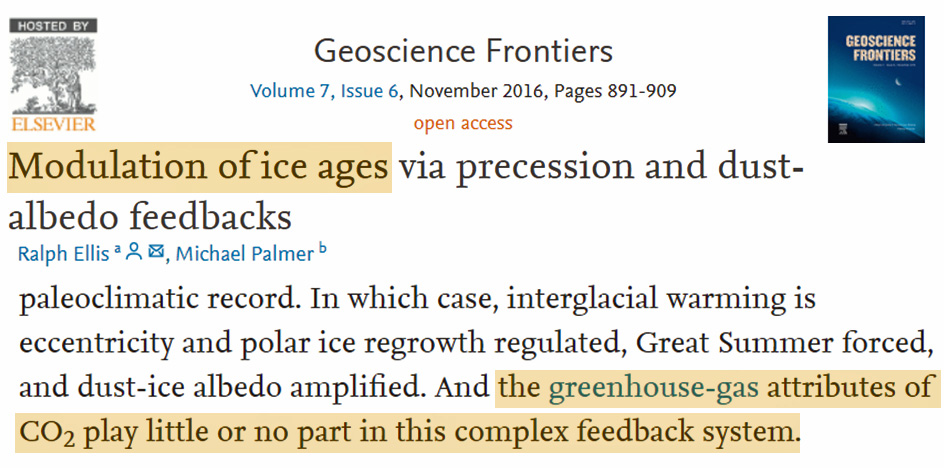
Image Source: Ellis and Palmer, 2016
Between about 22,000 and 17,000 thousand years ago, Earth’s sea levels were about 120 meters lower than they are now because much of the Earth’s seawater was locked up in kilometers-thick continental ice sheets.
Then, about 14,500 years ago, nearly the entire Northern Hemisphere abruptly warmed up by about 4-5°C within a span of about 20-30 years as sea levels rose at rates between 3 and 6 meters per century (Ivanovic et al., 2017). Northern Hemisphere sea surface temperatures warmed by 3°C in less than 90 years during this time.
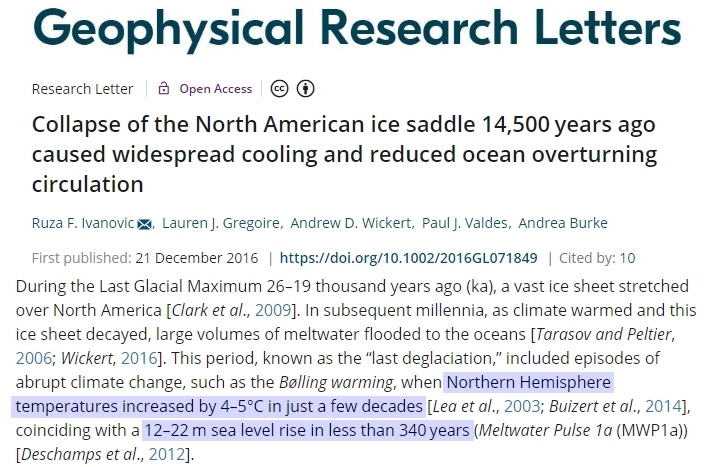
Image Source: Ivanovic et al., 2017
The last ice age ends and the Holocene begins
The Earth cooled and warmed and cooled and warmed for the next 3,000 years, during which time there was a gradual overall increase in global temperature of about 5-6°C superimposed on the abrupt decadal- and centennial-scale climate undulations.
By 11,700 years ago, when Greenland warmed up by 10°C within about 50 years (Steffensen et al., 2008), the last ice age glacial period ended and the Holocene interglacial warmth we now enjoy officially commenced.
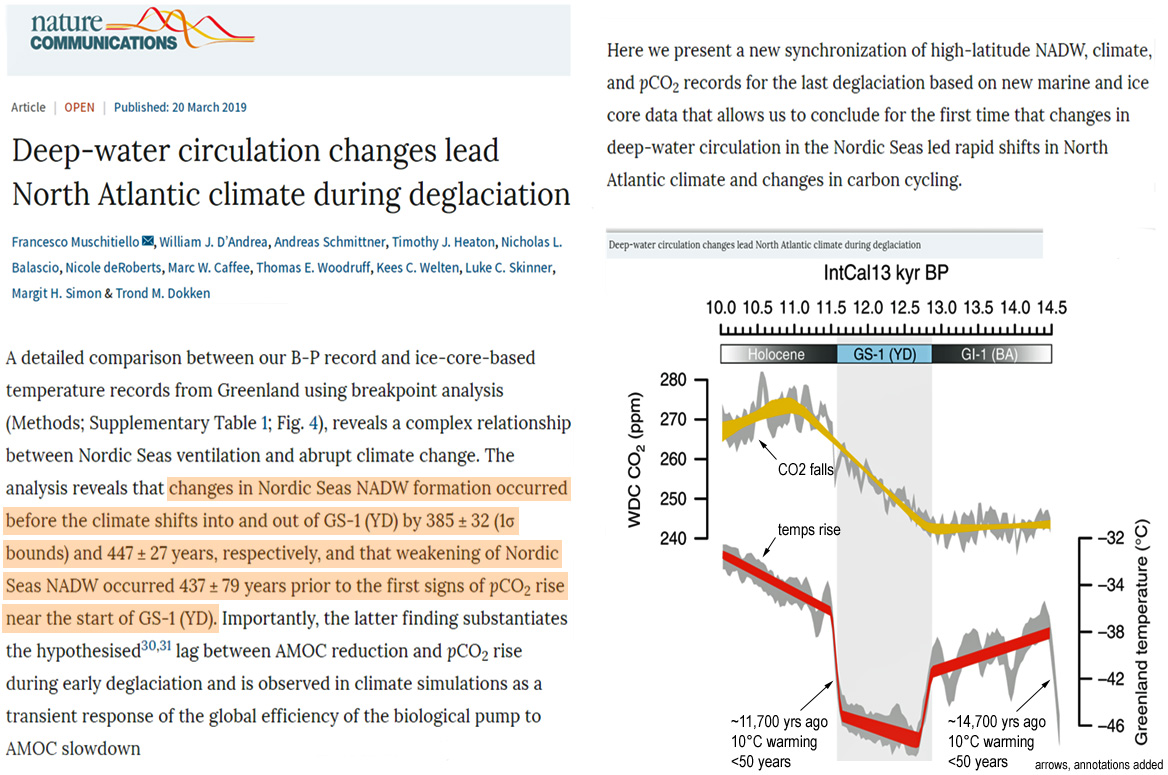
Image Source: Muschitiello et al., 2019
The honey bee-sized magnitude of CO2’s influence during the last deglaciation
There are many adherents to the Shakun et al. (2012)-endorsed position that “increasing CO2 concentrations is an explanation for much of the temperature change at the end of the most recent ice age.”
And yet one has to wonder how this conclusion could have been reached when the explosive warmings of degrees-per-decade occurred without any clearly detectable changes in CO2.
Not only that, but as Ellis and Palmer (2016) point out, Dr. James Hansen’s calculations of CO2’s radiative influence during the ~5,000 years of the Pleistocene-to-Holocene 5-6°C deglaciation suggest a 0.006 W/m² per decade CO2 forcing during this period, which is “about a third of the energy required to power a honey bee in flight.”
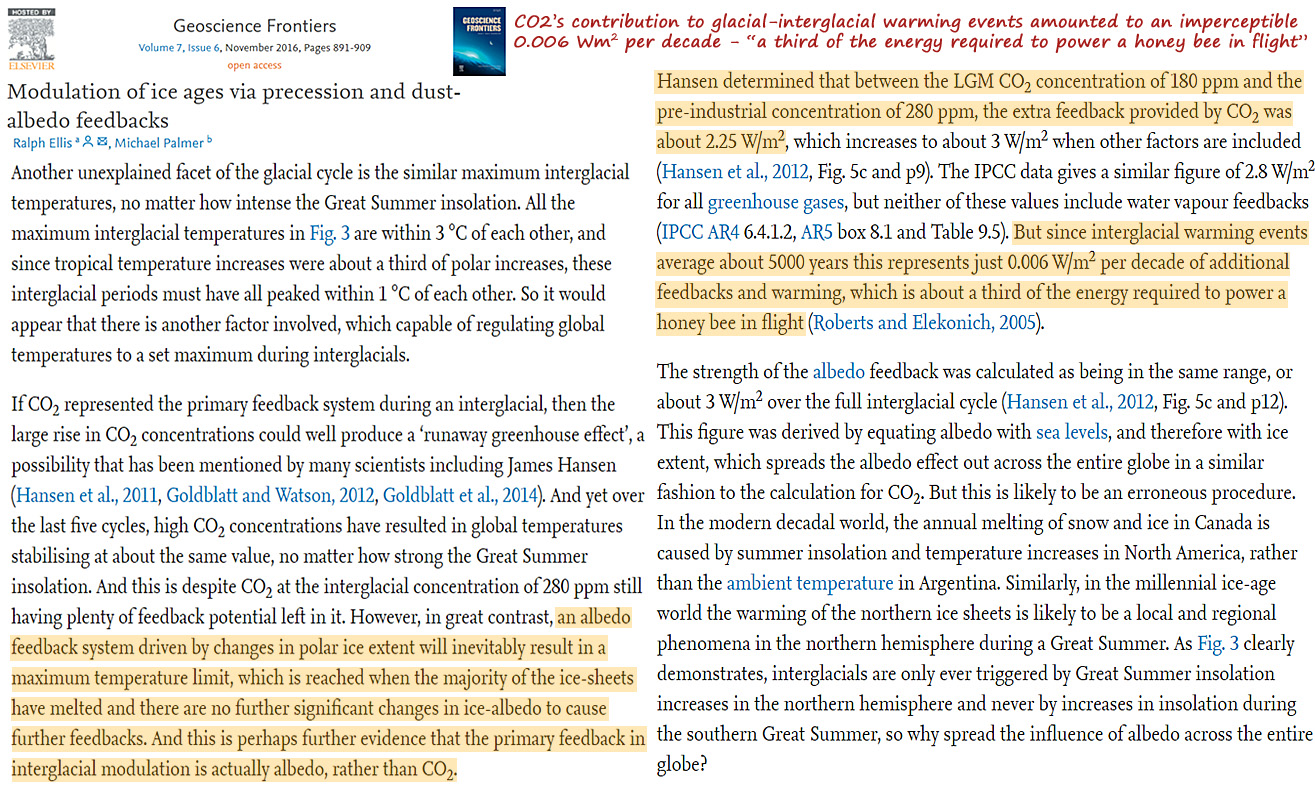
Image Source: Ellis and Palmer, 2016
With this vanishingly small forcing magnitude, why is it nonetheless thought that CO2 is a macro-level driver of Earth’s temperatures and a determinant of deglaciation transitions?


Precession
http://en.academic.ru/pictures/enwiki/80/Precessing_Kepler_orbit_280frames_e0.6_smaller.gif
How does this cycle take a few thousand years to go from the cold of the glacial maximum to the warmth of the inter-glacial yet take tens of thousands of years to get from warmth of the inter-glacial to the cold of the glacial maximum???
‘0.006 Wm² per decade’
I am puzzled by the units: should that be Watts per square metre?
Then, if it is, then it is describing power density flowing across a surface,
so why bother with the ‘per decade’?
It’s the difference between the relative and absolute forcing values.
For example, the IPCC claims that CO2 exerted a total forcing of about 1.8 W/m² since 1750. That can be divided up into relative “per decade” increments based upon the amount of per-decade CO2 ppm increase.
Feldman et al. (2015), for example, claim the 22 ppm increase in CO2 between 2000-2010 caused a RF increase of 0.2 W/m² per decade during that period.
The “power density flowing across a surface” you refer to is the absolute (alleged) forcing attributed to CO2 at any given moment. In Antarctica, for example, this RF is alleged to range between <0 to 1 W/m² over the course of the year, with “comparably weak” forcing values for Greenland.
Again, it’s a little difficult to understand how it could be claimed that CO2 is predominantly responsible for melting the polar ice sheets with such small forcing equivalents.
Thank you for your response.
So are you saying 🙂 that they mean it is the average over a decade, a particular decade, in fact? I wouldn’t state it as ‘per decade’. It’s like saying a power plant generates 100MW per year when it should be expressed as 100MW for a year. Otherwise it makes the units bizarre, or the amount time independent.
I am still confused.
And does Wm² mean Watts per square metre, or not?
I have just found the hyperlink (it isn’t in a good colour on my phone and I don’t often see the differences between some colours) and it explains all!
Thanks again for the explanation.
Watts per meter squared is usually written as Wm-2 or W/m², not Wm² which has no physical meaning.
[…] CO2’s Influence Was 0.006 W/m² Per Decade During The Last Deglaciation. And This Melted Ice Sheet… […]
[…] https://notrickszone.com/2019/04/18/co2s-influence-was-0-006-wm%C2%B2-per-decade-during-the-last-deg… […]
[…] https://notrickszone.com/2019/04/18/co2s-influence-was-0-006-wm%C2%B2-per-decade-during-the-last-deg… […]
[…] https://notrickszone.com/2019/04/18/co2s-influence-was-Zero-006-wmp.cC2p.cB2-per-decade-during-the-l… […]