“Our analysis revealed that the observed decrease of planetary albedo along with reported variations of the Total Solar Irradiance (TSI) explain 100% of the global warming trend and 83% of the GSAT interannual variability as documented by six satellite- and ground-based monitoring systems over the past 24 years.” – Nikolov and Zeller, 2024
A new, observation-based study makes extensive use of satellite data (CERES) to quantify the driving mechanism behind the global surface air temperature (GSAT) warming throughout the first 24 years of the 21st century.
Instead of agreeing with the prevailing narrative, the authors reject the hypothesis that accumulated “heat trapping” from rising greenhouse gas (GHG) concentrations in recent decades is the driver of global warming. Instead, satellite observations clearly indicate “100% of the global warming trend and 83% of the GSAT interannual variability” is explained by the increasing trend in absorbed shortwave radiation due to the downward trend in planetary albedo primarily induced by changes in cloud cover.
“According to CERES observations, the Earth’s all-sky albedo has declined by approximately 0.79% since 2000 causing an increase of planetary shortwave radiation absorption of ≈2.7 W/m².”
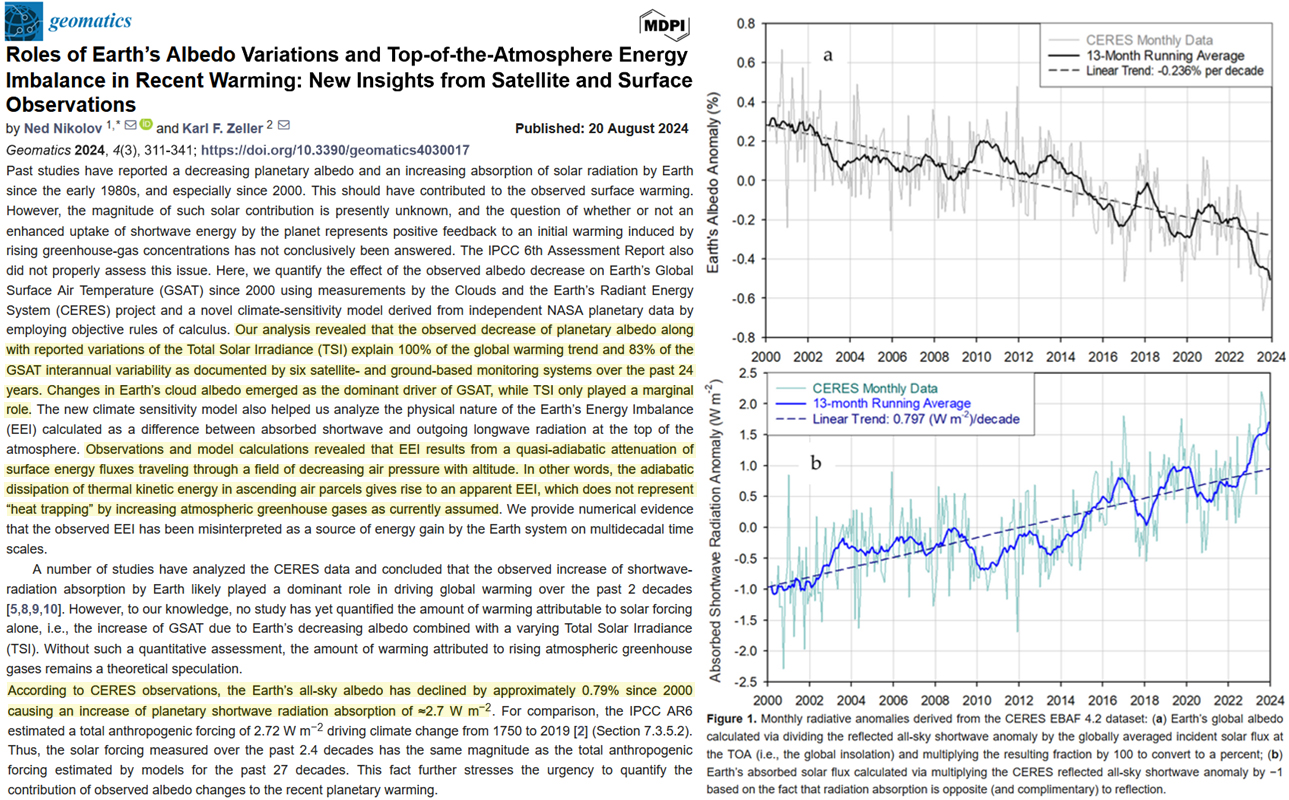
Image Source: Nikolov and Zeller, 2024
The authors point out that the prevailing narrative that says increases in downwelling longwave radiation from GHGs drive warming in the top 100 meters of the ocean is rooted in assumption. The proposed-but-never-observed (using GHGs as the causal variable) mechanism involves a hypothetical “thermal skin layer” temperature-gradient explanation for how GHG-induced water-warming might possibly work (see Wong and Minnett, 2018). In reality, thermal radiation penetrates less than one-thousandth of a meter and “cannot directly warm the deep ocean.”.
In contrast, satellite-observed increases in absorbed solar radiation – which penetrates 100 m and indeed directly warms the ocean water – explains not only the 0-100 m ocean-warming trend since 2000, but also 80% of the interannual temperature variability.
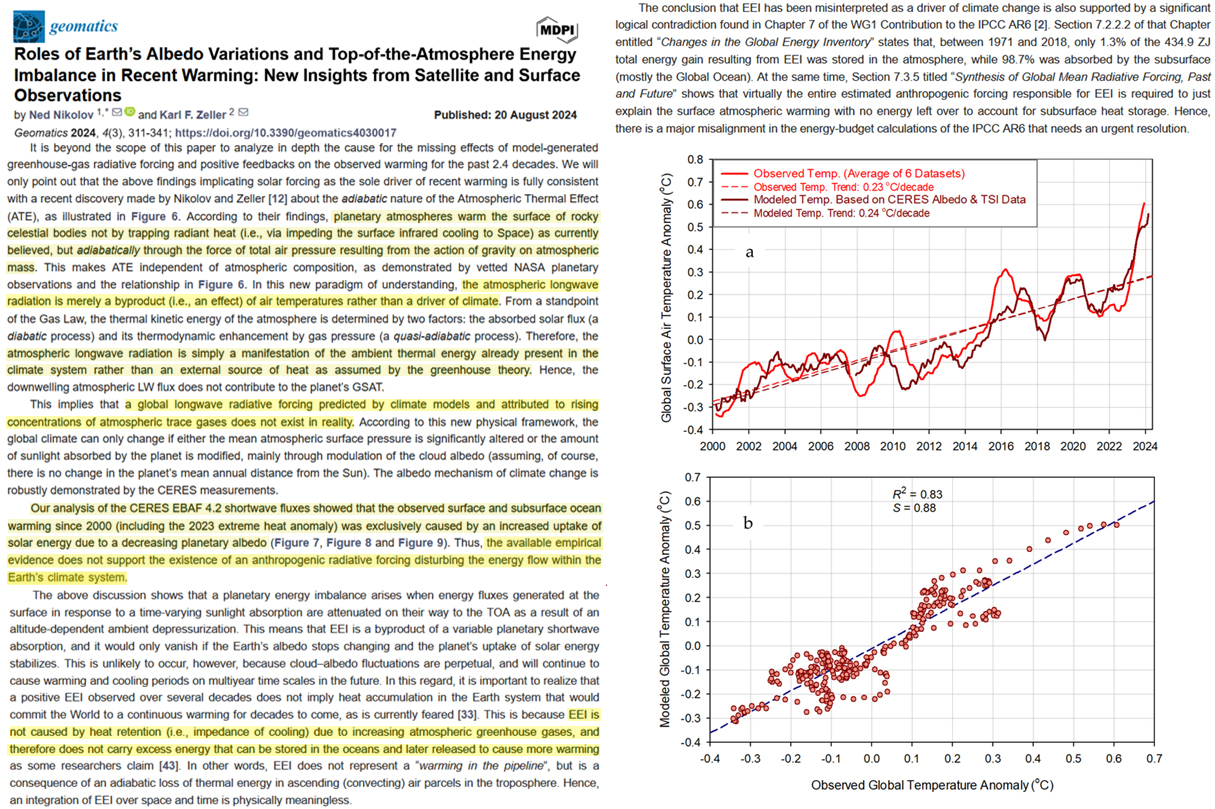
“CERES data do not support the hypothesis that the observed EEI [Earth’s Energy Imbalance] is a result of heat trapping by increasing atmospheric greenhouse gases. Instead, these data indicate that the Earth system has gained energy through an increased absorption of solar radiation…”
“Our analysis of the CERES EBAF 4.2 shortwave fluxes showed that the observed surface and subsurface ocean warming since 2000 (including the 2023 extreme heat anomaly) was exclusively caused by an increased uptake of solar energy due to a decreasing planetary albedo…”
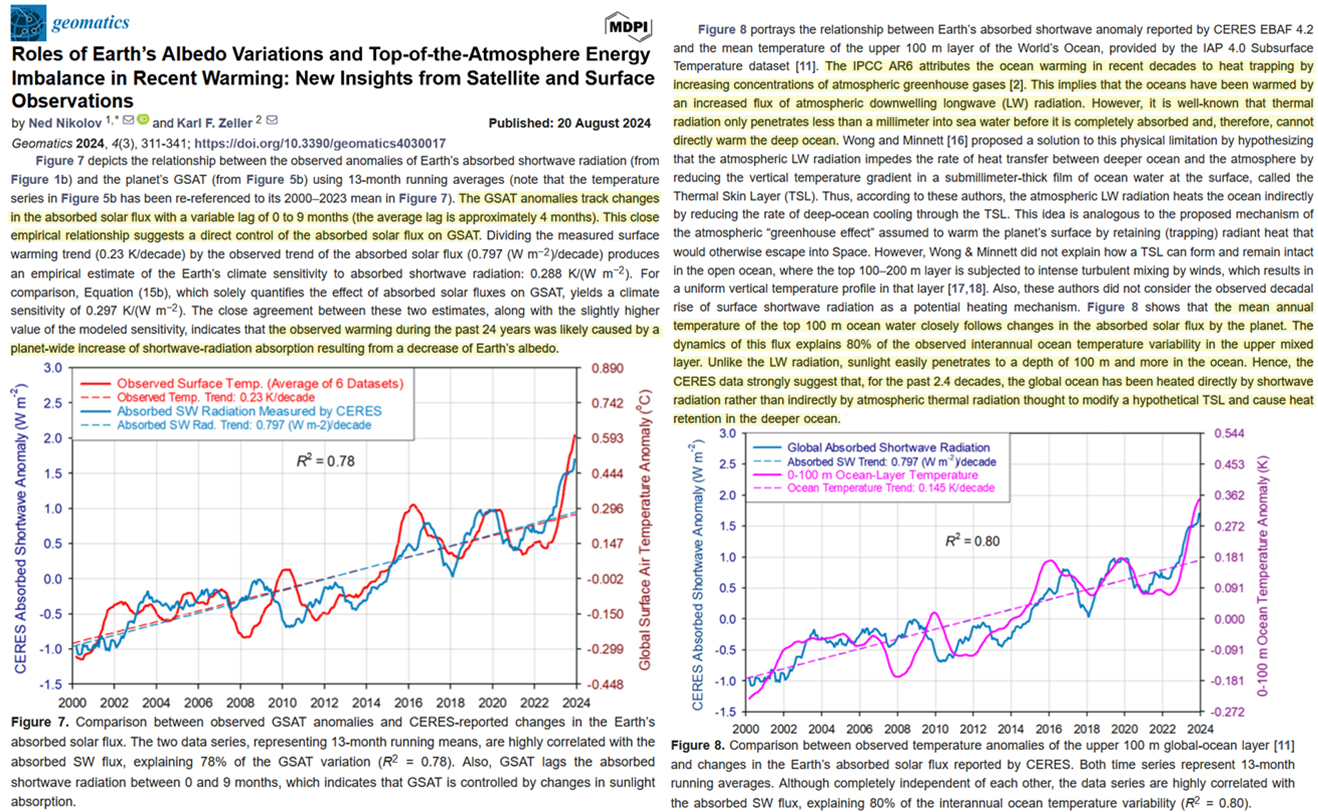
Image Source: Nikolov and Zeller, 2024
Drs. Nikolov and Zeller further explain “the atmospheric longwave radiation is merely a byproduct (i.e., an effect) of the air temperatures rather than a driver of climate.”
This is because Earth’s Energy Imbalance (EEI) – the energy budget presumed to be the determinant of atmospheric and ocean warming (positive imbalance) or cooling (negative) – “is not caused by heat retention (i.e., impedance of cooling) due to increasing atmospheric greenhouse gases, and therefore does not carry excess energy that can be stored in the oceans and later released to cause more warming.”
In other words, the anthropogenic global warming conceptualization is not a real-world phenomenon. It does not exist.
“[A] global longwave radiative forcing predicted by climate models and attributed to rising concentrations of atmospheric trace gases does not exist in reality.”
“Thus, the available empirical evidence does not support the existence of an anthropogenic radiative forcing disturbing the energy flow within the Earth’s climate system.”


It has become quite clear that CO2 forcing is virtually non-existent, mainly because 99.5% of whatever IR CO2 absorbs close to the surface is 99.5% thermalized, meaning 99.5% of what CO2 does is warm the other [non-radiating] air molecules. That’s the totality of what “heat trapping” actually means. It doesn’t impact radiation at all.
https://www.google.com/url?sa=t&source=web&rct=j&opi=89978449&url=https://tallbloke.wordpress.com/2012/02/13/doug-proctor-climate-change-is-caused-by-clouds-and-sunshine/&ved=2ahUKEwin7Jvx8YuIAxVUETQIHZl0Bo0QFnoECBYQAQ&usg=AOvVaw3rqzJyy9jE1H7tO94fjwhZ
I looked at this in 2010, Bright Sunshine Hours vs Maximum Daily Temperature for Central England, 1930 to 2010. (Changes in Bright Sunshine as a proxy for changes in serious cloud cover). I found almost all temp changes correlated with cloud cover changes once oceanic Temperature cycles were eliminated.
It was a crude analysis, I admit. But I couldn’t find serious cloud cover analysis – and I’m not surprised. Anything that conflicts with CO2 as the enemy doesn’t get funded.
I object to the rush to globalize data. Covid19: it was presented as a global threat to all humans when it was a serious threat to a small, mostly identifiable group – who did not include children. In reverse, the “vaccines” were said to be safe when they were dangerous to a small, identifiable group. If we were to analyze by nation or subnation for temperatures, cloud cover, humidity and even albedo, I’ll bet we’d be questioning CO2 as the primary and only cause of Global Warming.
I hope this study survives my expected round of debunking and suppression. Also the recent study on atmospheric humidity as a function of human agriculture and activities. But I doubt it.
[…] From NoTricksZone […]
[…] havaitsin uutisointia (Linkki), joka viittaisi siihen, että koko hiilidioksidin takaisinsäteilyn aiheuttama […]
Even if the semi-empirical state equation from N.&Z. is wrong, the fact is that almost all the T increase is due to an albedo decrease.
This is out of context but I think it is of interest :
Photosynthesis impact on global temperatures :
– I was searching for what fraction of the incoming TSI (340 W/m²) was absorbed by photosynthesis. The answer is about 1% (Quora), thus 3.4 W/m².
Knowing that there was a greening enhancement due to CO2 increase of about 20% in the last 40 years, as satellites data show, this correspond to about 3.4 (total absorption) * 0.2 (greening %) * 0.7 (CO2 actual effect) = 0.48 W/m² more that are converted in carbo hydrates.
https://science.nasa.gov/earth/climate-change/co2-is-making-earth-greenerfor-now/
During the same 40 years period, CO2 concentration increased by about 20%. Using the results of the Happer’s paper (Radiative forcing RF = 3 W/m² by doubling the CO2 concentration) :
RF increase during the last 40 years = 3 * ln(C/C0)/ln(2) = 2.08 * ln(1.2) = 0.38 W/m².
If these figures are correct, the CO2 increase induced, if anything, a net cooling of 0.1 W/m² during the last 40 years.
Weird isn’t it ?
Corrections from my previous post :
1) the absorbed TSI by the surface is 163.3 W/m² (not 340 W/m²), thus the estimated energy which may be transformed in carbohydrates instaed of heat is 1.63 * 0.2 * 0.7 = 0.23 W/m² (not 0.48 W/m²).
The 163.3 W/m² come from the Earth energy budget (NASA 2017) :
https://www.nasa.gov/centers-and-facilities/langley/what-is-earths-energy-budget-five-questions-with-a-guy-who-knows/
The 0.7 effect of CO2 on photosynthesis comes from here :
https://science.nasa.gov/earth/climate-change/co2-is-making-earth-greenerfor-now/
2) The RF increase, according the the Happer’s paper of 3 W/m² by doubling CO2 concentration applies on clear skies. Under clouds, which absorb almost 100% in the IR spectrum (and particularly in the 15µm waveband) and with a cloudiness of 67%, the RF increase during the last 40 years allegdly due to CO2, could be (using IPCC logarithmic formula with Happer’s parameter and taking 67% cloudiness into account) : 3 * (1 – 0.67) * ln (1.2) / ln (2) = 0.26 W/m².
3) Thus, the net increase of RF during the last 40 years could be almost 0 (0.03 W/m²) and if all those assumptions are correct, during the last 40 years, the CO2 didn’t induce any significant temperature increase.
[…] Eine kalte Nacht mit örtlichem Bodenfrost in Deutschland. GFS nun ohne September-Hitze… Neue Studie: 100 % der Erwärmung von 2000 bis 2023 werden durch solaren Antrieb erklärt … Der menschliche […]
[…] global surface air temperature (GSAT) warming throughout the first 24 years of the 21st century. (Read more) […]
I wonder though if the increase of Wind Turbines have caused the decrease in cloud cover over the earth since the wake/turbulence a single wind turbine produces stretches over considerable space impeding the flow of air.
It would be ironic,
[…] Meldung: Neue Studie: 100 % der Erwärmung von 2000 bis 2023 werden durch solaren Antrieb erklärt … Der menschliche […]