“The main factor governing the annual increase in atmospheric CO2 concentration is the SST [sea surface temperature] rather than human emissions.” – Ato, 2024
Another day, another new scientific paper has been published reporting efforts to curb anthropogenic CO2 emissions are “meaningless.”
In this study multiple linear regression analysis was performed comparing SST versus anthropogenic CO2 emissions as explanatory factors and the annual changes in atmospheric CO2 as the objective variable over the period 1959-2022.
The model using the SSTs (NASA, NOAA, UAH) best explained the annual CO2 change (regression coefficient B = 2.406, P = <0.0002), whereas human emissions were not shown to be an explanatory factor at all in annual CO2 changes (regression coefficient B = 0.0027, P = 0.863).
Most impressively, the predicted atmospheric CO2 concentration using the regression equation derived from 1960-2022 SSTs had an extremely high correlation coefficient of r = 0.9995.
Thus, not only is the paradigm that says humans drive atmospheric CO2 changes wrong, but “the theory that global warming and climate change are caused by human-emitted CO2 is also wrong.”
“SST has been the determinant of the annual changes in atmospheric CO2 concentrations and […] anthropogenic emissions have been irrelevant in this process, by head-to-head comparison.”
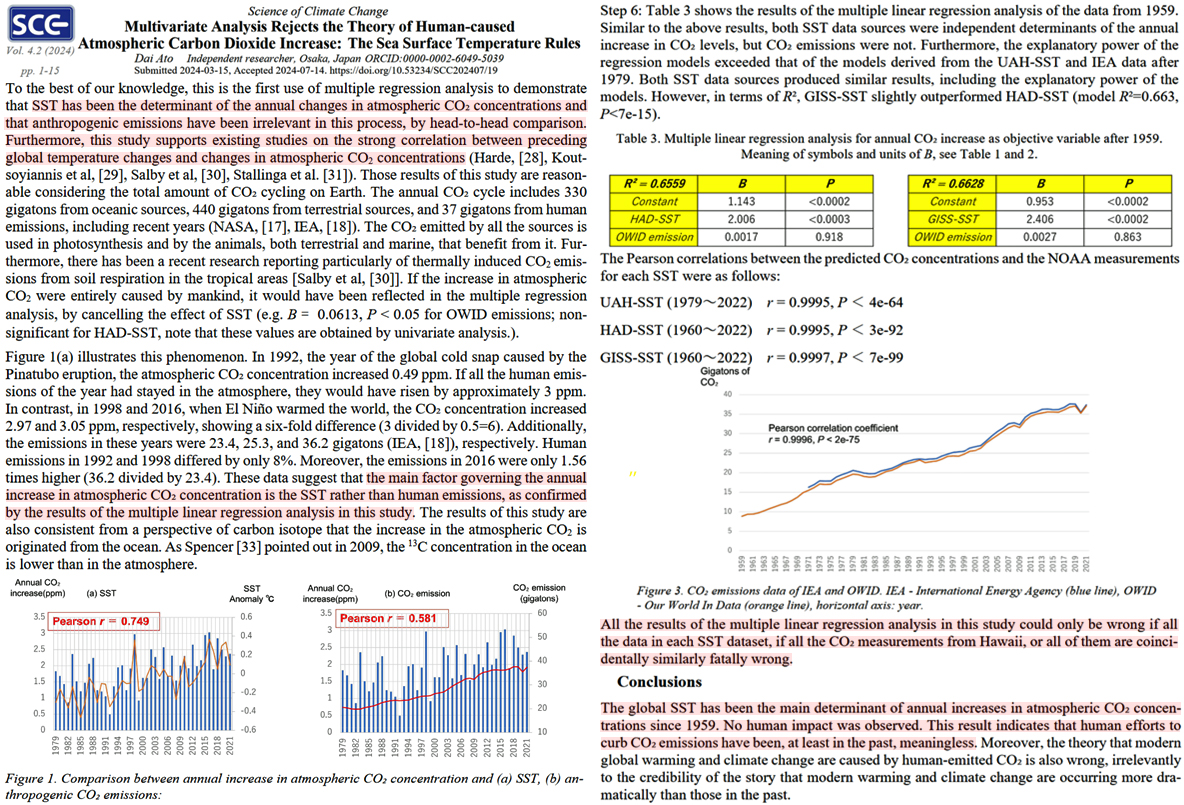
Image Source: Ato, 2024
This is not the first study to have addressed this lack of correlation between annual changes in atmospheric CO2 and anthropogenic CO2 emissions.
Wang et al. (2013) assessed that CO2 emissions derived from human activity (fossil fuel combustion and land use changes) only account for about +0.1 to 0.3 PgC/yr of the annual change in CO2 concentration. This is about “10% of the variance (σ²) of the CO2 growth rate.”
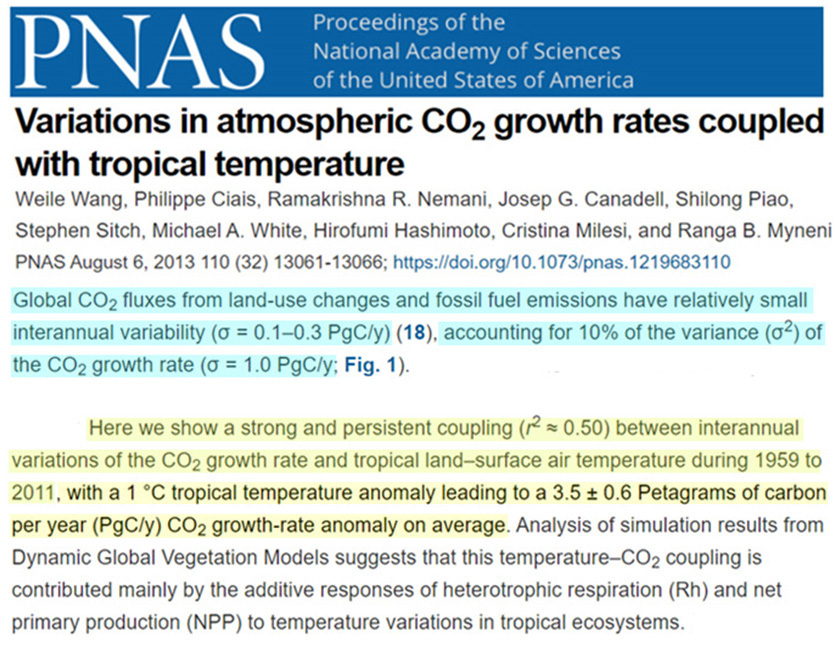
Image Source: Wang et al., 2013
Jones and Cox (2005) have pointed out that the changes associated with annual fossil fuel emissions are unlikely to explain CO2 growth rate anomalies.
“…it is unlikely that these anomalies can be explained by an abrupt increase in anthropogenic emissions, as the anomalies are much larger than annual increases in fossil fuel emissions.”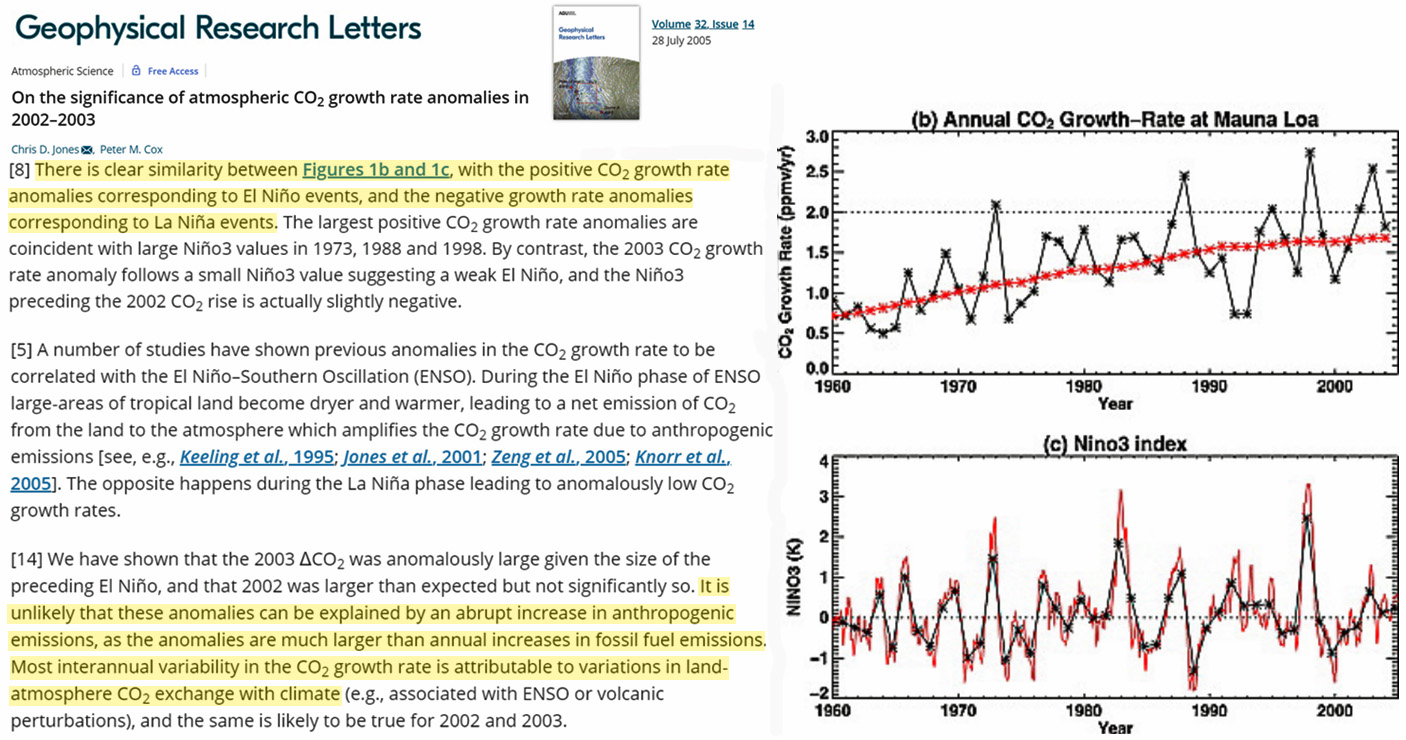
Image Source: Jones and Cox, 2005
Dr. Jari Ahlbeck (2009) also assessed the correlation between fossil fuel emissions and the increase in CO2 growth rates is “clearly statistically insignificant.” He therefore excluded this factor from consideration in his analysis of the mechanisms of CO2 variability.
A chart included in the body of the paper reveals 5-year periods where there was either a decline in the annual CO2 emissions trend (5.33, 5.17, 5.13, 5.11, 5.29 GtC/yr for 1980-1984) or a flattened trend (6.40, 6.53, 6.63, 6.59, 6.57 GtC/yr for 1995-1999).
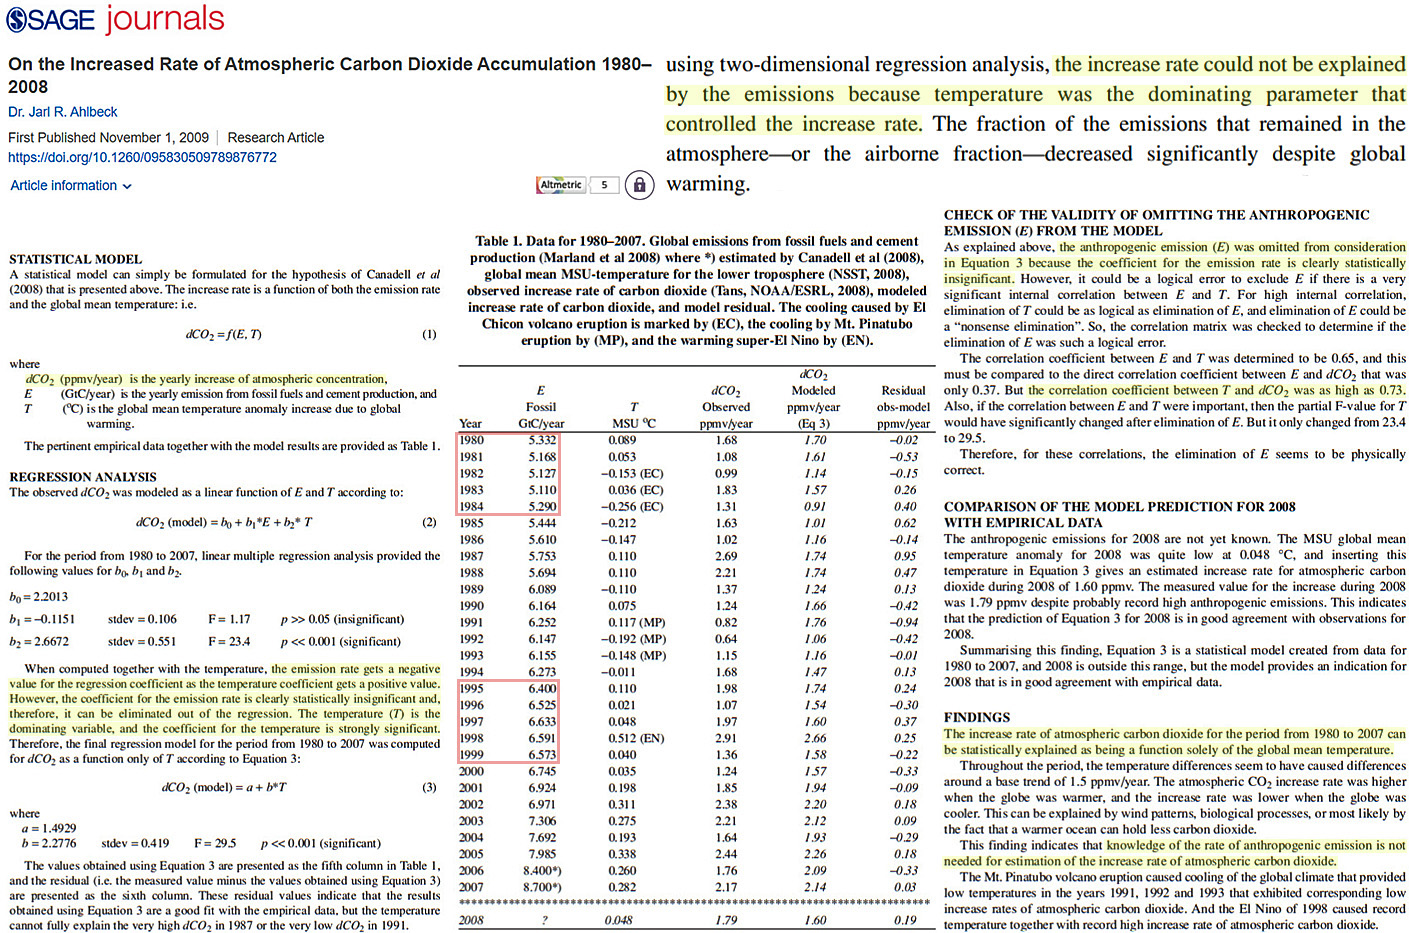
Image Source: Ahlbeck, 2009
Even an analysis detailed in the Carbon Brief blog from a few years ago suggests “global CO2 emissions have been flat – if not slightly declining – over the past 10 years.” This obviously does not support the conclusion that an increase in the CO2 growth rate has been driven by flat to declining human emissions.
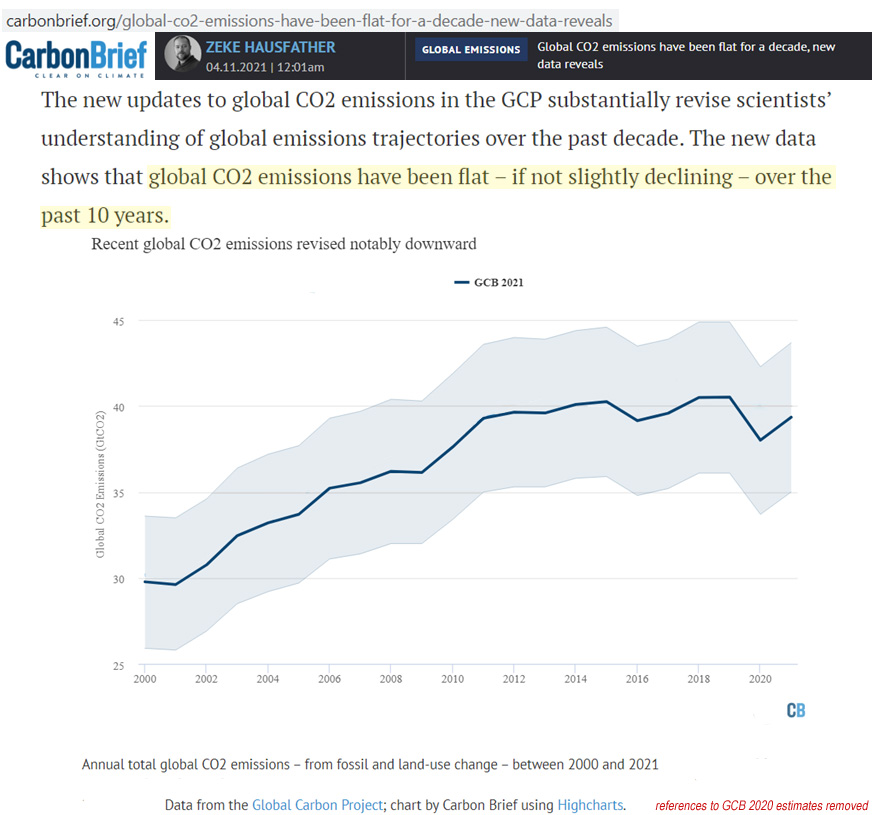
Image Source: Carbon Brief
An additional side note found in the Ato paper addresses the lack of a link between human methane emissions and atmospheric methane growth rates.
Although human methane emissions have risen dramatically in recent decades, “atmospheric methane concentrations have declined since the 21st century.”
“…natural fluctuations are far more powerful than human emissions in terms of the influence on atmospheric methane levels.”
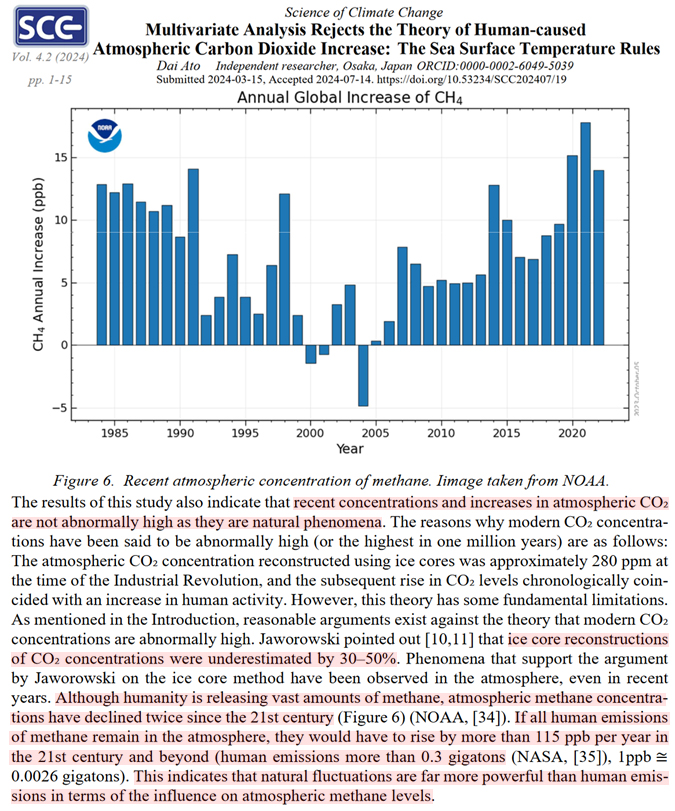
Image Source: Ato, 2024
So we not only have a lack of correlation between human emissions and annual variations in atmospheric CO2 (and CH4), we even have flat to declining trends in annual anthropogenic CO2 (and CH4) emissions in recent decades – the opposite explanatory directionality.


Thanks for those references.
Ole Humlum (Humlum & al. 2012) also found no correlation between anthropogenic CO2 emissions and global CO2 concentrations, but a high correlation between SST and atmospheric CO2 concentration, CO2 lagging SST by 11-12 months.
Analyzing the 4 CO2 measurement stations at different latitudes (Alert 82°N, Mauna Loa 20°N, Ascension 8°S, South Pole 90°S) Humlum also found no consistency with CO2 emission from the mean latitude where anthropogenic CO2 is emitted (40° N) but a strong agreement with CO2 emission from near or south of Equator.
https://www.researchgate.net/publication/257343053_The_phase_relation_between_atmospheric_carbon_dioxide_and_global_temperature
Yet, according to headlines, we merely have to burn one fresh witch per day to receive the blessings of the government – settled science demands obedience, and if any peer reviewed studies say otherwise, burn two witches, say 4 Hail Marys while genuflecting to Gaia, and plug your ears – that should turn the tide…
Despite this “So we not only have a lack of correlation between human emissions and annual variations in atmospheric CO2 (and CH4), we even have flat to declining trends in annual anthropogenic CO2 (and CH4) emissions in recent decades – the opposite explanatory directionality.” We still have a political problem in other words, blame the politicians not CO2.
Everyone should read the article by G-E Beck referenced in the ATO article (2022 but original 2009). Just click the reference and it will download. The amount of work that Beck did is impressive some 90,000 results from balloons and measurement at sampling sites spread around the world. He shows the concentration at different heights, different latitudes and variations over the year. One thing clear is that past CO2 levels may not have been much different to the present. Measured result go back to the 1800’s and around 1941 the concentration may have been around 400 ppm due to the high land and SST in the 1930’s. The supposed base level of 280 ppm used in some publications is rubbish and based on no factual data.
Thanks Pierre for your continued good work.
More recent technology, namely plant stomata proxies show higher CO2 concentrations than the ice cores.
https://i0.wp.com/fusion4freedom.com/science/co2-2.gif
[…] by K. Richard, Sept 2, 2027 in NoTricksZone […]
The fact that there is strong seasonality in the Mauna Kea CO2 measurements bears this out. The CAGW crew would not be able to explain it from what I have seen. But the change in SST would be seasonal as such.
The major problem with this finding is that the isotope analysis of atmospheric CO2 shows it’s largely sourced from burning fossil fuels. This paper and the isotope argument cannot both be correct.
Our d13 isotopic caracteristic is in the same ball park as the biomass d13 signature, the two being lower than atmospheric d13, so the observed d13 decrease does not prove humans are the cause :
– it may also be caused by an enhanced CO2 cycle with more emission from biomass, soils, …
Another way to investigate humans effect is to try to evaluate the d13 signature of the net input in the atmosphere :
– this has been carried on in the Koutsoyiannis’ paper “Net Isotopic Signature of Atmospheric CO2 Sources and Sinks: No Change since the Little Ice Age”, in which the author, estimates the d13 isotopic signature of the net input (Ci) in the atmosphere.
This is achieved by applying the mass conservation law and by using the official data on the atmospheric d13 and CO2 measurements.
For anthropogenic CO2 to be the cause of the atmospheric d13 decrease, the d13 signature of the net input Ci must have decreased :
– it is actually found that d13(Ci) has been increasing during the last decades.
If correct, this finding invalidates the fact that the observed atmospheric d13 decrease is induced mainly by anthropogenic CO2.
I encourage anyone to read Koutsoyiannis’ paper :
– it is well written, clear and informative and a deep insight on the d13 subject.
” This paper and the isotope argument cannot both be correct.”
Exactly. The isotope argument is wrong. It doesn’t take into account the equilibrium relationship between the oceanic and atmospheric CO2.
The amount of CO2 that goes into and out of the oceans changes in response to all of the other sources and sinks. The concentration of CO2 in the atmosphere is controlled by the equilibrium relationship. When the world warms, the oceans warm, and so the solubility in the oceans decreases. The proportion of total CO2 that can be dissolved in the oceans gets smaller. Which means the proportion in the atmosphere gets larger.
Which is why, when it is warmer, CO2 in the atmosphere increases, as this paper has found.
The isotope ratio change is evidence that humans have been burning fossil fuels because a disproportionate amount of the CO2 in the atmosphere came from fossil fuels. However, it is not evidence that this is the cause of the CO2 rise.The human generated CO2 takes the place of oceanic CO2 that would have moved into the atmosphere had humans not been burning fossil fuels.
[…] From NoTricksZone […]
I have studied the Beck time series from1826 to 1960 and the Mauna Loa CO2 records from 1959 to 2020. Together, the CO2 records cover a total period of 200 years. The study has revealed that:
1. Atlantic CO2 signature from 1826-1960 coincides with the Mauna Loa atmospheric CO2 growth variability signature, the global sea surface temperature variabilitysignature, and the lunar nodal tide variability signature. This is strong evidence of alunar forced atmospheric CO2 variations.
2. Atmospheric CO2 variations have a maximum growth rate when global sea surface temperature variations have a maximum state. The pi/2 (rad) phase lag between global sea temperature variations and atmospheric CO2 variations, reveals that atmosphericCO2 variations are controlled by global sea temperature variations.
3. The CO2 variability signature coincides with the lunar nodal tide signature. The lunar nodal tide spectrum reveals a chain of events from a lunar nodal tide variation to global sea surface temperature variations and atmospheric CO2 variations.
4. A lunar nodal tide spectrum in atmospheric CO2 growth reveals that CO2 is not controllable.
https://www.researchgate.net/publication/366823612_Lunar_Forced_Mauna_Loa_and_Atlantic_CO2_Variability
Many thanks for your link and the very interesting paper.
I have some questions about the chosen analysis by wavelets :
– I would like to know what are its strengths/weaknesses, for time series analysis, with respect to a classical Fourier analysis,
– what introductory documentation with application on time series analysis would you recommend on wavelets (engineer level) ?
Thanks in advance.
I thought it was interesting they said “This indicates that natural fluctuations are far more powerful than human emissions in terms of the influence on atmospheric methane levels”
I think the IPCC value for methane turnover time (aka residence time) is too high.
The concentration of methane is not the same all over the globe. Samples taken in the north of the northern hemisphere have concentrations that are larger than in samples taken in the tropics. And samples in the tropics are larger than in the south of the southern hemisphere.
I downloaded the methane data from the GML data finder and calculated the annual averages of a number of different sites.
There is a gradient of concentration, highest in the north and lowest in the south. I calculated the difference between the annual average values from Barrow (71 deg N) in Alaska is about 8% higher than the data from Baring Head (41 deg South) in New Zealand. The standard deviation of the differences was 0.47%
This is confirmation of a 3 dimensional graph, Figure 1.11 in the IPCC first assessment report (FAR) p.19 which shows the changes in methane over time and latitude. I had looked at that graph many times before I understood its implications.
The IPCC sixth assessment report (AR6) has a graph on p.701, Figure 5.13, that also shows a concentration gradient.
The difference in CO2 values between different sites is about 1 %. Much less than for methane.
So, what is the problem?
Well, methane is supposed to be a well mixed gas.
CO2 is a well mixed gas.
The turnover time for CO2 is about 4 years. The mixing time for gasses in the troposphere is about 1 year. (IPCC AR6 p.247)
Methane’s turnover time is supposed to be 9.1 years (and a pertubation lifetime of 11.8 years)
If this turnover time (aka residence time) is correct then methane should be better mixed in the atmosphere, but it isn’t.
The fact methane is less well mixed than CO2 strongly suggests the correct turnover time for methane is less than the turnover time for CO2.
This matters because the turnover time is used to calculate total emissions. That is both natural and anthropogenic emissions.
E = A/L
where E = Total emissions.
A = the amount of methane in the atmosphere.
and
L = the turnover lifetime.
If the turnover time is 9.1 years then anthropogenic methane emissions are about 60% of the total.
So we need to ask how certain can we be about the lifetime being about 9 years?
The IPCC, on p.9 of FAR, estimate “ an atmospheric lifetime for CH4 of
between 8 and 11.8 years” They reference Prinn et al.1987 ,who in “Atmospheric Trends in Methylchloroform and the Global Average for the Hydroxyl Radical” were looking into the oxidation of an halocarbon called Methylchloroform (CH3CCl3) and deducing its destruction rate. In the last paragraph they say that using this rate, which is similar to that of methane, calculate a lifetime for methane of 9.6 (+2.2.-1.5)years. Prinn et al. also say “The uncertainty in this lifetime does not include uncertainty in the rate constants.”
Without knowing the uncertainty in the rate constants it is not possible to know the total uncertainty.
The IPCC acknowlege that “Considerable uncertainty exists as to the lifetimes of methane and many of the halocarbons, due to difficulties in modelling the chemistry of the troposphere.”(IPCC WG1 FAR p.59)
Lassey et al. 1992 in “A Source Inventory for Atmospheric Methane in New Zealand and its Global Perspective “ say “Prinn et al. [1987] calculated a methane destruction rate of
0.104 +/- 0.21 /yr (lifetime = 9.6 yr) based on their estimates of OH.” This is a much greater uncertainty. It is possible they have included the uncertainty of the rate constants.
This means the destruction rate could be as high as 0.314/yr which would be a lifetime of 3.19 years. The turnover time is the inverse of the removal rate aka destruction rate.
But if the real turnover time is less than CO2’s, say 3 years, then total emissions are calculated like this.
1922 ppbv CH4 in the atmosphere times 2.77 Tg/ppbv = 5324 Tg CH4 in the atmosphere.
E=A/L
so
Total Emissions = 5324/3
= 1775 Tg/year
Anthropogenic emissions are estimated to be 357 Tg/year (AR6 p.703)
So anthropogenic methane emissions are 357/1775 = 0.2 or 20% of the total emissions.
So, in summary, Methane is significantly less well mixed than CO2 in the atmosphere. This suggests that the turnover lifetime used to calculate total emissions is too high.
If anthropogenic emissions are only 20% of total emissions there seems to be little chance reducing human methane emissions will have a detectable effect.
This would explain why they said “natural fluctuations are far more powerful than human emissions in terms of the influence on atmospheric methane levels”
[…] Read more at No Tricks Zone […]
There are some problems with this paper. The comments regarding ” This paper and the isotope argument cannot both be correct, “ point them out, very well done. Obviously, we are still interpreting a radically changing and complex system and that’s not easy. However, I’d like to point something out that is really just looking at this from a common sense perspective; let’s take a step back from all the science and observations and just ask a simple question: How long can we pollute our finite Earth system until we all choke on it?
I wanted to post the entire thread from a gent that goes under the moniker of TdeF over at Jo Nova’s website from May 4th, however the entire thread and relevant text would go for too long. So here is the link
https://joannenova.com.au/2024/05/saturday-57/#comment-2761250
Key part:
“The decrease in 13C and 14C cannot concretely be attributed to anthropogenic CO2. The measurements of decreasing 13C and 14C do not tell us whether the CO2 is anthropogenic or natural in origin. This is because a decrease in 13C and 14C is not a unique signature for anthropogenic CO2. ”
Yes, it is. But the logic is reversed. The lack of C14 is a unique signature for fossil fuel CO2. All other CO2 cycling in the ‘biosphere’ has C14 regardless of growing/rotting/doing nothing. Lifetimes are far shorter than 5740 years.
Unlike say a radioactive medical tracer, what you are looking for is a lack of radioactivity in Carbon. All free carbon is radioactive except fossil fuel. That is the trick. And it is absolute proof.
If as is alleged the 50% increase in CO2 in the air is man made with 0% C14, the total C14 level in the atmosphere must be 33% below the historic level. Presently it is only 3% below. In 1958 it was 2.3% below. This is not debatable. It is an accidental world size experiment to double C14 from one molecule per trillion of CO2 to two molecules per trillion of CO2. This CANNOT be removed. But it is all gone. Therefore ALL the CO2 from 1965 is in the ocean. And not just the top of the ocean.
As for C13, it is far less certain but the result is the same. The story there is dilution from -6 to -8 in the atmosphere. If it was from fossil fuels at -28, the total dilution would be much greater than an additional -2. If however the C13O2 was from the ocean you have 2 parts Atmosphere at -6 and 1 part ocean at -10 which gives you the value of -8. Which confirms the C14 result, not that it needed confirming. (the origin of these differences is that CO2 is more rapidly absorbed by plants if it is lighter, so C12 rather than C13. And like Henry’s law presumably different speeds at the same temperature, so what they seem to call kinetic fractionation, slight separation by speed)
“absorption of anthropogenic CO2 from the atmosphere has acidified the ocean”. That is a wild presumption and built into it is the idea that the extra CO2 in the air is ‘anthropongenic’ or man made from fossil fuel.
Like all of this it is possibly the reverse of the truth when you consider that 98% of CO2 is in the ocean and there is only 3.0% fossil fuel CO2 in the air. Rather I suspect that the steady increase in ocean surface temperature indicates a long ocean oscillation which may be bringing warmer currents to the surface which simply contain more CO2. So the usual business of confusing cause and effect. Warming increases CO2. CO2 does not increase warming. And warming correlates with CO2 increase in the ocean surface because that is the origin of the CO2. Which is confirmed by the both C13 result and the C14 results.
As said I am not happy with the Revelle factor as it assumes shallow water. Below 20 -30 metres, CO2 is practically a liquid, not a gas. Although it would have characteristics of both.
And the bomb blast C14 has two major lessons.
Firstly it decays with a perfect e-kt which confirms a single sink, not multiple sinks as proposed by the Bern model. Secondly the horizontal asymptote is almost exactly where it started, which means a doubling in C14 has vanished completely. This can only be explained by complete absorption in the deep ocean and dilution x 50, which confirms the model of a disconnected top ocean and bottom ocean is rubbish.
The disconnect between the 3500% growth rate of emissions and the 50% growth of CO2 is not explicable except by rapid maintenance of an equilibrium balance as dictated by Henry’s Law.
I also believe Henry’s Law which arises entirely from the Kinematics of CO2 molecules at the air/water interface is in play. Except that the environment is subject to many conditions in the real world where Henry’s Law is in the laboratory. In the real world you have wind, waves, droplets, turbulence. And exchange of gases increases to the fourth power of the wind speed. Plus the phase change in CO2 at even modest depth. Still the principle is the same but the return to equilibrium is clearly very fast.
We see this in fossil fuel CO2 emission which have reached a record 5% of atmospheric CO2 each year. But CO2 is only growing at 0.2% per year. Total CO2 is nearly stationary when it should be growing 5% a year if fossil fuel CO2 is adding directly. So we know that at least 96% of fossil fuel CO2 goes straight in the water, within say six months.
And my other observations include the incredibly fast restoration of CO2 levels across the planet, the maintenance of CO2 levels within 1% across the planet, the variation of CO2 with seasonal warmth, summer and winter and anticyclic from the North to South hemisphere confirming both mechanism in that heating increases CO2 and sensitivity.
For your last comment, that equilibrium is achieve quickly, confirming the involvement of the entire ocean to remove C14 which cannot be removed, just diluted plus the half life of 7 years and the single perfect e-kt which also proves the Bern model wrong.
There is one and only one possible story. That CO2 is in rapid equilibrium with the ocean. And that increasing surface temperature, likely from currents is responsible for increased CO2. We do not need to invent ways in which increasing CO2 by 50% over 270 years can increase temperature suddenly.
And my favorite proof by far is in the model of Prof Carl Otto Weiss and team. I have never seen such a good fit from two sine waves and these prove beyond a doubt that the major factors in temperature are ocean currents and solar activity. CO2 is irrelevant, tiny and saturated anyway.
More at the link
https://i.ibb.co/Y3K9VCf/climatelie.jpg
[…] Read more at No Tricks Zone […]
[…] Read more at No Tricks Zone […]
[…] Read more at No Tricks Zone […]
[…] Read more at No Tricks Zone […]
Dear Petit Barde
Thank you for your comment and question
1. I would like to know what its strengths/weaknesses are, for time series analysis, with respect to a classical Fourier analysis,
Fourier:
Identifies a set of stationary periods.
Lose information on the phase of the periods. The time when the periods have a maximum and a minimum. Then you lose information about future events.
Wavelets:
Identifies period time and phase. Can then identify the time periods’ minimum and maximum. Opens to calculate future events.
2. what introductory documentation with application of time series analysis would you recommend on wavelets (engineering level)?
I am using MATLAB Wavelet Toobox
You will find many examples on my blog: https://www.climateclock.no
Harald Yndestad
Thanks !
[…] Fonte: No Tricks Zone […]
[…] Fonte: No Tricks Zone […]
[…] tanulmányt Kenneth Richard összefoglalója, illetve Dai Ato eredeti cikke alapján […]