By Matti Vooro
A quite recent headline in our news warned that “Regions must brace for weather extremes: UN climate panel”. Apparently this will be the after-effect of global warming caused by man-made greenhouse gases. We can expect more frequent extreme events such as the drought in Texas and the Thailand floods because of global warming, they said.
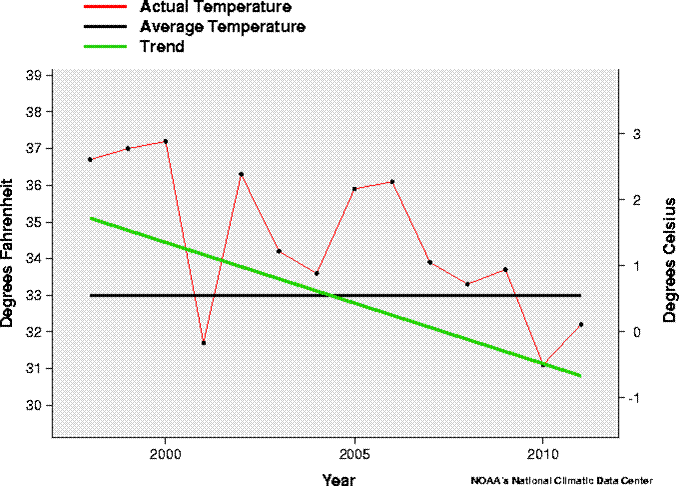
It is strange that the IPCC panel should link recent extreme weather events to global warming because quite simply there has been no global warming to speak of for 10-15 years now based on the official climate data from the governments of the world [US /NCDC, ENVIRONMENT CANADA and THE EUROPEAN ENVIRONMENTAL AGENCY. Recently US meteorologist Anthony Watts showed that the continental U.S. has not warmed in the last 10 years, and in fact has grown cooler in the summer and colder in the winter. The climate data numbers come from the National Climatic Data Center.
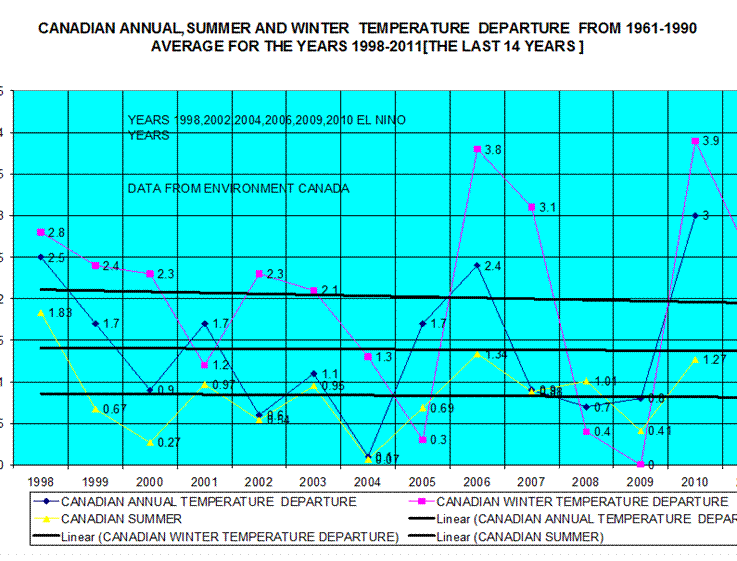
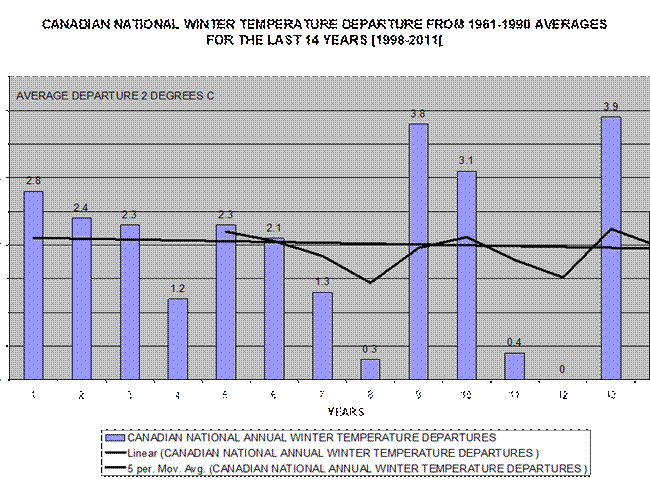
Not only have the US temperatures been flat for the last 10-15 years, but a similar pattern is happening in Canada. The Canadian national annual, summer and winter temperature departures from the 1961-1990 averages have been flat for 10-14 years when measured on Excel linear trend and based on Environment Canada’s own data. Comparing today’s winter temperature departure with that of the period 1961-1990 can be misleading since the 1961-1990 period was low or cool phase of the planet’s 60 year cycle and any comparison will always show warming not due to man generated global warming, but due to natural and regular changes (30 years of cooler weather followed by 30 years of warmer weather) in the planets climate pattern. It is like comparing summer temperatures with winter temperatures, the summer will always show warming.
Regionally 7 of the 11 regions reported by Environment Canada showed declining or flat winter temperature departures over the last 10 years. The average winter departure was about 2°C between 1998-2011. Only the Atlantic Coast, Northeastern Forests and Arctic Tundra, Mountains, and Fiords showed rising winter temperature departures. But the North Atlantic Ocean heat content is dropping and so is the Arctic Ocean’s heat content.
The Northern Hemisphere, North Atlantic, North Pacific and East Pacific SST Anomalies are all dropping. It will not be long before the Atlantic Coast and the Arctic regions will show similar cooling as the AMO goes cool or negative. North America is more likely see much cold weather during the next 20-30 years rather than global warming of 3-6°C as predicted by the IPCC. The recent severe winter weather along Alaska and the US east coast was just a sample of what may lie ahead. This cooling has been building for a decade now. So how can global warming be causing current and future extreme weather events when global warming as predicted has not been happening for a decade and is unlikely to happen during the next 30 years since the world 60-year climate cycle is heading for colder weather due to changing ocean surface temperatures and changes in deep ocean currents?
Ocean SST as measured by PDO, AMO, ocean heat content and ENSO cycles and pressure changes as measured by AO and NAO are all pointing to a future cooling planet. AMO has gone negative in November 2011 for the first time since early 2009. Time will tell whether this is just the normal seasonal dip or a long-term pattern. This cooler AMO, if sustained through the winter, could signify cooler weather for the US east coast and Western Europe. Several severe storms have already happened this fall on both sides of the Atlantic.
Here are two web references to support the above evidence of global cooling in North America: http://wattsupwiththat.com and http://ca.news.yahoo.com/blogs.
So why are we pouring all this taxpayers money to solve a the non-existing problem as currently defined when the world is near financial collapse and there are so many more pressing problems in our world today? Any prudent leader should see we need to change our priorities.
Further evidence of global cooling
The five following graphs illustrate the lack of global warming in US and Canada.
CONTIGUOUS US WINTER TEMPERATURES, 1998-2011 per NCDC
http://lwf.ncdc.noaa.gov/oa/climate/research/cag3/na.html
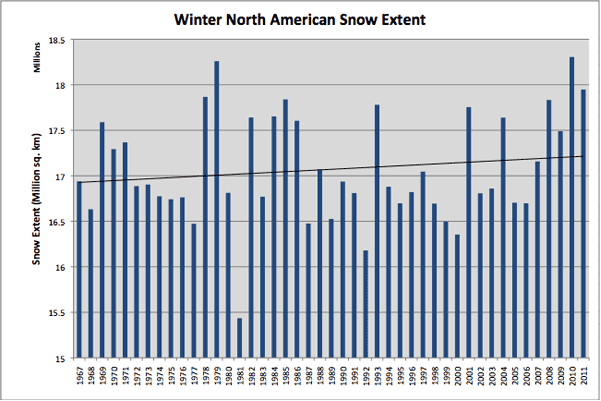
North American snow extent as reported by Rutgers University
The North American snow extent has been increasing for 5 years in a row since the Pacific Ocean SST pattern started to show cooler water as measured by PDO. Already the 2011-2012 winter snow extent is greater than that of 2010-2011 winter by some 60% by week 45. Snow extent levels are approaching the record levels of the late 1970s.
http://climate.rutgers.edu/snowcover/chart_seasonal.php?ui_set=namgnld&ui_season=1
Canadian winter, summer and annual temperature departures from 1961-1990. Averages for the years 1998 -2011
The annual trend of the departures as shown below indicates a flat or slightly cooling trend, and not global warming at all. Yes they fluctuate but that does not mean the trend is warming.
Canadian winter temperature departures from 1961-1990. Averages for the years 1998-2011
http://ec.gc.ca/adsc-cmda/default.asp?lang=En&n=4A21B114-1
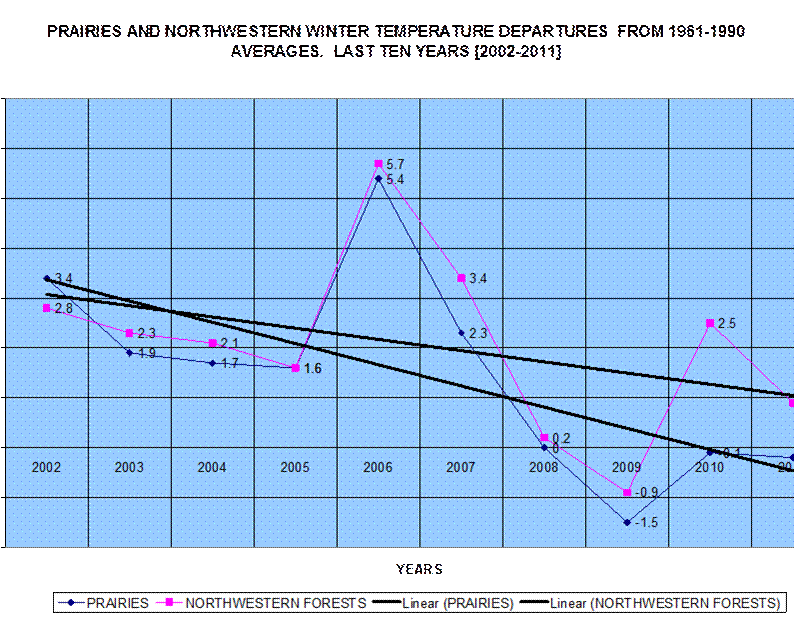
The winter cooling is especially apparent in the Canadian bread basket, namely the Prairie Provinces and their north half or the Northwestern Forests. Environment Canada reports in their Trend, Extremes and Current Season Ranking, 1948-2011[64 years] that the warming trend in these areas is 3.2 and 3.7 degrees C over the last 64 years. What is far more meaningful and not stated in their bulletins is that this area has been cooling for 10 years and very rapidly since 2006. The winter temperature departures dropped some 7°C between 2006 and 2009 alone and have been below or at the 1961-1990 averages for the last 3-4 years (see below). No wonder we are having all the spring floods from the extra melting snow in this area.
The cold winters are likely to continue and so are the floods for the next 20-30 years as the 60 year planetary climate cycle goes into its cold phase. We are having the winters like the previous cold cycle 30 years ago. Yet Environment Canada only talks about continuing global warming . on their web page. There is absolutely nothing about possible global cooling or warning to the Canadian public and businesses about possible flooding again, crop losses, infrastructure disruptions, etc from the pending weather.
http://ca.news.yahoo.com:80/colder-temps-west
PDO
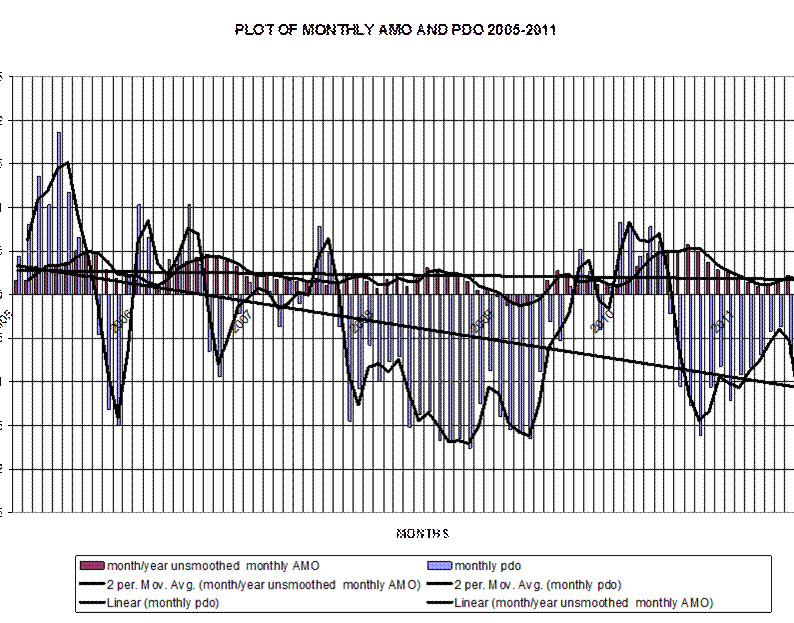
In November, the Pacific Decadal Oscillation or PDO dropped to its lowest level since 1961 at -2.33. The 1961 level was -2.69. PDO is an after effect of the ENSO signal and reflects a spatial pattern of the amount of cooler water in the north Pacific. Negative levels are accompanied by much cooler weather in the Northern Hemisphere especially in North America. This index started to go negative in 2007 and based on historical patterns, it could be negative for the next 20-30 years, signifying cooler weather for the same period. This has already been apparent the last four years in the North American weather – especially the winters.


Northern Hemisphere snow cover anomalies as provided by Rutgers University show the 2011 snow cover running just slightly under 3.3 million sq miles over the average by the end of November . This the highest anomaly since the early 1990’s and winter start is stll 3 weeks away.[from the end of November]
http://climate.rutgers.edu/snowcover/chart_vis.php?ui_year=2011&ui_month=11&ui_set=1
Solon insolvent. Massive state loans lost. German Solyndra.
http://www.ftd.de/unternehmen/industrie/:insolvenz-fahrlaessige-subventionen-fuer-solon/60142598.html
Interesting: “Fahrlässige Subventionen” == “Negligent Subsidies”
That means somebody in charge of the money was negligent; failed to exercise their proper duty. Everywhere else, that could even be a crime.
Alas in politics, it seems a prerequisite for promotion. 🙁
Thanks Matti. If they talk about more frequent extreme events, they are talking about increasing variances. Usually we see time series of global annual means. Have you ever seen a global time series of annual variances? If that series exists, is there an upward trend? If so, is the slope significantly different from zero? Or do they mean a handfull of cherry-picked extremes?
Mindert
This maybe of help
http://wattsupwiththat.com/2011/12/05/common-link-in-extreme-weather-events-found-and-no-it-isnt-agw/
My personal poinion is that the extreme weather events were perhaps cherry picked by the warmists as being caused by global warming for pure PR purposes prior to the Durban meeting and to tie their flawed science and failed global temperature forecasts to events that were actually happening or something legitimate. Perhaps they were trying to recoup some credibilty by tying naturally happening and caused events to global warming hoping the general public would not know the real cause. The picked events were current and seemed to be picked because of their magnitude or timing quality in the short term rather than for their increased frquency of happening or their long term trend . Many events were just plain wrong to be classified even as extreme events caused by global warming like: the floods in Australia last year during an La Nina , the heat wave in Moscow due to jet stream blocking , the significant snow storms along the US east coast durin La Nina winters and the floods in central North America from the extra cold and snow from the previous winter,etc . Droughts happen in the US southeastand south west regularly depending on the PDO and AMO cycles and phases and some are worse than others . This had already been well documented in scientific papers previously The same can be said about the floods in Thailand due to monsoons .The public caught on and they lost even more credibilty as the public and media ridiculed the connection that the warmists were claiming . Talk about shooting one in your own foot.
Mindert
Tim Ball has written a little more about extreme events here
http://drtimball.com/2011/climate-change-extremism-is-doing-its-job/
http://drtimball.com/2011/severe-us-weather-claims-ethics-based-on-inaccurate-science/
Thanks for the links. This is embarassing stuff .
Joe Bastardi also points out that temperature is highly correlated with the combination of the AMO and PDO – he and Joe d’Aleo give this graph.
8.2 kilo year event and you
http://chiefio.wordpress.com/2011/12/13/8-2-kiloyear-event-and-you/
2 degree Celsius up vs 1/2 degree Celsius down
http://chiefio.wordpress.com/2011/12/14/2-c-degrees-up-vs-12-c-down/
h/t RichieP at WUWT, this video about the ESM (European Stability Mechanism) is a must see. Given the track record of brussels technocrats, I don’t doubt its interpretations. The ESM is expected to come into force in July 2012.
http://www.youtube.com/watch?v=hJneSSGLnSI&feature=player_embedded#!
The magic word to stop the IPCC and the UN is de-funding
Off topic, humble apologies but something blue and plodding this way comes, police state in Britain!
http://noconsensus.wordpress.com/2011/12/14/crackdown-shooting-in-the-dark/
//It seems that the world governments are escalating cliamtegate to the next level. Tallbloke a fellow recipient blog of the climategate emails, and linked on the right, was raided today in what seems to be a coordinated effort by Metropolitan Police, the Norfolk Constabulary and the Computer Crime division and the U.S. Department of Justice Criminal Division. His home was raided and computers were taken for ‘examination’.//
Germany is part of the EUSSR.
More stuff here
My comments in the comment thread.
Lost link http://eureferendum.blogspot.com/2011/12/force-for-evil.html
They sure would like to, but it will not work. Looks like The Team is putting pressure on gullible/culpable politicians who in turn to the police. Too bad it’s All Over The Net. A misfiring show trial might not be the best idea for The Team right now – though it might divert media attention from the fact that all those billions poured into the Renewables sector are just now seen by everybody to be swirling down the drain. “Burn the tapes!”
Reference to the PDO in the text
“PDO is an after effect of the ENSO signal and reflects a spatial pattern of the amount of cooler water in the north Pacific.”
The period ( . ) ought to be after the word pattern. The + and – in this index do get used with the words warm and cool, respectively. However, this makes little sense in describing a pattern.
Further, when Bruce of Newcastle makes mention of Joe Bastardi using a combination of the AMO and PDO – one needs to be aware that insofar as these are not calculated in the same manner, they should not be combined.
Bob Tisdale at http://bobtisdale.wordpress.com/
has explained this with his work cross-posted at WUWT. The misinterpretation of the PDO regarding +/- and warm/cool ought to stop.
Other than the above (and without carefully checking all the indicated records), I get the same sense of the recent non-warming global climate as discussed in this post.
John – I am aware that Bob Tisdale does not like the combination that the Weatherbell guys use, however I do not know their methods thus I can only keep an open mind. The correlation is interesting. Is it correct? Readers can decide for themselves. From the referenced paper Joe d’Aleo says:
“I standardized the two data bases and did a multiple regression analysis with the USHCN data, again using a 11 point smoothing as with the CO2 and TSI.”
Standardisation suggests he has addressed the issue of compatibility you raise (which would not be surprising since they are long time professional weather guys), but without detail I am not able to comment on the science of the standardisation approach used. It would be helpful also to readers if you could link to a specific article of Bob Tisdale’s which touches on this, as Bob’s website is pretty extensive (I recall he jumped on me in the comments thread to the WUWT cross-post but I can’t remember if he gave a specific argument why you shouldn’t).
Using the two indecies together is becoming formal, as given in Wyatt et al 2011, but I’ve only scanned her post and I’ve not read their paper (paywall), so again I can’t say anything about combinatorial issues or the methods they used.
A nice look at some empirical correlations of the PDO and the AMO with the temperature record is here.
Bruce of Newcastle says: “I am aware that Bob Tisdale does not like the combination that the Weatherbell guys use…”
It’s not that I don’t like it; it is “technically” wrong to combine them. I explained this in great detail in this post:
http://bobtisdale.wordpress.com/2011/06/08/on-the-amopdo-dataset/
Bruce of Newcastle says: “Standardisation suggests he has addressed the issue of compatibility you raise…”
Your assumption is incorrect. Refer to the post linked above.
The post reads: “Ocean SST as measured by PDO…”
That is incorrect. The PDO does not represent the Sea Surface Temperature anomalies of the North Pacific. The PDO is the leading principal component of detrended North Pacific SST anomalies. The PDO is actually inversely related to the North Pacific SST anomalies.
http://bobtisdale.wordpress.com/2011/06/30/yet-even-more-discussions-about-the-pacific-decadal-oscillation-pdo/
Regards
Bob – Thanks. I was aware PDO was inversely correlated with and derived from +20N NP temperature anomaly. Which I would presume is behind the ability of the Joes to use it in conjunction with AMO to correlate with USHCN v2 if suitably treated. (Sorry my link to their paper didn’t work in the previous post, here it is again).
When I mentioned ‘standardisation’ it was in reference to Joe d’Aleo’s paper, whencefrom the quote came (see the link just now). I was not commenting on Matti’s post. I think you have misunderstood what I was saying there.
On the question of combining the PDO and AMO datasets of course you can combine them, but the question is whether there is a useful and valid reason for doing so. That I am open minded about. You argue that they should not. In support of your proposal I can say that since the PDO and AMO are derived from SST’s they are not completely independent of USHCN v2 (statistically). The correlation may not be useful for predictive effect unless there is a lead or lag aspect. That I defer to the Joes, but you’ll note all I said was there is a correlation. And so there is. Although a link between USHCN and the SST’s to the east and west of the US may perhaps be unsurprising it nevertheless can be interesting enough, particularly if there are cycles in the SST’s – which do appear to be cyclic to some extent. Why are there cycles? I don’t know, but that doesn’t stop people from pointing them out and perhaps using what they say about medium term climate. I know you (and John also, above) don’t like Joe d’Aleo talking about the warm phase/cool phase of the PDO, but this I believe is actually a terminology issue, since we lack a formal name for the oscillatory oceanic temperature cycle(s) (and climate phenomena causing it/them) which I believe is what is really being referred to in those usages. “PDO” in that respect is a convenient tag which perhaps should not be so used – a fair point – but it will continue to be until someone attaches a more apt and generally accepted name to the phenomenon.
Regarding the AMO and PDO insofar as I have managed to understand their construction . . .
The AMO is a moving average meant to reflect sea surface temperature.
The PDO is a mathematical construct meant to reflect shape (pattern).
One researcher (referenced by Tisdale) uses a rugby ball as an example. Look end-on or from the side and the ball has a different appearance. Now say you had an “index” to indicate which way you were seeing the ball – oval or round or from some intermediate angle. Getting the “index” is a complicated thing that I do not wish to explain. However, next, let’s assume the balls come in all colors and this can be measured with wavelength. The notion of “using” these two measures in describing a rugby ball makes sense to me. How one would go about “combining” a measure of shape and a measure of color and then using that, whatever that is, in subsequent calculations is something I don’t understand.
If, as stated, someone has figured out how to “combine” temperature and shape – that’s remarkable.
I mentioned before that Bob Tisdale has presented quite a bit of material on ENSO, PDO, and AMO. There are numerous links within his posts. One can start with this:
http://bobtisdale.wordpress.com/2011/06/30/yet-even-more-discussions-about-the-pacific-decadal-oscillation-pdo/
There is a link to this one in the above:
http://bobtisdale.wordpress.com/2010/09/03/an-introduction-to-enso-amo-and-pdo-part-3/
Thirty years ago I had a clock radio with a liquid crystal temperature gauge on it. That combines temperature and shape (of the crystals). Worked pretty well too.
Sorry, couldn’t resist. But if two parameters combined can be correlated to a third parameter that often means the underlying variables are indeed correlated. What you have to ask is what are the measured emergent variables actually measuring?
This is not a silly question – I use just such in my business for empirical models, which have been used in large projects. Not climate, but the measurable parameters are implied to be related to the actual parameter you’re trying to measure. A statistical model which is a function of measurable variable which hypothetically correlates to a unmeasurable underlying variable. The final arbiter is the success of the model in the validation step (and validation has to be extensive). The Joes have their business on the line if they are wrong. Likewise I would have been sacked if I was wrong (although there were multiple reviews and cross checks, so it was unlikely that would happen). So I keep an open mind even though I like what Bob does very much.
The whole extreme events is pure and un logical humbug. Why? Northern hemisphere (ground surface) warms by 20°C from winter to summer. IF ~0.5 “global warming” is manifested by increase in “extremes”, then we should see TREMENDOUS rise of extremes from January to August EVERY YEAR.. hello, anyone?
The global temperature, or better say average of surface temperatures varies by 4 °C during the year (and this is a meaningless average of summer NH and winter SH). Has anyone observed significantly MORE global extremes during the NH summer?
Humbug, yes, but self-immunizing humbug. AGW shows itself as not happening when it covers the ground in white sheets, and the “more heat causes cold” sound a bit Monty-Pythonesque. “We’ve had a lot of queer weather lately”, in contrast, is a safe bet. You can even sell last month’s weather, wich was a bit warmer and calmer than usual, as a potential catastrophe: Wind farmers could not sell nearly as much power as they had expected, ergo you can see how Global Warming causes trouble for the very kind of heroic measures that are meant to fight it, ergo AGW must be prevented.
Well, I would call it self-limiting humbug; you just can’t sell that as the catastrophe message. I watch the covers of the German alarmist weeklies, and none of them tried to sell a CAGW derivative over the past three months. It just doesn’t work to scare people. The alarmist weeklies (Spiegel, Stern, Focus) know they would go down with it.
Scientifically, there’s not even a definition of what statistical property they predict to go up – variance? So the CAGW scientist impersonators simply look like the stand-ins they are; I don’t think any scientist outside their field would want to have anything to do with them now – it’s reputation-damaging. Toxic science.
JOHN F HUTQUIST
I thought I selected my words carefully about the signifigance of PDO and not to indicate a direct cause and effect relationships between PDO and global temperatures but one of correlation . I think I used the word “accompanied by”.
Here is what i said :
“PDO is an after effect of the ENSO signal and reflects a spatial pattern of the amount of cooler water in the north Pacific. Negative levels are accompanied by much cooler weather in the Northern Hemisphere especially in North America. ”
Any way ,even Bob Tisdale in his articles admits that “The PDO is a useful index .Based on the Icecap post, it is used by meteorologigits for weather predictions. “I think the high credibilty of the two JOE’s in using this index speaks for its self. I have used it successfully for predicting weather in Canada especially the west coast and plan to continue its use in this process. However I am also looking at the following in parallel:
I think Bob Tisdale is suggesting the use of this graph that he updates each month
http://bobtisdale.wordpress.com/2011/12/05/november-2011-sea-surface-temperature-sst-anomaly-update/#more-796
It also shows the East Pacific SST declining since about 2005 , other than a brief spike due to the 2010 El Nino . It also shows the SST going negative or cooler in 2007 like the PDO index.
http://bobtisdale.wordpress.com/2011/12/05/november-2011-sea-surface-temperature-sst-anomaly-update/#more-796
Crackdown on climate blogs that first received the ClimateGate emails and Steve McIntire’s Climate Audit.
I’ve written a short story with all the links here:
http://rarereaders.seablogger.com/2011/12/international-crack-down-on-skeptic-climate-blogs-the-empire-strikes-back/
Spread the message ASAP
I noted from a recent presentation by the Met Office at the 2011 AGU Fall Conference that they are now using the AMO index for their short term [interannual] predictions . They claim that AMO plays a “small but non negligible effect on global climate “. They also use the ENSO variability. So the impact of our oceans on global climate is finally being recognized. It will be interesting how accurate their forecast will be . They are predicting HADCRUT3 global anomaly of 0.44 for this year and 0.46 for 2012. I think that this is high for 2011 as the actual is running around 0.357 to October 30. I feel 2012 will be cooler than 2011
I’ll be missing white Xmas, here in Westphalia 😉
This night will see a big storm and the snow cover line will drop to 500m. Look out.
Now, FR, 12:00 AM, it’s snowing here in Hildesheim at 100m elevation. Will take a while for temps to drop to freezing, though.
Caper
Eventhough there is more snow coverage than normal in the Northern Hemisphere this year, there are regions that have less snow coverage to date like parts of Europe [ except Northern Europe] , central United States and parts of Canada [like Southern Ontario ] My take is that the cold winter is about 4 -5 weeks away and that it will be a late winter . All La Ninas do not have the same effect in back to back winters as we have seen this year.
Casper
The Nothern Hemisphere snow coverage this winter[ 2011-2012] is now running about 3% behind the last one 2010-2011 up to the end of week 48. If you remember last December was quite wintery and we had more snow last December than this Decemeber by this date.
UP TO WEEK 48 THIS WINTER
41.97 million sq miles
UP TO WEEK 48 LAST WINTER
43.16 million sq miles
Bob TISDALE ,
When writing to the general public I personally like this description of PDO that you used in one of your earlier articles , namely
“The PDO represents a pattern of SST anomalies in the North Pacific. The operative word in that sentence is PATTERN. Figure 6 (from the JISAO PDO webpage) illustrates the warm and cool phases of the PDO. When the PDO is positive, SSTs in the eastern North Pacific are warmer than in the central and western North Pacific, and when the PDO is negative, the reverse is true.”
I wonder if the general public will even understand better what the terms in this definition mean ?
The PDO is the leading principal component of detrended North Pacific SST anomalies.
I know we are playing with words here but to me personally and it may be different for others , when the pattern of SST’S in the eastern North Pacific are colder than in the central and western Pacific , it is measure or indicator of the type of SST affecting climate even if its through a pattern indicator. Enough said . Always appreciate your comments., Bob
The following two OCEAN SST ANOMALY Plots illustrate the changes in the cooling mode in the North Eastern Pacific during November2011
NOV28/11[ PDO -2.33 ]
http://www.osdpd.noaa.gov/data/sst/anomaly/2011/anomnight.11.28.2011.gif
OCTOBER 31 [ PDO -1.34]
http://www.osdpd.noaa.gov/data/sst/anomaly/2011/anomnight.10.31.2011.gif
One can see a growing area or pattern of cooler water [north of 20N] in the NORTHEASTERN part of the Pacific compared to the NORTH WESTERN AND CENTRAL part of the Pacific when comparing the two timelines indicating more colder water along the NORTH EASTERN PACIFIC COAST during November. This greater area of cooler water along the north eastern part of Pacific will interact with the atmosphere to bring cooler winter temperatures to some parts of North America , typically the NORTH CENTRAL US and the WEST COAST, THE PRAIRIES and NORTHWESTERN FOREST AREA
One can also see a slight cooling in the North Atlantic accounting for the negative or cool AMO this past month
Solar activity and Svalbard temperatures
We predict an annual mean temperature decrease for Svalbard of 3.5\pm2 oC from solar cycle 23 to solar cycle 24 (2009-20) and a decrease in the winter temperature of \approx6 oC.
http://arxiv.org/abs/1112.3256
For the last 50 years, the linear warming trend has been 0.13 °C [0.10 to 0.16 °C] per decade according to AR4.
Yes, but current tropospheric temps have been the lowest in 10 years for an entire year.
http://discover.itsc.uah.edu/amsutemps/
Use channel 6, then activate all the years.
Looks to me like it peaked in 1998.
sugel
The least square trend line slope for Hadcrut 3 [unadjusted] for the last 600 MONTHS gives a slope of 0.014 C/year or 0.14 C/decade . However don’t fall into the trap of comparing summer temperatures with winter . THEY WILL ALWAYS SHOW SIGNIFICANT WARMING The era of the 1950-1970’s was the trough or cold period of the 60 year climate cycle . One has to pick a complete cycle like 6o years or better yet a century. The trend for a century is closer to 0.5 C
SUGEL
The least square trend line slope hadcrut3 [unadjusted] per WOODFORTREES web page for 1200 months[100 years] is actually 0.007 C per year or 0.07 C per decade since 1911. I ealier said it was 0.5 C per century or 0.05C per decade . The latter figure is closer for 150 years or 1800 months is 0.0049 C/year[since 1861]