The latest post by Frank Bosse and Fritz Vahrenholt looks at solar cycle 24 in January, and the climate impacts of the North Atlantic. The two authors write that the IPCC models may be in for a bitter surprise.
==================================
The sun in January 2015 and Atlantic prognoses
By Frank Bosse and Prof. Fritz Vahrenholt
(Translated, edited by P Gosselin)
Solar report January 2015
Last month the sun reached a sunspot number of 67.0 and thus was once again below normal in activity: It reached 85% of what is normal for the particular cycle month.

Fig. 1: The mean activity of the sun since systematic observations have been conducted is shown in blue and the current cycle (24th cycle, red), along with the relatively similar Cycle No. 1 of 260 years ago.
The red curve shows that the sunspot maximum is now over. Up to now that was not so easy to identify because instead of the usual pronounced maximum (compared to the mean curve in Fig. 1), there have been two peaks with a pronounced dip between them.
Observation of the sun’s polar magnetic fields brings certainty rather than guesses. We reported on this in detail before the end of the year. In short the polar fields have a zero polarity during the solar sunspot maximum. The difference of north polar field and south polar field is zero, yet it can occur often when the fields do not reverse at the same time. During the current cycle the fluctuation about the zero line was quite intense:

Figure 2: The difference between the polar fields of the sun, source: leif.org.
The zero value was first approached in fall 2012, in early summer 2013, and again at the beginning of 2014. The maximum dragged on for some 15 months. But now the trend appears to be clearly away from zero and the maximum to be behind us for good. The month with the highest activity was month no. 63 of the cycle, February 2014, with a SSN= 102.8.
We are seeing an unusually weak cycle with a delayed start and delayed maximum. Another thing is noteworthy: The polar fields are building up only very slowly, especially the solar north pole is dipping as before close to zero. Could that be an indication of an even weaker cycle to follow? It is still too early to determine this, but we will know in a few years. What follows is a comparison of all the cycles:
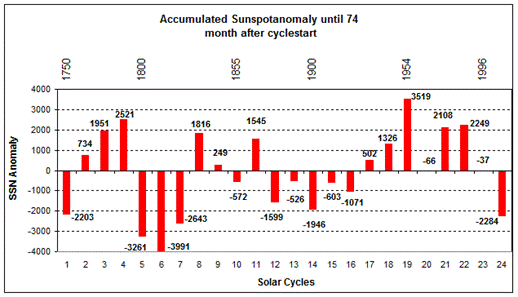
Fig. 3: The summed deviations from the mean value (blue in Fig. 1) for all cycles for all months up to the current one. The right bar in Fig. 3 is growing deeper into negative territory. This indicates a strongly reduced solar activity since approx. 2006.
North Atlantic harboring a bitter surprise?
As some readers may recall, we reported earlier here on the North Atlantic and we suspected that a relatively significant reduction in the Atlantic Meridional Overturning Circulation (AMOC) could be in the pipeline. Since then there have been additional mesurements of this near surface warm current, which impacts the Atlantic part of the Northern Hemisphere and to some extent other large regions of the Northern hemisphere. Our earlier prognoses are now confirmed:
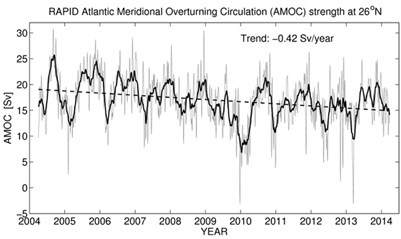
Fig. 4: The AMOC strength between 2004 and spring 2014. Source: climate-lab-book.ac.uk.
It is the decisive element that controls the AMO, and probably the approximately 65-year temperature oscillation. Earlier it had been positive, the transition from negative to a positive phase precisely coincides with the time frame that most climate models were parameterized: between 1975 and 2004.
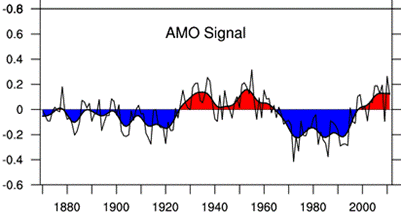
Fig.5: The AMO since 1870, Source: climatedataguide.ucar.edu. The signal is determined by measuring surface temperatures of the entire North Atlantic and the deviation from the linear long-term trend. The AMO thus expresses an internal variability.
The additional added heat from the variable oscillation may have led to the models having calculated an excessive forcing from greenhouse gases, just as the AMO will also not be accounted for in the newest CMIP5 models when it comes to the global and northern hemisphere temperatures.
Getting back to the AMOC, if it weakens, it will lead to a falling heat content in the North Atlantic at depths from 0 to 700 meters and so less heat getting conveyed towards the North Pole. This is precisely what has been observed since 2007:
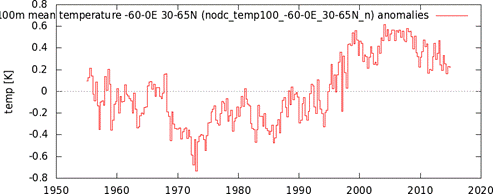
Fig. 6: The heat content of the upper 700 meters in the region of impact of the AMOC, Chart source: Climate Explorer.
It is highly likely that the focus of the AMOC-effect can be found in the sub-polar gyre, which is a relatively small area of the sea in the North Atlantic located off the southern tip of Greenland: 45°N…60°N; 50°W…20W°. Here we are seeing truly dramatic events:
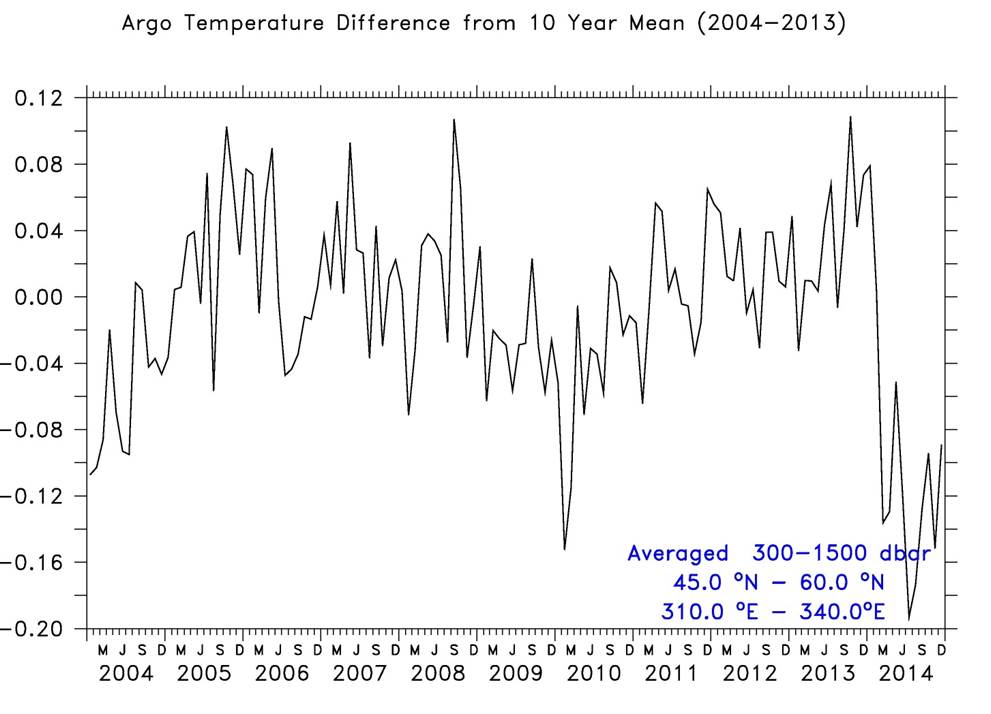
Fig. 7: The heat content of water between 300 meters depth and 125 m of the sub-polar circulation. The depth limit was chosen in order to exclude falsifications from the effects of atmospheric processes. (Image source: Argo Marine Atlas)
Beginning in the spring of 2014 (after the end of the available direct measurement in Fig. 4) we see the occurrence of a steep drop. Also the forecast of the British Met Office for the next years is now taking this development into account and foresees with some certainty for the next ten years global temperatures at the lower end of the models’ ranges. It is also stated very carefully that a temperature stall could occur over the next 10 years, which for the models would be a real large-scale catastrophe. Just as we wrote back in January, 2014:
The AMO] is not accounted for in the IPCC models and would limit the trend rise in global temperatures since the beginning of the impact of greenhouse gases to about 1°K/ century. How much longer will we have to wait before the IPCC finally accepts the multidecadal oscillations, as it already has here and is shown in other works?”
The North Atlantic is indeed a special region and could contribute much to understanding our climate. Also a greater impact by the sun than what has been considered up to now would be possible. A new paper by authors in China and Scandinavia examined high resolution proxy summer temperature data from northern Iceland and came to the result that the fluctuations there over the last 3500 years correspond to solar activity, and do so significantly over long time frames (centuries and millennia).

Fig. 8: The coincidence between North Atlantic summer temperatures and solar activity in the gray range over the last 3500 years (top), with the correlation (middle) and significance (bottom – the lower the p -value, the greater the certainty) of the relationship . Source: Figure 5 of the above-mentioned paper.
When one looks very closely at Fig. 8, one sees a time delay in temperature with respect to solar activity characteristic numbers. And when one now looks at Figure 3 of post and notice the especially high activity until the end of the 1980s and the rather dramatic drop afterwards, what do you think the solar drive will do to the Atlantic temperatures?
Things could become very bitter for the IPCC forecast models! With much excitement we look forward to how the climate unfolds.


The most important factor in climate forecasting is where earth is in regard to the quasi- millennial natural solar activity cycle which has a period in the 960 – 1020 year range. For a complete review and forecasts of the coming cooling see discussion and Figs at
http://climatesense-norpag.blogspot.com/2014/07/climate-forecasting-methods-and-cooling.html
For evidence of the 960 or thereabouts cycle see Figs 5-9.
From Fig 9 it is obvious that the earth is just approaching ,just at or just past a peak in the millennial cycle.
I suggest that more likely than not the general trends from 1000- 2000 seen in Fig 9 will likely repeat from 2000-3000 with the depths of the next LIA at about 2650.
The best proxy for solar activity is the neutron monitor the count and 10 Be data.
My view ,based on the Oulu neutron count – Fig 14 is that the solar activity millennial maximum peaked in Cycle 22 in about 1991.
There is a varying lag between the change in the in solar activity and the change in the different temperature metrics. There is a 12 year delay between the neutron peak and the probable millennial cyclic temperature peak seen in the RSS data in 2003.
http://www.woodfortrees.org/plot/rss/from:1980.1/plot/rss/from:1980.1/to:2003.6/trend/plot/rss/from:2003.6/trend
There has been a declining temperature trend since then (Usually interpreted as a “pause”)
The sharp drop in the Argo temperatures in 2014 (Fig 7 Bosse and Vahrenholt above) could well represent a delayed response related to the sharp decline from the cycle 23 peak seen 2004 in the Ap index Fig 13.I agree with these authors that there is likely to be a steepening of the cooling trend in 2017- 2018 corresponding to the very important Ap index break below all recent base values in 2005-6.
The Polar excursions of the last few winters are harbingers of even more extreme winters to come in the near future.
The accelerated warming of the AMO and Arctic since 1995, I would say is due to declines in the solar wind strength increasing negative North Atlantic Oscillation episodes, which then increases poleward ocean transport.
https://bobtisdale.files.wordpress.com/2012/10/4-northern-no-atl.png
The Arctic/AMO cooling since 2013 is just some brief periods of stronger solar forcing around this sunspot maximum temporarily increasing positive NAO conditions.
The typical pattern is for the AMO to be in phase with solar cycles when in its cold mode, and out of phase with solar cycles in its warm mode.
http://www.woodfortrees.org/plot/esrl-amo/from:1880/mean:13/plot/sidc-ssn/from:1880/normalise
We see the reverse occur with UK land temperatures:
http://snag.gy/MTnui.jpg
I suggest that we will see a strongly renewed warming of the AMO through the next decade.
Pierre,
Thanks for the translation and other work getting this posted. Clearly, I should be doing a lot more reading about the AMO.
Right now, this year’s weather is interesting in that parts of the Northern Hemisphere is cold and snowy (the Northeastern US and adjacent Canada; parts of Europe), while on the left coast there has been warmth (some records) and very little snow. Those associated with irrigation and those associated with fighting wildfire are making plans for a dry spring and summer.
The pattern is expected to change later this month – Meteorologist Pete Parsons of the Oregon Department of Forestry. He uses “analog years” of weak El Niño conditions for this forecast.
I’ll write and suggest he look at the AMO – starting with this current NTZ post.
http://www.oregon.gov/ODA/programs/NaturalResources/Documents/Weather/dlongrange.pdf
Joe Bastardi made a comment recently about a significant move by the AMO. I asked him if he could put something in his great saturday summary but, sadly, he hasn’t yet.
[…] Full post […]
The second sentence in the paragraph above Fig 5 has the words “negative” and “positive” transposed.
“the transition from negative to a positive phase precisely coincides with the time frame that most climate models were parameterized: between 1975 and 2004.”