A short but extremely interesting post today. Hat-tip: reader Stuart.
It appears the NOAA also agrees that sea level rise is not happening any where near as fast as many among us would like to think it is. At its site here, it writes the following n(my emphasis):
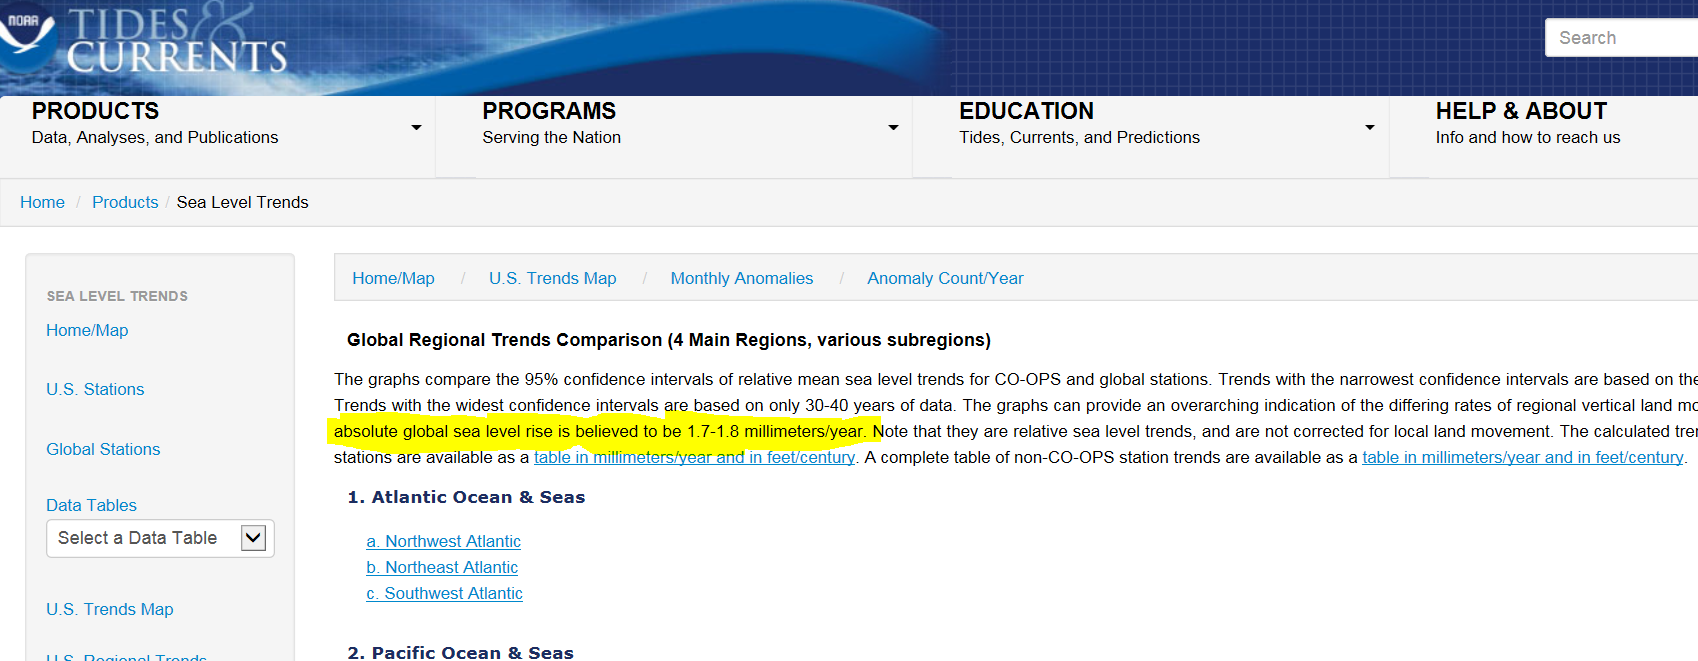
The graphs compare the 95% confidence intervals of relative mean sea level trends for CO-OPS and global stations. Trends with the narrowest confidence intervals are based on the longest data sets. Trends with the widest confidence intervals are based on only 30-40 years of data. The graphs can provide an overarching indication of the differing rates of regional vertical land motion, given that the absolute global sea level rise is believed to be 1.7-1.8 millimeters/year. Note that they are relative sea level trends, and are not corrected for local land movement. The calculated trends for all CO-OPS stations are available as a table in millimeters/year and in feet/century. A complete table of non-CO-OPS station trends are available as a table in millimeters/year and in feet/century.”
Hurry up and read it before this gets taken down! To be on the safe side I’ve cut out the location of interest:
The full URL is: http://tidesandcurrents.noaa.gov/sltrends/globalregional.htm.
So many among us have severely criticized the various institutes for hyper-hyping the dubious, and some even say manipulated, satellite data showing a rise of over 3 – while tide gauges as the NOAA writes above indicate no such thing.
Expect this site to get wiped out.


I’m in Dortmund Stadium for a DFB match right now: Dortmund vs Hertha BSC! Expect 3 – 0 result for Dortmund…
It was 3 -1.
If only climate models had similar predictive skill.
That was a very interesting match with Dortmund working so hard on breaking into Hertha’s defensive fortress and watching two great players missing an empty goal.
Pierre, I’m curious:
Do the AGW propagandists use the heat during those days and the images of naked fans to push their agenda in popular culture? It seems the fans did not mind the temperature at all and enjoyed themselves throughout the game.
This will come as good news to Al Gore, Tim Flannery, Julia Gillard and all other climate worriers who, despite their public claims about sea rises, went out and bought houses very near the sea.
Graeme:
Brilliant line! When Gore et al start selling oceanfront land at fire-sale prices, then I will believe in global warming.
“Expect this site to get wiped out.”
– it’s been there for at least 6 years, to my knowledge. Also, they say “Note that they are relative sea level trends, and are not corrected for local land movement.”
“given that the absolute global sea level rise is believed to be 1.7-1.8 millimeters/year”
This refers to an (oldish) IPCC report, I believe, and the data which resulted in that figure spanned a much longer period than the reliable satellite record. Is global sea level rise around 3mm/year currently? I’ve analysed a LOT of tide-gauge records, and I accept that figure. The point is that sea level(s), like local and global temperatures, exhibit clear multi-decadal cycles. “Chicken littles” conveniently ignore that, and just extrapolate over a carefully picked period.
It’s too bad most climatologists do not understand that 95 per cent confidence levels do not mean what they think they mean.
http://blog.minitab.com/blog/adventures-in-statistics/when-should-i-use-confidence-intervals-prediction-intervals-and-tolerance-intervals
But confidence level sounds good™ and that is all that matters in The Science as funded by taxpayers who have no choice in what is funded, or how much they are forced to pay.
It should go without saying that climastologers also have no idea of the difference between measured data and fabricated data. They treat them as though they were of equal veracity.
According to archive.org wayback machine, that web page has been there with exactly the same words since at least October, 2014.
The folks studying sea level do not really have the sorts of information that would be useful. New numbers are available, it seems, almost every month. This allows anyone to select a number and go with it to support a cause. For example, Fiji: {The article uses “average monthly”, “decade” and “year”, so it is confusing.}
“The country’s 2012 policy document also notes that average monthly sea levels at the country’s Lautoka tide have been increasing at a rate of 4.6 millimeter per decade since 1993, though satellite observations indicate that the sea level is changing at the faster rate of 6 millimeters per year over the same period. ”
http://thinkprogress.org/climate/2014/01/29/3222641/fiji-climate-change-refugee/
And, note that Tony Heller reviewed NOAA’s tide gauge data a few days ago and found a mean sea level rise of only 0.63 mm/year. Trivial! http://realclimatescience.com/2015/08/sea-level-fraud-worse-than-it-seems/
Yes, and if you look at his bar chart, and the original data, you’ll see that a number of negative values are included – several very negative. All are in the northern Baltic, where the land is rising faster than sea level – post-glacial rebound. If a “warmist” played this kind of trick, he’d be called out on it, and I’m calling HIM out on it. He’s done this sort of thing before, and will continue to do so, as he knows perfectly well such data should be excluded.
Re-commented from “Real Science:”
First you need to remember that the Satellite radars that Topex/Poseidon/Jason rely upon cannot resolve at the millimeter level. The Ku Band can only resolve 23 mm and the C band limits to 56mm. With orbital tracking error in the 20 – 40 mm range, there is such an error range that reliance on the satellite reportage for public policy purposes is tantamount to malpractice, if not outright criminality.
In tectonically inert places (neither land rising nor subsiding) such as the Gulf of Maine, there is a slight upward trend in sea-level, but minuscule at that. The level recorded by the Portland Maine Tide Gauge in 2014 is IDENTICAL (to the millimeter!) to that measured in 1947. Ocean current changes appear to be the major factor. The old timers correctly say that sea-levels are the same as when they “grew up,” and they are absolutely correct!!!
The real discovery to be made is: The rise in University and scientist’s bank deposits from Government (taxpayer) grants expressed in millions of dollars. It would also be interesting to correlate the rise of said bank accounts in relation to the decline in middle class, private sector, personal savings and net worth. I believe the findings would be stunning.
That would be antropology, no? The change from hunter-gatherer to agriculture to grafter. Homo Sapiens -> Homo Ladriens ? Homo Furtivus ? (I don’t know if that is correct Latin).
Hunter-gatherer to hunter-grafterer…
😀
Homo Saccularius? Homo Cleptarius?
[…] […]
If the 95% certainty predictions were correct then we would be out of polar ice right now.
Looking through Google to see how many others have posted about this, I found a lot more than I expected. Many of them are one web pages that have links on their navigation bars to recent posts in other blogs, mainly yours and Marc Morano’s
http://www.climatedepot.com/2015/08/30/sea-level-rise-alarm-turned-off-noaa-absolute-global-sea-level-rise-is-believed-to-be-1-7-1-8-millimetersyear/
There are a few oldish references I’ve come across, you can try fishing out some at https://www.google.com/search?q=absolute+global+sea+level+rise+is+believed+to+be+1.7-1.8
However, it looks like you gave it legs!
More significantly, note that 1.7 – 1.8 mm/y is within Nils-Axel Mörner’s claim that sea level rise is +0.5 ± 1.5 mm/year, i.e. -0.5 – 2.0 mm/year.
I downloaded the two files (U.S. and global), and combined them into a single Excel spreadsheet. For ease of sorting, I changed the U.S. station ID numbers by adding an “A-” prefix. I also added “average” and “median” lines at the end of the spreadsheet. The average of 375 NOAA-analyzed stations is 1.28 mm/yr, and the median is 1.71 mm/yr:
http://www.sealevel.info/NOAA_AllStationsLinearSeaLevelTrends_2015-08.xls or
http://www.sealevel.info/NOAA_AllStationsLinearSeaLevelTrends_2015-08.htm
Some of the difference between the calculated average and NOAA’s figure of 1.7-1.8 mm/yr MSL rise may be due to the addition of model-derived GIA adjustments to the measured rates when calculating the average, to attempt to account for Post-Glacial Rebound (PGR). My guess is that they’re using Prof. Richard Peltier’s figures.
Prof. Peltier also estimates that meltwater load from the melting of the great ice sheets (~10k years ago) is causing the ocean floors to sink by enough to cause a 0.3 mm/yr fall in sea-level, absent other factors. That number (0.3 mm/yr) is usually added to calculated “global average” sea-level rise rates, inflating the reported average, even though the resulting sum is not truly sea-level, and not useful for projecting sea-level for coastal planning. (It’s an attempt to estimate what sea-level rise would be, were it not for the hypothesized sinking of the ocean floor.)
Unfortunately, many of the tide stations in NOAA’s expanded list of 375 are too short to be appropriate for measuring sea-level trends. The literature indicates that at least 50-60 years of data are needed to establish a robust sea-level trend from a tide station record, but the shortest record in NOAA’s list is just 21 years. So I also made a version of this spreadsheet in which stations with records shorter than 50 years are omitted.
Considering only tide-stations with records of at least 50 years, the average and median rates of MSL rise (of the 225 remaining stations) are 0.90 mm/yr and 1.41 mm/yr, respectively:
http://sealevel.info/NOAA_AllStationsLinearSeaLevelTrends_2015-08_50yr.xls or
http://sealevel.info/NOAA_AllStationsLinearSeaLevelTrends_2015-08_50yr.htm
(I also tried limiting it to stations with records of at least 60 years, with very similar results: average 0.77 mm/yr, and median 1.37 mm/yr.)
The average (0.90 mm/yr) is probably unrealistically low, due to the disproportionate number of stations in northern Europe which see low or negative rates of measured sea-level rise due to PGR. The fact that the average is less than the median also suggests that there are a disproportionate number of low-end outliers.
I also tried another approach, in which I excluded the most extreme latitudes. I started with just the 50+ year stations, and included only stations within a latitude range of ±45° (i.e., I excluded stations above 45° north or below 45° south). The resulting average and median for 137 stations were 2.22 mm/y and 2.02 mm/yr, respectively:
http://www.sealevel.info/NOAA_AllStationsLinearSeaLevelTrends_2015-08_50yr_lowLat.xls or
http://www.sealevel.info/NOAA_AllStationsLinearSeaLevelTrends_2015-08_50yr_lowLat.htm
That approach largely solves the problem of low-side bias introduced by stations which are affected by PGR (which lowers the calculated average), but it doesn’t solve the problem of high-side biase introduced by stations affected by subsidence (which raises the calculated average). So the average (2.22 mm/yr) is probably unrealistically high. The fact that the average is greater than the median also suggests that there are a disproportionate number of high-end outliers.
So I tried another approach, this time explicitly eliminating “outliers.” I started with just the “50+ year” stations, but excluded the 40 stations with the lowest rate of sea-level rise (including most of those experiencing falling sea-level), and the 30 stations with the highest rate of sea-level rise (including most of those experiencing severe land subsidence, like Galveston, which is built on sinking fill dirt). The resulting average and median rates of sea-level rise (calculated from 155 stations) are both 1.48 mm/yr:
http://www.sealevel.info/NOAA_AllStationsLinearSeaLevelTrends_2015-08_50yr_less_high30_and_low40.xls or
http://www.sealevel.info/NOAA_AllStationsLinearSeaLevelTrends_2015-08_50yr_less_high30_and_low40.htm
That figure, 1.48 mm/yr, is my best estimate of globally averaged coastal sea-level rise. At first glance, excluding more low outliers than high outliers might seem to bias the result to the high end. But I think it is justifiable, because of the disproportionate number of northern European and North American stations at locations where the land is rising due to PGR. The fact that the median and average are equal suggests that there aren’t disproportionate numbers of either high or low outliers. (I also tried excluding the low and high 35 stations, and the result was an average MSL rise of 1.36 mm/yr, and median 1.41 mm/yr, which suggests a slightly disproportionate number of low outliers.)
Note that if you add Peltier’s 0.3 mm/yr GIA to the calculated 1.48 mm/yr global average rate of MSL rise, the sum is right at NOAA’s 1.7-1.8 mm/yr figure.
Nice job!
Here in New Zealand Rising sea levels predicted by City Council provoke strong reaction
http://www.stuff.co.nz/the-press/news/71585341/coastal-homeowners-in-christchurch-may-get-more-time-to-fight-new-zonings
[…] (No Tricks Zone) It appears the NOAA also agrees that sea level rise is not happening any where near as fast as many among us would like to think it is. At its site here, it writes the following n(my emphasis): […]
It is, of course, relative sea level that matters to us, not absolute sea level. And relative SL is changing by 3.3 mm/yr:
http://sealevel.colorado.edu/
David Appell, or perhaps someone using his name, wrote, “It is, of course, relative sea level that matters to us, not absolute sea level. And relative SL is changing by 3.3 mm/yr: http://sealevel.colorado.edu/ “
That is a nonsensical statement. “Relative sea-level” is, by definition, locally measured sea-level. It is no more valid to say “relative sea-level is changing by 3.3 mm/yr” than it is to say “cars are moving at 33 mph.”
The closest long-term tide gauge to David Appell is at Astoria, Oregon. We have precise sea-level records there going back 90 years. In that time, relative sea level has not increased at all. In fact, it’s fallen about one inch.
http://tidesandcurrents.noaa.gov/sltrends/sltrends_station.shtml?stnid=9439040
Appell is obsessed with visions of some sort of Biblical flood. When he isn’t commenting here, he’s outside building a modern Noah’s Ark.
Another personal attack from Pierre. Why can’t you stick to the data and the science? Resorting to the personal shows you have no better argument.
Here’s some science for you. And yes, it is peer-reviewed. http://www.populartechnology.net/2009/10/peer-reviewed-papers-supporting.html
Dave Burton wrote:
““Relative sea-level” is, by definition, locally measured sea-level”
Exactly.
And that’s what matters.
I am not so provincial to believe that what’s happening 100 miles away from me is what’s happening anywhere else in the world, or that it represents the world average.
Why do you believe that?
The global average rate of sea-level rise, measured by long-term coastal tide gauges, is just under 1.5 mm/year. See:
https://notrickszone.com/2015/09/03/sea-level-analyst-not-possible-to-torture-coastal-tide-gauge-data-into-yielding-a-sea-level-rise-anywhere-near-3-3-mmyr/
[…] Lees verder hier. […]
[…] https://notrickszone.com/2015/08/30/sea-level-rise-alarm-turned-off-noaa-absolute-global-sea-level-ri… […]
[…] Weather. Sea levels rising slowly. The next energy […]