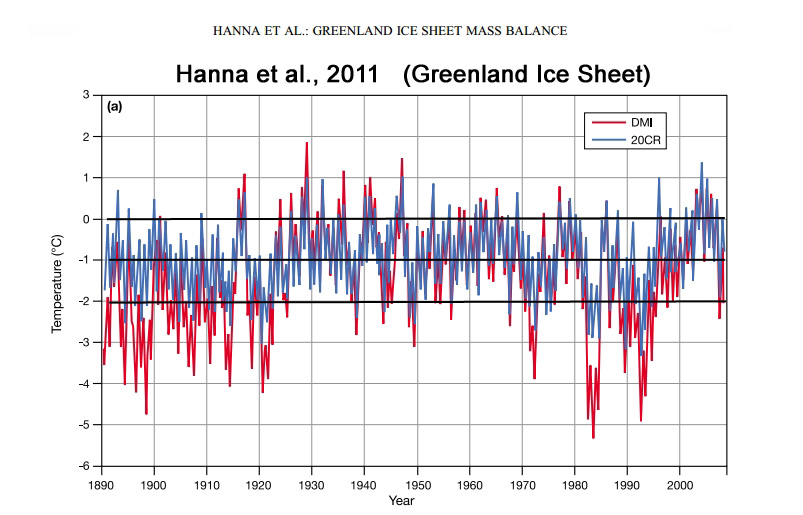
Above image from Hanna et al., 2011 (Greenland Ice Sheet)
In 1942, eight U.S. WWII aircraft (2 bombers, 6 fighter planes) emergency-landed on the Southwestern coast of Greenland after encountering severe weather. The crews were rescued and the planes ultimately had to be abandoned at the landing site. So there the planes sat on the Greenland ice sheet, undetected, for more than 4 decades. The active search for the WWII planes had been ongoing since 1981, but it wasn’t until 1988 that a group of artifact enthusiasts (Greenland Expedition Society) were able to finally locate the planes. The primary reason why it was so excruciatingly difficult to find the planes is that the explorers had originally assumed the planes were buried under ice that was relatively close to the ice sheet’s surface. They weren’t. When the planes were finally found in 1988, 46 years after crash-landing on the Greenland ice sheet, they were buried under 260 feet (79 meters) of ice. In other words, between 1942 and 1988, the Greenland ice sheet gained mass at a rate of 57 feet (17 meters) per decade at that location. In 1992, the planes were impressively pulled out of the ice part-by -part. In that 4-year span between 1988 (discovery) and 1992 (recovery), the Greenland ice sheet had advanced with another 8 feet of ice, as the planes were 268 feet beneath the ice sheet surface when they were rescued.
It should come as no surprise that the Greenland ice sheet gained so many billion tons of ice during the 50 years from 1942 to 1992. After all, the scientific literature has been replete with records of rapidly declining Greenland temperature trends between the 1940s and the 1990s, which followed a period of especially rapid warming during the 1920s and 1930s (that was greater in rapidity and magnitude when compared to the Greenland ice sheet warming trend in the last decade or two).
These trends are the opposite of what should be expected from anthropogenic forcing in climate models. After all, the rapid 1920s to 1930s Greenland warming occurred while anthropogenic CO2 emissions remained flat at about 1 GtC/year (gigatons of carbon), whereas the 1940 to 1995 Greenland cooling period was accompanied by human CO2 emissions rates that rose by more than a factor of 6, or from 1 GtC/year to well over 6 GtC/year (see here). Succinctly, Greenland warmed rapidly while CO2 emissions were flat, and Greenland cooled rapidly while CO2 emissions were significantly rising. As Kahl et al. (1993) write in their paper entitled “Absence of evidence for greenhouse warming over the Arctic Ocean in the past 40 years” [1950-1990], climate models “do not adequately incorporate the physical processes that affect the polar regions.”
There were higher Greenland Ice Sheet melting rates in the 1920s and 1930s than in recent decades.
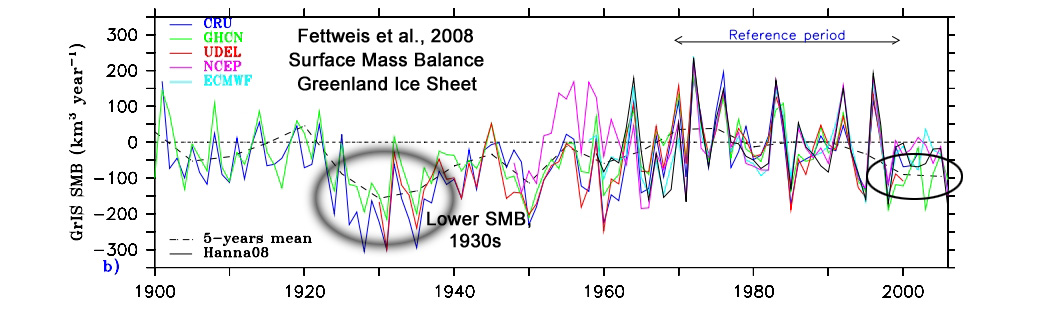
It should be noted that the Greenland ice sheet surface mass balance trends are calculated using a baseline period of 1961-1990. The problem with this is, of course, that the 1961-1990 period was unusually cool in Greenland — about 1 to 2°C cooler than the 1920s to 1930s period. Therefore, any estimate of surface mass balance for the post-1990 period will necessarily be biased towards greater melt rates. Had the 1920s to 1930s period been used as a baseline, the recent decades of warming would likely only mean that the Greenland ice sheet has returned to balance, and is not rapidly losing mass as is often claimed.
“These estimates show that the high surface mass loss rates of recent years are not unprecedented in the GrIS [Greenland Ice Sheet] history of the last hundred years. The minimum SMB rate seems to have occurred earlier in the 1930s and corresponds to a zero SMB rate….The results show that the GrIS surface mass loss in the 1930s is likely to have been more significant than currently due to a combination of very warm and dry years.”
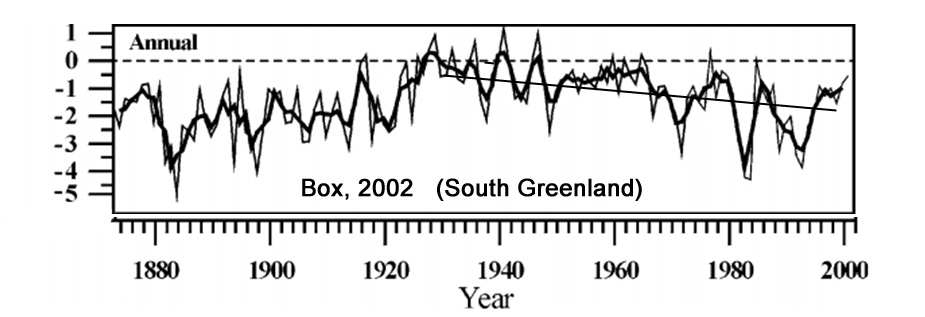
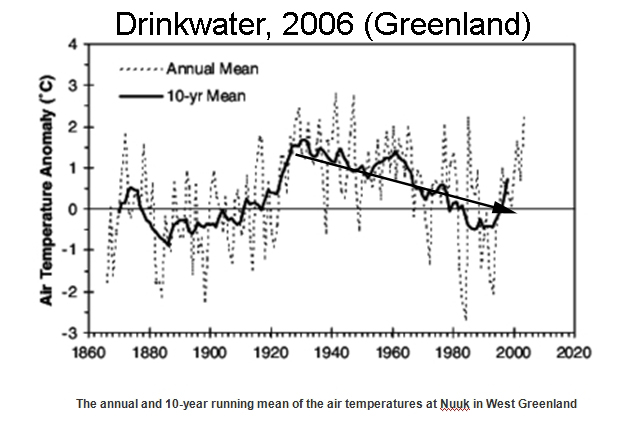
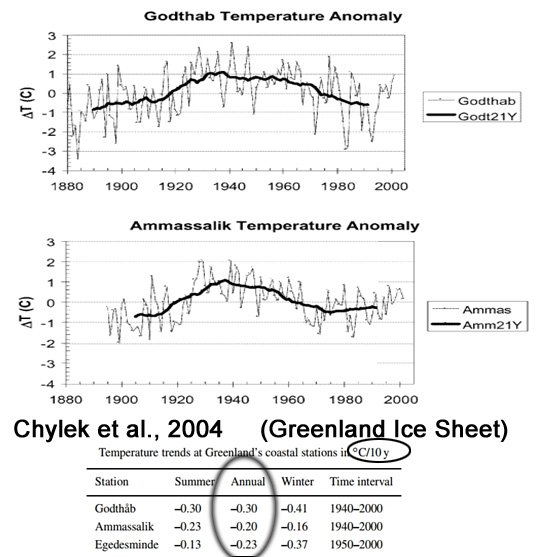
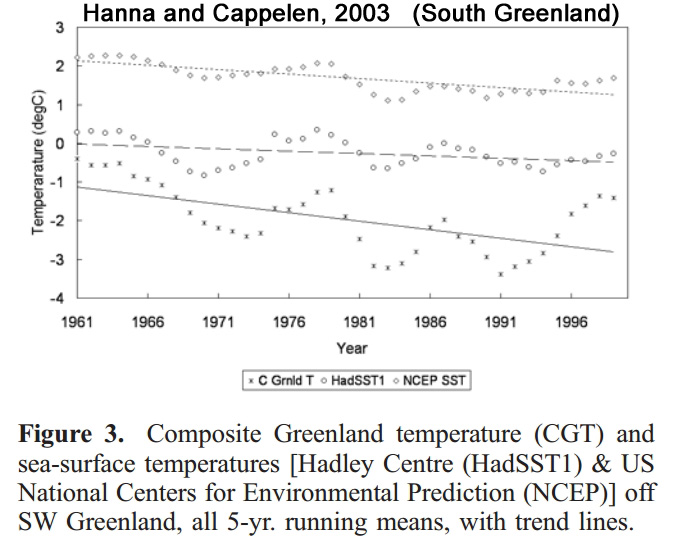
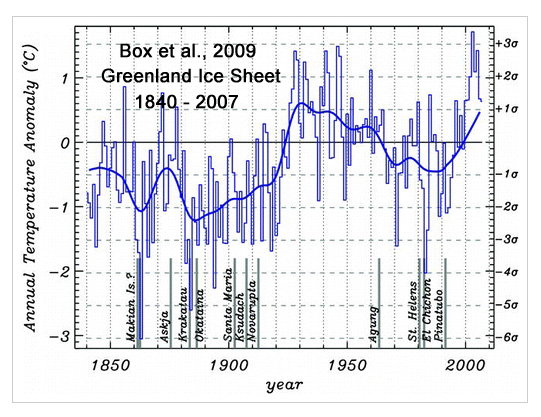
Below, there are graphs from several papers indicating that Greenland cooled between the 1940s and 1990s.
“Temporal and spatial variability are analysed in Greenland instrumental temperature records from 24 coastal and three ice sheet locations. … The standard period 1961–90 was marked by 1–2°C statistically significant cooling.”
Scientists have found that the overall cooling trend for Greenland since 1940 may have extended to the early 2000s.
“A significant and rapid temperature increase was observed at all Greenland stations between 1920 and 1930. The average annual temperature rose between 2 and 4°C in less than ten years.”
“A substantial decrease in the surface air temperature occurred over the Greenland ice sheet summit in summer season during the period of available measurements from 1987 to 2001. The average temperature of the warmest month and the summer average (June, July and August) temperature show a decreasing trend of 3.0 and 2.2°C/decade between 1987 and 2001 (Figure 8). This summer cooling of the ice sheet at the Summit is accompanied by winter warming at the rate of about 2°C per decade. The result is a substantial decrease in the annual temperature range (Figure 8) from 34°C in 1987 to less than 28°C in 2001. The cause of these rapid changes and decrease in temperature range is undetermined, however, a change in cloud cover is a possibility.”
“Analysis of new data for eight stations in coastal southern Greenland, 1958–2001, shows a significant cooling (trend-line change −1.29°C for the 44 years), as do sea-surface temperatures in the adjacent part of the Labrador Sea”
As recently as 1992-2002, the whole Greenland ice sheet continued to gain mass (at a rate of +11 Gt/year), which meant a net negative contribution to sea level rise from the Greenland ice sheet during that period.
“Changes in ice mass are estimated from elevation changes derived from 10.5 years (Greenland) [1992-2002] … of satellite radar altimetry data from the European Remote-sensingSatellites ERS-1 and -2. The Greenland ice sheet is thinning at the margins (–42 ± 2 Gt/yr–1 below the equilibrium-line altitude (ELA)) and growing inland (+53 ± 2 Gt/yr–1 above the ELA) witha small overall mass gain (+11 ± 3 Gt/yr–1; –0.03 mm a–1SLE (sea-level equivalent)).”
The subsequent Greenland warming trend (1995 – present) after 50 or 60 years of cooling has been characterized as smaller in magnitude and rapidity when compared to the 1920s and 1930s warming trend.
“Meteorological station records and regional climate model output are combined to develop a continuous 168-yr (1840–2007) spatial reconstruction of monthly, seasonal, and annual mean Greenland ice sheet near-surface air temperatures. The annual whole ice sheet 1919–32 warming trend is 33% greater in magnitude than the 1994–2007 warming.”
Since 2007, Greenland temperature trends have been flat (as shown below in Lim et al., 2016), indicating that the current warm period in Greenland has apparently plateaued and not superseded the early 20th century warming.

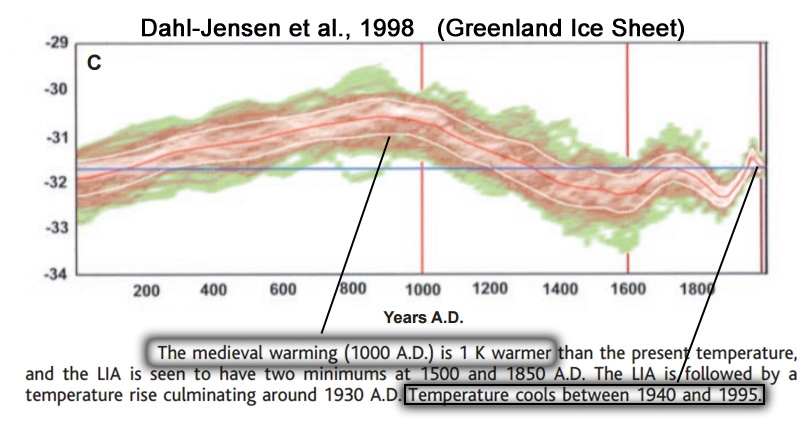
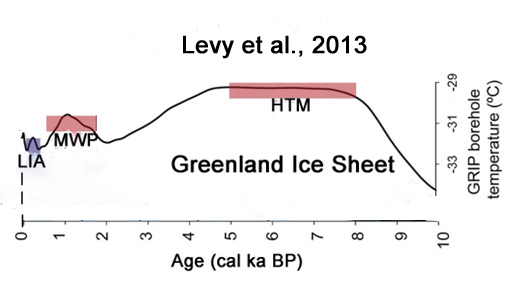
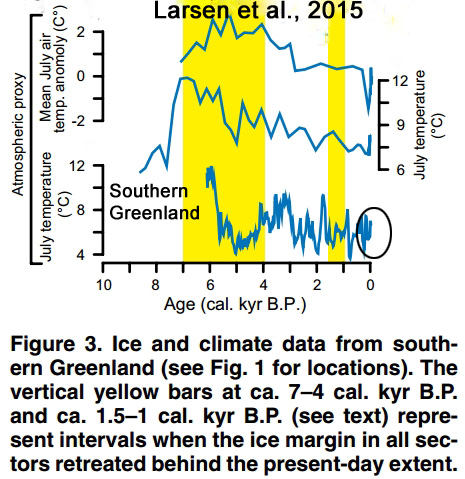
Finally, below are a few graphs of the last few thousand years which indicate that modern Greenland temperatures are not unprecedented, and in fact modern temperatures are still some of the coldest of the Holocene.
Levy et al., 2013 (Greenland Ice Sheet)
Lecavalier et al., 2013 (North Greenland)

Larsen et al., 2015 (Southern Greenland)
“Southern Greenland proxy-inferred atmospheric temperatures also peaked between ca. 7 and 4 cal. kyr B.P. at 2–4 °C higher than present“


If anyone happens to be interested.
Here is a link to the history behind the loss of those aircraft along with recovery, restoration of one of the P-38s. Renamed Glacier Girl.
http://p38assn.org/glacier-girl.htm
Just a small, almost nitpicky comment on an otherwise OUTSTANDING and INSPIRING article…
An increase from 1Gt to 6Gt+ is a 500+% increase, not 600%.
Ugh, embarrassing. Thank you for the correction, D. Steven Fraser. Edited.
6 to 1 is a six times multiplier or 600% of the original! Indeed the ‘increase’ is 500% or 5x the original! Why even use the conflicting terms % or ‘increase’? Is this another attempt to confuse the peons?
Didn’t solar forcing peak around mid-century?
Of the 5 solar cycles starting around 1950, 4 of them have been the highest since the LIA.
If you take the 3 cycle average, 1950-2000 was a very strong period of solar input.
But that has now changed.