Over the course of years to decades, the heat contained in the ocean naturally undulates, with more or less upwelling cooler waters rising to the surface. Naturally-occuring El Niño (wind current) events greatly influence the prevention of cooler waters from upwelling to the surface; this phenomenon, in turn, ultimately elicits an overall surface warming event (less cooling = net warming).
Below is a very simplified version of “How El Niño Works” from NASA:
NASA :
“During a normal year, strong, easterly surface winds (winds blowing from the east to the west) along the equator, cause upwelling of cold, nutrient rich water along the coast of South America. This keeps the waters of the central Pacific relatively cool. … When, for an as yet, unknown reason the easterly surface winds weaken, or reverse, the warm pool moves from the western Pacific to the central and eastern Pacific ocean basin. This situation is known as an El Niño, and when this happens, heavy rainfall occurs along the western coasts of Peru, Mexico and California instead. The warm water also acts as a cap that prevents cold water from upwelling along the eastern edge of the Pacific.”
Over time, net step-changes induced by each successive El Niño warming event may lead to an overall surface warming trend. The more frequent and/or powerful the El Niño event(s), the greater the net step change. These internal ocean heat circulation processes that lead to more or less heat welling up to the ocean surface can significantly account for the warming trend since the early 1980s, meaning that the increase in temperature could be mostly explained by natural variability, not anthropogenic intervention.
This conclusion has been reached by scientists Large and Yeager (2012), who maintain that, over the 1984-2006 period, the observed “diminished ocean cooling [i.e., warming] due to vertical ocean processes” imply that “natural variability” can explain the rise in sea surface temperatures since 1984 rather than anthropogenic climate change.
“Global satellite observations show the sea surface temperature (SST) increasing since the 1970s in all ocean basins, while the net air–sea heat flux Q decreases. Over the period 1984–2006 the global changes are 0.28°C in SST and −9.1 W m−2 in Q, giving an effective air–sea coupling coefficient of −32 W m−2 °C−1 …[D]iminished ocean cooling due to vertical ocean processes played an important role in sustaining the observed positive trend in global SST from 1984 through 2006, despite the decrease in global surface heat flux. A similar situation is found in the individual basins, though magnitudes differ. A conclusion is that natural variability, rather than long-term climate change, dominates the SST and heat flux changes over this 23-yr period.“
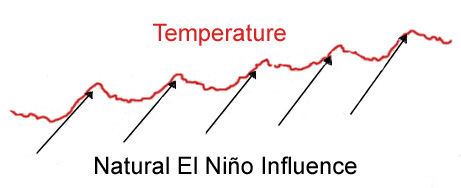
Below is an extremely simplistic illustration of the step-change influence of El Niño events on surface temperature. Notice that between each El Niño-induced warming event, the temperature declines or flattens until the advent of the next El Niño event.
El Niño-Induced Warming Events Are Natural, And Not Influenced By Human Activity
While discussing the powerful 2015-’16 El Niño a few months ago, Dr. Fredolin Tangang — a Malaysian climate scientist, oceanographer, and the vice-chairperson of the IPCC — maintains that the warming of the ocean surface which occurs with the onset of an El Niño event has not been linked to anthropogenic climate change, but is instead a naturally-occurring phenomenon.
The current El Nino phenomenon that has brought prolonged drought and sweltering heat to Malaysia is the strongest of the 20 over the last 60 years, but there is no concrete evidence to link its heat intensity to global warming, says an expert. Climatologist and oceanographer Prof Dr Fredolin Tangang of Universiti Kebangsaan Malaysia said this year’s El Nino was even more extreme than the severe phenomena experienced in 1982/82 and 1997/98.
“There is no conclusive evidence that the occurrence of El Nino (frequency and intensity) is influenced by climate change,” said Tangang, who had served from 2008 to 2015 as vice-chairperson of the Intergovernmental Panel on Climate Change (IPCC), a United Nations agency.
“El Nino is a naturally occurring phenomenon, which is part of the inter-annual variability associated with oscillation of the atmosphere-ocean interaction in the Pacific Ocean that occurs in a two- to seven-year cycle.”
A few months before Tangang’s announcement, Mike Halpert, NOAA’s deputy director of the Climate Prediction Center, had also declared that anthropogenic climate change was playing an “insignificant role, if any role at all” on the warmth experienced during 2015-’16.
NPR interview with NOAA’s Mike Halpert:
SHAPIRO: OK. So El Nino plays a role [in the 2015-’16 warming]. The Arctic oscillation plays a role. What about climate change? Is that playing a role?
HALPERT: If it is, it’s probably fairly insignificant at this point. If it were to play a role, it would be more likely if, somehow, climate change is impacting either the Arctic oscillation or El Nino, and we’re not really aware that it is at this point. If you think about, maybe – the high temperature over the weekend was 70, so maybe without climate change, it would’ve been 69. I think it’s a fairly insignificant role, if any role at all.
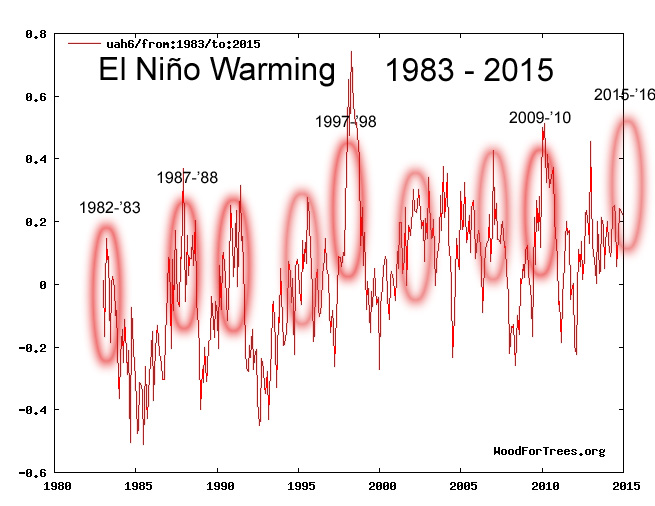
Since 1982, Temp Records Show No Warming Other Than Due To The All-Natural El Niño Warming Events, With Cooling In Between Each Event
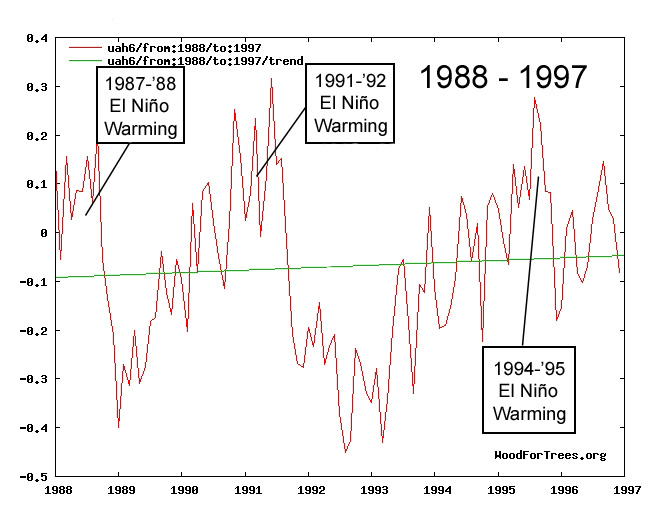
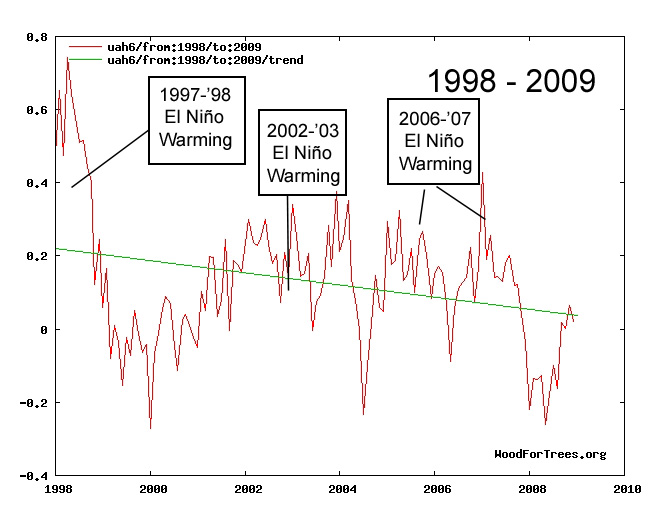
In the satellite record (UAH), the significant warming effects of moderate to strong El Niño events on temperature can be reasonably identified. As mentioned above, notice the cooling or flattened temperatures that occur between each warmth-inducing El Niño event.
Graphs below are courtesy of woodfortrees.org.
http://www.woodfortrees.org/plot/uah6/from:1983/to:1987/plot/uah6/from:1983/to:1987/trend

http://www.woodfortrees.org/plot/uah6/from:1988/to:1997/plot/uah6/from:1988/to:1997/trend
http://www.woodfortrees.org/plot/uah6/from:1998/to:2009/plot/uah6/from:1998/to:2009/trend
http://www.woodfortrees.org/plot/uah6/from:2010/to:2015/plot/uah6/from:2010/to:2015/trend
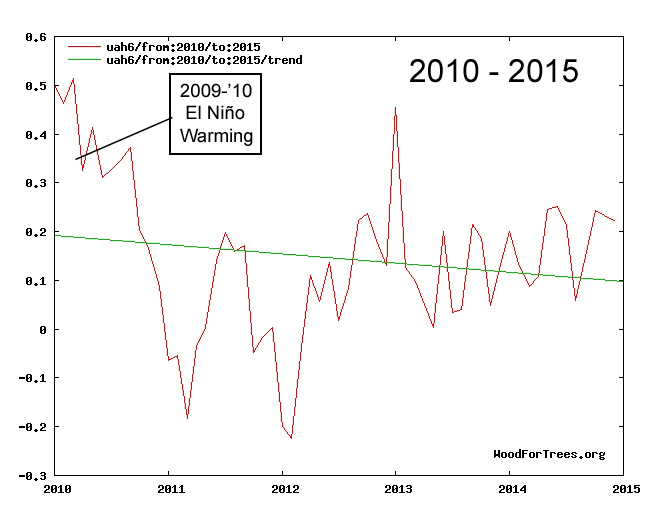
If we combine these graphs to illustrate the effects of El Niño events on temperature over the entire 1983 to 2015 period, a somewhat disorderly version of a step-change warming trend emerges that looks similar in scope to the neat and simplified El Niño-induced step-change graph shown above.
http://www.woodfortrees.org/plot/uah6/from:1983/to:2015
El Niño Events “Triggered” by Solar Activity
So if El Niño events can significantly explain the step-change warming trend in the temperature record since the early 1980s, what physical mechanism(s) may explain why El Niño events occur? According to scientists, the Sun is the main catalyst.
The impact of solar activity on the 2015/16 El Niño event
“Recent SST and atmospheric circulation anomaly data suggest that the 2015/16 El Niño event is quickly decaying. Some researchers have predicted a forthcoming La Niña event in late summer or early fall 2016. From the perspective of the modulation of tropical SST by solar activity, the authors studied the evolution of the 2015/16 El Niño event, which occurred right after the 2014 solar peak year. Based on statistical and composite analysis, a significant positive correlation was found between sunspot number index and El Niño Modoki index, with a lag of two years. A clear evolution of El Niño Modoki events was found within 1–3 years following each solar peak year during the past 126 years, suggesting that anomalously strong solar activity during solar peak periods favors the triggering of an El Niño Modoki event. The patterns of seasonal mean SST and wind anomalies since 2014 are more like a mixture of two types of El Niño (i.e., eastern Pacific El Niño and El Niño Modoki), which is similar to the pattern modulated by solar activity during the years following a solar peak. Therefore, the El Niño Modoki component in the 2015/16 El Niño event may be a consequence of solar activity, which probably will not decay as quickly as the eastern Pacific El Niño component. The positive SST anomaly will probably sustain in the central equatorial Pacific (around the dateline) and the northeastern Pacific along the coast of North America, with a low-intensity level, during the second half of 2016.”
Summarizing, scientists Lakshmi and Tiwari (2015) point out that climate changes are primarily driven by solar activity and El Niño events. This leaves little to no room for anthropogenic activities to have a significant influence on the Earth’s climate.
“Introduction: Several recent studies of solar–geomagnetic effects on climate have been examined on both global as well as on regional scales. The Sun’s long-term magnetic variability is the primary driver of climatic changes. The magnetic variability (mostly short-term components) is due to the disturbances in Earth’s magnetic fields caused by the solar activity, which is usually indicated by indices of geomagnetic activity. The Sun’s magnetic variability modulates the magnetic and particulate fluxes in the heliosphere. This determines the interplanetary conditions and imposes significant electromagnetic forces and effects upon planetary atmospheres. All these effects are due to the changing solar-magnetic fields which are relevant for planetary climates, including the climate of the Earth. The Sun–Earth relationship varies on different time scales of days to years bringing a drastic influence on the climatic patterns. The ultimate cause of solar variability, at time scales from decadal to cen tennial to millennial or even longer scales, has its origin in the solar dynamo mechanism. During the solar maxima, huge amounts of solar energy particles are released, thereby causing the geomagnetic disturbances. … The 11 years solar cycle acts an important driving force for variations in the space weather, ultimately giving rise to climatic changes. Therefore, it is very important to understand the origin of space climate by analyzing the different proxies of solar magnetic variability.”
“The another most important climate variation is El Niño–Southern Oscillation (ENSO) events, which impact the global oceanic and atmospheric circulations which thereby produce droughts, floods and intense rainfall in certain regions. The strong coupling and interactions between the Tropical Ocean and atmosphere play a major role in the development of global climatic system. The El Niño events generally recur approximately every 3–5 years with large events spaced around 3–7 years apart. The El Niño–Southern Oscillation (ENSO) phenomena has shown huge impact on the Asian monsoon (Cole et al., 1993), Indian monsoon (Chowdary et al., 2006, 2014) as well as globally (Horel and Wallance, 1981; Barnett, 1989; Yasunari, 1985; Nicholson, 1997). In particular, the El Niño, solar, geomagnetic activities are the major affecting forces on the decadal and interdecadal temperature variability on global and regional scales in a direct/indirect way.”


Very thorough and explicit with strong references. My own post on this comes to the same conclusion with some other sources:
https://rclutz.wordpress.com/2016/11/05/el-ninos-hottest-year/
Since 1900, apart from in one solar cycle in which there were two spikes and in the adjacent solar cycle four spikes, every solar cycle has contained three ‘El nino’ spikes in temperature. The strongest following solar minimum, another after solar maximum, and one halfway down the tail of the cycle.
This is also synchronised with the Moon. El nino is triggered by alignements of the Moon with Earth and Sun when the lines of Apse and/or Nodes also align.
Climate change is driven mainly by tides and insolation.
The ENSO phenomenon (encompassing both warm El Nino and cool La Nina episodes) is a consequence of there being more ocean in the southern hemisphere.
The greater volume of water in the southern hemisphere absorbs mopre solar energy than does the lesser amount of water in the northern hemisphere.
Over time,an energy imbalance builds up between the two hemispheres until there is a discharge of energy across the equator in the form of an El Nino event.
It is quite possible that the timing of the discharge is affected by lunar tidal influences.
Roger I agree with you here because I found the same things.
The post-solar minimum ENSO is a response to the rate of TSI increase at the onset of the cycle, mixed by lunar tides per IW. The post-solar max ENSO(s) result from high TSI spikes during the solar max, and the last ENSO imo, something I need to verify this cycle, is probably due to the high insolation under low TSI clear skies (an albedo effect), like in 2006.
I think your F10.7cm 90sfu threshold for warming/cooling is “at the knee”, like we’ve reached during this year, as the F10.7cm flux for 2016 is now about 90. BUT, we reach 90sfu quite often and it doesn’t cool necessarily, and the reason for that is a longer term level must also be reached for cooling to start.
The long-term F10.7cm flux threshold I calculated in mid-2014 is 120sfu. This month we are at 120.1sfu, and by Jan 2017 it’ll be 120.0, which incidently is the same time frame for cooling that David Evans’ notch delay predicts. I didn’t stop there.
It was that summer when I witnessed that the sun did drive the ENSO, using F10.7cm, before I studied TSI. The 2014 ENSO was dropping off with solar flux into mid-summer, then flux went back up, firing up the ENSO again, as I predicted in mid-2014 before it happened.
In August of 2015 I found F10.7cm of 120sfu is statistically equivalent to SORCE TSI of 1361.25 w/m2. In mid-March 2016, the daily TSI dropped below that threshold, and with it SSTs & OHC, right on time, concurrently. It was a beautiful thing to witness.
http://www.cpc.ncep.noaa.gov/products/analysis_monitoring/enso_update/heat-last-year.gif
http://www.ospo.noaa.gov/data/sst/anomaly/2016/anomnight.11.14.2016.gif
http://www.cpc.ncep.noaa.gov/products/analysis_monitoring/ocean/weeklyenso_clim_81-10/wkteq2_anm_55m.gif
Back in mid-2014 I wasn’t sure if the F10 threshold was 120 or 121 sfu.
When TSI crossed the line this year, the long-term F10.7cm average was at 120.5sfu. So, it seems we’re already there!
There’s more too, especially about the modern maximum, ‘global’ warming, and extreme events…
Kenneth has posted so many papers supporting these concepts. I credit you all, those authors, and so many others for also discovering the basic idea.
Let’s face it, if there is a true objective reality, it’s logical and expected that so many of us would find it in our own way.
“This is also synchronised with the Moon. El nino is triggered by alignements of the Moon with Earth and Sun when the lines of Apse and/or Nodes also align.”
And Jupiter aligns with Mars.
How exactly do these conditions cause an El Nino? Scientifically?
Dear UN-IPCC,
Your goose is cooked, its over.
Close the door on the way out!
Yes the UN-IPCC people have thrown a line to the media.
And yes, the compliant media have announced that this year is ‘on course’ for being the hottest year ever on every news outlet — over, and over, and over… But of course this nonsense is endlessly repeated because so many listeners/viewers are freezing their asses off and are NOT convinced.
The world needs a #UNFEXIT! movement now!
tom0mason wrote:
“And yes, the compliant media have announced that this year is ‘on course’ for being the hottest year ever on every news outlet — over, and over, and over… But of course this nonsense is endlessly repeated because so many listeners/viewers are freezing their asses off and are NOT convinced.”
As they say, the plural of anecdote is not data.
I’m in good company! just like you, data free.
If you don’t know the data, you should look them up.
http://data.giss.nasa.gov/gistemp/tabledata_v3/GLB.Ts+dSST.txt
http://www.metoffice.gov.uk/hadobs/hadcrut4/data/current/time_series/HadCRUT.4.5.0.0.monthly_ns_avg.txt
http://www.ncdc.noaa.gov/cmb-faq/anomalies.php
http://ds.data.jma.go.jp/tcc/tcc/products/gwp/temp/ann_wld.html
Just tune into Australia’s ABC or the BBC domestic or World Service to hear for yourself. From there news agencies have replicated the item.
So wake-up David Appell get tuned in and stop asking for others to spoon-feed you when you are too lazy to supply requested data links when asked, see https://notrickszone.com/2016/11/14/since-1982-temperature-records-show-no-warming-other-than-that-due-to-natural-el-nino-warmth-inducing-events/comment-page-1/#comment-1147208.
That link is wrong.
Ask yourself: why do El Ninos keep getting warmer?
The 1997-98 El Nino peaked about about 0.4 C above the 1982-83 peak.
And the recent El Nino peaked at about 0.4 C above 1997-98.
Explain.
“the recent El Nino peaked at about 0.4 C above 1997-98”
http://www.woodfortrees.org/plot/rss/from:1998/to/plot/rss/from:1998/to/trend
According to RSS global mean (above), it was a little over 0.1 C above the ’98 peak, and the overall trend for the 18 year period is +0.1 C. With the upcoming La Nina, that overall 18-year trend will be reduced to hundredths of a degree in the coming months. It’s already only about 0.05 C of total warming between 1998 and now in the land only data, as the land anomaly has just plummeted below the anomalies from the early 2000s, as seen here:
http://www.woodfortrees.org/plot/rss-land/from:1998/to/plot/rss-land/from:1998/to/trend
So with almost 40 ppm of CO2 “forcing” since the last El Nino, we have a “warming” trend of less than one tenth of one degree in 18 years.
Why is it that CO2 forcing has had no influence on the greenhouse effect since 1992, David? Why do you continue to avoid responding to this paper:
https://notrickszone.com/2016/09/19/new-paper-documents-imperceptible-co2-influence-on-the-greenhouse-effect-since-1992/
@David Appell 16. November 2016 at 4:38 AM said
“That link is wrong.”
You are in error again, that link at https://notrickszone.com/2016/11/14/since-1982-temperature-records-show-no-warming-other-than-that-due-to-natural-el-nino-warmth-inducing-events/comment-page-1/#comment-1147208 is entirely correct. Why do you continue to avoid responding to this question?
The rotten appell always AVOID, RUNS, HIDES when he knows he cannot back up anything he says.
That is how he operates.
He has NOTHING except EMPTY, BASELESS RHETORIC.
I covered this subject back in 2008:
http://www.newclimatemodel.com/the-real-link-between-solar-energy-ocean-cycles-and-global-temperature/
and elaborated on the specific solar mechanism here:
http://joannenova.com.au/2015/01/is-the-sun-driving-ozone-and-changing-the-climate/
whereby solar effects on global cloudiness alter the balance between cool La Nina episodes and warm El Nino episodes.
Stephen, it appears the joannenova essay on the Sun driving ozone has found a home in a just-published (4 days ago) doctoral dissertation from Finland:
Maliniemi, 2016
Recent results, both observational and from chemistry climate models, have indicated significant effects in the Earth’s middle atmosphere due to the energetic electrons precipitating from the magnetosphere. These effects include the formation of reactive hydrogen and nitrogen oxides in the high latitude mesosphere and the depletion of ozone caused by them. Ozone is a radiatively active and important gas, which affects the thermal structure and dynamics of the middle atmosphere. Accordingly, the depletion of ozone can intensify the large scale stratospheric circulation pattern called the polar vortex. Winter weather conditions on the surface have been shown to be dependent on the polar vortex strength.
A comprehensive knowledge of the Earth’s climate system and all its drivers is crucial for the future projection of climate. Solar variability effects have been estimated to produce only a small factor to the global climate change. However, there is increasing evidence, including the results presented in this thesis, that the different forms of solar variability can have a substantial effect to regional and seasonal climate variability. With this new evidence, the solar wind related particle effects in the atmosphere are now gaining increasing attention. These effects will soon be included in the next coupled model inter comparison project (CMIP6) as an additional solar related climate effect.
Nice to see that this research is finally being noticed. The research has been conducted under the ReSoLVE Center of Excellence of the Oulu University in Finland:
http://www.spaceclimate.fi/resolve/
“(Research on SOlar Long-term Variability and Effects) is a Center of Excellence established in 2014 and funded by the Academy of Finland. We are a group of 5 research teams from University of Oulu and Aalto University focused on studying the long-term solar variability and its effects in near-Earth space, atmosphere and climate”
so there is a lot more of research along this lines being done in Finland
Are you the author? Excellent paper. The number of Sun-Climate scientific papers for 2016 has now reached 100. Thank you for the contribution to the solar sciences.
No, I am not the author 🙂 I just happen to follow the scientific discussion on matters related to climate.
BTW, more papers to be found here:
http://www.spaceclimate.fi/resolve/publications.html
an energy imbalance builds up between the two hemispheres until there is a discharge of energy across the equator – See more at: https://notrickszone.com/2016/11/14/since-1982-temperature-records-show-no-warming-other-than-that-due-to-natural-el-nino-warmth-inducing-events/comment-page-1/#comment-1146940
Hi Steven. Interesting. What’s your empirical evidence for this?
Hi Rog.
It makes sense in light of empirical observations.
http://realclimatescience.com/wp-content/uploads/2016/11/Screen-Shot-2016-11-13-at-8.11.06-PM.png
record global cooling past eight months over land RSS.
“Since 1982, Temperature Records Show No Warming Other Than That Due To Natural El Niño Warmth-Inducing Events”
I wonder how many hundred times I have said this ! 🙂
Have been saying it too Andy, as it is very obvious to see in the data.
La Ninas play a big role too.
You completely ignored them.
“La Ninas play a big role too. You completely ignored them.”
Great! So you acknowledge that La Ninas “play a big role” in net climate changes. Should we then assume that you also agree that El Ninos also play a “big role” in net climate changes? If so, how much relative to CO2 changes?
Between 2015 and 2016, surface temperatures rose by 0.7 C and declined by 0.5 C. Did CO2 cause both the warming and the cooling? Or just the warming?
Yes, ENSOs play a big role in increases/decreases in surface temperatures.
How exactly is that news?
Why do El Ninos keep getting warmer? La Ninas too?
David, you and many warmists have yet to explain why your super molecule fails to prevent huge cool downs as we have seen this year and in other years?
CO2 take a vacation when La-Nina events come around?
By the way, you didn’t answer his question:
“Between 2015 and 2016, surface temperatures rose by 0.7 C and declined by 0.5 C. Did CO2 cause both the warming and the cooling? Or just the warming?”
When are you going to answer,David?
And you completely ignore providing any pictures of birds killed by coal fired power station
I can only assume you were yet again LYING
How much of this warming was cause by CO2, appell grub?
https://s19.postimg.org/bu42tbw1f/UAH_Australia_20_years.png
Or how about this warming ?
https://s19.postimg.org/pxr2p1rw1/UAH_So_Pol_All.png
And Japan developed massively from 1950-1990. How much of its warming was caused by CO2?
https://s19.postimg.org/6kzq5cxdf/japan1950_1990.png
All that nice El Niño warmth was just what the Pacific Phytoplankton enjoyed.
Cool Pacific, less plankton, less initial CO2 up-take?(maybe)
Great post on The deplorable climate site.
TH shows that the 8 month cooling since the peak of the El Nino has been the fastest, and deepest, cooling in the whole of the satellite data.
I’ll use my graphs because I have UAH as well..
https://s19.postimg.org/eb6iahzoz/RSS_8_month.png
https://s19.postimg.org/54o7n7ugj/UAH_8_month.png
Wow! That’s a darn steep fall on both graphs. I also don’t see that rate of change moderating anytime soon, but lets hope, eh?
the problem with this article is, that the main claim is false:
“Over time, net step-changes induced by each successive El Niño warming event may lead to an overall surface warming trend.”
There is simply zero support for this claim.
The opposite is true: any positive trend with a random positive “spike” effect will look like “step changes” without the steps being real.
Surely you jest Sod!
This article quoted a number of recently published science papers showing evidence of step warming,that matches very well with El-Nino events.
One of the points of the post was this you manage to miss:
“SHAPIRO: OK. So El Nino plays a role [in the 2015-’16 warming]. The Arctic oscillation plays a role. What about climate change? Is that playing a role?
HALPERT: If it is, it’s probably fairly insignificant at this point. If it were to play a role, it would be more likely if, somehow, climate change is impacting either the Arctic oscillation or El Nino, and we’re not really aware that it is at this point. If you think about, maybe – the high temperature over the weekend was 70, so maybe without climate change, it would’ve been 69. I think it’s a fairly insignificant role, if any role at all.”
Natural events,NOT “climate change” are the dominant cause of warming trends. Once again CO2 is left out in the cold with no demonstrated ability to drive the weather or climate.
You as usual look dumb.
Sir sod is, regrettably, totally right. This post is simply misguided.
Not that I’d believe sod’s or my comment made any difference.
Wert is also WRONG
Don’t tell me we have yet another brainwashed AGW psychophant !!
“There is simply zero support for this claim. :
sop is, AS USUAL, totally WRONG
Let’s look up the FACTS
1. No warming in the UAH satellite record from 1980 to 1998 El Nino
2. No warming between the end of that El Nino in 2001 and the start of the current El Nino at the beginning of 2015.
3. No warming in the southern polar region for the whole 38 years of the satellite record.
4. No warming in the southern ex-tropicals for 20 years.
5. No warming in Australia for 20 years, cooling since 2002
6. No warming in Japan surface data for the last 20 years, No warming from 1950-1990.. ie, a zero trend for 40 years through their biggest industrial expansion
7. No warming in the USA since 2005 when a non-corrupted system was installed, until the beginning of the current El Nino.
8. UAH Global Land shows no warming from 1979-1997, then no warming from 2001 – 2015
9. Iceland essentially the same temperature as in the late 1930s as now, maybe slightly lower
10. British Columbia (Canada) temperatures have been stable, with no warming trend, throughout 1900-2010
11. Chile has been cooling since the 1940s.
12. Southern Sea temperatures not warming from 1982-2005, then cooling
13. Even UAH NoPol shows no warming this century until the large spike in January 2016.
That is DESPITE a large climb in CO2 levels over those regions and time periods.
There IS NO CO2 WARMING effect.
The ONLY warming has come from REGIONAL El Nino and ocean circulation effects such as the PDO and AMO.
sod:
Can you provide evidence, sod, that there is “zero support” for the conclusion that ENSO has influenced the climate shift/increase in temperatures since the 1970s, or on centennial-scale time periods? Because that’s what the science says. Below are just a few examples. Let’s see you back your claims with science. Because I don’t think anyone is inclined to just take your word for it.
—–
https://www.sciencedaily.com/releases/2016/06/160609115117.htm [press release]
El Niño oscillations in Pacific Ocean may have amplified global climate fluctuations for hundreds of years at a time
Scientists have found past El Niño oscillations in the Pacific Ocean may have amplified global climate fluctuations for hundreds of years at a time. The team uncovered century-scale patterns in Pacific rainfall and temperature, and linked them with global climate changes in the past 2000 years. For example, northern hemisphere warming and droughts between the years 950 and 1250 [Medieval Warm Period] corresponded to an El Niño-like state in the Pacific, which switched to a La Niña-like pattern during a cold period between 1350 and 1900 [Little Ice Age].
—–
http://link.springer.com/article/10.1007/s00382-014-2173-x
The most intense El Niño episodes in more than a century occurred after the 1970s climate shift. Previous studies show that the characteristics of the El Niño-Southern Oscillation (ENSO) phenomenon changed synchronously with the shift, but the associated causes are not fully understood. We present observational evidence which supports the hypothesis that the change in the TPMM [tropical Pacific meridional mode, responsible for the post-1970s climate shift to warming] was triggered by the great salinity anomaly (GSA), which manifested in the North Atlantic during the late 1960s. The GSA induced a weak Labrador convection and a SST dipole south of Greenland. The associated atmospheric structure includes a North Pacific Oscillation sea level pressure dipole in the Pacific sector. This excites the TPMM which contributes to the intense El Niño events and to the enhanced ENSO’s asymmetry, observed after the shift. Our results imply that, if the GSA has not an anthropic origin, as was suggested, then the tropical Pacific climate shift has a natural origin. This is supported by the end of the North Atlantic regime in the 1990s and by the rebound of the tropical Pacific after 1998.
—–
http://www.pnas.org/content/111/41/14716.full.pdf
The bidecadal to centennial climate shifts in the Pacific region during the MCA [Medieval Climate Anomaly] can be described in terms of the latitudinal extent of the tropics and the mean state of the Pacific Ocean region with respect to the persistence or frequency of either phase of the El Niño−Southern Oscillation (ENSO). Shifts in mean climate state result from a change in the timing and frequency of persistent seasonal summer−winter weather patterns, and storm frequency. For example, a shift to more El Niño-like (La Niña-like) climate involves a higher frequency of westerly (southeasterly) winds in the Southern Hemisphere tropics and, on a decadal scale, represents the occurrence of multiyear El Niño (La Niña) events, as seen in recent decades 1980–2000 (1950–1970).
Kenneth: Why do El Ninos keep giving warmer and warmer surface and LT temperatures?
Where does that heat come from?
You aren’t seriously suggesting that CO2 provides the energy for El Ninos.
That would be a bizarre fantasy, even for you, appell.
The ONLY warming has come from SOLAR energised El Ninos, and that is only regional, as I have shown many times before.
There is absolutely NO CO2 WARMING SIGNAL in the satellite data. None what-so-ever.
Ignore the truth for as long as you like.. it only makes you look less credible.
” Below are just a few examples”
Those “examples” do not show your point.
Your articles at best claim a coincidence of more el ninos and warmer temperatures on two (TWO!) examples.
That is an example of garbage science at best.
so enlighten us: How much do you know about the strength of el nino events over the last 2000 years and their effect on global temperature?
“Those ‘examples’ do not show your point.”
I’ll just presume you don’t understand what decadal and centennial scale ENSO-climate shifts are, then. It’s obviously not worth explaining to someone who has already made up his mind that any scientific paper that challenges his beliefs is “garbage science at best.”
http://www.woodfortrees.org/plot/rss-land/from:2016/to/plot/rss-land/from:2016/to/trend
Since you apparently believe that ENSO events are caused by 0.000001 variations in CO2 concentrations, sod, please explain why the 2016 land temperature anomaly has plummeted by -1.2 C since January (above WFT link). Did CO2 cause that rapid cooling? Or does it only cause the warming, and then the cooling is natural? Explain how that works.
“Since you apparently believe that ENSO events are caused by 0.000001 variations in CO2 concentrations, sod, please explain why the 2016 land temperature anomaly has plummeted by -1.2 C since January”
i do not think that CO2 causes ENSO.
And i do not think that ENSO is the CAUSE (cause!) of the temperature increases.
And i also do not think that there are step changes in the temperature that are caused (CAUSED) by ENSO.
The cooling is easy to explain: it is called weather. If you look in the past, you will see similarish drops.
You do not understand CO2 at all. writing it with those many zeros behind the comma is simply stupid.
If you ever in your life meet a scientist, he can explain it to you.
http://nature.berkeley.edu/~penggong/textbook/images/atmospheric%20window2.jpg
Sod, you didn’t explain ANYTHING. Kenneth,requested you to do that,Quoting:
“Since you apparently believe that ENSO events are caused by 0.000001 variations in CO2 concentrations, sod, please explain why the 2016 land temperature anomaly has plummeted by -1.2 C since January (above WFT link). Did CO2 cause that rapid cooling? Or does it only cause the warming, and then the cooling is natural? Explain how that works.”
You are as usual scraping the bottom of the barrel.
“And i do not think that ENSO is the CAUSE (cause!) of the temperature increases.”
“You do not think”…. just finish your sentence there.
Seems sop has been having psycho-illogical discussions with CO2, so know he “knows” it.
Too many zeros for you, hey sop!
Primary school repeat needed for you, yet again.
Do pay attention to basic maths this time.
There is a mass of evidence that the only warming has come from El Nino effects.. but as usual, you will just ignore the actual science, in favour of some childish mumbo jumbo.
“Over time, net step-changes induced by each successive El Niño warming event may lead to an overall surface warming trend.”
Where does the increased warmth come from?
David Appell: “Where does the increased warmth come from?”
Insolation, ultimately. Where did you think deep ocean heat comes from, David?
Have you found that scientific experiment that empirically demonstrates that 0.000001 variations in CO2 concentrations are the predominant cause of changes in ocean heat content? If so, please cite it. You have been asked many times to produce the scientific evidence that CO2 variations in volumes of 0.000001 are capable of heating up ocean water — or any water, for that matter. And you have yet to provide any. Why?
Explain why it is your belief that these scientists are wrong:
Douglass and Knox, 2015
http://www.pas.rochester.edu/~douglass/papers/PLA_Sun_II_in_press.pdf
Global ocean temperature time series from the surface to depths of 2000 m since the year 2000 are found to agree in detail with those of other diverse climate indices. It is asserted that these systems are driven by a forcing unquestionably of solar origin that has two manifestations: (1) a direct phase-locked response to what is identified as a solar forcing at a frequency of 1.0 cycle/yr for the whole time series; (2) a second phase-locked response at a period of two years or three years. With these findings it is becoming clear that the entire climate system is responding to the varying incident solar radiation
—–
Clark, 2010
http://eae.sagepub.com/content/21/4/171.abstract
http://www.eike-klima-energie.eu/uploads/media/EE_21-4_paradigm_shift_output_limited_3_Mb.pdf#page=13
Energy transfer at the Earth’s surface is examined from first principles. The effects on surface temperature of small changes in the solar constant caused by the sunspot cycle and small increases in downward long wave infrared (LWIR) flux due to a 100 ppm increase in atmospheric CO2 concentration are considered in detail. The changes in the solar constant are sufficient to change ocean temperatures and alter the Earth’s climate. The surface temperature changes produced by an increase in downward LWIR flux are too small to be measured and cannot cause climate change. The assumptions underlying the use of radiative forcing in climate models are shown to be invalid. A null hypothesis for CO2 is proposed that it is impossible to show that changes in CO2 concentration have caused any climate change, at least since the current composition of the atmosphere was set by ocean photosynthesis about one billion years ago.
The ‘clear sky’ upper limit for the CO2 induced increase in evaporation is below the measurement uncertainty bounds. Long term averages of surface air temperatures are approximately 2 C below the corresponding ocean surface temperatures. This means that there is usually no direct heating of the ocean by the atmosphere, as required by the Second Law of Thermodynamics. As discussed below (Figure 15), any slight increase in atmospheric H2O vapor concentration will produce atmospheric cooling through increased upward LWIR emission under these conditions. Latent heat of evaporation is not released until the water condenses, which is generally at altitudes above 1 km. It is therefore impossible for an increase in downward atmospheric LWIR flux of 1.7 W.m−2 to heat the ocean.
Yamakawa et al., 2016
http://www.sciencedirect.com/science/article/pii/S104061821501143X
It is known that global average SST [sea surface temperature] was positively correlated with solar activity (Reid, 1987 and Reid, 1991). However, the relationship between solar activity and regional SST has not been investigated in detail. This study attempted to determine the relationships between solar activity and SST. Instrumental data from 1901 to 2011 revealed a significant positive relationship on a global basis.
Conclusion: The analysis of the relationship between variations in solar activity and SST from 1901 to 2011 indicated that sunspot numbers and SST were positively correlated in wide areas, with statistically significant positive correlations in many regions…. Analyses of the relationships between solar activity and the Earth’s climate system also revealed relationships between variations in solar activity and circulation in the troposphere. It is worthy of note that the highest coefficients at a 29-month lag were found in the relationships both between SSN [sunspot number] and PDO [Pacific Decadal Oscillation], and SSN and CP El Niño with statistical significance at the 99% confidence level, respectively.
—–
Luening and Vahrenholt, 2016
https://www.researchgate.net/publication/308928345_The_Sun%27s_Role_in_Climate
The amplitude of the observed temperature fluctuations is often more than 1°C and thus has a similar or even greater range than the warming that has occurred since the Little Ice Age. Furthermore, many of these Holocene, natural climate fluctuations show the same level of abruptness as the 20th-century warming. A common characteristic of many of the documented millennial climate fluctuations is their good match with solar activity changes, as well as a North Atlantic climate record by Bond et al. (2001). Besides solar activity changes, internal millennial ocean cycles may have contributed to the observed climate oscillations.
—–
de Larminat, 2016
http://www.sciencedirect.com/science/article/pii/S1367578816300931
[T]he recent anthropogenic contribution is found to be less than the contribution of solar activity. Reflecting the predominance of internal variability in the error output, the natural contribution (solar and volcanic activities, plus internal variability) becomes clearly much greater than the anthropogenic contribution in the recent warming.
“Have you found that scientific experiment that empirically demonstrates that 0.000001 variations in CO2 concentrations are the predominant cause of changes in ocean heat content?”
Do you know what happens on a cold windy night, if i only remove a single brick (one of thousands?) from the wall of our house?
Translation:
I can’t answer Kenneth’s request for EMPIRICAL EVIDENCE,therefore put up a feeble brick (ironic)fallacy instead.
That is the best you can do,Sod?
So.. the answer from sop is,
“NO.. there is no scientific experiment…..”
… so sop pretends he is the big bad wolf”
““NO.. there is no scientific experiment…..””
there are basically no global scientific experiments. But hey, do not let the facts touch you.
Sod, still has no answer to Kenneth’s question.
Here it is again,Sod:
“Have you found that scientific experiment that empirically demonstrates that 0.000001 variations in CO2 concentrations are the predominant cause of changes in ocean heat content?”
When are you going to answer it?
sop, you have not present one single fact.
You ignore all facts.
You are an empty vassal.
“there are basically no global scientific experiments”
Not only are there no “global” scientific experiments that indicate 0.000001 (that’s 1 part per million, sod) variations in CO2 concentrations cause changes in deep ocean heat, there are no scientific experiments that indicate that 0.000001 variations in CO2 concentration have *any* effect on the temperature of *any* body of water — a child’s swimming pool or a bucket of water. It’s all an assumption based upon models.
If you don’t agree, please cite an experiment that shows CO2 heats water in *any* container. It doesn’t even have to be the ocean. Got anything?
During a period of prolonged low solar activity I would expect to see cooling step changes after successive La Ninas.
“uring a period of prolonged low solar activity I would expect to see cooling step changes after successive La Ninas.”
That is an absurd claim.
Sod,
Steve,made a statement expecting something,your reply was to ridicule him.
You have NOTHING to counter or discuss it with him. You are all wind and water here.
“Steve,made a statement expecting something,your reply was to ridicule him.
You have NOTHING to counter or discuss it with him. You are all wind and water here.”
sorry, but you are wrong. El Nino is not the cause of the increase in temperature, but at least an El Nino can indeed warm the atmosphere.
Things work a little different with la nina and those will definitely not cool the planet.
Though it might look like it does, to the uneducated searching for step changes in a graph that has none.
Sod,
apparently doesn’t know the difference between OPINION and Evidence.
Steve, made an interesting unsupported statement,but you didn’t care,as you you made an unsupported reply to him,ridiculing him in the process.
Why are you still here Sod,when you don’t provide real evidence to support your assertions? You have been asked questions,you don’t answer them,just make unsupported assertions instead,which doesn’t help you at all.
I have seen you post many empty,inane comments for over 10 years now,no improvement in sight in all that time.
Poor sop, perpetually WRONG
and totally IGNORANT.
El Nino is THE ONLY cause of the increase in temperature.
You can IGNORE the data as long as you like.
That does not change the FACT. !!
You have NOTHING to counter the FACTS.. and you know it.
Poor sop, just because you don’t have the slightest clue about how climate works, doesn’t make the claim absurd.
All your lack of any climate knowledge does, is display your ignorance, yet again.