75% Of Total Modern Glacier Melt Occurred Before 1950
“[T]he retreat of the glaciers after about 1925 became rapid. It was almost entirely during the [pre-1950] twentieth century warming that the Alpine glaciers disappeared from the valley floors up into the mountains. Similarly great retreats occurred in Scandinavia, Iceland, Greenland, in the Americas, and on high mountains near the equator.” — H.H. Lamb Climate, History, and the Modern World (1982), pg. 248
A new scientific paper indicates that the pronounced warming that occurred during the years stretching from the 1920s to the 1940s melted Northern Iceland glaciers much more extensively and at a far more rapid pace than has been observed in recent decades.
During the 1960s to 1980s, glacier melt rates not only decelerated relative to the 1920s to 1940s, the ice actually advanced in some cases due to decades of cooling. It has only been since about the mid-1990s that glaciers have consistently begun melting again — but with far less alacrity than they did in the first half of the 20th century.
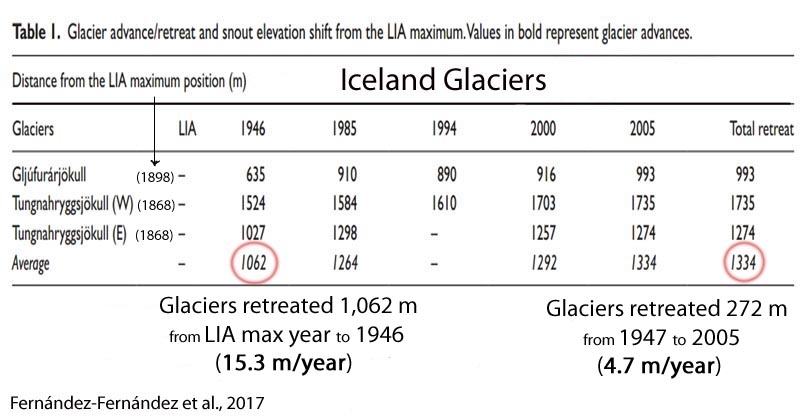
Fernández-Fernández and co-authors (2017) indicate that the Icelandic glaciers they studied melted by more than 1,000 meters (1,062) on average between the late 1800s and 1946. But from 1947 to 2005, these same glaciers only retreated by an average of 272 meters more. In other words, about 75% of the total glacier melt production since the end of the Little Ice Age (the late 19th century) occurred prior to the mid-1940s.
Below are some key points and graphs from the paper.
Fernández-Fernández et al., 2017
Summary:
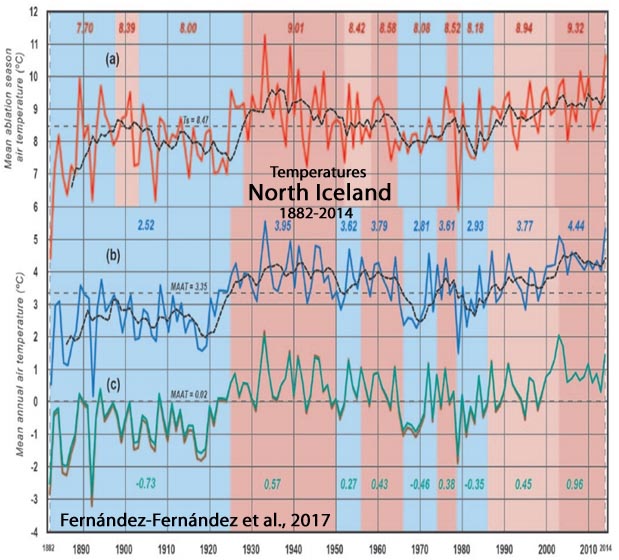
“The abrupt climatic transition of the early 20th century and the 25-year warm period 1925–1950 triggered the main retreat and volume loss of these glaciers since the end of the ‘Little Ice Age’. Meanwhile, cooling during the 1960s, 1970s and 1980s altered the trend, with advances of the glacier snouts. Stötter et al. (1999) indicate that the coldest period after the LIA was from the early 1960s to the mid-1970s, when temperatures fell to levels equivalent to the warmest recorded in the 19th century. This cooling is the reason given by Caseldine (1983, 1985a, 1985b, 1988) to explain the advance of the Gljúfurárjökull between the mid-1970s and the mid-1980s … Studies of aerial photographs and satellite images show that the glacier snouts have retreated by more than 1300 m on average since the LIA maximum (considered to be AD 1898 in Gljúfurárjökull and AD 1868 in both Western and Eastern Tungnahryggsjökull), with an altitudinal rise of more than 100 m. The retreat accelerated rapidly (15.3 m yr−1) during the first half of the 20th century. In the second half of the 20th century, the retreat decelerated considerably, reflected in the lowest values around 1985 (5.2 m yr−1) and a trend shift in 1994, with an advance observed in Gljúfurárjökull. … The retreat rate intensified in the period 2000–2005 compared with 1994–2000, but did not reach the rates recorded before 1946.”
Gljúfurárjökull, West Tungnahryggsjökull, and East Tungnahryggsjökull Glaciers:
1. During the period 1898–1946, the snout of Gljúfurárjökull retreated 635 m, almost two-thirds of the total distance from the LIA maximum (1898–1903) to 2005, at an average rate of 13.2 m yr−1.
2. The trend in Western Tungnahryggsjökull during the first half of the 20th century was a more rapid retreat, showing the highest average rates of the whole period (19.5 m yr−1). By 1946, this glacier had retreated almost 90% of the total recorded between the LIA maximum (1868) and 2005.
3. Just as in the glaciers described above, the retreat of the Eastern Tungnahryggsjökull from its LIA position was more intense during the first half of the 20th century, and in 1946 its snout was only 200 m from its current position. … The 2000 aerial photograph shows that an advance of at least 41 m had taken place since 1985. Nevertheless, between 2000 and 2005, the snout retreated 17 m, even more slowly than Western Tungnahryggsjökull.
No Net Warming In North Iceland Since 1920s-1940s
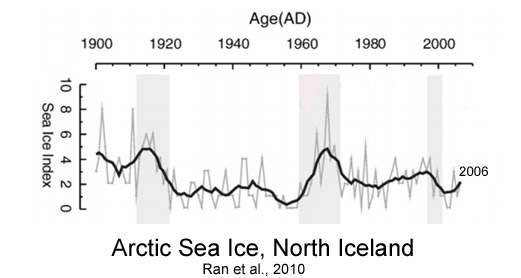
Similar Or Less North Iceland (Arctic) Sea Ice During 1920s-1950s
Ran et al., 2010
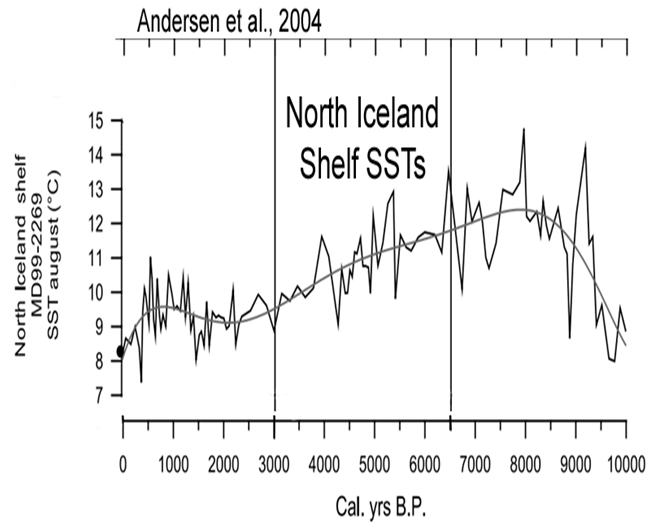
Holocene Icelandic Climate 4-5°C Warmer, Changing 2-3°C Per Century
Andersen et al., 2004
“Our results show that the Nordic Seas circulation system is highly sensitive to the large-scale insolation [surface solar radiation] changes as the general Holocene climate development follows closely the Northern Hemisphere insolation. … Century-scale surface current variability for the Holocene is shown to be 1 – 1.5°C for the Vøring Plateau and East Greenland shelf, and 2.5– 3°C on the North Ice-land shelf. … The first cooling [East Greenland Shelf SSTs] from 2400 to 2000 cal years BP was introduced by a 1.5°C temperature drop starting at 3000 cal years BP which culminated in an SST low around 2100 cal years BP. The second cooling occurred around 300 cal years BP and preceded a rapid warming [during the 1700s A.D.], where SSTs rose with more than 1.5°C within 70 years. The third cooling took place in the second half of the last century. Until the last three centuries, SST variability at this site has been 1°C, while SSTs varied with amplitudes of 1.5– 2°C during the last 300 years.”
Not Just Iceland: Global Glacier Melt Rates More Rapid, Pronounced 1920s-1950s
Gregory et al., 2013

Globally, glaciers melted 69% more rapidly from 1921-1960 (12.5 meters/year) than from 1961-2000 (7.4 meters/year).
Leclercq et al., 2014 A data set of worldwide glacier length fluctuations
“The data set contains the glacier length records for 471 [global] glaciers and it covers the period 1535–2011. There are glacier length records from all continents and at almost all latitudes. For the observed glaciers, the 20th century retreat was strongest in the first half of the 20th century.”
“[T]he retreat is strongest in the period 1921–1960 rather than in the last period 1961–2000, with a median retreat rate of 12.5 m yr in 1921–1960 and 7.4 m yr in the period 1961–2000.”
A Significant Non-Correlation Between CO2 Emissions And Glacier Melt
Advocates of the position that humans exert a profound and dangerous influence on the Earth’s temperatures, glacier melt, sea level rise, extreme weather patterns . . . point to the rapid increase in human CO2 emissions (purple trend line) as the condemnable culprit.

But consider that the trend in anthropogenic CO2 emissions was essentially flat and very low (averaging just 1 gigaton of carbon [GtC] per year) from about 1900 to 1945, when most modern glacier recession occurred. Also consider that explosive growth in human emissions occurred after 1945, when a significant deceleration in glacier melt (and even decades of advancing glaciers) occurred. This historical evidence would not appear to support the position that anthropogenic CO2 emissions drive warming, glacier melt, and sea level rise.


How do you homogenise a glacier?
Pierre try https://soundwaves.usgs.gov/2001/07/glacierbaymap.gif
for a time series on melting that doesn’t fit AGW theory. Note that the ice when at the mouth of the bay was grinding the bottom so retreat not due to warm sea currents.
The homogenisers have mastered temperature, sea levels and precipitation.
Mastering homogenisation of glacier melt rates, gravity, atmospheric pressures and palaeontology shouldn’t be too hard.
soot.
Please finally consider that more than one variable can influence the climate and therefor sea level and glaciers. The early 20th century industry polluted the air with soot … causing glacier melt (among a few other issues).
https://scholar.google.de/scholar?q=soot+glaciers (for a few thausand papers on the topic)
And something else caused the ice to melt after the last ice age. Do you think the same natural effect is at work today?
https://notrickszone.com/wp-content/uploads/2017/01/Total-Solar-Irradiance-1700-2013-Yndestad-and-Solheim-17.jpg
—
Is it possible that the abrupt increase in solar irradiance from 1900 to 1950 (see link above from Yndestad and Solheim, 2017) could have had quite a bit to do with the abrupt increase in radiative energy melting glaciers during that period? Or, in your opinion, does soot cause more glacier melt than the Sun?
—
http://arxiv.org/PS_cache/arxiv/pdf/1102/1102.4763v1.pdf
“We obtained a large historical solar forcing between the Maunder minimum and the present, as well as a significant increase in solar irradiance in the first half of the twentieth-century. Our TSI reconstructions give a value of ∼1 W/m2 per decade [+5 W/m2] for the period 1900–1950.”
—
Or even surface solar radiation (heat energy absorbed via variations in albedo) trends for that period could explain the abrupt warming:
—
http://onlinelibrary.wiley.com/doi/10.1029/2008JD011290/abstract
“Global solar irradiance showed a significant fluctuation during the last 90 years. It increased from 1920 to 1940s/1950s, thereafter it decreased toward late 1980s. In early 1990s 75% of the globe indicated the increasing trend of solar irradiance, while the remaining area continued to lose solar radiation. The magnitudes of the variation are estimated at +12 W m 2 [1920-1940s/1950s], – 8 W m 2 [1950s-1980s], and +8 Wm2 [early 1990s-2005], for the first brightening, for the dimming, and the recent brightening periods, respectively.”
—
In your opinion, how much did solar forcing contribute to the early 20th century warming relative to soot-forcing?
This is the graph that you are looking for:
http://www.realclimate.org/images/ipcc_rad_forc_ar5.jpg
http://www.climate4you.com/images/SolarIrradianceReconstructedSince1610.gif
and your second link do not show the sharp decrease in the 50s.
Anyway, thank you for your answer. Apparently you do expect a 1.25 W/m² change in the energy budget (5 W/m² devided by 4: sphere to circle area conversion) of the surface has some effect on the climate. The climate sensitivity due to CO2 concentration changes is in the same range and often estimated to be higher.
Why can’t it be responsible now? Did the solar irriadance change since the 50s? Not much. Did the CO2 forcing change? Yes.
“Did the solar irriadance change since the 50s?”
roflmao….. the sebtroll ignorance comes to the fore, yet again
the latter part of last century was a Grand Solar Maximum.. if you think that TSI is the only solar variable, you are even more of a ignorant goose than even I thought you were.
There is NO such thing as CO₂ “forcing”, its fake science from the AGW priests.
You have proven by your INABILITY to produce one single contrary paper, that CO₂ DOES NOT cause warming in a convective atmosphere.
AndyG55, here is one paper that measured the effect of CO2:
http://asl.umbc.edu/pub/chepplew/journals/nature14240_v519_Feldman_CO2.pdf
Also, point an infrared thermometer up at the sky and tell me what it measures. The temperature of space?
No seb.. the Marty Feldman paper started at the very base of a La Nina and ended at the peak of an El Nino and they still took 5 years to tease out an immeasurable wattage with HUGE error limits. It is a monumental farce.
And pointing an infrared thermometer measure H₂O radiation NOT CO₂. You are not measuring CO₂ radiation because it does re-emit below about 11km
https://s19.postimg.org/s6jyed10z/stratospheric_cooling.jpg
Its almost as if you haven’t read ANY of the FACTS put in front of you about what actually happens.
Your WILFUL IGNORANCE is on display for all to see.
You have still have been TOTALLY UNABLE to show ONE SINGLE PAPER that shows that CO₂ causes warming in a convective atmosphere.
You cannot even back-up the most basic LIE of your worthless AGW religion
And that really is PATHETIC.
Why did Marty Feldman do a check to2008.. One should always do partial period checks of data (its science, seb.. way beyond you)
And why did such an important (lol) paper take 5 years from the end data to of publishing…
(very unusual for a “climate science paper, normally they are rushed through pal-review)
..or did their data actually go to 2012, and they had to ignore the last part.
The immeasurable back-radiation didn’t cause any warming…. the NATURAL warming caused the immeasurable back radiation, probably just a remnant on the wings of the H₂O bands. certainly not CO₂, because as we know, CO₂ DOES NOT re-emit below 11km, so that cannot be what they teased out of the data after 5 years of computing 😉
https://s19.postimg.org/6nqtliulv/Feldman_oops.png
Yeah right …
https://i2.wp.com/www.skepticalscience.com/images/infrared_spectrum.jpg
Skeptical NONSense.
roflmao. You really have to up your credibility somehow, oh brain-washed twerp.
Proves NOTHING except CO₂ absorbs in a certain frequency, which everybody knows.
Says NOTHING about what happens after that.
Says ABSOLUTELY NOTHING AT ALL about CO₂ warming a convective atmosphere.
You are STILL batting ZERO from 200+,
Maybe if you remove your blindfold, it might help !!
Nah, because you would still have your eyes closed.
Dear AndyG55,
what you are saying is that all the energy CO2 absorbs results in warming of the surrounding atmosphere. Where does this energy go?
You clearly have no clue at all …
Identify where the models say the CO2 heat energy goes. Then identify, via observations and controlled scientific experiments, where the heat energy goes. Is there a difference?
Poor seb.. still flapping around trying IN VAIN to support even the most basic LIE of his baseless AGE religion.
Still waiting for something , ANYTHING, that proves CO2 causes warming in a convective atmosphere.
Waiting waiting
so pathetic of you..
baseless belief.
baseless religion.
Seems poor seb hasn’t got even the most basic clue about gases and how the work
Did you even get past junior high, you poor ignorant child-mind ????
Sleb seems to think that energy isn’t immediately shared to the other 99.96% of the atmosphere.
DUMB, Dumber.. then seb.. the DUMBEST. ..
You didn’t answer the question …
You didn’t provide a paper.
And I have answered the question many times before. You just don’t read or don’t comprehend.
I CANNOT solve your massive dose of “stupid”
And really seb, if you are so, so ignorant that you can’t figure out where energy in the atmosphere goes… I don’t think ANYONE can help you.
Did you even finish primary school !! ???
So you don’t think that 5 W m-2 of global TSI forcing (that you’ve divided by 4) has more than “some” effect on the climate? According to estimates of global surface solar radiation (energy absorbed at the surface due to changes in albedo), there was “+12 W m-2” of solar radiation forcing from the 1920s to the 1950s.
http://onlinelibrary.wiley.com/doi/10.1029/2008JD011290/abstract
“Global solar irradiance showed a significant fluctuation during the last 90 years. It increased from 1920 to 1940s/1950s, thereafter it decreased toward late 1980s. In early 1990s 75% of the globe indicated the increasing trend of solar irradiance, while the remaining area continued to lose solar radiation. The magnitudes of the variation are estimated at +12 W m 2 [1920-1940s/1950s], – 8 W m 2 [1950s-1980s], and +8 Wm2 [early 1990s-2005], for the first brightening, for the dimming, and the recent brightening periods, respectively.”
You obviously don’t know how to calculate your own modeled/hypothetical CO2-forcing in W m-2 so as to compare it to solar forcing. So I’ll have to educate you on how the IPCC (your side) “computes” CO2 forcing.
First of all, the IPCC (2013) has claimed that the total radiative forcing from CO2 concentration changes has been 1.8 W m-2 for the entire period between 1750 and 2011. The IPCC has also stated that the radiative forcing for CO2 was 1.5 W m-2 for the period extending from 1951 to 2011.
—
“Over the period 1951–2011 the trend in anthropogenic forcing is almost 0.3 W m–2 per decade and thus anthropogenic forcing over this period is more than 1.5 W m–2.” IPCC AR5 Chapter 8, page 699
—
That leaves 0.3 W m-2 of alleged CO2 forcing for the entire 1750 to 1950 period. More specifically, according to your side, the CO2 radiative forcing for 1910 to 1950, when CO2 increased from 300 to 310 ppm, was 0.12 W m-2 (using the formula 3.3% change out of 3.7 W m-2 for doubled CO2). So, for the period of highest glacier melt, CO2 forcing was alleged by the IPCC’s calculations to be 0.12 W m-2. Solar forcing, by contrast, was estimated to be anywhere between 10 (1.25 W m-2) and 100 times (+12 W m-2) greater than CO2’s 0.12 W m-2. And yet your claim is that CO2 forcing is in the “same range” or higher. I have no idea where you concocted that…but I don’t put it past you to just make stuff up, as you’ve done that multiple times in recent weeks.
What was the soot-forcing value (in W m-2) for the first half of the 20th century, SebastianH? Where is that value found in the last IPCC report?
Kenneth, do you realize that there is a difference between the trend of total solar irradiance and trends in measured irradiance on the surface? In the words of the authors of your linked paper:
That’s why I devided the change in TSI by 4, because that’s what you do when going from a irradiated circle in order to get the irradiation on the surface of a sphere (Earth).
The CO2 forcing is in the same range as changes in TSI.
Also: a change in solar irradiance induces a change in backradiation (feedback), while a change in backradiation does not change the solar irradiance. This lessens the effect of a TSI change in terms of temperature change.
And at last: I repeat – once again – changes in the past are not necessarily caused by the same effect as changes today and vice versa. Yes, TSI increased in the early 20th century and is most likey the major reason for glacier melt and temperature changes back then. However, TSI didn’t change much since the 50s (http://www.climate4you.com/images/SolarIrradianceReconstructedSince1610.gif) … you paper shows aerosols decreased (and the lack of them increased) measured irradiance at the ground. Another forcing mechanism. CO2s influence adds on top of all this …
http://asl.umbc.edu/pub/chepplew/journals/nature14240_v519_Feldman_CO2.pdf
“However, TSI didn’t change much since the 50s ”
Nope, as your chart shows.. it was on FULL BURN the whole time….
No wonder the Earth warmed from El Nino steps.
That much CONTINUOUS energy being pumped into the oceans, had to surface some time.
And there’s that Marty Feldman paper again, where the heat from the El Nino may have caused a small change in down-welling on the wings of the HO₂ spectrum, after CONSIDERABLE statistical manipulation and comparison to models etc etc.
It certainly WASN’T from CO₂ because CO₂ doesn’t emit below 11km.
And that down-welling from H₂O DID NOT cause the El Nino warming, it was CAUSED BY the El Nino warming.
Again
There is NO CO₂ WARMING in either satellite record.
There is NO CO₂ warming signal in sea level rise.
There is NO CO₂ warming signal ANYWHERE…
… except in NOAA/GISS data adjustments.
Get used to those FACTS, seb
Because there is NOTHING you can do about them.
Yes, I am quite aware of the difference between surface solar radiation (heat energy absorbed by the surface/oceans due to variations in albedo [aerosols and clouds]) and changes in the Sun’s output, as I’ve read extensively on this topic and accumulated 100s of papers detailing it. In contrast, your posts strongly suggest that much of this information is new to you.
For example, you seem to be unaware that even though you have dismissed the estimated +8 W m-2 of SSR forcing for the 1990-2005 period due to aerosol loading changes/reductions, you still have to contend with cloud radiative forcing (a net decrease in cloud cover, allowing more SW solar radiation to absorbed by the surface/oceans), which is generally agreed to be about +2 – +3 W m-2 for the 1980s to 2000s. Once again, these radiative forcing trends from cloud cover reductions completely dominate the alleged forcing attributed to CO2 (according to models) during this period (0.0 to 0.2 W m-2 per decade according to Song, Wang, & Tang (2016) or Feldman et al., (2015). So again, you are stuck with the problem of magnitude (natural forcing vs. CO2 forcing) that you, for obvious reasons, wish to pretend doesn’t exist.
For a brief summary of the trends in surface solar radiation, the Feldman et al. (2015) paper, and the enormous magnitude problem your paradigm has that I am referring to, see here:
https://notrickszone.com/2016/10/27/3-new-papers-reveal-dominance-of-solar-cloud-forcing-since-the-1980s-with-co2-only-a-bit-player/
Earlier you mentioned that soot-forcing melted the glaciers in the early 20th century. I asked you to provide the radiative forcing values for soot for that period (in W m-2) as agreed upon by the IPCC. You have yet to provide these values. Is that because you don’t know them? Do you have a peer-reviewed paper supporting your views on this? I ask because you’ve now seemed to change your mind and acknowledge that “TSI increased in the early 20th century and is most likely the major reason for glacier melt and temperature changes” So have you abandoned the soot-forcing explanation as the major reason?
You say that just because natural variations in clouds and aerosols and the Sun’s radiance dominated as the determinants of net ocean heat changes and climate change in general in the past doesn’t mean that they are the dominant cause now. Which begs the question (that you keep on avoiding answering): What year (or span of years) did variations in clouds and natural aerosol emissions stop influencing the climate, SebastianH so as to allow 0.000001 variations in CO2 to take over as the dominant climate regulator? Will you finally answer this question?
I have not abandoned soot, but you presented valid data that TSI increased in that period, so this “most likely” was a major reason. I am not sure of the magnitude of the effect such a change would have. 5 W/m² increase in TSI is after all just 1.25 W/m² on the actual surface area. This kind of warming of the surface would lead to an increased warming due to the greenhouse effect and increased cooling due to convection. Also – as you wrote – the ocean is a big heat sink for solar radiation. So lots of variables in a complex system.
I’ll keep repeating myself: it doesn’t matter what other effects are at work. The increased greenhouse effect due to CO2 still exists. Similar to your bank account income and withdrawals change the balance in bigger magnitudes, but if those two are staying basically the same the whole time it is interest that dominates. Got it?
What year (or span of years) did variations in clouds and natural aerosol emissions stop influencing the climate, SebastianH so as to allow 0.000001 variations in CO2 to take over as the dominant climate regulator? Will you finally answer this question?
And if the increased greenhouse effect due to CO2 “still exists”, but is completely overwhelmed by changes in natural planetary constituents like clouds and aerosols, why do you nonetheless believe the latter are worth dismissing when discussing the main causes of climatic changes/ocean heat changes?
Why not just answer the question, SebastianH? Why keep on dodging it? Identify the year or span of years that clouds and aerosols stopped varying and thus causing net heat changes in the oceans.
So what radiative forcing values in W m-2 are assigned to soot-forcing, then? I keep asking you this question, and you keep avoiding it. Is that because you don’t know? Don’t you think you should know this before posting that early 20th century glacier melt was due to soot-forcing?
Poor seb , mindless irrelevant analogies is about all he has left…….
Come to think of it
its all he has ever had. !!
“The increased greenhouse effect due to CO2 still exists….”
in your brain-addled IMAGINATION only.
As you repeatedly show in your TOTAL INABILITY to provide one relevant paper that shows CO₂ causes warming in a convective atmosphere.
No CO₂ warming in the 39 years of satellite data.
No CO₂ signal in sea level rise,
No CO₂ warming signal anywhere.
NO CO₂ WARMING……. PERIOD.
“the ocean is a big heat sink for solar radiation.”
well done, you have figured out step 1. !!!
..but, as you know, the oceans are NOT warmed by any mythical long-wave back-radiation from CO₂.
AndyG55,
please just stop pretending like you don’t understand:
https://geosciencebigpicture.com/2016/04/10/the-2-good-greenhouse-gas-iii-looking-up/
AGW-science, right?
The backradiation isn’t warming anything. When will you finally understand the very basic principle of radiative energy transfer? In order to get to a steady state with its environment a heated object (ocean) has to reach a certain surface temperature. If the atmosphere radiates a certain amount of energy in the direction of the object the temperature has to be higher than within a vacuum.
Explain how heat energy from 0.000001 changes in atmospheric CO2 concentrations is transferred such that net heat changes in bodies of water are dominated by these 1 part per million changes in CO2. Use observational evidence from a scientific experiment.
You can’t do this, of course, because, as you’ve already acknowledged, your belief about CO2 causing heat changes in water is only theoretical. Modeled. Heat transfer from CO2 has never been observed in the real world. That’s why you are continually asked to produce a paper to show that this isn’t just a belief…and you can’t do it. All you do is repeat what the hypothetical models say is true, and then castigate the non-believers who aren’t willing to accept something to be true that has never been observed scientifically. That’s why we are skeptics and you’re a believer. Beliefs aren’t science.
While I don’t agree with the wording in some cases here (i.e., I don’t use the word “impossible”), see if you can explain to us why this chemist is wrong about CO2-induced water heating…
https://quadrant.org.au/opinion/doomed-planet/2009/12/diy-ocean-heating/
On the one hand you want “observational evidence” on the other hand you reject such evidence when I present measurements of the downwelling longwave radiation. You (and AndyG55) are not consistent …
But I get it now. If we would measure the salinity of the oceans in a 1 km grid, you’d believe the values taken at the stations but in the area between the measurement stations for all you know the salinity could be 0 as well. Correct?
Regarding your link: the chemist doesn’t understand radiative heat transfer. He accurately describes transfer by contact and the fact that heat does not flow from cold to warm. That’s all straight forward. With no source of energy (sun) there is no way the ocean could get warmer.
But there is the sun and the ocean absorbs energy from the sun and the temperature increases. It increases until its surface is emitting (radiation, convection, etc) exactly as much energy to its surroundings as it absorbs. But its surroundings isn’t empty, it is radiating too and depending on its temperature convection & co have a changing effect too.
And this is where the chemist got it wrong. If the surroundings change so convection or radiative transfer is less effective, the ocean surface temperature will increase until the balance is achieved again.
SebastianH, the evidence you present is not observational evidence, or actual physical measurements, of CO2 variations heating or cooling WATER. It’s a modeled result. You have no observational evidence or scientific experiment showing that CO2 modifications in volumes of 0.000001 heat or cool water bodies. None. It’s all theoretical. Actually, hypothetical.
Since you think you do, please provide scientific evidence (observational, experimental) that varying CO2 concentrations above a body of water cause net heat changes in that body of water. You can’t. It’s hypothetical. All your “explanations” are not rooted in real world experiments. Even SkepticalScience acknowledges this. Why can’t you?
Since you believe that decadal-scale variations in cloud and natural aerosol depth used to (but no longer do) influence the climate like they used to because humans took over the climate and ocean heating-cooling with our CO2 emissions, please identify the year or span of years that clouds and aerosols stopped varying and thus stopped affecting the heat content of the oceans, or climate changes. I will keep on asking you this question, SebastianH, so you’d better concoct another of your made-up answers.
What’s the W m-2 value for early 20th century soot-forcing? I keep on asking you to support your beliefs (that soot melted glaciers in the early 20th century), but when pressed to support these beliefs, you can’t. Why do you write things that you can’t support?
We know there is radiation from atmospheric H₂O. But only because it has already done it job.
No CO₂ radiation until 11km. where acts to cool the planet by radiating to space.
Who says convective transfer becomes less effective? Making stuff up again hey ??
Takes very little convective change to transfer the small thermalisation of CO₂ absorption in the lower atmosphere.
Maybe you could MAKE UP a paper that shows CO₂ causes warming in a gravity/thermal gradient controlled atmosphere..
Making it up is the only way you will find one.
Maybe you could stun us all with another primary school anti-science analogy that shows how little you actually comprehend about science.
Make up your own version of science as you go, that seems to be what you are doing.
You have certainly FAILED MISERABLY to support even the most basic lie of you AGW religious farce.
CO₂ DOES NOT cause warming in a convective atmosphere.
CO₂ DOES NOT cause any warming of the oceans.
CO₂ DOES NOT act as a blanket (lol), or slow down energy transport in the atmosphere in any way what so ever. It is just another conduit for energy transfer.
There is NO CO₂ WARMING signal in either satellite record.
There is NO CO₂ warming signal in sea level rise.
There is NO CO₂ warming signal ANYWHERE… … except in NOAA/GISS data adjustments.
Get used to those FACTS, seb
Because there is NOTHING you can do about them.
“please just stop pretending like you don’t understand:–”
roflmao..
poor ignorant seb, thinks radiation is the only energy movement in a convective atmosphere.
there is dumb, there is DUMBER… then there is seb !!
and doesn’t pretend to be dumbest.. he just is.
“The backradiation isn’t warming anything. ”
YIPPEEEEEEEE.. seb finally gets something right. 🙂
then goes off on another anti-science rant ignoring the main control of the lower atmosphere. 🙁
oh well, seb,
One step forward 4 steps back. !!
Kenneth, I guess it is also hypothetical to you that a body of a certain mass experiences the same force when accelerated regardless of its location (e.g. over the ocean or over land). Is it also hypothetical to you that an object with a certrain speed will travel a certain distance in an hour regardless of its location?
It’s true, you can’t just change CO2 concentration over the ocean and observe what happens. But you can observe the downwelling longwave radiation and this radiation has an effect on the surface, regardless of the material it consists of. Sure, it could be possible that ocean water behaves against known physics and doesn’t need to become warmer to emit more energy to counteract this, but it is highly unlikely. Just as with the salinity of the ocean being 0 in a location which has not been measured yet.
Why would they stop affection the climate? You may repeat this question as often as you want, but I don’t think you understood the answer. You were nearly there with you pool analogy …
Since you didn’t comment on the chemist being wrong. Do you understand why he was wrong? The warming of the ocean has nothing to do with something cold transfering heat to something warmer.
I don’t know about the soot forcing of the early 20th century, but I imagine it was as high as today in Asia. Feel free to google those values. Globally it seems to be around 0.4 and 1 W/m².
They don’t. But in order for your beliefs to be realized about CO2 as the predominant factor influencing net ocean heat changes, and thus climate changes, clouds would necessarily need to remain steady or not vary. That’s because clouds alone affect both SW and LW (GHE) radiative forcing on a far more pronounced scale even with seemingly tiny, insignificant changes. Cloud variations dominate radiation budget changes.
The total net radiative forcing for CO2 since 1750, as alleged by the IPCC, is 1.8 W m-2. Doubled CO2 (to 560 ppm) from pre-industrial levels is alleged to cause 3.7 W m-2 of forcing (which is usually rounded up to 4 W m-2). Variations in clouds, on the other hand, completely overwhelm this alleged CO2 forcing…
—
RealClimate (Dr. Peter Minnett)
“Of course the range of net infrared forcing caused by changing cloud conditions (~100W/m2) is much greater than that caused by increasing levels of greenhouse gases (e.g. doubling pre-industrial CO2 levels will increase the net forcing by ~4W/m2)”
—
Ramanathan et al., 1989
The size of the observed net cloud forcing is about four times as large as the expected value of radiative forcing from a doubling of CO2. The shortwave and longwave components of cloud forcing are about ten times as large as those for a CO2 doubling.
—
So if changes in cloud radiatively dwarf changes in CO2 in determining LW (and SW), and you acknowledge that clouds don’t just remain in steady states on decadal scales, and many dozen scientific papers attest that changes in cloud cover since the ’80s have led to a net positive radiative forcing that completely overwhelms the alleged forcing values for CO2 (as expressed in W m-2), why do you nonetheless dismiss/ignore all this and continue to insist that CO2 has been the predominant cause of warming since the 1980s anyway? Why are you pretending that the magnitude of radiative forcing differences between CO2 and cloud variations doesn’t matter?
—
http://file.scirp.org/Html/22-4700327_50837.htm
The reduction in total cloud cover of 6.8% [between 1984 – 2009] means that 5.4 Wm−2 (6.8% of 79) is no longer being reflected but acts instead as an extra forcing into the atmosphere… To put this [5.4 Wm-2 of solar radiative forcing via cloud cover reduction between 1984-2009] into context, the IPCC Fifth Assessment Report…states that the total anthropogenic radiative forcing for 2011 relative to 1750 is 2.29 Wm−2 for all greenhouse gases and for carbon dioxide alone is 1.68 Wm−2. The increase in radiative forcing caused by the reduction in total cloud cover over 10 years is therefore more than double the IPCC’s estimated radiative forcing for all greenhouse gases and more than three times greater than the forcing by carbon dioxide alone [from 1750 to present].
—
http://www.sciencemag.org/content/295/5556/841
It is widely assumed that variations in Earth’s radiative energy budget at large time and space scales are small. We present new evidence from a compilation of over two decades of accurate satellite data that the top-of-atmosphere (TOA) tropical radiative energy budget is much more dynamic and variable than previously thought. Results indicate that the radiation budget changes are caused by changes in tropical mean cloudiness.
—
ftp://bbso.njit.edu/pub/staff/pgoode/website/publications/Palle_etal_2005a_GRL.pdf
Traditionally the Earth’s reflectance has been assumed to be roughly constant, but large decadal variability, not reproduced by current climate models, has been reported lately from a variety of sources. There is a consistent picture among all data sets by which the Earth’s albedo has decreased over the 1985-2000 interval. The amplitude of this decrease ranges from 2-3 W/m2 to 6-7 W/m2 but any value inside these ranges is highly climatologically significant and implies major changes in the Earth’s radiation budget.
“In a nutshell, water takes a lot of energy to heat up, and air doesn’t contain much. In fact, on a volume/volume basis, the ratio of heat capacities is about 3300 to 1. This means that to heat 1 litre of water by 1˚C it would take 3300 litres of air that was 2˚C hotter, or 1 litre of air that was about 3300˚C hotter! … The ocean contains a colossal 1,500,000,000,000,000,000,000 litres of water! To heat it, even by a small amount, takes a staggering amount of energy. To heat it by a mere 1˚C, for example, an astonishing 6,000,000,000,000,000,000,000,000 joules of energy are required.”
Since 1750, the IPCC alleges that the total net radiative forcing for CO2 has been 1.8 W m-2. Please explain why you believe this is enough energy to warm the ocean by 1˚C. And then explain why the chemist is wrong about this, and you are right.
So soot-forcing was 0.4 to 1 W/m2 during the early 20th century. Where did you come up with this? Please provide the source.
CO2 forcing was 0.12 W m-2 for 1910 to 1950 (per modeling). And solar radiative forcing was anywhere between 1.25 W m-2 and 12 W m-2, or 10 to 100 times greater. But yet you believe humans caused the glaciers to melt and temperatures to warm anyway. And that’s why you’re the believer, and we’re the skeptics. And science is not for believers.
So you didn’t understand.
The backradiation (or difference of the surroundings to a vacuum) is not causing the whole ocean water to warm. To emit as much energy as the ocean receives only the surface has to reach the necessary temperature. I don’t know how to get any clearer …
1.8 W/m² on the entier ocean surface equals 2.05 x 10^22 Joules per year. So it takes roughly 300 years for the ocean to warm by 1°C if this were the only thing that’s going on. No additional convection, no radiative energy loss.
What’s the additional ocean heat content compared to 1980 levels nowadays? 20 * 10^22 Joules?
For soot you can start at wikipedia: Black carbon radiative forcing. Enough source links in there.
Oh sheesh. I understand what your beliefs are, as there is nothing you’ve written that I haven’t read before from those who cling to your beliefs. You offer nothing new. I understand every diversionary tactic you attempt. Every failure to address the points about magnitude that render modeled CO2 forcing values insignificant by comparison. Every attempt to claim that CO2 changes are “the only thing going on” even though you simultaneously admit that cloud and aerosol variations have not stopped, and therefore are not “the only thing going on”.
Nearly my entire post was about how cloud forcing completely overwhelms alleged CO2 forcing…and not one word from you about that. Instead, it’s off to another diversion. Hey, it’s soot-forcing! No idea what the values are, but hey, it was worth a shot since that’s what the blogs say. No? Well, since soot-forcing didn’t work, now let’s try saying that CO2 doesn’t have to heat the oceans, just the 0.1 to 1 mm “thick” surface skin…even though the IPCC has claimed that the 0-700 m layer is warmed by CO2. So are you going to pivot now and claim that indeed CO2 does cause the 0-700 m layer to heat up, or will you continue to claim that the skin layer (which IR cannot penetrate past) is the only factor that counts, as only the skin “has to reach the necessary temperature” to have CO2 dominate the ocean heat content?
Here’s the problem (well, among several others) with this latest attempt to deny the dominance of natural forcing: the heat gradient in the surface skin is only 0.002 K. So your “1.8 W/m² on the entier ocean surface equals 2.05 x 10^22 Joules per year” is completely fabricated. Joules/heat energy applies to the ocean depths beneath the skin, not the heat gradient in the skin itself. And, according to proxy-based (clouds) experimental evidence, the highest temperature change possible across the ocean skin is 0.002 K. This value was found on the RealClimate blog, when using clouds as a proxy for CO2 (since, again, we have no observational evidence that affirms CO2 changes affect ocean heat content, and, if so, how much). It is highly likely that this is all new information for you too. So it’s time to veer off and concoct some other “explanation”.
RealClimate (Dr. Peter Minnett): “There is an associated reduction in the difference between the 5 cm and the skin temperatures. The slope of the relationship is 0.002ºK (W/m2)-1. Of course the range of net infrared forcing caused by changing cloud conditions (~100W/m2) is much greater than that caused by increasing levels of greenhouse gases (e.g. doubling pre-industrial CO2 levels will increase the net forcing by ~4W/m2)
“What’s the additional ocean heat content compared to 1980 levels nowadays? 20 * 10^22 Joules?”
Not measured.. Assumption driven model.
And do big numbers scare and confuse you , sleb ?
perhaps you ought to convert it to a temperature, or something you can actually understand.
At the comment system once again ate my comment …
Kenneth, your comment (IR radiation needing to penetrate the surface in order to warm the ocean) tells me that you don’t understand radiative heat transfer. The energy source (sun) is heating the ocean to a higher temperature when backradiation increases … not the backradiation itself.
About the rest: the Joules calculation is correct and no fabrication. Your believe in large scale variations making small, but steady changes look irrelevant is noted. I’m skeptical about that assumption.
This is just so maddening, communicating with someone who maintains his beliefs in the powers of CO2 with a religious fervor. It’s like trying to communicate with someone who believes in fairies.
SebastianH, you don’t understand radiative heat transfer if you think the constituency of IR back radiation can even remotely compete with variations in the Sun’s energy modulated by albedo (clouds, aerosols) penetrating the ocean depths by 200 meters in determining heat flux variations. AGAIN, WE ARE TALKING ABOUT MAGNITUDES. I understand why you so desperately want it to be, but it’s not an either/or thing here. It’s a magnitude thing here. Modifications in cloud cover and aerosol depth completely overwhelm 0.000001 changes in atmospheric CO2 concentrations in determining ocean temperatures, as modifications in cloud cover and aerosols affect shortwave radiation, which is overwhelmingly what determines variations in OHC. Backradiation isn’t even in the same league in determining heat flux. Notice that scientists don’t even mention CO2 as a factor when discussing the radiative properties affecting ocean heat…
—
http://journals.ametsoc.org/doi/pdf/10.1175/1520-0477%281996%29077%3C0041%3AOOTIRP%3E2.0.CO%3B2
Observations of the Infrared Radiative Properties of the Ocean
“[I]t is necessary to understand the physical variables contributing to sea surface emitted and reflected radiation to space. The emissivity of the ocean surface varies with view angle and sea state, the reflection of sky radiation also depends on view angle and sea state, and the absorption of atmospheric constituents such as water vapor, aerosols, and subdivisible clouds affect transmittance.” [CO2 isn’t mentioned once in the paper.]
—
It’s a fabrication to claim that any joules calculation was determined by 0.000001 variations in atmospheric CO2, as there has never been a scientific experiment that demonstrates 0.000001 changes in atmospheric CO2 concentrations cause heat changes in water. None. It’s hypothetical. It’s a model. It’s never been observed. You have yourself called it a theory. But yet your faith rests upon this “truth” anyway.
And by the way, your claim that your joules calculation is “correct” assumes that our calculations of global ocean heat changes are correct. Even the ARGO data are subject to error bars and uncertainty that is several times greater than the assumed heat change itself. So no, your joules calculation is only “correct” if you decide to believe that we actually know what the global ocean temperatures have been with precision. We don’t.
Kenneth, are you intentionally missunderstanding what I am writing? I always thought my English writing was ok-ish, but your responses make me doubt that.
1) I wrote “if this were the only thing that’s going on” because there is more involved when heating a body of water. Evaporation and radiative heat transfer will eat part of the energy input for example.
2) Have you ever considered that an changes in cloud cover is a feedback mechanism? What is the net forcing of the cloud cover? Hint: it’s not 100 W/m² like you suggested at the end of you comment.
3) 1.8 W/m² applied on the surface of the oceans for a year equals 2.05 x 10^22 Joules … that’s no fabrication, that is simple math.
4) You once more write about IR radiation needing to penetrate the surface in order to warm the ocean. This is not how it works and tells me you really do not understand how radiative heat transfer works. The temperature of a body depends on its energy source and it’s environment. A body can have different temperatures in different environments (e.g. a vacuum and a 20°C warm layer of atmosphere) with the same amount of energy input. Do you agree or disagree with that assumption?
Cloud cover changes can be both a feedback and a forcing, as they affect both shortwave and longwave.
What is the net forcing of cloud cover relative to when? The 100 W m-2 is the range of forcing from clouds — as mentioned by Peter Minnett on the RealClimate blog. I hope you understand what “range” means in this context, but it’s likely that you don’t.
—
http://file.scirp.org/Html/22-4700327_50837.htm
The reduction in total cloud cover of 6.8% [between 1984 – 2009] means that 5.4 Wm−2 (6.8% of 79) is no longer being reflected but acts instead as an extra forcing into the atmosphere… To put this [5.4 Wm-2 of solar radiative forcing via cloud cover reduction between 1984-2009] into context, the IPCC Fifth Assessment Report…states that the total anthropogenic radiative forcing for 2011 relative to 1750 is 2.29 Wm−2 for all greenhouse gases and for carbon dioxide alone is 1.68 Wm−2. The increase in radiative forcing caused by the reduction in total cloud cover over 10 years is therefore more than double the IPCC’s estimated radiative forcing for all greenhouse gases and more than three times greater than the forcing by carbon dioxide alone [from 1750 to present].
—
http://www.sciencemag.org/content/267/5197/499.short
Ship observations and ocean models indicate that heat export from the mixed layer of the western Pacific warm pool is small (<20 watts per square meter). This value was used to deduce the effect of clouds on the net solar radiation at the sea surface. The inferred magnitude of this shortwave cloud forcing was large (≈ – 100 watts per square meter) and exceeded its observed value at the top of the atmosphere by a factor of about 1.5.
—
http://onlinelibrary.wiley.com/doi/10.1029/RG022i002p00177/full
On the variability of the net longwave radiation at the ocean surface
The RTE studies also reveal that LW⇅ variations due to cloudiness effects can be very large. Low clouds can reduce LW⇅ from clear sky values by as much as 70 W/m².
—
ftp://mana.soest.hawaii.edu/pub/rlukas/OCN-MET665/fluxes/radiative/Ohlmann%20etal%20Part%20II%202000%20JPO.pdf
“Results from radiative transfer calculations indicate that in-water solar fluxes can vary by 40 W/m-2 within the upper few meters of the ocean (based on a climatological surface irradiance of 200 W/m-2) and that a significant portion of the variation can be explained by upper ocean chlorophyll concentration, solar zenith angle, and cloud amount (OSM).
—
http://onlinelibrary.wiley.com/doi/10.1029/JC091iC09p10585/abstract
Incoming solar radiation and latent heat flux are the two dominant components that control net surface energy fluxes. Wind speed, cloud cover, and the gradient of specific humidity are the three most important meteorological parameters in determining surface flux. [CO2 not mentioned as a parameter in determining surface flux, or anywhere in the paper.]
—
http://www.pmel.noaa.gov/pubs/outstand/mcph1166/mcph1166.shtml
Shortwave radiation is likely to account for a large percentage of the unexplained temperature variance in the surface layer. Insolation at the equator under clear-sky conditions ranges between about 300 and 350 W/m-2. Using Reed’s [1977] flux formula, changes in cloudiness of only 10% would lead to changes in the net shortwave radiation at the sea surface of about 20 W/m-2. Changes in cloudiness of this magnitude are likely to occur on daily to monthly time scales, given that normally the skies are 60-70% cloud-covered owing to very active deep convection in the western equatorial Pacific.
“In your opinion, how much did solar forcing contribute to the early 20th century warming relative to soot-forcing?”
the soot effect on glaciers (melting faster) is different from the soot effect on climate (cooling).
and soot can both be of natural and human origin.
The best sum up of forcings still is this IPCC graph:
https://static.skepticalscience.com/pics/FigSPM.4.png
Sod9,
Who constructed the IPCC graphs?
Was it the Happy Day Kindergarten?
roflmao..
Those temperature graphs from SkS are absolute NONSENSE.
A total and child-minded FABRICATION, designed only for the most GULLIBLE kool-aiders in the world…..
….. no wonder sob got sucked in.
Their global temp bottom left.. there was NO WARMING from 1980 to 1997 in either satellite record.
https://s19.postimg.org/iwoqwlg1f/UAH_before_El_nino.png
The Global land is even more of a farce.
There was NO warming from 1980 to 1997 either
https://s19.postimg.org/is632i7hv/UAH_land_before_1998_EL_Nino.png
In a study about drought variability in Montana’s Glacier National Park, and other Rocky Mountain locations, the authors showed that GNP’s Sperry Glacier had shrunk dramatically since 1850. But of the shrinkage from 1850 through 2003, 81% of the shrinkage had occurred by 1945. (figure 6D)
https://www.fs.fed.us/psw/cirmount/wkgrps/ecosys_resp/postings/pdf/pederson_etal2006.pdf
History & Geography of Glacier Bay Park
“Glacier Bay was first surveyed in detail in 1794 by a team from the H.M.S. Discovery, captained by George Vancouver. At the time the survey produced showed a mere indentation in the shoreline. That massive glacier was more than 4,000 feet thick in places, up to 20 miles wide, and extended more than 100 miles to the St. Elias mountain range.
By 1879, however, naturalist John Muir discovered that the ice had retreated more than 30 miles forming an actual bay. By 1916, the Grand Pacific Glacier – the main glacier credited with carving the bay – had melted back 60 miles to the head of what is now Tarr Inlet.”
http://www.glacierbay.org/geography.html
If we can just reduce CO2 back to what it was in 1900, we can crush all those people living in the valleys with advancing glaciers.
Actually, it would make no difference to glaciers what so ever
But taking levels back to the dangerously low levels of pre-industrial age would probably cause starvation of 1/4 of the world’s population
The Green agenda, writ large.
Atmospheric and ocean CO₂, with H₂O, provides to ONLY food source for ALL LIFE ON THE PLANET
Current levels need to be pushed higher, certainly not lower.
I think it would be interesting to take a poll. My answers follow each question.
Four questions:
1. Have you ever seen a mountain-valley glacier up close? {Yes.}
2. Have you ever been at the toe/snout of a glacier during melt season? {Yes}
2-a.: What other surface does this remind you of? {For me asphalt.}
3. Have you walked on a glacier? {Yes}
4. What color do you see when looking into a crack in glacial ice? {Blue.}
It might have been earlier than that as well,Zubov noted that the Jacobshavn glacier had receded by 20m (not sure if that is miles or meters)between 1880-1920.Ahlman describes the Spitzebergen glacier retreat as catastrophic. Pages 170-175. http://www.archive.org/stream/arcticice00zubo#page/470/mode/2up
Yes, here are some quick links to the actual graphs from Ahlmann’s comprehensive work. Another Iceland glacier melted 1,100 meters in ~55 years. Most started melting in the 1700s.
https://notrickszone.com/wp-content/uploads/2017/02/Ahlmann-Glaciers-Melting1700s-Severe-Retreat-1900-50-.jpg
https://notrickszone.com/wp-content/uploads/2017/02/Ahlmann-Glaciers-Melting-1700s-Severe-Retreat-1900-1950.jpg
OT..
According to JoNova, Perth has just broken its COLDEST February day since records began around 1900
and not just by a little bit !!!
http://joannenova.com.au/2017/02/climate-change-means-perth-smashes-the-coldest-ever-record-for-february/
Send some over to the east coast, guys !:-)
“According to JoNova, Perth has just broken its COLDEST February day since records began around 19002
yeah. And remember, with UHI problems and station site effects, the real temperature was 10-20°C lower than what the thermometer said.
Perth most likely will hit absolute zero temperature next year, when the AMO turns negative and la nina hits hard.
everyone should prepare to be frozen to death any moment. Perhaps we are lucky here and survive the summer..
Facts yet again, sob.. they REALLY sting you, don’t they.
The only come-back you have is to up the level of your idiocy.
If this keeps on is Greenland going to sink! Or possibly even tip over?
https://www.dmi.dk/en/groenland/maalinger/greenland-ice-sheet-surface-mass-budget/
Greenland just recorded record high temperatures:
http://www.dmi.dk/nyheder/arkiv/nyheder-2017/februar/der-er-lunt-i-arktisk/
Lovely weather they are having….. off you go an enjoy that lovely warm weather. (or remain locked up in your inner city basement with Granny paying the heating bills.)
No comment about the continued FREEZING over Russia where people actually live, hey seb.
Do you understand the difference between a trend and an anomaly, SebastianH?
http://www.sciencedirect.com/science/article/pii/B9780128045886000082
“In the past 500 years, Greenland temperatures have fluctuated back and forth between warming and cooling about 40 times, with changes every 25–30 years. … Comparisons of the intensity and magnitude of past warming and cooling climate changes show that the global warming experienced during the past century pales into insignificance when compared to the magnitude of profound climate reversals over the past 25,000 years. At least three warming events were 20–24 times the magnitude of warming over the past century, and four were 6–9 times the magnitude of warming over the past century.”
Kenneth, please take a look at what is happening right now.
arctic regions are 20°C warmer than the average.
http://www.spiegel.de/wissenschaft/natur/arktis-plusgrade-in-nordpol-naehe-gemessen-a-1133865.html
berlin is colder than parts of the arctic!
There are huge changes coming, please do not ignore them!
Sod, you’re succumbing to another fit of silliness and hysteria. It’s what informed people call “weather”. Perhaps a dose of valium would help with your panic attack.
“Sod, you’re succumbing to another fit of silliness and hysteria. ”
can you please give me the source for your information?
This is temperature so far this year (40 days!)
http://ocean.dmi.dk/arctic/meant80n.uk.php
and the end of the last year looks horrible. Temperature up there are completely out of norm. this is not weather, if you scroll back some years!!
By the end of the week the Arctic will be melting down: https://www.facebook.com/severeweatherEU/videos/vb.1377757209114043/1954980331391725/?type=3&theater
“There are huge changes coming, please do not ignore them! – See more at: http://notrickszone.”
Yep sob, this is the same WEATHER pattern as when the Wisconsin Ice Sheet formed.
Arctic over the Kara sea, a bit warmer than usual, what a blessing that must be in the middle of winter….
….while its FREEZING over northern Russia, Europe, Alaska and Canada, where millions of people live and will suffer hardship.
Extremely warm anomalies and extremely cold anomalies occur routinely over the course of a year. Anomalies are not trends. To be considered “climate”, a trend is said to need to last for decades. Not days, months or even a single year.
For example, global temperatures have plummeted by about -0.7 C within the last year:
http://www.woodfortrees.org/plot/rss/from:2016.1/to:2017/plot/rss/from:2016.1/to:2017/trend
To what do you attribute that abrupt cooling to, sod? What caused it?
How is this for a trend then?
http://sites.uci.edu/zlabe/arctic-temperatures/
Jet stream WEATHER..
Do try to do a little bit of basic research and understanding before you make idiotic comments, sleb.
???
There are multi-year graphs on that page. Open your eyes and turn on your brain before making idiotic comments …
Do some basic research on NATURAL cycles like the AMO, ..or keep showing your child-like ignorance.
Get some basic historical perspective, or forever be a baseless non-entity, as you are in every other subject you have attempted .
Oh yes, I would expect you to locate graphs that start the trend in the 1950s, the beginning of the Arctic’s 30-year cooling trend. I would expect you to just ignore the early 20th century warming that was just as warm or warmer as the 1995-present warming period, which means the 100-year trend yields NO NET WARMING in the Arctic, as seen here:
https://notrickszone.com/wp-content/uploads/2016/11/Arctic-Surface-Temps-Since-1920-copy.jpg
Here’s the Late Holocene trend in Arctic sea ice. Notice how influential anthropogenic CO2 has been.
https://notrickszone.com/wp-content/uploads/2016/11/NTZ-Arctic-Sea-Ice-Late-Holocene-Human-Influence.jpg
Greenland’s long-term cooling trend:
https://notrickszone.com/wp-content/uploads/2016/10/Holocene-Cooling-Greenland-North-Agassiz-Ice-Cap-Lecavalier13-copy.jpg
Here’s the Holocene’s Greenland ice sheet surface mass balance trend. Notice that there is more ice on Greenland now than there has been for nearly all of the last 7,500 years.
https://notrickszone.com/2016/12/15/scientists-greenland-is-now-much-colder-with-more-advanced-ice-sheet-margins-than-90-of-the-last-7500-years/
But yes, I understand why you prefer to cherry-pick graphs that start in the 1950s. Did you think you could trick us, SebastianH?
“Oh yes, I would expect you to locate graphs that start the trend in the 1950s, the beginning of the Arctic’s 30-year cooling trend. ”
we are using the data that we have. Please show us the graphs starting earlier with information over the whole arctic and do not forget to add error bars. This should be simple!
I already have. Many times. Every time I do, you ignore it and restate your beliefs.
Hanhijärvi et al., 2013 (Arctic, North Atlantic)
“According to Chylek et al. (2009), the Arctic warming from 1900 to 1940 proceeded at a significantly faster rate than the warming during the more recent decades and was highly correlated with the Atlantic Multi-decadal Oscillation (AMO) suggesting that the Arctic temperature variability is highly linked to the Atlantic Ocean thermohaline circulation at various temporal scales.”
https://notrickszone.com/wp-content/uploads/2017/02/Holocene-Cooling-Arctic-Hanhijarvi-13.jpg
https://notrickszone.com/wp-content/uploads/2017/02/Holocene-Cooling-Arctic-Atlantic-Hanhijarvi-2013.jpg
http://polarmet.osu.edu/PolarMet/PMGFulldocs/box_yang_jc_2009.pdf
Meteorological station records and regional climate model output are combined to develop a continuous 168-yr (1840–2007) spatial reconstruction of monthly, seasonal, and annual mean Greenland ice sheet near-surface air temperatures. The annual whole ice sheet 1919–32 warming trend is 33% greater in magnitude than the 1994–2007 warming.
OT.. Greenie EnvironMENTALists looking after the environment in their normal fashion
http://www.kfyrtv.com/content/news/Sanitation-crews-work-to-remove-massive-amounts-of-garbage-from-DAPL-protest-camp-before-spring-thaw-412954433.html
your friends, seb, sob. Environmental vandals.
Ha ha ha,
I see that Sod and Sebastian,have no case to maintain their “CO2 did it” delusion. It is hilarious that a trace gas with a trace increase in the air, suddenly become a threat to the world. This mentally ill stuff that warmists push relentlessly,despite the long known utter predictive failures.
Meanwhile Kenneth post a lot of published science papers,highlights relevant passages to make his case,ask reasonable questions.
The replies have been deflection,obfuscation and plain dumb avoidance of the obvious.
This is a main reason why I come here,is to see a rational man (Kenneth) calmly,civilly tear apart shallow,dodging replies with published science that quickly exposes the unconvincing,often religious based replies,from warmist bigots.