Fifteen international scientists recently collaborated to assemble one of the most comprehensive analyses of temperature and ice sheet changes for Greenland and the Canadian Arctic ever produced. Briner et al., (2016) synthesized over 100 records from a large and accumulating database to publish “Holocene climate change in Arctic Canada and Greenland” in the journal Quaternary Science Reviews.
The results are not good news for those who wish to maintain that today’s Greenland Ice Sheet is losing ice area at an unprecedentedly accelerated rate, or that modern temperature values for the Arctic region are dangerously high. Greenland’s Ice Sheet has a larger ice extent now than it has had for most of the last 7,500 years; only the Little Ice Age period (~1300-1900 A.D.) had more ice mass. And both regions (Canadian Arctic and Greenland) are still 1 to 2°C colder now than they were just a few thousand years ago.
The Greenland Ice Sheet Is Now At Nearly Its Highest Extent In The Last 7,500 Years
In the climate alarmism world, the Greenland Ice Sheet has been cooperating with the ice-is-melting-faster-than-ever paradigm for decades. For headline-creators who warn of “ominous” and “catastrophic” rates of change — and how humans are to blame for most of it — the Greenland Ice Sheet has been losing mass at “unprecedented” rates since the 1990s. For example: The Greenland Ice Sheet is losing 110 million Olympic size swimming pools worth of water each year. … ‘The Arctic Is Unraveling,’ Scientists Conclude After Latest Sobering Climate Report – Unprecedented warming has sent the Arctic into uncharted territory, says latest NOAA report … Alert! Greenland’s Ice Now Melting At Catastrophic Speed
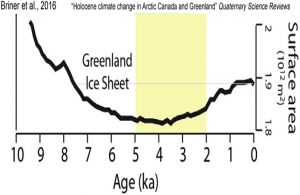
But what does “unprecedented” actually mean with regard to ice loss or temperature change in the Arctic? Effectively, precedence only extends back to the beginning of the 20th Century in most cases. Some may only extend precedence back to the 1961-1990 period, which is the baseline for nearly all surface mass balance estimates. So ice is said to be melting faster than any time since 1900, or since 1961-1990. But consider that in 1900, with centuries of solar minima and large-scale volcanic eruptions leading to plummeting Little Ice Age temperatures, the Greenland Ice Sheet had accumulated more ice and expanded its margins more than at any time in the last 7,500 years. And as the 15 scientists contributing to Briner et al. (2016) reveal in this encapsulating graph from the paper, the Greenland Ice Sheet’s surface area has only negligibly retreated from that high point (~1900). Today’s ice sheet extent is still among the highest of the Holocene.
Briner et al., 2016 “The Greenland Ice Sheet retracted to its minimum extent between 5 and 3 ka [5,000 and 3,000 years ago], consistent with many sites from around Greenland depicting a switch from warm to cool conditions around that time.”
Taking a closer look at what this graph depicts, we first of all can clearly see that Greenland’s ice sheet reached its much-lower-than-now minimum extent between 6,000 and 2,000 years ago, with the absolute lowest levels between 5,000 and 3,000 years ago. This millennial-scale ice sheet recession took place at a time when an anthropogenic influence was non-existent, and when CO2 levels were safely in the range of 260 ppm – about 140 ppm lower than today’s levels (400 ppm).
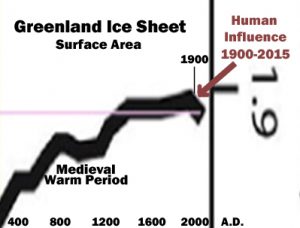
And as mentioned above, it is also clearly discernible that the modern Greenland Ice Sheet extent has not only not fallen outside the range of natural variability, it barely even falls below the coldest centennial-scale periods of the last 10,000 years (the Little Ice Age). Here is a much closer look (with annotations) at the last ~1,500 years of Greenland Ice Sheet area changes as shown in Briner et al. (2016):
Greenland and Canadian Arctic Temperatures Were 2°C Warmer Than Now For Most Of The Last 10,000 Years
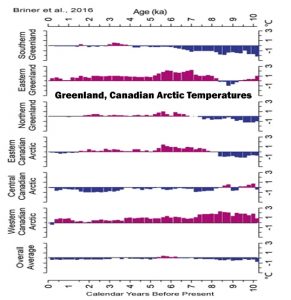
Not only did Greenland’s ice sheet margins experience far greater retreat and higher melt rates during most of the last 7,500 years, but Greenland’s (and the Canadian Arctic’s) temperatures were also much warmer than today’s during the Holocene too. Below are some of the summarizing comments from Briner et al. (2016) describing the temperature changes for this region. Again, these much warmer temperatures occurred while CO2 levels were in the 260 ppm range.
“The temperature decrease from the warmest to the coolest portions of the Holocene is 3.0 ± 1.0 °C on average (n = 11 sites). … The temperature record, which integrates all seasons, shows rapid warming from the onset of the Holocene until ~9.5 ka [9,500 years ago], relatively uniform temperature at the millennial scale until ~7 ka [7,000 years ago], followed by ~3.5 °C temperature decline to the Little Ice Age [1300-1900 C.E.], followed by ~1.5 °C warming to today. [Today’s Greenland Ice Sheet temperatures are 2.0 °C colder than the Early and Middle Holocene] . The record also shows centennial-scale variability on the order of 1-2 °C, and a ~3 °C temperature oscillation during the 8.2 ka event.”
“Reconstruction results [Canadian Arctic] showed that summers warmer than today (~1 to 2 °C) prevailed prior to 4-3 ka [4,000 to 3,000 years ago]. … At Qipisarqo Lake [Greenland], pollen data indicate a sharp increase in July air temperature of 3-4 °C at 7.5-7.0 ka [7,500 to 7,000 years ago] and higher temperatures until 5.5-5.0 ka [5,500 to 5,000 years ago]. After 5 ka [5,000 years ago], a progressive cooling of 1-2 °C is inferred.”
Another synopsized graph from the paper depicting the temperature changes for each region of Greenland and the Canadian Arctic yields a clear and decisive verdict: modern Arctic-region temperature changes are not unusual or unprecedented.
Other New Papers Confirm That Modern Temperatures, Ice Loss Not At All Unusual For the Arctic Region
In the last few decades, the interior of the Greenland Ice Sheet has been melting at a slower rate than it did for 95% of the last 9,000 years according to scientists publishing in the journal Science. This finding is similar to the aforementioned conclusion that the ice extent for the Greenland Ice Sheet is now higher than it was for more than 90% of the last 7,500 years, rendering recent “losses” relatively insignificant and well within the range of natural variability.
MacGregor et al., 2016 [press release] (Greenland Ice Sheet)
“[I]ce flow in its [the Greenland Ice Sheet’s] interior is slower now than the average speed over the past nine millennia.”
“[T]he interior of the GrIS [Greenland Ice Sheet] is flowing 95% slower now than it was on average during the Holocene [the last 9,000 years].”
—
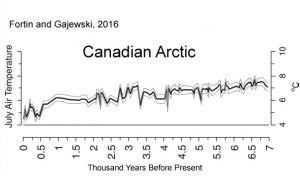
Fortin and Gajewski (2016) find that the central Canadian Arctic has not warmed in the last 150 years, and that the region was 3°C warmer than now just a few thousand years ago.
Fortin and Gajewski, 2016 (Canadian Arctic)
“A study of chironomid remains in the sediments of Lake JR01 on the “Boothia Peninsula in the central Canadian Arctic provides a high-resolution record of mean July air temperatures for the last 6.9 ka …. Biological production decreased again at ~ 2 ka and the rate of cooling increased in the past 2 ka, with coolest temperatures occurring between 0.46 and 0.36 ka [460 and 360 years ago], coinciding with the Little Ice Age. Although biological production increased in the last 150 yr, the reconstructed temperatures do not indicate a warming during this time. … Modern inferred temperatures based on both pollen and chironomids are up to 3°C cooler than those inferred for the mid-Holocene.”
—
Spolaor et al., 2016 [press release] (Arctic Ocean, Region)
“Researchers have found that 8000 years ago the Arctic climate was 2 to 3 degrees warmer than now, and that there was also less summertime Arctic sea ice than today.”
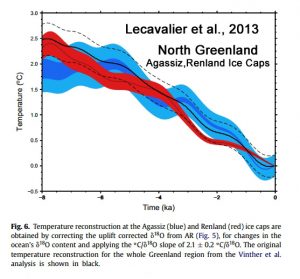
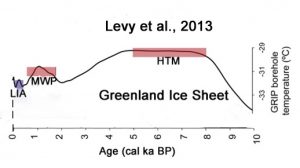
Other Recent Reconstructions Of Greenland, Canadian Arctic Climate Also Do Not Indicate ‘Unprecedented’ Modern Changes
Lecavalier et al., 2013 (North Greenland)
Levy et al., 2013 (Greenland Ice Sheet)
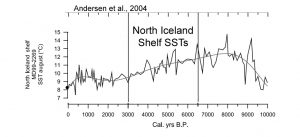
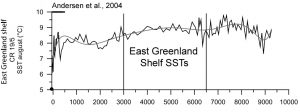
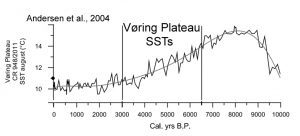
Andersen et al., 2004 (North Iceland Shelf, East Greenland, Vøring Plateau SSTs)
“Our results show that the Nordic Seas circulation system is highly sensitive to the large-scale insolation [surface solar radiation] changes as the general Holocene climate development follows closely the Northern Hemisphere insolation. … Century-scale surface current variability for the Holocene is shown to be 1 – 1.5°C for the Vøring Plateau and East Greenland shelf, and 2.5– 3°C on the North Ice-land shelf. … The first cooling [East Greenland Shelf SSTs] from 2400 to 2000 cal years BP was introduced by a 1.5°C temperature drop starting at 3000 cal years BP which culminated in an SST low around 2100 cal years BP. The second cooling occurred around 300 cal years BP and preceded a rapid warming [during the 1700s A.D.] , where SSTs rose with more than 1.5°C within 70 years. The third cooling took place in the second half of the last century. Until the last three centuries, SST variability atthis site has been 1°C, while SSTs varied with amplitudes of 1.5– 2°C during the last 300 years.”
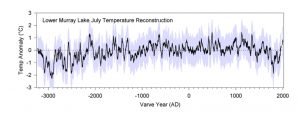
Cook et al., 2009 (Canadian Arctic)
Remember The Larger Context For Claims Of ‘Unprecedented’ Arctic Change
Geologist Dr. Don Easterbrook offers a cogent summarizing perspective on the modern levels of relative Arctic quiescence.
“In the past 500 years, Greenland temperatures have fluctuated back and forth between warming and cooling about 40 times, with changes every 25–30 years. … Comparisons of the intensity and magnitude of past warming and cooling climate changes show that the global warming experienced during the past century pales into insignificance when compared to the magnitude of profound climate reversals over the past 25,000 years. At least three warming events were 20–24 times the magnitude of warming over the past century, and four were 6–9 times the magnitude of warming over the past century.”
So the next time we read a headline that uses words like dangerous and catastrophic and unprecedented to refer to Arctic temperatures or ice mass losses, let’s remember that the far larger context strongly suggests that modern changes in the Arctic are comparatively minor, even negligible.


So the obvious take away is that there is even more ice available to unprecedentedly and catastrophically melt than was originally thought!
This seems like good – back to basics – science.
Thanks for presenting it.
Wladimir Köppen (and later with Rudolf Geiger) began drawing boundaries of “climates” using vegetation** as integrators of the patterns, such as warm/dry summer with cool/moist winter. When instruments for measuring temperature and precipitation became widespread these sorts of data were used. It is easier but not necessarily better.
The introduction of a “global temperature = climate” was a catastrophe with regard to climate science.
**like this: https://www.na.fs.fed.us/pubs/silvics_manual/volume_2/sabal/palmetto.htm
~~~~~~~
Meanwhile (just an anecdote), ‘green’ Portland, Oregon and the local area was all tangled in global warming yesterday. Icy roads and about 8 cm. of snow caused accidents and abandoned autos. Natives blame the poor driving skills of imported Californians.
Thanks for sharing, Pierre. It is stunning that the MSM somehow overlooks such studies. Not sufficiently dire to garner the attention of the Chicken Littles which reside in the editorial offices, it would appear.
Of course, they are faithfully reporting “the science” you see. No hit of confirmation bias.
But where are Sod and David Appell: don’t they have their usual rebuttal, er, diatribe ready to “debunk the deniers”?
Merry Christmas and Happy New Year – may the winter bring plenty of snow!
Mister Appell usually arrives here at about 4.00 AM, which may have to do with his bladder. If he arrives at 16 December early in the morning, he will work from bottom to top, i.e. start with debunking your comment, Kurt. Next he will do the former post about Trump also from bottom to top. If he is ready, he usually does not return for comments on his production. Also Merry Christmas to you.
This text went into moderation and Appell’s products also as they were not visible at 2.37 AM. At 2.00 AM Appell was here and at 2.14 AM he paid a visit to Trump. My prediction was quite accurate for the behavioral domain.
We need “sod” and “David Appell”. Without them this fine blog might become an echo chamber like “Skeptical Science” or “RealClimate”.
Totally agree. Would really like to have more believers in catastrophic climate change here.
Just for the laughs 🙂
And please…
send someone that actually knows something…..
…. other than the usual propaganda pap.
Greenland is now losing about 250 Gt of ice/year, regardless of anything it did in the past.
That’s a great deal of ice, contributing to sea level rise.
You should probably familiarize yourself with the recent Arctic report cards. Over the last 3 years, the mass loss has rapidly decelerated from the 2002-2015 average (238 Gt/yr) to an average of -127 Gt/yr per year on average. That’s a recent rate of sea level contribution of about 3.5 cm (a little over an inch) per century from the Greenland Ice Sheet. Can I assume you find that rate of sea level contribution alarming? If not, when do you think that rate of contribution will become catastrophic?
—
2013-’14: -6 Gt
2014-’15: -186 Gt
2015-’16: -191 Gt
—
Average rate of yearly loss for the most recent 3 years: -127 Gt, a 47% deceleration from the average of -238 Gt for the 2002-2015 period.
—
https://epic.awi.de/37384/1/ArcticReportCard_full_report.pdf
“A negligible ice mass loss of 6 Gt between June 2013 and June 2014, in contrast to the largest annual loss (474 Gt) observed in the GRACE record in 2012, indicates a slowing of the rate of ice loss.”
—
https://academiccommons.columbia.edu/catalog/ac:196257
“Ice mass loss of 186 Gt over the entire ice sheet between April 2014 and April 2015 was 22% below the average mass loss of 238 Gt for the 2002- 2015 period”
“The net area loss from marine-terminating glaciers during 2014-2015 was 16.5 km². This was the lowest annual net area loss of the period of observations (1999-2015) and 7.7 times lower than the annual average area change trend of -127 km².”
—
ftp://ftp.oar.noaa.gov/arctic/documents/ArcticReportCard_full_report2016.pdf
“Between April 2015 and April 2016 (the most recent period of available data) there was a net ice melt loss of 191 Gt.”
“regardless of anything it did in the past.”
Why don’t you care about what the GIS did in the past? Is it because you know that natural ice sheet melting rates were several times larger than today’s rates, even though CO2 concentrations were much lower and didn’t fluctuate during those rapid changes? Yes, I think that’s exactly why you’d prefer not to consider long-term contexts.
What a load of pitiful BS!
While the IPCC is a dubious source of data their latest report (AR5) says that the GLOBAL continental ice sheet is diminishing at a rate of 270 Giga-tonnes per year.
That may sound pretty scary if you don’t know what the global “Ice Inventory” is. Currently there is 30,000,000 Giga-tonnes of continental ice so at the present rate of melting it will take more than 10,000 years to melt all the ice.
I hope the ice will all melt so that we can enjoy a balmy climate as in the “Thermal Optimum” fifty million years ago:
https://en.wikipedia.org/wiki/Paleocene%E2%80%93Eocene_Thermal_Maximum#/media/File:65_Myr_Climate_Change.png
Much more likely another glaciation will kick in and destroy habitats on a vast scale. In that case less than one animal in 20 will survive.
“Greenland is now losing about 250 Gt of ice/year,”
RUBBISH !!
Yes, David Appell, Greenland IS losing ice, …if you report gain as “loss.”
https://stevengoddard.wordpress.com/2015/07/18/85-of-the-greenland-ice-sheet-has-gained-mass-since-september/
Measured by Grace, which was proven massively WRONG over the Antarctic
Now do you know why GRACE is useless for ice mass over Antarctica or Arctic ?
Bet you have no clue whatsoever, rotten-appell.
Appell, is this really the only comment you have concerning the science publications references in this post? Science denier are you?
Yes, most of those of his ilk think that by using a word like “gigatonnes” (Gt) and applying it to ice mass loss in Greenland, they have effectively ended all discussion. Others say things like…
http://www.slate.com/blogs/bad_astronomy/2015/09/03/ice_loss_greenland_and_antarctica_lost_5_trillion_tons_since_1992.html
“5 Trillion Tons of Ice Lost Since 2002”
“Five. Trillion. Tons. That’s beyond staggering; that’s almost incomprehensible. It’s a volume of about 5,700 cubic kilometers, a cube of ice nearly 18 kilometers—more than 11 miles—on a side. Place that cube on the ground, and the top of it would be above 90 percent of the Earth’s atmosphere, reaching twice the height of Mount Everest.”
Little do they realize that they’re talking to people who understand that the amount of ice “lost” in the last few decades contribute to sea level rise at a rate of about 1 or 2 inches per century. That’s what “5 Trillion Tons” actually means.
We skeptics just aren’t impressed by their hyperbolic terms.
As I just read elsewhere, that is .0007% of the total mass of Greenland ice.
Big deal.
See my graph just below. 🙂
“That’s a great deal of ice, contributing to sea level rise.” – David (the irrelevant) Appell
Which is why the sea level rise is no different than it has been for over a century.
http://www.c3headlines.com/sea-levels.html
Thank you again, David A., for you ever useless and irrelevant filler.
Just for fun, here is an approximate graph of the TOTAL GREENLAND ICE MASS from 1979 to 2015
Feel free to correct it if you have a better approximation and can graph it using a zeroed vertical scale.
https://s19.postimg.org/miw84hsab/Greenland_ice_mass.png
That’s odd..
Where is one of the trolls correcting my graph?
Or is it that they KNOW its correct.
[…] https://notrickszone.com/2016/12/15/scientists-greenland-is-now-much-colder-with-more-advanced-ice-sh… […]
Curious – why would they suggest – in the graphic – that the human influence is from 1900 to 2015 (present)? Is not the consensus of the “A” climate change community that the human footprint on GW does not become observable/measurable until somewhere between 1950 and the 1970’s?
Regardless – great [facts] report to have around.
Actually, the 1920s to 1930s GIS melt was comparable to, if not greater, than the 1990s-to-present melt rate. And the 1920s to 1930s GIS melt occurred while CO2 emissions rates weren’t rising and instead were about 1/10th of what they are now. The 1900 to 2015 “human influence” period includes about 50 years of cooling (between 1940-1995), which included the period when CO2 emissions rates increased by a factor of 6. In other words, the Greenland ice sheet (and its surface mass balance) has undergone an oscillation, not a linear warming trend, since 1900, and the trend does not correlate well with CO2 emissions rates (50 years of cooling while CO2 emissions were rapidly rising).
https://notrickszone.com/2016/10/24/defying-climate-models-greenland-cooled-by-1-5c-during-1940-1995-as-human-co2-emissions-rates-rose-600/
http://polarmet.osu.edu/PolarMet/PMGFulldocs/box_yang_jc_2009.pdf
Meteorological station records and regional climate model output are combined to develop a continuous 168-yr (1840–2007) spatial reconstruction of monthly, seasonal, and annual mean Greenland ice sheet near-surface air temperatures. The annual whole ice sheet 1919–32 warming trend is 33% greater in magnitude than the 1994–2007 warming.
http://www.the-cryosphere.net/2/117/2008/tc-2-117-2008.pdf
These estimates show that the high surface mass loss rates of recent years are not unprecedented in the GrIS [Greenland Ice Sheet] history of the last hundred years. The minimum SMB rate seems to have occurred earlier in the 1930s and corresponds to a zero SMB rate….The results show that the GrIS surface mass loss in the 1930s is likely to have been more significant than currently due to a combination of very warm and dry years. It is also noted from our results that a mere ten years would be enough to pass from a GrIS growth state to a significant mass-loss state. Therefore, the SMB changes that are currently occurring, and which are linked to global warming (Fettweis, 2007; Hanna et al., 2008) are not exceptional in the GrIS history.
The’wild jetstream’ period now in force has been sending Atlantic air over SW Greenland, moist air, dumping vast amounts of snow on the GISheet. As Caleb said, a fine way to shed heat to space from 10,000ft plus…. Very interesting times, but not always pleasant.