Scientists: Temperature Data Contamination
Accounts For 33% – 75% Of Modern Warming
Urban heat from paved roads, buildings, and machinery can artificially inflate temperatures substantially above measured temperatures from non-urban areas. This introduces a significant non-climatic warming bias into long-term records.
Heat from an urban (or highly populated) environment can artificially raise temperatures by as much as 3°C to 10°C relative to nearby rural locations. This is true even for villages in the Arctic.
Imhoff et al., 2010 On a yearly average, urban areas are substantially warmer than the non-urban fringe by 2.9°C
This article presents the results of a study of the urban heat island (UHI) in the city of Apatity [Russian Arctic] during winter that were obtained according to the data of field meteorological measurements and satellite images. Calculations of the surface layer temperature have been made based on the surface temperature data obtained from satellite images. … As a result of the analysis of temperature fields, an intensive heat island (up to 3.2°C) has been identified
Kim, 1992 The results indicate that urban heating is attributable to a large excess in heat from the rapidly heating urban surfaces consisting of buildings, asphalt, bare-soil and short grasses. In summer, the symptoms of diurnal heating begin to appear by mid-morning and can be about 10°C warmer than nearby woodlands.
Artificial Warming From Urban Bias A ‘Substantial Portion’ Of Overall Global Trend
Scientists were at one time concerned that artificial warming biases from expanding urbanization might contaminate the measured surface temperature record.
As recently as the late 1980s it was concluded that the “artificial warming” from urban heat could add an extraneous 0.1°C to 0.4°C of warming per decade in some regions, and that the non-climatic warming attributed to urbanization exceeds the observed overall long-term trends after the 1950s. In other words, a substantial portion of the warming since the mid-20th century could be attributed to artificial heat.
Karl and Quayle, 1988 Karl et al., 1988) has shown that at some ‘sun belt’ cities in the West, the rise of temperature that can be attributed to the urban heat island is as much as 0.3 to 0.4°C per decade. In the East, the rise is over 0.1°C per decade. … The artificial warming in the primary station network, relative to the climate division data, is nearly 0.17°C over the past 34 years [1950s]. Such trends are at least as large as any of the observed trends over the United States (Karl, 1988) or the globe (Jones and Wigley, 1987).
Karl and Jones, 1989 Results indicate that in the United States the two global land-based temperature data sets have an urban bias between +0.1°C and +0.4°C over the twentieth century (1901-84). … The magnitude of this urban bias in two global, land-based data sets was found to be a substantial portion of the overall trend of global and regional temperatures.
Modern Temps Rising 0.05°C – 0.12°C/Decade…Urban Heat Bias Rising Faster
The IPCC considers the year 1750 as the starting point for the radiative anthropogenic influence on climate, due principally to fossil fuel burning and concomitant CO2 emissions. Since 1850, CO2 concentrations have risen from 285 ppm to 400 ppm. During these ~165 years, the IPCC has concluded that surface temperatures have warmed by 0.78°C. This is a warming rate of only 0.05°C per decade for 1850-2012 — which happens to be the same rate of warming over the 1998-2012 period. Temperatures are rising at a rate of 0.12°C per decade during 1951-2012.
IPCC AR5 (2013): The globally averaged combined land and ocean surface temperature data as calculated by a linear trend, show a warming of 0.85°C over the period 1880 to 2012, when multiple independently produced datasets exist. The total increase between the average of the 1850–1900 period and the 2003–2012 period is 0.78 °C, based on the single longest dataset available 4 (see Figure SPM.1). … [T]he rate of warming over the past 15 years (1998–2012; 0.05 °C per decade), which begins with a strong El Niño, is smaller than the rate calculated since 1951 (1951–2012; 0.12 °C per decade).
As suggested above, (a) non-climatic urban heating may artificially add 0.1°C per decade (or more) to the temperature record; (b) the overall surface temperature record is only rising at a rate of +0.05°C to +0.12°C per decade; therefore, (c) this would imply that all or nearly all the warming since 1850 or 1950 may be attributed to rapidly expanding urbanization and measurement bias, not climate change.
4 New Papers Highlight Artificial Warming Bias, Adjustments
Four new studies can be added to a large collection of scientific papers documenting an accelerating artificial warming bias.
1. Urbanization Adds +0.13°C Per Decade To Temp Record
Liao et al., 2017 We examine the urban effect on surface warming in Eastern China, where a substantial portion of the land area has undergone rapid urbanization in the last few decades. Daily surface air temperature records during the period 1971–2010 at 277 meteorological stations are used to investigate temperature changes. Owing to urban expansion, some of the stations formerly located in rural areas are becoming increasingly influenced by urban environments. To estimate the effect of this urbanization on observed surface warming, the stations are dynamically classified into urban and rural types based on the land use data for four periods, i.e. 1980, 1990, 2000 and 2010. After eliminating the temperature trend bias induced by time-varying latitudinal distributions of urban and rural stations, the estimated urban-induced trends in the daily minimum and mean temperature are 0.167 and 0.085 °C decade−1, accounting for 33.6 and 22.4% of total surface warming, respectively. The temperature difference between urban and rural stations indicates that urban heat island intensity has dramatically increased owing to rapid urbanization, and is highly correlated with the difference in fractional coverage of artificial surfaces between these two types of stations. This study highlights the importance of dynamic station classification in estimating the contribution of urbanization to long-term surface warming over large areas.
2. ‘Very Likely’ GISS Artificial Warming Bias Of 0.65°C/Century (Globe)
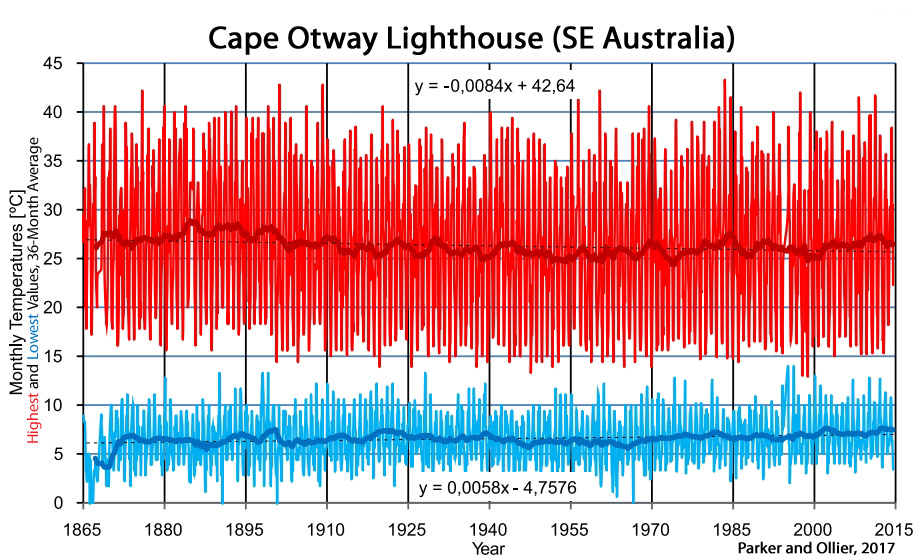
Parker and Ollier, 2017 The global reconstructions as GISS (Hansen et al. 2010, GISTEMP Team 2017) are artificially biased upwards to reproduce the carbon dioxide emission trend, but the strong natural oscillation signal prevails. The very likely overrated warming rate since 1880 is 0.00654°C/year or 0.654°C/century. This rate increases to 0.00851°C/year or 0.851°C/century by considering the data only since 1910. The warming rate cleared of the oscillations is about constant since the 1940s.
As there is no way to perform a better measurement going back in the past, there is no legitimate way to correct recorded data of the past. Therefore, we should stick to the raw data.
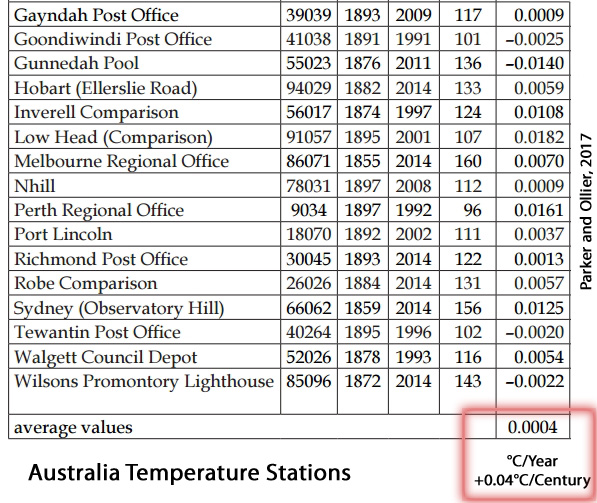
2. Australia Has ‘Warmed’ By 0.04°C Since 1800s…BOM Artificially Inflated Temps
Parker and Ollier, 2017 (Continued) Table 1 presents the warming trend for the 30 longest temperature records of Australia collected in a single location, with measurements started before 1900 and continued until after 1985. … In the 30 locations, the monthly mean maximum temperature is warming 0.0004°C/year, or 0.04°C/century. That means there is no change within the limits of accuracy of the measurements.
A definitive statement about the BOM procedure is provided by Parker (2016). The Global Historical Climatology Network (GHCN) v2 temperature time series (GISS Surface Temperature Analysis, 2012) in Alice Spring and all the 36 other stations located in a circle of 1,000 km from Alice Springs do not show any warming.

There are stations covering different time windows having very close patterns of temperatures. In this circle of 3,141,593 km2 (roughly 50% of Australia) that is mostly underdeveloped, none of the stations […] actually has a warming trend. … It is therefore only an artefact by BOM to produce the warming. Homogenization is supposed to be used to account for upwards biases such as Urban Heat Island, not to introduce upwards biases.
As noticed by Parker (2015a), the ACORN adjustments of Australian temperatures are in the wrong direction, inevitably in the direction to produce a warming much larger than the legitimate. In the centre of Australia, all the stations available in a circle of radius 1,000 km were showing very little or no warming, as still acknowledged in the GHCN v2 data set up to October 2011 (Fig. 6). To move from a scattered population of stations with unequal time coverage and many missing data but both uniformly not warming to produce the largest warming trend for Australia as depicted by the BOM it only requires many administrative corrections and the development of an ad-hoc procedure to compute spatial trends.
We should also consider the role of the Bureau of Meteorology. The climate trend maps compiled by Bureau of Meteorology in their climate change section are completely unreliable, as the alleged increasing temperature is obtained by lowering temperatures of the past by “adjustments”.
The longest of the Australian temperature records that were considered the most reliable by Bureau of Meteorology on February 2009 (BOM 2009) are still available as raw temperatures in the climate data online section and consistently show no warming and no increased extreme events within the limit of accuracy of measurements.
3. Moving Stations, ‘Adjustment’ Bias Adds +0.47°C To Temp Record Since 1800s
Dienst et al., 2017 We here assess these influences and demonstrate that even in villages urban heat island biases might affect the temperature readings. … Due to the station movement from the village centre to the outskirts, the net correction results in an additional warming trend over the past 155 years. The trend increase is most substantial for minimum temperatures (+0.03 °C /10 years−1) [+0.47°C over 155 years] . … An increase in trend is even more severe if the 20th century is regarded exclusively, displaying a rise in annual mean temperature trend by +0.03 °C /10 years−1 and +0.07 °C /10 years−1 in annual minimum temperatures, respectively. … The adjustment of the Haparanda station record results in an increased warming trend.
4. Rapidly Increasing Urbanization To Add 2.4°C To Temps By 2100
Levermore et al., 2017 The urban heat island intensity in Manchester has a highly significant rising trend which by the end of the century could add 2.4 K to the average annual urban temperature, on top of the predicted climate change increase. An analysis of the urban morphology showed that the urban site had indeed become more urban over 9 years of the study, losing green spaces which mitigate against the UHII [urban heat island intensity].
Below are several more scientific papers supporting the conclusion that a substantial portion of modern warming can be traced to urbanization, bias, and measurement contamination.
‘Data Contamination’ Accounts For ~50% Of Warming During 1980-2002
McKitrick and Michaels, 2007 [E]xtraneous (nonclimatic) signals contaminate gridded climate data. The patterns of contamination are detectable in both rich and poor countries and are relatively stronger in countries where real income is growing. We apply a battery of model specification tests to rule out spurious correlations and endogeneity bias. We conclude that the data contamination likely leads to an overstatement of actual trends over land. Using the regression model to filter the extraneous, nonclimatic effects reduces the estimated 1980–2002 global average temperature trend over land by about half.
Urbanization Accounts For 65-80% Of Warming Trend Since 1960s
Ren et al., 2007 The annual urban warming at the city stations can account for about 65∼80% of the overall warming in 1961∼2000, and about 40∼61% of the overall warming in 1981∼2000.
Urbanization Adds 0.2 °C/Decade, Half Of Athens’ Warming Since 1970
Founda et al., 2015 Highlights: UHI [the Urban Heat Island effect] accounts for almost half of Athens’ warming.
The study explores the interdecadal and seasonal variability of the urban heat island (UHI) intensity in the city of Athens. Daily air temperature data from a set of urban and surrounding non urban stations over the period 1970–2004 were used. Nighttime and daytime heat island revealed different characteristics as regards the mean amplitude, seasonal variability and temporal variation and trends. The difference of the annual mean air temperature between urban and rural stations exhibited a progressive statistically significant increase over the studied period, with rates equal to +0.2 °C/decade. A gradual and constant increase of the daytime UHI intensity was detected, in contrast to the nighttime UHI intensity which increases only in summer, after the mid 1980s.
A+217 to +562% Artificial Warming Detected In Western U.S. Due To ‘Artifacts’
Oyler et al., 2015 Artificial Amplification of Warming Trends …Western United States Observations from the main mountain climate station network in the western United States (US) suggest that higher elevations are warming faster than lower elevations. This has led to the assumption that elevation-dependent warming is prevalent throughout the region with impacts to water resources and ecosystem services. Here, we critically evaluate this network’s temperature observations and show that extreme warming observed at higher elevations is the result of systematic artifacts and not climatic conditions. With artifacts removed, the network’s 1991–2012 minimum temperature trend decreases from +1.16 °C decade−1 to +0.106 °C decade−1 and is statistically indistinguishable from lower elevation trends. Moreover, longer-term widely used gridded climate products propagate the spurious temperature trend, thereby amplifying 1981–2012 western US elevation-dependent warming by +217 to +562%. In the context of a warming climate, this artificial amplification of mountain climate trends has likely compromised our ability to accurately attribute climate change impacts across the mountainous western US.
‘Half Or More’ Of Recent Warming Due To Urban Growth
Hughs and Balling, 1996 The long-term mean annual temperature record (1885 –1993) shows warming over the past century, with much of the warming occurring in the most recent three decades. However, our analyses show that half or more of this recent warming may be related to urban growth, and not to any widespread regional temperature increase.
24% – 44% Of Overall Warming Due To Urbanization
Yang et al., 2011 [R]apid urbanization has a significant influence on surface warming over east China. Overall, UHI [urban heat island] effects contribute 24.2% to regional average warming trends. The strongest effect of urbanization on annual mean surface air temperature trends occurs over the metropolis and large city stations, with corresponding contributions of about 44% and 35% to total warming, respectively. The UHI trends are 0.398°C and 0.26°C decade−1. The most substantial UHI effect occurred after the early 2000s, implying a significant effect of rapid urbanization on surface air temperature change during this period.
Long-Term New Zealand-Wide Temps Artificially Inflated By Factor Of 3


I suspect that data contamination (by which I include not only homogenisation/adjustments, but also station moves, the change in distribution of stations away from rural to more urban, and to include ever more airport locations etc) together with natural multi-decadal variation accounts for all the apparent warming.
I suspect that if we were to select say 150 of the prime stations in the Northern Hemisphere (ie., those best sited with no nearby change in land use/encroachment of urbanisation, and with no station moves and the best practices and procedures) and if we were to retrofit these with the same LIG thermometers as used by the station in question back in the 1930s/1940s and then observe measurements in accordance with the same practice and procedure at the station in question (ie., same TOB for that station) then (on a comparison of RAW data to RAW data with no adjustments)there would be no significant increase in temperature over and above that measured by the station in question in the late 1930s/early 1940s.
In my opinion, it is no coincidence that the country where we have the most complete data and observations, the contiguous US, it shows no warming from the highs of the 1930s/1940s (in fact it suggest that there has been slight cooling since that time). There is no reason why given that CO2 is a well mixed gas at high altitude (ie., +/- 10 000m on ~395 ppm), the US should be an outlier and not typical of the Northern Hemisphere as a whole.
this is particularly materially since about 95% of all manmade CO2 emissions have taken place since about 1940, and I suspect that there has been no significant change in the Northern hemisphere since that time suggesting that Climate Sensitivity to CO2 is zero, or close thereto.
As Phil Jones stated in the Climategate emails, we have no real data on the Southern Hemisphere and SH temperatures are large made up, and Hansen in his 1981 paper accepted what PHil Jones said on the sparsity of SH data, we simply do not have the data to know what if any change has taken place in the SH (or for that matter global). We only have worthwhile data on the Northern Hemisphere and we know that the contiguous US, Iceland and Greenland all show the 1930s/1940s as being the same temperature as today.
Your suspicions are correct. Temp stations are poorly sited.
https://wattsupwiththat.com/2015/12/17/press-release-agu15-the-quality-of-temperature-station-siting-matters-for-temperature-trends/
Here’s their website.
http://www.surfacestations.org/
Oops. I see that BobW in NC 24. July 2017 at 4:17 PM has already posted the surfacestations link below.
And ocean temperature coverage was virtually NON-EXISTENT before 2003.
https://s19.postimg.org/46xcg7377/figure-42.png
Which makes a total nonsense of Ocean Heat Content graphs such as Levitus et al.
You are absolutely right. The biggest problem in this science is the data, its poor quality, its sparsity and the way that it has been handled,
I have spent about 30 years studying ship’s data. and the problem is twofold. First, ship’s data is extremely unreliable. Second, the shipping routes cover a very narrow band of ocean.
On commercial ships I have seen the engine log book, the deck log book, the noon day report to charterers, the noon day report to owners, the reoports to weather routing agencies and the Chief engineer’s diary/personal notebook, all recording different data for the same momeent in time! Which one of these 6 records has the correct details? Perhaps none of them!!!
Further, there are wide error margins on ship’s data and sometimes commercial reasons why ship’s data is not recorded correctly.
This is one reason why there is no worthwhile information on the Southern Hemisphere which is largely ocean.
The idea that we have any global thermometer details prior to ARGO is farcical. Even today, the lamd area of the Southern Hemisphere is sparsely sampled.
Either one should look solely at the Northern Hemisphere, or one is left with the satellite data but unfortunately this goes back only to 1979, whereas it would be more interesting if it covered the highs of the 1930s/1940s.
Richard Keen discusses the paucity of data, as well as it’s distortion by adjustments, here.
https://www.google.com/url?sa=t&rct=j&q=&esrc=s&source=web&cd=1&cad=rja&uact=8&ved=0ahUKEwjHwujvvqPVAhUGWD4KHeizAyAQtwIIJjAA&url=https%3A%2F%2Fwww.youtube.com%2Fwatch%3Fv%3DGmc5w2I-FCA&usg=AFQjCNExLAstYYpoc9nEjytphMg9mDRXzA
Do you have any papers on the ship measurements, and what’s wrong with them (i.e., quantitatively)?
Also, I read a while back that they were distancing themselves from the ARGO data, because it wasn’t validating their warming bias, but I can’t find references to that at the moment.
Add to the discussion the fact that the measurements are all over the 30% land of the global surface and next to nothing over the 70% oceans of the global surface. And that the thermometers are not evenly distributed on the land masses.
Very few are in the forests and sparsely inhabited areas and polar icecaps.
How can the figures possibly be any where near a global average?
Ah, but maybe M. Mann and the 97% of Climate Scientists™ are correct, and all that non-urban countryside is cooling the temperatures too much. Thus these non-satellite records require curve fitting adjustments to correctly reflect the CO2 warming that is hiding there, and so the proper man-made warming is observed.
Why else adjust historic temperature records?
/sar-off
The temperatures in the countryside are not natural. The forests, meadows, lakes, ponds, streams and marches are artificially cooling the environment but such features don’t exist in our cities and metropolitan areas. I would not report them at all but if you must, of course they should be adjusted upwards to conform to the representative temperatures measured in densely populated urban areas.
I agree. When we lived in Philadelphia we would sometimes go camping in French Creek State Forest, a few hours drive directly West. During the days the temps would be comparable, but at night the temps in the woods were unnaturally cold. While the asphalt and concrete of the buildings held the heat in the cities both day and night, a phenomenon warmists are much more comfortable with, the night time temps in the woods would plunge to become so uncomfortably cold that it was preferable to stay in one’s sleeping bag than to go out to relieve oneself. Very unnatural. So, yes, definitely purge the measurements of the rural areas. They are too negative an influence on the warming we all KNOW is there. //s//
Colorado you have got to be joking. If you are just being sarcastic you should start with /sarc on/ and end with /sarc off/ or as yonason has done //s//.
Or are you just trying to take the mickey out of us ‘skeptics’.
Well I’ll bite ‘Temperatures in the countryside are not natural’. REALLY? How about you tell us what you think is natural then? Anything that isn’t hot perhaps? Should we accept that ‘The forests, meadows, lakes, ponds, streams and marches (sic- marshes) are artificially cooling the environment’ aren’t natural either?
Please explain?
He’s just joking Don.
Don, you must realise…
Colorado is even more cynical/sarcastic about AGW than I am 🙂
Thanks Andy and yonason apologies to Colorado. I need to lighten up a bit do I?
Here in New South Wales Australia we have just had a 20% increase in electricity charges with media reports of thousands of customers facing disconnection for being unable to pay their bill. ( De Ja Vous Germanies experience).
Major factors – Subsidised wind and solar destabilising a once stable government owned generation, transmission and distribution system.
Stupid, short sighted greed of State governments desire for immediate cash resulting in sale to private enterprise.
Gaming by those private enterprises to raise charges for increased profits. (I guess if I was in their boots I would be inclined to do the same)
Perhaps it is time to look at buying a diesel Gen set.
Just a note, Don.. I’m also in NSW. 🙂
Sympathies to you Don (and Andy) for being caught in the insanity of your watermelon “leaders.” Hopefully it won’t be long before sanity returns and prevails.
Don’t listen to them, Don. I’m serious.
https://www.youtube.com/watch?v=Q34logqQfEA
😡😷🤐
Sorry, Don, I don’t use /sarc tags because I live among the watermelons of the People’s Republic of Boulder and they don’t use them either when writing things like my comment above.
Warm greetings from Colorado.
[…] Read rest at No Tricks Zone […]
According to Surface Stations.org (http://www.surfacestations.org/), any adjustments of land-based temperature monitors should be down, if they are done at all:
“Climate Reference Network Rating Guide – adopted from NCDC Climate Reference Network Handbook, 2002, specifications for siting (section 2.2.1) of NOAA’s new Climate Reference Network:
Class 1 (CRN1)- Flat and horizontal ground surrounded by a clear surface with a slope below 1/3 (<19deg). Grass/low vegetation ground cover 3 degrees.
Class 2 (CRN2) – Same as Class 1 with the following differences. Surrounding Vegetation 5deg.
Class 3 (CRN3) (error >=1C) – Same as Class 2, except no artificial heating sources within 10 meters.
Class 4 (CRN4) (error >= 2C) – Artificial heating sources = 5C) – Temperature sensor located next to/above an artificial heating source, such a building, roof top, parking lot, or concrete surface.”
Are you guys absolutely sure about what the post is trying to say?
http://www.woodfortrees.org/plot/gistemp/from:1930/mean:12/plot/hadcrut4gl/from:1930/offset:0.14/mean:12/plot/rss/offset:0.30/mean:12/plot/uah6/offset:0.43/mean:12
Why do satellite record the same increase as ground based temperature measurements?
They don’t:
https://notrickszone.com/wp-content/uploads/2017/02/NASA-vs-RSS-1998-2014-Cooling-to-Warmingjpg.jpg
The satellite record does not extend back to 1930.
As HadCRUT and NOAA show, after 1980, because the activists removed thousands of rural temperature stations while keeping the urban stations intact, especially in the U.S., the land based temperatures shot up by 0.5°C to 0.6°C relative to sea surface temperatures:
–
1. https://notrickszone.com/wp-content/uploads/2017/02/HadCRUT-1900-2010-Land-vs-Sea-Temperatures.jpg
–
2. https://notrickszone.com/wp-content/uploads/2017/02/NOAA-Global-Temperatures-1880-2014-Land-vs-Sea-0.6-C-Added-768×561.jpg
–
Do you think there could be a connection between extensive rural station temperature removal and a dramatic uptick in land surface temperatures? Or is this just a coincidence?
SebastianH, now that you’re back, perhaps you could answer the question you have been asked (multiple times) but routinely avoided.
As you may recall, you called Dr. Richard Lindzen a “climate denier” because although he agrees with you about the greenhouse effect, CO2 as a GHG, humans emissions causing warming, etc., apparently you don’t agree with him about how much warmer we’ll get when CO2 is doubled to 560 ppm. Here’s the question I asked:
How much warming from a doubling of CO2 must one believe in to avoid being classified as a “denier” of the climate? Please be specific. How much warming do you believe we shall experience upon CO2 doubling? 4 degrees C? 5 degrees C? 6 degrees C? Is 3 degrees of warming the lowest threshold one must believe in? Below that, one becomes a “climate denier”?
Similarly, how many meters of sea level rise by 2100 must one believe in to avoid being called a “climate denier”? Is 1 meter of SLR “denier”? How about 2 meters?
How many species extinctions by 2050 must one believe in to avoid being called a “climate denier”? Is one million the lower limit? How about 2 million species extinctions? Is that “denier”?
In responding to this question, SebastianH, please be very specific. I’d really like to know the values that distinguish the deniers from the non-deniers.
Also, once we know the safe and proper thresholds for the above belief tests:
Can a person of weak faith—i.e. someone who doesn’t accept the doctrine of CO2 omnipotence and believes in lower numbers—buy climate indulgences and avoid being called a “climate denier”?
Authorized indulgences include but are not limited to driving a Prius or EV, eating organic vegetables, avoiding beef, buying wind electricity, sending money to Greenpeace or working for the election campaigns of progressive parties.
My reply from the last time still stands Kenneth. You become a denier when you say/publish nonsense like Mr. Lindzen did.
You can also be a denier if you say CO2 doubling will increase the temperature by 100 degrees. That term has nothing to do with what you are asking here … oh and it has nothing to do with the Holocaust either.
And:
Of course they do. Gistemp Loti and RSS v4 match. And the Gistemp data website (https://data.giss.nasa.gov/gistemp/) says: GISS Homogenization (Urban Adjustment)
One of the improvements — introduced in 1998 — was the implementation of a method to address the problem of urban warming: The urban and peri-urban (i.e., other than rural) stations are adjusted so that their long-term trend matches that of the mean of neighboring rural stations. Urban stations without nearby rural stations are dropped. This preserves local short-term variability without affecting long term trends. Originally, the classification of stations was based on population size near that station; the current analysis uses satellite-observed night lights to determine which stations are located in urban and peri-urban areas.
Dr. Lindzen, IPCC lead author, atmospheric physicist, author of 240+ peer-reviewed scientific papers, had his climate sensitivity paper featured in the last IPCC report. Lindzen agrees with the theoretical greenhouse effect, agrees that CO2 is a GHG, agrees that human emissions cause warming, and thus he agrees with AGW. And yet he has published multiple papers that indicate the climate’s sensitivity to CO2 is 0.7 K upon doubling (including feedbacks). All this has been pointed out to you multiple times, and yet you still decided to call Dr. Lindzen a “climate denier”. Why? Because he doesn’t agree with you that catastrophic warming will occur upon CO2 reaching 560 ppm, nor does he agree with you that CO2 concentrations CONTROL the climate. Notice that he specifically uses that word in his “magic” quote, as there is a fundamental distinction between believing that CO2 concentration changes CONTROL the climate (as you do) and believing that CO2 concentration changes contribute to climate change, but not significantly (as Lindzen believes).
So this brings me to the question that I have asked you probably about 10 times in the last two months, and that you have danced around and successfully (?) avoided answering for the last two months: What is the minimal threshold of warming one must believe in from doubled CO2 (to 560 ppm) to avoid having people like you call them names like “denier”? What’s the baseline temperature value for the denier/believer cut-off? If an atmospheric physicist is a “climate denier” because he concludes that the ECS is 0.7 K for CO2 doubling, by how many degrees does that need to be raised to avoid the name-calling? How much warming do you believe we’ll get? Answer the question, SebastianH. It’s not like I’m going to stop asking you to specifically respond to this question. It’s fundamental.
They don’t [matching satellites vs. NASA/NOAA temperature].
As this graph shows, there is a 0.5 K difference between the RSS temperature value (trend) in 2015 and the NASA/NOAA value (trend) in 2015. A half of a degree of difference is not a “match”.
https://notrickszone.com/wp-content/uploads/2017/02/NASA-vs-RSS-1998-2014-Cooling-to-Warmingjpg.jpg
The values for UAH show the same trend difference (0.5 K) as the RSS vs. NASA/NOAA does for 2015. In other words, they don’t match either.
http://www.woodfortrees.org/plot/uah6/from:1998/to:2015/plot/uah6/from:1998/to:2015/trend/plot/gistemp/from:1998/to:2015/plot/gistemp/from:1998/to:2015/trend
You’ve got to remember that these are just simple believers. These are people of the cause. The common clay of the New Order. You know …
Because he says nonsense regarding climate change and its consequences. Your question about climate sensitivity thresholds is pretty telling. As always you like simple answers and simple relations/connections … if it were only as simple as it’s (often) in your world, but it isn’t.
Graphs: you are ignoring the different baselines … http://www.woodfortrees.org/notes#baselines
Here is a comparison of Gistemp Loti and RSS and Gistemp shifted to the RSS baseline: http://imgur.com/a/5voWi
Do those lines look like they don’t match for you?
you still decided to call Dr. Lindzen a “climate denier”. Why?
Please specifically identify what the “nonsense” is that he says. You’ve previously cited this quote as an example of what you think demonstrates that Lindzen is a “climate denier”:
“Doubling CO2 involves a 2% perturbation to this budget. So do minor changes in clouds and other features, and such changes are common. In this complex multifactor system, what is the likelihood of the climate (which, itself, consists in many variables and not just globally averaged temperature anomaly) is controlled by this 2% perturbation in a single variable? Believing this is pretty close to believing in magic. Instead, you are told that it is believing in ‘science.’ Such a claim should be a tip-off that something is amiss. After all, science is a mode of inquiry rather than a belief structure. The accumulation of false and/or misleading claims is often referred to as the ‘overwhelming evidence’ for forthcoming catastrophe. Without these claims, one might legitimately ask whether there is any evidence at all.”
1. Why do you believe that CO2 controls the climate such that a 2% perturbation (560 ppm CO2) in a single variable out of the many contributing variables is the determinant of the planet’s temperatures?
2. Why do you believe that a warming catastrophe lurks due to this 2% perturbation (560 ppm CO2) in a single variable, especially since even your own theorists conclude that doubling CO2 from 280 ppm to 560 ppm can, at most, cause a temperature change of 1.16 K? Why is a 1.16 K increase in temperature from the coldest period of the Holocene in about 10,000 years (LIA) a climate catastrophe, SebastianH?
Why not just answer the question, SebastianH? Why continue dancing around like this, pretending it is beneath you to answer the question as to how much warming you believe we’ll get when CO2 doubles? I’m just going to continue asking until you answer.
What is the specific amount of warming an atmospheric scientist must believe in to avoid having people like you call them “climate deniers”? What’s the denier/non-denier cutoff temperature value? Is 3 K the bare minimum to be accepted as a non-denier? Or is even 3 K “denier” too?
It’s a simple answer that you keep on running away from. How much warming do you believe we’ll get when CO2 reaches 560 ppm?
I see. So now that Mears has bowed to pressure and changed the temperature data to your liking within the last few weeks, you don’t have to answer the question as to why it is that both RSS (the previous version) and UAH showed 0.5 C less warming in 2015 than GISS. No, SebastianH, the lines don’t match.
https://notrickszone.com/wp-content/uploads/2017/02/NASA-vs-RSS-1998-2014-Cooling-to-Warmingjpg.jpg
http://www.woodfortrees.org/plot/uah6/from:1998/to:2015/plot/uah6/from:1998/to:2015/trend/plot/gistemp/from:1998/to:2015/plot/gistemp/from:1998/to:2015/trend
The quote you requoted and things like the letter to Trump http://blog.ucsusa.org/wp-content/uploads/annotated-lindzen-letter.jpg
Components of radiative forcing:
https://www.ipcc.ch/report/graphics/images/Assessment%20Reports/AR5%20-%20WG1/Technical%20Summary/FigTS-07.jpg
Why do you believe it is not? Because it sounds so tiny? 2%? ppm? single variable? Is there anything wrong with that chart? Do you have 1000 papers saying it’s not true? What is your own opinion? Do you believe they got ignored for the report because it is all a great conspiracy?
It’s in the range between 1.5°C to 4.5°C (high confidence) and very unlikely below 1°C or greater than 6°C.
For long term effects, you could re-read Chapter 12.5 of the IPCC report: http://www.ipcc.ch/pdf/assessment-report/ar5/wg1/WG1AR5_Chapter12_FINAL.pdf
I don’t believe, that’s what most skeptics seem to do … isn’t it mostly a gut-feeling that 2% of one variable can not possibly change anything?
I’d go with what scientists say the range will most likely be (queue in you telling me that the IPCC report actually uses the word “belief”).
The classic “all adjustments are false” defense? Have you even read and understood the adjustments?
So it needs repeating? Please read: http://www.woodfortrees.org/notes#baselines
You are welcome!
http://www.woodfortrees.org/plot/uah6/from:1998/to:2015/plot/uah6/from:1998/to:2015/trend/plot/gistemp/from:1998/to:2015/offset:-0.43/plot/gistemp/from:1998/to:2015/offset:-0.43/trend
So Lindzen is a “denier” because he writes that CO2 is not a pollutant? We have to accept that CO2 is a pollutant, and if we don’t, we’re “deniers”?
The scribbled “rebuttals” in that piece indicate that emissions regulations reduce wildfires, droughts, and floods. Do you believe this has been scientifically established, and thus people who disagree are deniers of this “truth”? (Wildfires, droughts, and floods are all less common today compared to past centuries).
even your own theorists conclude that doubling CO2 from 280 ppm to 560 ppm can, at most, cause a temperature change of 1.16 K?
So instead of actually answering the question, you have again retreated to just repeating the IPCC range (that hasn’t narrowed in 30 years). The question was, What is the minimum temperature change from CO2 doubling one must believe in to avoid having people like you call them “deniers”? How far away is Dr. Lindzen from the non-denier camp with his conclusion that ECS is 0.7 K because increasing water/cloud is a negative feedback?
Speaking of, since you’re a believer that CO2 can only cause a temperature change of 1.16°C when doubled to 560 ppm, and it’s positive feedbacks with water vapor and cloud that cause temperatures to rise the rest of the way (up to 6°C), what percentage of the 0.78°C temperature increase since 1850 has been caused by water vapor and cloud positive feedbacks? Or do you believe the contribution from water vapor and cloud has been 0°C up to this point, and that it’s only at some point in the future that water vapor and cloud positive feedbacks will “kick in”? How does that work, exactly? Water vapor and cloud will increase temperatures by 3°C or 4°C or 5°C, but up to this point they haven’t contributed anything? Why haven’t they?
I never wrote that “all adjustments are false”. You just fabricated another statement. Do you feel accomplished when you “slay” arguments that you made up yourself?
Have you realized your mistake with the different baselines or are you just ignoring this?
A nonsense question and you seem to ignore my reply to this one as well.
I suggest you learn something about the mechanisms involved. Even if you don’t agree with those ranges, you should at least know how scientists arrive at those numbers. Hint: if we continue to increase the CO2 concentration to 560 ppm and keep it stable at that level, the resulting full temperature increase caused by the forcing will happen decades later.
I didn’t write that you wrote “all adjustments are false”, did I?
What is the minimum temperature change from CO2 doubling one must believe in to avoid having people like you call them “deniers”?
It’s only a “nonsense” question because you don’t want to answer it. I have asked you this same question 5 times in this comment section alone and you continue to avoid answering it.
Is believing that climate sensitivity to doubled CO2 is 1.5°C “denier”? Or is that the bottom threshold to be counted among the believers? How much warming from doubled CO2 must one believe in to avoid being called names by people like you?
I asked you a specific question (that you failed to answer for the umpteenth time): What percentage of the 0.78°C temperature increase since 1850 has been caused by water vapor and cloud positive feedbacks? Do you have an answer? Does the IPCC? If so, enlighten us. Why do you continue to runaway from questions like this? Can you at least acknowledge that you don’t know the answer? Or would that require too much humility?
SebastianH, you wrote that I used “The classic ‘all adjustments are false’ defense”. And now you’re claiming you never wrote that. That is classic you.
Yes, and it has been stupid nonsense (sorry) the first time. That not a criteria to be called “denier”, as I now have written as a reply 100 times.
I find it quite amusing that you insist on me giving you an answer to such a question and even count your repetitions. I wish I had counted the many times I asked you to learn about the mechanisms involved in order to understand what you are calling impossible or extremely unlikely. You don’t have to agree with “us”, but don’t you want to know what you are arguing against?
I see, so writing it like this in English means that I am implying you actually said “all adjustments are false”? Weird language. Or are you misinterpreting this on purpose (again)?
P.S.: I don’t know exactly how much of the warming was caused by feedbacks, those are ranges too. The current temperature anomaly is not a direct result of the current CO2 concentration. So if we have a range of 1.5°C to 4.5°C (and 1.16°C for the direct CO2 effect) for a concentration of 560 ppm you’d have to reverse the mechanism to find out at what percentage of the road to 560 ppm we are now at (hint: the scale is not linear) and you’ll get the range for today’s anomaly. That would be a wonderful exercise for you to do when you learned how the mechanisms work (or are supposed to work, since you don’t want to accept them working this way).
You wrote that Dr. Lindzen is a “denier” because he “argues against known physics and mechanisms”. But he thoroughly agrees with the greenhouse effect, that CO2 causes warming, that increasing our emissions increases the planet’s temperature to rise and CO2 concentrations to rise. So he agrees with you. And yet you still called him a “denier” anyway. What are the physics and mechanisms he denies, SebastianH? He doesn’t agree with you that the climate’s sensitivity to CO2 doubling will result in catastrophic warming. What other “truth” does he deny that is “known physics and mechanisms”?
And again, the “physics and mechanisms” you refer to here are rooted in modeling. As you know, there is no scientific evidence that supports your beliefs that raising or lowering CO2 concentrations over a body of water causes cooling or warming in that body of water. It’s hypothetical based on suppositions. That’s what your paradigm is based on.
Great! So identify those ranges. Of the 0.78 K, what are the ranges for the contribution from increasing cloud cover — which you apparently believe causes a net warming despite all the evidence to the contrary? Do you have cloud data from before the satellite era to affirm these value ranges? How about water vapor positive feedback? What were the water vapor level contributions from the 1930s? Do you know, or are these just guesses on your part?
You are a DENIER of science , when you are totally unable to produce ONE SINGLE PIECE of empirical evidence for CO2 warming of oceans or convective atmosphere.
That would be YOU, seb-t.
Only person HIGH on nonsense is YOU, seb-t.
It seems to be all you are capable of.
Attention-seeking, bed-wetting, anti-science nonsense.
The surface data is a monumental MESS.
– Irregularly spaced, sparse,
– Of unknown quality in many cases, (and in many cases that are known, have been shown to be HIGHLY dubious to say the least)
– Multiple raw data adjustments with questionable explanations.
– Infilling wild guess data where data are missing (majority of grids).
– Absurd claimed of margins of errors.
– Improper surface thermometer siting.
– Massive tampering by AGENDA driven climate monkeys.
– Now RSS has become AGENDA-tainted as well.
But even after all that, in the satellite data, there is absolutely ZERO CO2 warming signature.
All the warming came from El Nino events, which have absolutely NOTHING to do with CO2
Between those events (1980, 1998-2001, 2015….
….THERE WAS NO WARMING!
You will try any LIE you think you can get away with, won’t you, seb-t
http://www.woodfortrees.org/plot/gistemp/from:2000/mean:12/plot/hadcrut4gl/from:2000/offset:0.14/mean:12/plot/rss/offset:0.30/mean:12/from:2000/plot/uah6/offset:0.43/mean:12/from:2000
Sebastian, incredibly writes this howler:
“Why do satellite record the same increase as ground based temperature measurements?”
Not from 1979 they do since their warming rate is .12C per decade,while the surface temperatures varies around.16C per decade,depending on which data source you use.
But then when you go from 2001 to now it is around zero rate for Satellites while the surface temperature manage to find warming.
Meanwhile you seem to be ignoring the well known Urbanization bias,as many of the existing temperature stations are being affected by cities and their heat increasing capacity of the buildings,Roads,HAV units and so on.
Then don’t start in about the only year where you can get such a result with a trend over a short time period: http://imgur.com/a/ctkRg
Do you think UHI effect is unknown to those adjusting and quality checking the station data?
No, it’s very well known. That’s why they removed thousands of temperature stations in mostly rural areas after the 1970s – to eliminate the stations that had been showing cooling (non-urban), and to retain the stations that would continue to show artificial warming (urban).
–
https://notrickszone.com/wp-content/uploads/2017/02/NOAA-Data-Manipulation-Station-Removal-Small.jpg
–
https://notrickszone.com/wp-content/uploads/2017/02/NOAA-Data-Manipulation-USA-Temperature-Station-Removal-Since-1979.jpg
–
https://notrickszone.com/wp-content/uploads/2017/02/NOAA-Data-Manipulation-Altitude-Bias.jpg
–
https://notrickszone.com/wp-content/uploads/2017/02/NOAA-Data-Manipulation-Urban-Bias-Airport-Temperature-768×562.jpg
–
Do you think it’s a coincidence, SebastianH, that the removal of thousands of rural temperature stations from the network occurred at the very same time (post-1980) that land surface temperatures rose by 0.5 to 0.6 C more than sea surface temperatures did? Or do you think there is a connection?
–
https://notrickszone.com/wp-content/uploads/2017/02/HadCRUT-1900-2010-Land-vs-Sea-Temperatures.jpg
–
https://notrickszone.com/wp-content/uploads/2017/02/NOAA-Global-Temperatures-1880-2014-Land-vs-Sea-0.6-C-Added-768×561.jpg
ROFLMAO.
your puerile little graph shows you up, yet again, as a mathematically inept monkey at best.
And I bet you don’t even know why. 😉
So hilarious, so ANTI-science.
Seb, you have been told before that starting at the first full year of the 21st century is relevant,because it was AFTER La-Nina faded away and to show that despite the significant addition of CO2 into the atmosphere since 2001,there is precious little warming.
Virtually ALL of the warming has been from El-Nino events since the 1970’s.
You have been told MANY TIMES now that the IPCC projected a .30C per decade warming rate,yet NONE of the data sets show this since 1979,1990,1997,2001 time frames.Heck it has been BELOW .20C per decade the entire time. The Satellite data has been below .13C per decade since 1979.
You have NOTHING against this Seb,and you know it.
SEb, your link doesn’t even help you.
The RSS warming rate is still less than half the IPCC projected rate since 1979. Can you guess what it is,Seb child?
It is clear you are STILL IGNORING the IPCC per decade AGW based modeling guesses,that are so shown by Satellite data, to be very wrong. The Tropical “hotspot” is still not there after decades of waiting. It actually cooled slightly at one level,warmed warmed a little in the second layer and about zero in the third layer.
You call Dr. Lindzen names,but you can’t face the STARK IPCC prediction failures.
Without data tampering, there would be NO warming.
https://www.youtube.com/watch?v=VZWBFtukLyU
All they have is lies, and all you are is an echo chamber for those lies, which are wonderfully exposed by Tony Heller. Here’s another.
https://www.youtube.com/watch?v=VZWBFtukLyU
So, what’s the deal SebH? Are you a victim of their abuse of science? Or are you a willing accomplice?
seb-t = GULLIBLE, anti-science AGW parrot, with an underlying attention-seeking troll MENTALity
Apparently so.
And thanks for, YET AGAIN, proving me correct, by using the El Ninos as your prime source of trends.
Can’t help yourself, can you seb-t.. because you KNOW that between those El Ninos, THERE IS NO WARMING
You also KNOW that El Ninos are SOLAR driven, nothing to do with CO2.
I don’t think you are so scientifically illiterate that you don’t know these facts…
That makes you a deliberate, deceitful, AGW LIAR/SHILL !!
Andy,
He doesn’t want to face that obvious reality,which is why we get the run around from this silly man. He keeps avoiding answering a couple specific questions from Kenneth too,gee I wonder why……….
Meanwhile he has yet to show by evidence,of postulated CO2 effect on the temperature since 2001.
It is impressive how easily you get triggered and need to present your beliefs about manipulated data and El Nino as the master of temperature increase as a response.
Should stop commenting again so you can all calm down and reassure yourselves of your strange beliefs 😉
Keep repeating your mantras, but don’t act surprised if you get called what you are.
Yeah. Shame on us for “needing” to respond to your lies with facts. Whatever were we thinking?!
And getting called on telling the truth is just such a blow to our egos, too.
Getting pretty desperate there, chatbot sebH.
It looks as though SebastianH is threatening to call us names like “climate deniers” again. Name-calling has been a really effective response every time he’s used it in the past.
We’ve been warned. Prepare to have SebastianH unleash his super-special debating tactic on us.
This is getting serious. I’ve seen it before. Sebastian farted in your general direction:
Do you know what’s next?
Run away!
Why are you still DENYING science and facts seb-t.
You are a brain-washed parrot, desperately seeking attention, who’s only reason for being here is as a baseless, anti-science, AGW troll.
And you calling any one out, on anything, is the equivalent of a chihuahua YAPPING behind a 6ft fence.
Sebastian writes,
“It is impressive how easily you get triggered and need to present your beliefs about manipulated data and El Nino as the master of temperature increase as a response.”
It is impressive that you keep ignoring that obvious reality since it warms ONLY when El-Nino’s come along,otherwise flat to a cooling trend comes after it fades away.
From Bob Tisdale,where he shows using the data that yes “global warming” are caused by ENSO events:
Can El Nino Events Explain All of the Global Warming Since 1976? – Part 1
https://bobtisdale.wordpress.com/2009/01/10/can-el-nino-events-explain-all-of-the-global-warming-since-1976-%E2%80%93-part-1/
Seb,
“Should stop commenting again so you can all calm down and reassure yourselves of your strange beliefs.”
When are you going to stop ignoring the failed PER DECADE projections from the IPCC reports?
How much longer are you going to ignore well documented temperature data tampering?
How much longer are you going to avoid Kenneth’s well documented massive station drop outs?
How much longer are you going to ignore the Satellite data showing the failure of the Tropical Hot Spot and the less than 50% per decade warming as per the Satellite data rate of the IPCC projected rates?
Seb ends with this childlike prose,
“Keep repeating your mantras, but don’t act surprised if you get called what you are.”
Bwahahahahahahahahahahahahahahahahaha!!!
You ignore most of the official evidence right off the bat,then the occasional time you make a sourced reply,it gets a detailed reply, you quickly drop it,to go to a corner of the room and curl up into a fetal ball.
Your whine about Dr. Lindzen,is a classic example of your low level behavior,who can’t provide a credible counterpoint to what he wrote,instead of the name calling you several times foisted on Dr. Lindzen. He has since been joined by many scientists who also show low to near zero CO2 sensitivity effect. You are indeed a cad!
Many here long know that you are a glassy eyed,slack jawed warmist troll. You bring very little to the debate,ignore the many failed IPCC projections,ignore the obvious El-Nino effect on global temperature,ignore the hundreds of published science papers in recent years,that shoots holes in the absurd AGW conjecture.
Why not surprise us with honest rational replies instead?
An honest and rational approach to observations, data and evidence fails to support the anthropogenic global warming hypothesis. Fortunately, Marxism provides an alternative method:
“manipulated data and El Nino as the master of temperature increase”
FACTS, you really can’t cope with FACTS can you seb-t.!