Glacier Retreat Has Been
Slowing During 2000-2016
A new satellite-based estimate of glacier mass change for High Mountain Asia (HMA), the world’s third largest glacier conglomeration after Antarctica and Greenland, reveals a relatively modest retreat rate for the first 17 years of the 21st century.
The results from Brun et al. (2017) indicate that HMA glaciers are nearly in balance for 2000-2016, contributing the equivalent of just 0.046 millimeters per year to sea level rise during this period. This is a glacier-melt contribution rate of less than half a centimeter per century, which is “much smaller” and “in marked disagreement” with other recent estimations.
Previous model-based estimates have generated HMA glacier melt and sea level equivalent values nearly 4 times greater (-46 Gt yr-1, +0.13 mm yr-1). The new study’s authors attribute the discrepancy to the historical “sparse spatial sampling” and “lack of direct measurements”, or extrapolating data from limited coverage areas to represent much larger areas.
In this study, for example, glaciers in the Kunlun and Karakoram regions of HMA have been observed to be in balance or even gaining mass. The model-based studies indicate significant mass losses are occurring in these regions.
The high estimates of HMA glacier melt and sea level rise contribution are preferred (and thus “widely used in the literature”) by those advancing the position that modern glacier melt rates are unusual or unprecedented. This study makes a strong case that past and present high glacier-melt values in this region are unsupported by comprehensive analyses from satellite observations.
Brun et al., 2017
‘Much Smaller’ Asian Glacier Retreat For 2000-2016
•“We provide spatially resolved estimates for the potential contribution of HMA [High Mountain Asia] glaciers to SLR [sea level rise] and changes in the downstream hydrology, aggregated by major river basins. We find a total sea level contribution of -16.3 ± 3.5 Gt yr−1 (14.6 ± 3.1 Gt yr−1 when including only the exorheic basins), corresponding to 0.046 ± 0.009 mm yr−1 sea level equivalent (SLE) (0.041 ± 0.009 mm yr−1 SLE when including only the exorheic basins).” [-16.3 Gt yr is equivalent to +0.046 mm yr, or adding only 0.46 of a centimeter to sea levels in 100 years.]
•“This estimate is in marked disagreement with the total estimate of −46 ± 15 Gt yr−1 from Cogley, 2009 and Marzeion et al., 2015 commonly used in the sea level budget studies.”
Model-Based Estimates Of Glacier Retreat ‘Four Times Larger’ Due To ‘Lack Of Direct Measurements’
•“The model contribution estimates of Cogley, 2009 and Marzeion et al., 2015 for the period 2000–2013 are nearly four times larger than our estimate for Central Asia (22 Gt yr−1 for the model versus 6 Gt yr−1 for this study) and over twice as large for South Asia East and South Asia West (14 Gt yr−1 for the model versus 6 Gt yr−1 for this study, and 9 Gt yr−1 for the model versus 4 Gt yr−1 for this study for the two regions respectively.”
•“These discrepancies can be explained by the lack of direct measurements to constrain both the interpolation method of Cogley, 2009 and the model tuning and/or the high temporal smoothness of atmospheric models of Marzeion et al., 2015.”
•“In particular, these estimates [Cogley, 2009 and Marzeion et al., 2015] attribute mass losses to Karakoram and Kunlun, two regions with a large glacierized area where we find only little mass loss or even mass gain.”
•“Our new estimate of HMA [High Mountain Asia] glacier contribution to SLR [sea level rise] for 2000–2016 (0.041 ± 0.009 mm yr−1 SLE [sea level equivalent], when excluding endorheic basins) is slightly smaller than the values of Kääb et al., 2015 (0.06 ± 0.01 mm yr−1 SLE) and Gardner et al., 2013 (0.07 ± 0.03 mm yr−1 SLE), but much smaller than the model-based estimate of Cogley, 2009 and Marzeion et al., 2015 (0.13 ± 0.05 mm yr−1 SLE), although the latter are widely used in the literature.”
Shrinking Estimates Of Non-Polar Glacier Mass Loss
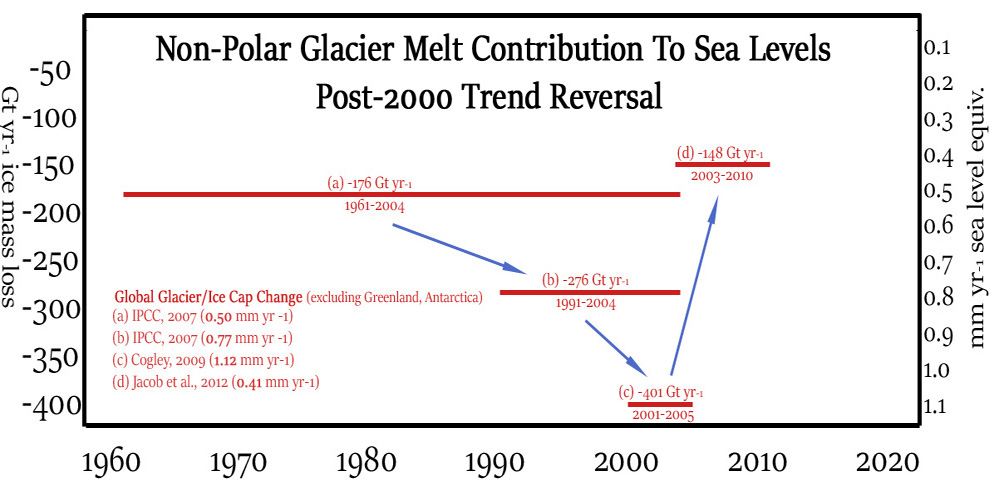
In a highly-regarded mass balance analysis (to date, nearly 550 citations) published in the journal Nature, Jacob et al. (2012) record a stark trend reversal and rapid deceleration of glacier retreat in the 21st century for the globe’s glaciers and ice caps (excluding the Greenland and Antarctica ice sheets).
A major reason why the glacier loss estimates have been shrinking in recent years is the effectively in-balance estimates for HMA glaciers, which “show a mass loss of only 4 ± 20 Gt yr−1 for 2003–2010, compared with 47–55 Gt yr−1 in previously published estimates“.
Considering aggregate estimates for non-polar glacier mass loss were 2 or 3 times greater for the 1990s to early 2000s than in the more recent years, it would appear the trend reversal in glacier mass losses is more widespread than a few areas in High Mountain Asia.


Glaciers stay frozen but Merkels meltdown will drown us!
Is that the message to take away?
How very inconvenient (if not impertinent) of Brun et al.
Isn’t there a proper gate keeper somewhere who could “redefine peer review” and get this paper buried? After all, reporting such measurements certainly won’t help “the cause” now, will it?
It’s not just in Asia. Tony at https://realclimatescience.com/
keeps an eye on the Peterman Glacier which is the probably the most studied glacier in Greenland. It is gaining ice which makes sense because the SMB of the Greenland ice sheet has been increasing at a near record rate for well over a year now.
https://realclimatescience.com/2017/11/arctic-ice-growth-this-month/
CO2 working its magic again, Sebastian?
I assume the response to this paper will be a deafening silence.
If I understand correctly, their method was to use stereo satellite images to measure the (almost) entire ice mass in 3D. Sounds sensible.
I’ve not paid to download the whole paper but there is a reference in the snippet above to ‘bridging the gap between two previous methods’, one of which sounds as unsophisticated as taking spot measurements then doing some (probably rather dodgy) averaging. Perhaps the other is simple 2d satellite images…?
Can anyone tell me what these conventional methods are and whether they are even credible in principle (i.e. before being…ahem…corrected)?
“We apply a fully automated method to compute DEMs from the vast amount of freely available ASTER optical satellite stereo pairs. We use these DEMs to assess glacier volume changes over the entire HMA for the period 2000–2016. We fit a linear regression through time series of co-registered ASTER DEMs to estimate the rate of elevation change for each 30-m pixel. Inspired by previous studies, this methodology was further developed and validated on the Mont Blanc area in the European Alps21. Contrary to earlier studies, we did not rely on DEMs available online (the so-called 14DMO product) but directly calculated more than 50,000 DEMs from L1A ASTER images using the Ames Stereo Pipeline. One strength of this method is that it relies exclusively on satellite optical data. Thus, it is not affected by signal penetration, which is a major source of uncertainty in DEMs derived from radar sensors (for example, from the Shuttle Radar Topography Mission; SRTM), for which the signal penetrates to a mostly unknown depth of up to many metres into snow and ice.”
“We integrate these elevation changes and use a mass to volume conversion factor of 850 ± 60 kg m−3 (ref. 27 and Supplementary Information). Our glacier mask for DEM co-registration and for integrating the glacier elevation change is derived from the GAMDAM inventory, as this is the only homogeneous inventory covering the entire HMA. As a sensitivity test, we compare our GAMDAM-based estimates with those obtained using the ICIMOD inventory, the ESA CCI inventory and the Randolph Glacier Inventory (Supplementary Information).”
[…] Full post […]