Changing Scientific Consensus
1970s: Global Cooling A Serious Threat
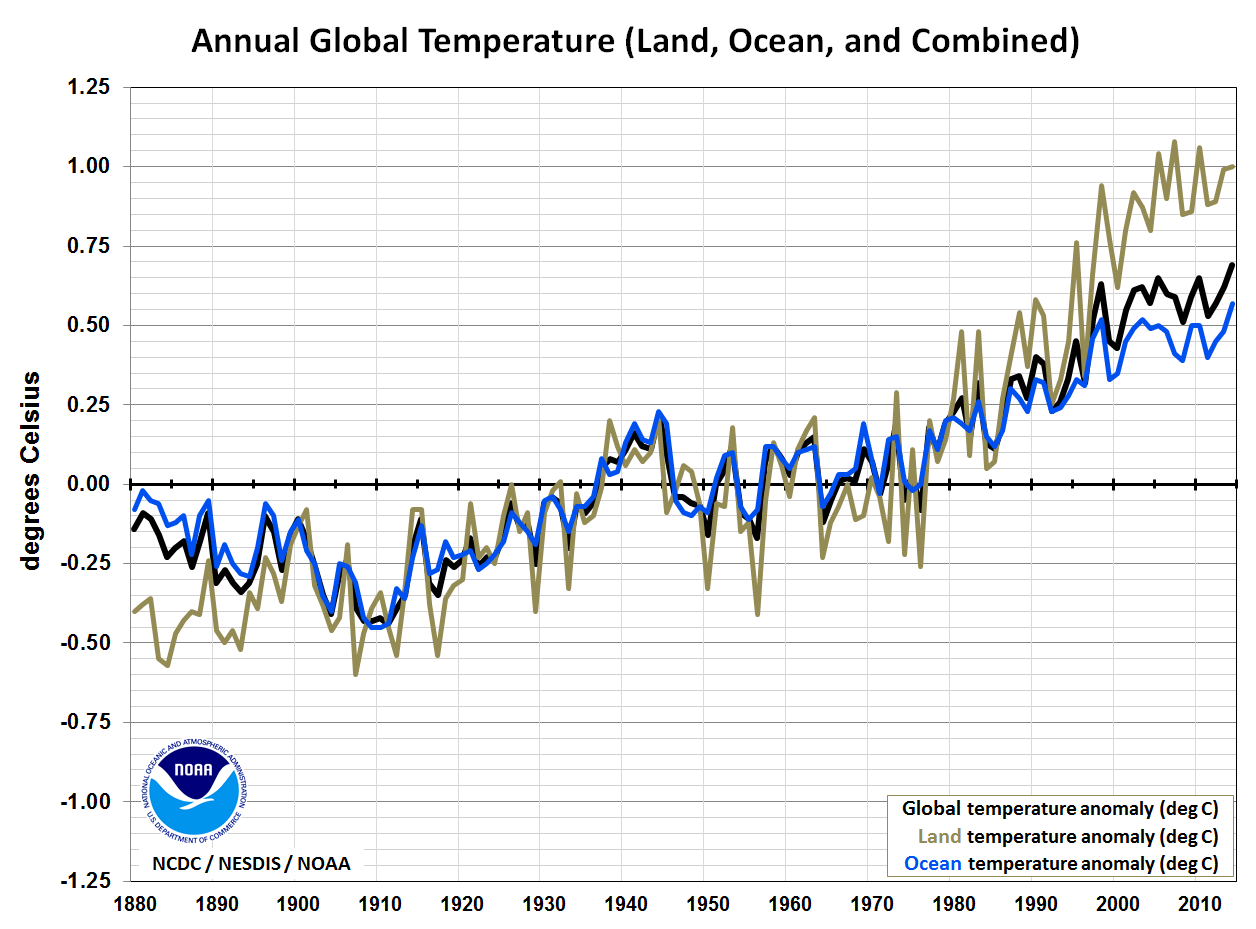
Today: Global Cooling Never Happened
Until the mid-1980s, it was widely accepted in the peer-reviewed scientific literature that there was an abrupt global cooling trend between the 1940s and 1970s.
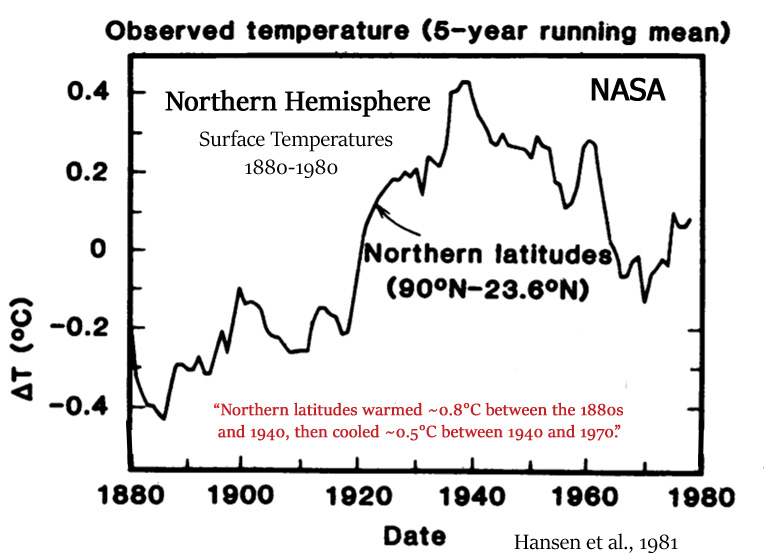
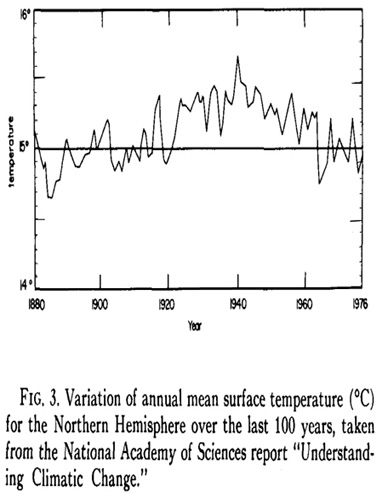
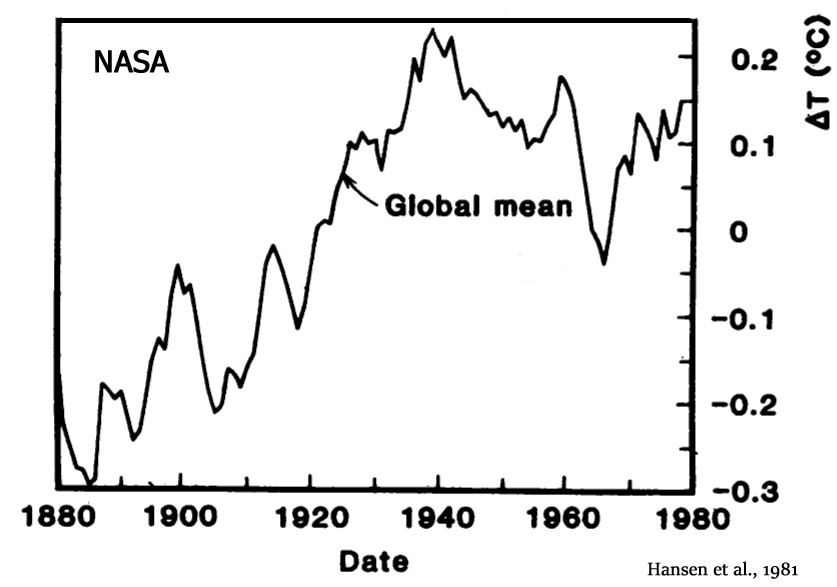
The amplitude of the climate change amounted to more than -0.5°C of cooling in the Northern Hemisphere, as documented by NASA (1981).
Hansen et al., 1981 (NASA) “[T]he temperature in the Northern Hemisphere decreased by about 0.5°C between 1940 and 1970, a time of rapid CO2 buildup. … Northern latitudes warmed ~ 0.8°C between the 1880’s and 1940, then cooled – 0.5°C between 1940 and 1970.”
For the globe as a whole, the warming between the late 19th century and 1940 reached an amplitude of about +0.6°C, but a cooling trend of -0.3°C during the decades after the 1940s pulled temperatures more than halfway back to the 1880s.
Benton, 1970 “In the period from 1880 to 1940, the mean temperature of the earth increased about 0.6°C; from 1940 to 1970, it decreased by 0.3-0.4°C.”
Cimorelli and House, 1974 “[B]etween 1880 and 1940 a net warming of about 0.6°C occurred, and from 1940 to the present our globe experienced a net cooling of 0.3°C.”
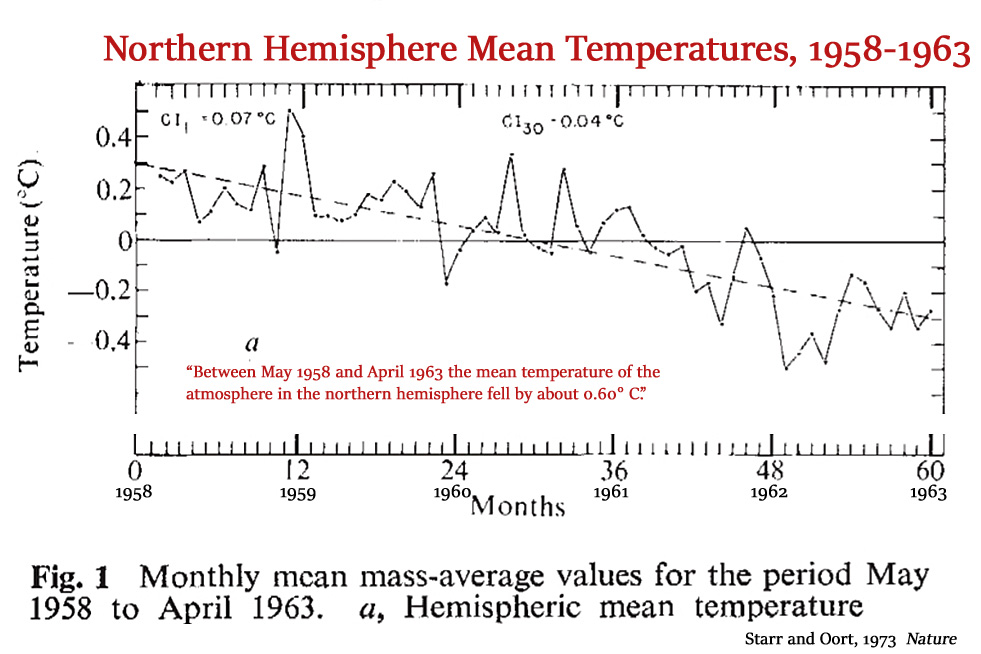
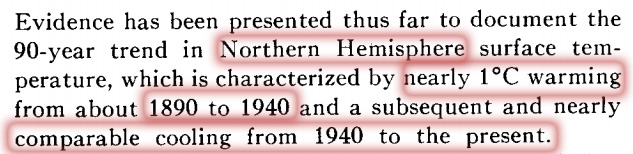
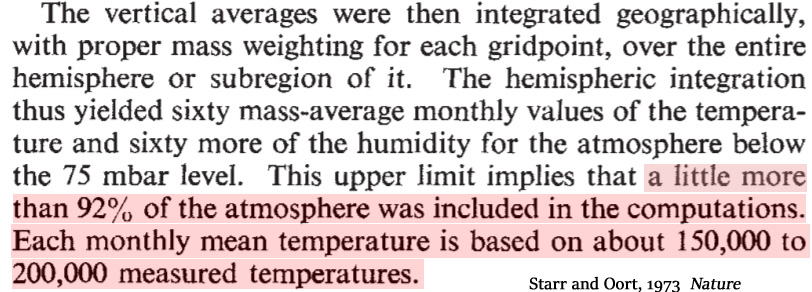
Between 1958 and 1963 alone, the National Academy of Sciences (NAS, 1975) cited an analysis of about 200,000 measured temperatures that said the Northern Hemisphere’s temperatures plummeted by -0.6°C (Starr and Oort, 1973, introductory graph above). The NAS also concluded that a “serious worldwide cooling” has a “finite probability” to befall the Earth within the next century, or by about 2075.
National Academy of Sciences, 1975 “Starr and Oort (1973) have reported that, during the period 1958-1963, the hemisphere’s (mass-weighted) mean temperature decreased by about 0.6 °C. … Since the 1940’s, mean temperatures have declined and are now nearly halfway back to the 1880 levels. … There seems little doubt that the present period of unusual warmth will eventually give way to a time of colder climate … [T]here is a finite probability that a serious worldwide cooling could befall the earth within the next hundred years. … [A]s each 100 years passes, we have perhaps a 5 percent greater chance of encountering its [the next glacial’s] onset.”
NOAA (1974) also agreed that Northern Hemisphere temperatures declined by about -0.5°C after 1940, but additionally pointed out that a new ice age may be approaching, with scientists linking the 1970s-era droughts and crop failures and ice expansion to the ongoing global cooling.
NOAA, 1974 “Many climatologists have associated this drought and other recent weather anomalies with a global cooling trend and changes in atmospheric circulation which, if prolonged, pose serious threats to major food-producing regions of the world. … Annual average temperatures over the Northern Hemisphere increased rather dramatically from about 1890 through 1940, but have been falling ever since. The total change has averaged about one-half degree Centigrade, with the greatest cooling in higher latitudes.”
“[T]he average growing season in England is already two weeks shorter than it was before 1950. Since the late 1950’s, Iceland’s hay crop yield has dropped about 25 percent, while pack ice in waters around Iceland and Greenland ports is becoming the hazard to navigation it was during the 17th and 18th centuries. … Some climatologists think that if the current cooling trend continues, drought will occur more frequently in India—indeed, through much of Asia, the world’s hungriest continent. … Some climatologists think that the present cooling trend may be the start of a slide into another period of major glaciation, popularly called an ‘ice age’.”
A decades-long cooling trend during the modern era is not convenient for those who advocate for the position that humans control the temperatures of the oceans and atmosphere by burning more or less fossil fuels, or by emitting more or less CO2.
So, instead of allowing the original temperature data showing +0.8°C warming and -0.5°C cooling (Northern Hemisphere) to remain, overseers of temperature data sets decided to gradually remove several tenths of a degree from the warming and cooling amplitudes.
Now, instead of +0.8°C of Northern Hemisphere warming between the 1880s and 1940, it’s about +0.3°C. Instead of -0.5°C of cooling between the 1940 and 1970, it’s been changed to about -0.1°C. About half a degree of temperature change was removed from both trends.
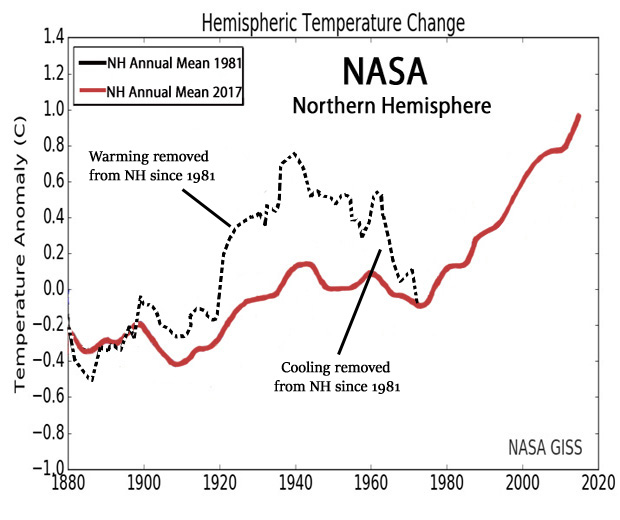
Image Source: NASA
Instead of -0.3°C of global cooling between about 1940 and 1970, NOAA now shows a pause occurred. The global cooling has been removed.
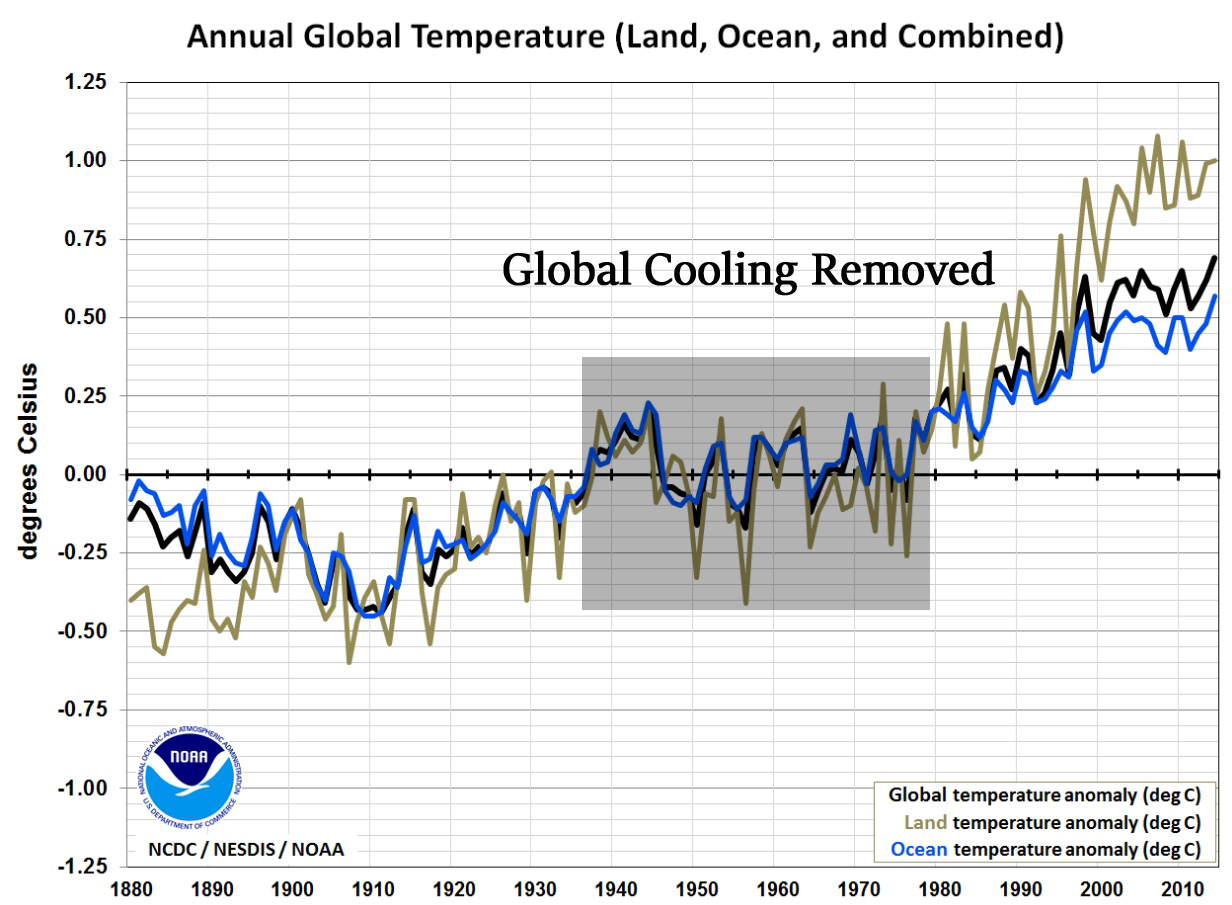
Image Source: NOAA
The problem with attempting to erase hemispheric- and global-scale cooling temperature trends is that extensive scientific records of the “serious threat” of global cooling still exists.
What follows is an abbreviated (93 papers out of over 300) compilation of the hundreds of scientific publications documenting concerns pertaining to the 1960s and 1970s global cooling and Ice Age scare.
Unlike illustrative graphs of hemispheric and global temperatures, this evidence is not so easily erased by anthropogenic global warming advocates.
1. Kukla, 1972 “A new glacial insolation regime, expected to last 8000 years, began just recently. Mean global temperatures may eventually drop about 1°C in the next hundred years.”
2. NOAA, 1974 “Many climatologists have associated this drought and other recent weather anomalies with a global cooling trend and changes in atmospheric circulation which, if prolonged, pose serious threats to major food-producing regions of the world. … Annual average temperatures over the Northern Hemisphere increased rather dramatically from about 1890 through 1940, but have been falling ever since. The total change has averaged about one-half degree Centigrade, with the greatest cooling in higher latitudes. … [T]he average growing season in England is already two weeks shorter than it was before 1950. Since the late 1950’s, Iceland’s hay crop yield has dropped about 25 percent, while pack ice in waters around Iceland and Greenland ports is becoming the hazard to navigation it was during the 17th and 18th centuries. … Some climatologists think that if the current cooling trend continues, drought will occur more frequently in India—indeed, through much of Asia, the world’s hungriest continent. … Some climatologists think that the present cooling trend may be the start of a slide into another period of major glaciation, popularly called an ‘ice age’.”
3. Cimorelli and House, 1974 “[B]etween 1880 and 1940 a net warming of about 0.6°C occurred, and from 1940 to the present our globe experienced a net cooling of 0.3°C. … [I]t has since been found that the rate of temperature increase decreases with increasing CO2 … [A]n increase in man-made global particulates by a factor of 4.0 will initiate an ice-age. In order that we safeguard ourselves and future generations from a self-imposed ice-age it is necessary that we effectively monitor global concentrations of particulate matter.”
4. U.S. Central Intelligence Agency,1974 (1) “According to Dr. Hubert Lamb–an outstanding British climatologist–22 out of 27 forecasting methods he examined predicted a cooling trend through the remainder of this century. … A number of meteorological experts are thinking in terms of a return to a climate like that of the 19th century. This would mean that within a relatively few years (probably less than two decades, assuming the cooling trend began in the 1960’s) there would be brought belts of excess and deficit rainfall in the middle-latitudes; more frequent failure of the monsoons that dominate the Indian sub-continent, south China and western Africa; shorter growing seasons for Canada, northern Russia and north China. Europe could expect to be cooler and wetter. … [I]n periods when climate change [cooling] is underway, violent weather — unseasonal frosts, warm spells, large storms, floods, etc.–is thought to be more common.”
5. Ellsaesser, 1975 “In recent years there have appeared a rash of papers claiming an upward trend in airborne particulates, which is presumed to have already reversed the alleged CO2 induced heating of the atmosphere observed between the 1880’s and 1940’s and to pose the further threat of inducing another ice age. Allusions to the trend have become so common that many authors now cite it as an accepted reality requiring neither qualification nor attribution by reference.”
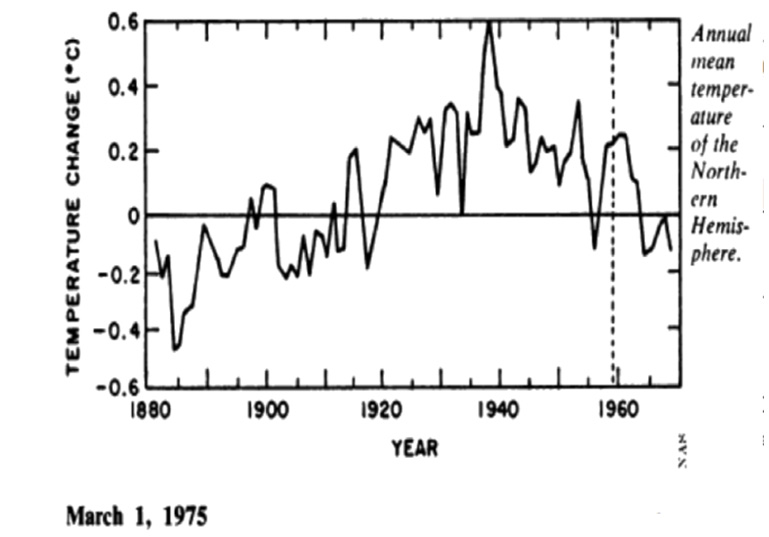
6. Agee, 1980 “Evidence has been presented and discussed to show a cooling trend over the Northern Hemisphere since around 1940, amounting to over 0.5°C. [T]he mean annual temperature of the Northern Hemisphere increased about 1°C from 1880 to about 1940 and then cooled about 0.5°C by around 1960. Subsequently, overall cooling has continued (as already referenced) such that the mean annual temperature of the Northern Hemisphere is now approaching values comparable to that in the 1880s.”
7. Benton, 1970 “In the period from 1880 to 1940, the mean temperature of the earth increased about 0.6°C; from 1940 to 1970, it decreased by 0.3-0.4°C. Locally, temperature changes as large as 3-4°C per decade have been recorded, especially in sub-polar regions. … The drop in the earth’s temperature since 1940 has been paralleled by a substantial increase in natural volcanism. The effect of such volcanic activity is probably greater than the effect of manmade pollutants.”
8. National Academy of Sciences, 1975 “Starr and Oort (1973) have reported that, during the period 1958-1963, the hemisphere’s (mass-weighted) mean temperature decreased by about 0.6 °C. … Since the 1940’s, mean temperatures have declined and are now nearly halfway back to the 1880 levels. … There seems little doubt that the present period of unusual warmth will eventually give way to a time of colder climate … [T]here is a finite probability that a serious worldwide cooling could befall the earth within the next hundred years. … [A]s each 100 years passes, we have perhaps a 5 percent greater chance of encountering its [the next glacial’s] onset.“
9. Hare, 1971 “[M]ost recent years of hemispheric surface temperatures (Mitchell, 1970) show rises of about 0.6C over the 0-80N belt between 1880 and 1940, followed by a subsequent decline to current temperatures about 0.3C above 1880. … It is clear, however, that sound meteorological estimates of the troposphere and surface warming to be expected from this increase [in CO2] (e.g., Manabe and Wetherland, 1967) do not account for the observed temperatures variations. The rise between 1880 and 1940 was much greater than the computed carbon dioxide effect, and since 1940 temperatures have actually fallen as the rise in [CO2] mixing ratio accelerated.”
10. Gribbin, 1975 “A recent flurry of papers has provided further evidence for the belief that the Earth is cooling. There now seems to be little doubt that changes over the past few years are more than a minor statistical fluctuation. … The observed cooling corresponds to a re-establishment of the ‘Little Ice Age’ which persisted for several hundred years up to the end of the nineteenth century”
11. Ellsaesser , 1974 “The 1968 AAAS Symposium on Global Effects of Environmental Pollution initiated a flood of papers supporting monotonically if not exponentially increasing pollution. The particulate increases were usually cited as at least contributing to the post 1940 cooling and possibly capable of bringing on another ice age. … Since 1945 there has been a cooling trend and we are now nearly back down to the averages of the early 19th century.”
12. Flohn, 1974 “Since about 1945 [to 1974], global cooling, on a scale of -0.01°C/yr [-0.3°C total], has reversed the warming trend of the first decades of our century. … A large majority of the participants of the symposium concluded that the present warm epoch has reached its final phase […]–the natural end of this interglacial epoch is ‘undoubtedly near’.”
13. Stewart and Glantz, 1985 (full paper) “One could effectively argue that in the early 1970s the prevailing view was that the earth was moving toward a new ice age. Many articles appeared in the scientific literature as well as in the popular press speculating about the impact on agriculture of a 1-2°C cooling. … The causes of global climate change remain in dispute. Existing theories of climate, atmospheric models, and actuarial experience are inadequate to meet the needs of policymakers for information about future climate.”
14. Curry, 1969 “At least four major periods of increased mean snowfall and cooler, cloudier summers during the last 10,000 years resulted in four periods of multiple glacial advance in the Sierra Nevada. These occurred (1) between 6000 and 7000 years ago, (2) between 2000 and 2600 years ago, (3) around 1000 years ago, and (4) between 650 years ago and the present.” [By including the last 650 years to the present, the authors strongly imply that the present 1960s-era climate had not sufficiently warmed enough to be distinguished from the post-1400 AD Little Ice Age.]
15. Denton and Karlén, 1977 “Here, the ages of Little Ice Age moraines suggest fluctuating glacier expansion between ad 1500 and the early 20th century. Much of the 20th century has experienced glacier recession, but probably it would be premature to declare the Little Ice Age over.”
16. Denton and Karlén, 1973 “Viewed as a whole, therefore, the Holocene experienced alternating intervals of glacier expansion and contraction that probably were superimposed on the broad climatic trends recognized in pollen profiles and deep-sea cores. Expansion intervals lasted up to 900 yr and contraction intervals up to 1750 yr. … Should this pattern continue to repeat itself, the [ongoing, current] Little Ice Age will be succeeded within the next few centuries by a long interval of milder climates similar to those of the Roman Empire and Middle Ages. … Holocene glacier and climatic fluctuations, because of their close correlation with short-term C14 variations, were caused by varying solar activity.”
17. Potter et al., 1981 “Sagan et al. have suggested that the cumulative impact of anthropogenic albedo changes may have contributed to global climate changes [cooling] in the past and that its effect may be continuing. … While the model computed a surface cooling of 0.6 K for the Northern Hemisphere, the global mean of ~0.2 K was substantially less than the 1 K [of anthropogenic global cooling] suggested by Sagan et al.”
18. Brinkmann, 1979 “Concern about the impact of the recent downward trend in the average surface temperature for the ‘Northern Hemisphere’ (Reitan, 1974; Angell and Korshover, 1975) on the world food supply has led to an increasing interest in possible changes in the length of the growing season (NRC, 1976; NRC, 1977). … Increased variability has been proposed to be linked to hemispheric cooling […] would cause greater extremes in weather (Bryson, 1975; Lamb, 1975).”
19. Wright, 1972 “The Holocene has already run a course of at least 10,000 yr. If it is like earlier interglacials, it will end soon, giving way to gradually developing cold conditions“
20. U.S. Central Intelligence Agency, 1974 (2) “The western world’s leading climatologists have confirmed recent reports of a detrimental global climate change. The stability of most nations is based upon a dependable source of food, but this stability will not be possible under the new climatic era. A forecast by the University of Wisconsin projects that the earth’s climate is returning to that of the neo-boreal era (1600-1850) – an era of drought, famine, and political unrest in the western world [the Little Ice Age]. … The world is returning to the type of climate which has existed over the last 400 years.”
“The climate change [global cooling] began in 1960, but no one including the climatologists recognized it. Crop failures in the Soviet Union and India during the first part of the sixties were attributed to the natural fluctuation of the weather [instead of global cooling]. … The six West African countries south of the Sahara…became the first victims of the climatic change [global cooling]. The failure of the African monsoon beginning in 1968 has driven those countries to the edge of economic and political ruin. They are now effectively wards of the United Nations and depend on the United States for a majority of their food supply. … Later, in the 1970s, one nation after another experienced the impact of the climatic change [global cooling]. • Costa Rica and Honduras (1973) – worst drought in 50 years • United States (April 1973) -“flood of the century along the Great Lakes” • Japan (1973) – cold spell seriously damaged crops • Pakistan (March 1973) – Islam planned import of U.S. grain to off-set crop failure due to drought • USSR (June 1974) – poor weather threatens to reduce grain yields in the USSR • China (June 1974) – droughts and floods • United States (July 1974) – heavy rain and droughts cause record loss to potential bumper crop“
“Because of the global cooling trend, the lower edge of the circumpolar vortex has in recent years stayed farther south during the summer […], blocking the monsoons out of regions where they are vital to the survival of hundreds of millions of people. At the same time, the vortex’s semistationary wave patterns have altered, affecting rainfall patterns in temperate regions and making the climate more variable. … [S]ome evidence exists that the cooling trend has affected wind patterns in the Southern Hemisphere as well, weather statistics are scanty. … Since the late 1960s, a number of foreboding climatic predictions has appeared in various climatic, meteorological, and geological periodicals … Early in the 1970s, a series of adverse climatic anomalies occurred: • The world’s snow and ice cover had increased by at least 10 to 15 percent. • In the eastern Canadian area of the Arctic Greenland, below normal temperatures were recorded for 19 consecutive months. Nothing like this had happened in the last 100 years. • The Moscow region suffered its worst drought in three to five hundred years. • Drought occurred in Central America, the sub-Sahara, South Asia, China, and Australia. • Massive floods took place in the midwestern United States … Within a single year, adversity had visited almost every nation on the globe.”
21. Robock, 1978 “Instrumental surface temperature records have been compiled for large portions of the globe for about the past 100 years (Mitchell, 1961; Budyko, 1969). They show that the Northern Hemisphere annual mean temperature has risen about 1°C from 1880 to about 1940 and has fallen about 0.5 °C since then … Because the magnitudes of the effects are small, and may cancel, it cannot be concluded that these high correlations show that man has produced climate change.”
22. Magill, 1980 “Recent anomaloous weather conditions of the 1970s have revealed the possibility that significant aberrations in global climate have and are occurring with serious consequences. The 1970s have seen a generally overall greater variability and instability of global weather. … [A] general consensus that a major upheaval in climate is taking place. …There is no way of determining, however, whether or not the world is entering into another major ice age“
23. Bryson and Wendland, 1975 “Since 1940, the effect of the rapid rise of atmospheric turbidity appears to have exceeded the effect of rising carbon dioxide, resulting in a rapid downward trend of temperature. There is no indication that these trends will be reversed, and there is some reason to believe that man-made pollution will have an increased effect in the future.”
24. Skeeter, 1985 “Numerous studies of global and hemispheric temperature trends have been undertaken in recent decades. One of the earliest studies was done by Willett in 1950. Willett analyzed temperature records of fifty years for 54 stations. He found that global temperatures increased 1°F (0.6°C) between 1885 and 1940. Winter temperatures during this same period were found to increase by 2.2°F (1.2°C). The most pronounced warming was in the high latitudes of the Northern Hemisphere. This warming trend conformed with the temperature trend that climatologists had expected to exist due to the increasing levels of carbon dioxide in the atmosphere. However, even though the amount of carbon dioxide in the atmosphere has continued to rise, cooling temperatures have been reported since about 1940. The first study to report this reversal in temperature trends was done by Mitchell in 1961. Mitchell updated Willett’s work through the 1950s and found that temperatures had fallen 0.2°C by the late 1950s from a peak in the early 1940s. In 1970, Mitchell stated that by the late 1960s global temperatures had fallen 0.3°C from the peak in the 1940s, approximately one-half of the prior rise. Similarly, Budyko reported that temperatures in the Northern Hemisphere fell 0.3-0.4°C between 1940 and 1976. Summaries by Schneider and Dickenson, Kalnicky, Robuck, Roberts, and Agee all report Northern Hemisphere temperatures declines by at least 0.5°C since the 1940s.”
25. Hoffert and Flannery, 1985 “[T]here is no clear indication of a monotonic warming over this period [1880-1980], as would be anticipated from the observed build up of CO2 in the atmosphere. … Indeed, the global temperatures seem to have increased from 1885- 1935, and the extent of Arctic sea ice decreased from 1925-1945. This was followed, however, by a leveling off and then a subsequent decrease in temperature. Although it is possible that the data sets are incomplete, these surface air temperatures do not appear to display the monotonic increase in global mean temperatures predicted by CO2-driven climate models.”
 26. Schneider, 1974 “In the last century it is possible to document an increase of about 0.6°C in the mean global temperature between 1880 and 1940 and a subsequent fall of temperature by about 0.3°C since 1940. In the polar regions north of 70° latitude the decrease in temperature in the past decade alone has been about 1°C, several times larger than the global average decrease. Up till now, past climatic changes (except possibly those of the last few decades [of cooling temperatures]) could hardly have been caused by man’s activities. … Some scientists already feel that particles might be responsible for the recently observed decrease in the earth’s temperature”
27. Bradley and Miller, 1972 “The climatic warming trend since the 1880s, which seems to have been global in extent and was manifested by an upward trend in mean annual (and particularly mean winter) temperatures, seems to have given way since the 1940s to a cooling trend, which is most marked in higher latitudes.”
28. Collis, 1975 “It is not clear how such favorable and relatively consistent conditions are related to the higher temperatures in this century or the peaking of temperatures around 1940. The reversal of this warming trend, however, could mark the beginning of a new ice age“
29. Haber, 1974 “A meteorologist and Director of the Institute for Environmental Studies at the University of Wisconsin, Dr. Bryson believes that the Earth is moving toward an inevitable climate change; the consequences, he says, are already being felt – tragically – in the drought-plagued belt of West Africa called the Sahel. The global climate will become cooler, Bryson predicts, the pattern of rainfall will change, and a southward movement of the subtropical deserts will take place. Since rainfall and climate affect crop growth, since crop growth affects food supply, and since food supply affects life itself, Bryson’s prediction may be of paramount importance to mankind. The drought that has gripped West Africa since the late 1960s is just one reminder that climate cannot be taken for granted.”
30. Ghil, 1975 “There has also been a concern about a possible climatic catastrophe [global cooling] being imminent because of the increase in the quantity of industrial pollutants in the atmosphere (Rasool and Schneider, 1971).”
31. Wahl, 1968 “A comparison of climatic data for the eastern United States from the 1830’s and 1840’s with the currently valid climatic normals indicates a distinctly cooler and, in some areas, wetter climate in the first half of the last century. The recently appearing trend to cooler conditions noticed here and elsewhere could be indicative of a return to the climatic character of those earlier years [1830s, 1840s] … frequently referred to as the ‘Little Ice Age’ (Brooks, 1951) apparently started during the middle of the 16th century at a time of glacial advances both in Europe and North America. … During the last two decades there appears to be some evidence that this warming trend of the last 100 yr. has changed over recently to a distinct new deterioration of the climate, leading to conditions that in the 1960’s appear to approach those which were generally found around the turn of the century or even earlier, i.e. a return to the climatic character of the 19th century … A downward trend of the mean temperature, especially in early fall, will tend to increase the likelihood of early frosts […] and thus may require changes in agricultural practices.”
32. Eichenlaub, 1970 “[A] general cooling of winter temperatures may be partially responsible for this climatic change. [M]any of the snowfall time-series curves for the lake stations show downward trends during the 1920’s and 1930’s, at the height of the recent warm period, and the more recent snowfall increase has coincided with a general world-wide cooling which has occurred in the last several decades [1940s-1970s]. Recent evidence derived from [isotope] analysis of ice core samples on the Greenland ice cap indicates a continuance of this cooling trend for another 20 or 30 years [through the 1990s].”
33. Budyko, 1969 [A] rise in temperature that began at the end of the last century stopped in about 1940, and a fall in temperature started. The temperature in the northern hemisphere that increased in the warming period by about 0.6oC then decreased by the middle of the fifties by 0.2°C.
34. Hughs, 1970 “Convection in the Antarctic Ice Sheet Leading to a Surge of the Ice Sheet and Possibly to a New Ice Age … [A] surge of the ice sheet appears likely.”
35. Fletcher, 1970 “[F]rom about 1890 to 1940 the general but irregular trend was toward growing strength of the global atmospheric circulation […] reflected by a dramatic warming of the arctic and of the North Atlantic, and aridity in the south central parts of North America and Eurasia. Conversely, recent decades have exhibited opposite trends: weakening planetary circulation, southward shifts of ice boundaries and cyclone paths and sharp cooling and different rainfall patterns over continents.”
36. Thompson, 1975 “A cooling trend in the world’s climate would have serious effects in the monsoon belts depending on whether or not the recent changes in snow and ice cover in the polar regions were responsible for the droughts in Africa and the failure of the monsoons over South Asia. The cooling and shrinking of the atmosphere at the higher latitudes is believed to have brought the subtropical anticyclones nearer to the tropical rainbelt and have caused a shifting of the monsoon belt. The regions that would be most severely affected by a continuation of the cooling trend to the year 2000 would be the higher latitudes (above 50 degrees) where spring wheat is grown and the warm band below 30 degrees latitude where rice is the principal grain crop.”
37. Fletcher, 1968 “Since the ‘little ice age’ of 1650-1840, which climaxed the cooling trend from about 1300, a new warming trend predominated which seems to have reached a climax in the 1920’s, followed by cooling since about 1940, at first irregularly but then sharply since about 1960. The periods of general warming were accompanied by increasing vigor of the westerly zonal circulation in both hemispheres, bringing a more maritime climate to the continents, more northerly cyclone tracks and a pronounced warming of the Arctic. From 1890 to 1940 the mean thickness of Arctic pack ice decreased by more than 1/3rd (Ahlmann, 1945). Since about 1940 the reverse pattern has occurred, with weakened zonal circulation, greater development of blocking anticyclones over continents in winter, more variable and southerly cyclone paths, and a colder Arctic.”
38. Schneider, 1978 “In the short term (left) the temperature has risen by about 1/2 degree Celsius since the 1880s, and from the middle 1940s to the middle 1960s it dropped about 1/4 degree. What’s wrong with this picture is that there should be large error bars on it, because there are still vast regions of oceans not covered by thermometers.”
39. Sanchez and Kutzbach, 1974 “Departures of mean annual precipitation and temperature for the decade 1961–1970 from the 1931–1960 averages are illustrated on maps of the tropical and subtropical portions of the American continents. Certain features of midlatitude climatic anomalies appear to be associated with concurrent anomalies in the tropics. There is an apparent southward shift of circulation features in this longitudinal sector of both hemispheres. A review of selected literature on latitudinal climatic shifts and atmosphere-ocean interaction suggests some similarities between the patterns of climate in the 1960s and the climate of the Little Ice Age.”
40. Hansen et al., 1981 (NASA) “The major difficulty in accepting this theory has been the absence of observed warming coincident with the historic CO2 increase. In fact, the temperature in the Northern Hemisphere decreased by about 0.5°C between 1940 and 1970, a time of rapid CO2 buildup. … Northern latitudes warmed ~ 0.8°C between the 1880’s and 1940, then cooled – 0.5°C between 1940 and 1970, in agreement with other analyses.”
41. Moran and Morgan, 1977 “In Wisconsin, the growing season became cooler and shorter from 1958 into the mid-1960s. These trends accompanied a pronounced drop in the mean annual tropospheric temperature of the Northern Hemisphere. Although Northern-Hemispheric—tropospheric temperatures continued to fall (albeit at a lesser rate) from the mid-1960s through 1973, the growing season in Wisconsin showed a general trend toward lengthening and warming. In view of concern over the potential impact of climatic variation upon agriculture, these observations point out the need for a detailed examination of the modes of translation of hemispheric—tropospheric temperature trends to climatic changes at ground level, and at smaller temporal and spatial scales.”
42. Gates, 1976 “Recorded data show that from 1940 to the early 1970s the average temperature in the Northern Hemisphere slowly decreased, with a net cooling of approximately 1°F [-0.55 °C] over the continents and less cooling over the oceans. We also know that during the period from about 1890 to 1940 the air over at least the continents of the Northern Hemisphere underwent a gradual warming of over 1.5°F [+0.83°C]. … Whether such fluctuations are primarily the result of man’s activities or are only natural climatic variations remains an open question.”
43. Andrews et al., 1972 “Baffin Island is thus a critical area in which to monitor glaciologial and climatological changes. The processes that are involved may be taking the world toward the next full glaciation. … Mean summer temperatures have declined throughout the 1960s to a level cooler than for approximately 40 yr. … On a regional basis, winter precipitation has increased by more than 30% over the last 10 yr. Both the winter-warming trend and the increased precipitation are presumably related to a change in the frequency of southerly airflow types advecting warm moist air into the region. The net effect has been for heavier falls of snow in winter and with lower summer temperatures and therefore less melting (Jacobs et al, 1972), resulting in notably increased glacierization. … Recent field observations and comparisons with aerial photographs taken late in the ablation seasons of 1949 and 1960 provide verification of a recent climatic deterioration. … [A]t least two corries snowfree in 1960 are presently occupied by incipient glaciers. … The present Neoglacial ice is nearly as extensive as the late glacial stade.”
44. Potter et al., 1975 “Of the various mechanisms suggested by which man might change the planetary climate, the removal of tropical rain forests to increase arable acreage seems to be one of the more imminent. For this reason we selected this as one of the first problems to be tested in our recently updated climate model. Bearing in mind the fallibility of computer simulations, we find overall global cooling and a reduction in precipitation: a larger tropical reduction being almost balanced by a subtropical increase.”
45. Allen et al., 1976 “In recent decades, however, a general cooling has been apparent in high latitudes. In northeast Greenland this appears to have been of the order of 0.3°C for the period 1940 to 1959“
46. Ya-feng et al., 1978 “Since the fifties the decline of temperature and the increase of precipitation have been the predominant trend in the western part of China. According to the dendroclimatological data obtained from several places, the declining temperature trend will continue till the end of this century or the beginning of the next [late 1990s to early 2000s]. From this we predict that the number of advancing glaciers may increase considerably in the days to come. But the relation between the fluctuations of glaciers and the changes of climate is very complex. The law ruling the fluctuations of glaciers is still left to a considerable extent to the systematic study and observation of us all.”
47. Ložek, 1972 “The dwindling formation of tufa spring deposits and their partial destruction both in occupied and unoccupied areas indicate that the Holocene warm interval is in the late phase. The recent slope deposits are reminiscent of early glacial sections both by their lithology and fauna reflecting existence of large open spaces. Whereas in early glacials the deforestation resulted from the change of climate, the recent one is almost entirely a product of man.”
48. McCormick and Ludwig, 1967 “Theoretical considerations and empirical evidence indicate that atmospheric turbidity, a function of aerosol loading, is an important factor in the heat balance of the earth-atmosphere system. Turbidity increase over the past few decades may be primarily responsible for the decrease in worldwide air temperatures since the 1940’s“
49. Mitchell, 1971 “Turning to the presumed effect of such large-scale background aerosol increases, a number of authors have called attention to the coincidence between these increases and a systematic decline of worldwide average temperature in the past two or three decades, and have considered the possibility of a causal connection between the two phenomena (McCormick and Ludwig, 1967; Bryson, 1968; Budyko, 1969; Bryson and Wendland, 1970; Mitchell, 1970). … With particular regard to the recent cooling trend of worldwide climate, the attribution of this cooling (or any significant part of it) to secular increases in atmospheric particles from human activities now appears unlikely, not merely on quantitative grounds (see Mitchell, 1970) but on qualitative grounds as well. Indeed, long-term increases of particulate pollution of the atmosphere by man may serve to augment, rather than oppose, other warming effects of human activities, such as the increasing carbon dioxide content and direct thermal pollution of the atmosphere. In that event the observed climatic cooling of the past quarter century emerges more persuasively than ever as a natural geophysical phenomenon, with man the innocent bystander.”
50. Shultz and Hillerud, 1978 “Kukla and associates (1977) presented “new data on climatic trends” and showed that during the last 30 years in the Northern Hemisphere, the oscillatory cooling has not yet reversed. Shultz (1972) reported on the northern migration of the armadillos and other southern vertebrates into the Kansas, Colorado and Nebraska region of the Great Plains during the 1930’s to 1950’s. Then there was a sudden reversal of the migration to the south during the 1960’s and 1970’s as cooling began to take place. … We now know that climatic changes may happen at a more rapid rate than we had thought, but much more research must be done before accurate long-range climatic forecasting can be accomplished.”
51. Kukla and Gavin, 1981 “Autumns in the Northern Hemisphere during the 1974–78 pentad were substantially cooler than in the pentad ending in 1938 [1934-’38]. Zonally averaged surface air temperature in October along latitude 80°N was 4.8°C lower, while summers were 0.6°C warmer. The recent pentad is cooler between 20 and 80°N in all seasons except spring when virtually no change was detected. The largest temperature difference was observed in autumn and winter in the high latitudes, which is a region of negative surface heat balance.”
52. Norwine, 1977 “Around 1900, a radically different climate stage set in, probably worldwide, one of warming (see Figure 1). … Well, all that was nice while it lasted, but a substantial cooling phase of deterioration has characterized the last 25 to 30 years“
53. Reitan, 1974 “Mean monthly temperatures for the Northern Hemisphere were determined for the years 1955 through 1968 following the same procedures used by H. C. Willett and J. M. Mitchell, Jr., in their studies of long-term trends. It was found that the downward trend they reported starting in the 1940s continued, though interrupted, into the 1960s.”
54. Schneider and Dickinson, 1974 “Milder climate has returned in modern times, but the optimum (warmest) condition occurred in the 1940’s, and since then, there has been a fairly rapid cooling in the high latitudes of the northern hemisphere. The relatively benign climate that we have taken for granted in the latter half of the twentieth century is not characteristic of all periods since the retreat of the ice age. … Climate-induced famine is even more serious today. Already, 6 consecutive years of drought have ravaged large populations in parts of central Africa known as the ‘Sahel.’ The drought has left millions of people near starvation, and the number of deaths approaches hundreds of thousands. There are hints that the situation may yet worsen (e.g., Winstanley, 1973; Bryson, 1973).”
55. Kukla and Kukla, 1972 “The new negative insolation regime, NIR 0/ + 8, will last for the next 8000 yr. Inasmuch within the last radiometrically dated 150,000 yr no NIR is known to correlate with generally warm interval, the prognosis is for a long-lasting global cooling more severe than any experienced hitherto by civilized mankind.”
56. Sancetta et al., 1972 “If the Eemian is taken as the analog of the present interglacial, a point in time 116,000 YBP becomes the historical model for today’s ocean, and the North Atlantic is now approaching a time of severe cooling.”
57. Bodhaine and Pueshel, 1973 “The effect of the atmospheric aerosol load on the earth’s climate has been of great concern during the past decade. McCormick and Ludwig (1967), Bryson (1968) and Mitchell (1970) suggested an increase of particulate loading would lead to a decrease in incoming solar radiation that would, in turn, lead to a general cooling of the earth’s temperature as observed during the past 30 years. “
58. King and Willis, 1975 “Starr and Oort (1973) have made a comprehensive study of meteorological temperatures, using about 10 million individual measurements of temperature, to derive the average temperature of the bulk of the atmospheric mass in the northern hemisphere for each of the 60 months between May 1958 and April 1963. If the mean seasonal variation is subtracted from the monthly values to yield the residual temperatures, it is found that the spatially averaged temperature fell by about 0.60° C during the 5 years.”
59. Idso, 1982 “A potential negative feedback relationship between atmospheric relative humidity and surface air temperature is described. Together with a recently proposed negative feedback mechanism involving atmospheric CO2, the phenomenon may be sufficient to prevent the global ice catastrophies which are a common prediction of many climate models following initial development of ice age conditions, and could well be of importance for the problem of the cool sun in Earth’s early history.”
60. Karl et al., 1984 “An appreciable number of nonurban stations in the United States and Canada have been identified with statistically significant (at the 90% level) decreasing trends in the monthly mean diurnal temperature range between 1941–80.”
61. Chaston, 1980 “Much of the Northern Hemisphere experienced a dramatic upsurge in snowfall during the 1970s as compared with the previoius decades. … Whether the “Snowy Seventies” heralded the dawn of a major cooling trend or is merely a temporary anomaly is highly debatable. One may ask fifty meteorologists for his/her opinion on climatic change and inevitably receive fifty differing opinions. This is why meteorology is so exciting: even with relatively advanced computer programs and the complete set of equations of motion of the atmosphere, we are far from truly understanding the mechanics of Mother Nature.”
62. Arrigo, 1982 “The decade of 1971-80 was 1.5°F cooler than 1931-40. The latest 40-year period of general cooling in annual values is a result of down trends in winter, summer, and fall seasonal temperatures”
63. Lamb, 1966 “The large-scale circulation of the atmosphere during the current decade […] seem to represent a recurrence of a regime that prevailed over long periods before 1895. … [M]eteorology is being confronted with a demand for climatic forecasting for which no adequate scientific basis yet exists. Nevertheless, it is an urgent practical matter to take stock of the present climatic position and to assess the probability of the new climatic regime continuing –albeit subject to normal year-to-year and decade-to-decade variations. The investigation here reported of some of the gross features of world climatic behaviour since 1960 apparently discloses an abrupt return to conditions as they were before the well-known warming of climates in the early 20th century … On this evidence, something like the climatic regime of the years since 1960 [global cooling] should probably be expected to persist till the end of the century or beyond“
64. Gordon, 1981 “Since about 1968/69 the glacier fronts have advanced by up to 158 m following a marked climatic recession [cooling] during the 1960s and early 1970s. In general, fluctuations of the glaciers have been in sympathy with prevailing climatic trends and show a relatively rapid response following temperature changes and a lagged response of at least 9 yr following precipitation changes.”
65. Starr and Oort, 1973 “Between May 1958 and April 1963 the mean temperature of the atmosphere in the northern hemisphere fell by about 0.60° C. … Each monthly mean temperature is based on about 150,000 to 200,000 measured temperatures.”
66. Stockton and Boggess, 1979 “Van Loon and Williams (1976) suggest that regional trends in surface temperature are indeed connected with long wave circulation changes, that the greatest variations appear above 500 N. latitude, but that the changes may be compensated for in other regions. For example, during 1942-1972 there appears to have been a change of -1.4°C in the mean temperature above 600 N. latitude but this appears to have been offset by a +0.20°C change over the area between 300 N. to 300 S. latitude. Budyko and Asakura (in NAS, 1975) show that for the period 1880-1969, average temperature for the northern hemisphere attained a maximum around 1940 and decreased until 1969.”
67. Barry, 1977 “Cooling over the eastern Arctic in the summers of the 1960s was pronounced, leading to lower temperatures than for 30 to 40 years in Baffin Island. … [I]n the early 1970s there was evidence that snowbanks, identifiable on aerial photographs of the Cumberland Peninsula, Baffin Island, taken in 1959, had become much more extensive as a result of increased winter snowfall and reduced summer snowmelt. Although such growth may easily be reversed by a single warm summer, the pattern is suggestive of what may happen more persistently during a prolonged phase of climatic deterioration. The cooling observed over Baffin Island during the 1960s and early 1970s appears to be closely related to shifts in the standing waves in the hemispheric westerly circulation reported by Namias (1969, 1970). … Air reconnaissance data for the last two decades shows that between about 1963 and 1972 there was a significant increase in the severity of [sea] ice conditions for July through September in Baffin Bay (Dunbar, 1972). This apparently matches without any lag the cooling (up to 1972) in the eastern Canadian Arctic noted by Bradley and Miller (1972).”
68. Wahl and Lawson, 1970 “Lamb (1966) had already suggested that it appears likely that we have passed the height of the warming episode in the first half of this century and are now reverting to a pattern characterized by lower zonal flow and intensification of the trough/ridge systems, essentially a reestablishment of the climatic character of the last century.”
69. Thompson, 1977 “Recent theoretical studies (Pollack and others, 1976) and empirical evidence (Newell, 1970) indicated that variations in the concentration of particles in the atmosphere is an important component in the heat balance of the earth-atmosphere system. Some investigators (McCormick and Ludwig, 1967; Bryson, 1968; Rasool and Schneider, 1971) attributed the decrease in mean air temperatures of the northern hemisphere since the 1940’s to an increase in the atmospheric aerosol load. … Mitchell (1975) found a correlation between an increase in the quantity of volcanically-injected stratospheric material and a decrease in mean temperatures in the northern hemisphere for the period since 1880 A.D.”
70. Absolon, 1972 “The present assemblages of Ostracods in Central Europe resemble the assemblages known from the earliest phases of Holocene. This observation supports the view that the termination of the present warm interval is to be expected in the near future.”
71. Lentfer, 1972 “Several authors have presented data indicating that sections of the Arctic have experienced warming trends prior to about 1950 and have experienced cooling trends since that time. … The mean ice thickness was one-third less and the mean air temperature 4°C higher in 1937-40 than in 1893-96. Dorf (1960) quotes Willett (1950) who states that in Spitsbergen mean winter temperatures have risen about 8°C between 1910 and 1950. Dorf (1960) also quotes Ahlmann (1953) who reports ice free ports in Spitsbergen to be open to navigation about 7 months of the year as compared with only 3 months 50 years earlier. Mitchell (1965) states that world climate during the past century has been characterized by a warming trend from the 1880’s to the 1940’s. Thereafter, the warming trend appears to have given way to a cooling trend that has continued to at least 1960 with some evidence that it was continuing in 1965.”
72. Palmer, 1973 “This article reviews the information on the climatic effect of carbon dioxide and aerosols and outlines man’s part in contributing to their occurence. Recent downward trends in the average surface temperature of the biosphere has lead some scientists to conclude that albedo increases due to the effect of aerosol backscatter is the causative mechanism. While there is evidence for and against this hypothesis, this paper emphasizes that albedo changes due to aerosol modification of cloud cover may be a more significant mechanism for explaining temperature trends.”
73. Angell and Korshover, 1977 “Between 1958 and 1965 there was a significant cooling averaging about 0.3°C over much of the globe, but since 1965 the temperature variations have been small.”
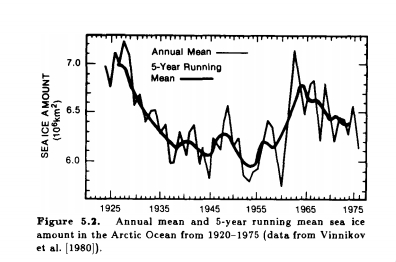
74. Bryson and Ross, 1977 “The authors of this paper show, based on some examples from climatic history, that climate can change rapidly and that these changes can have drastic effects on world food production, as well as on other aspects of economic and cultural life. The historical examples are the Arctic expansions of around 1900 B.C. and A.D. 1200. The authors also describe a presently occurring Arctic [ice] expansion and its world-wide effects on climate to date.”
75. Newell, 1974 “Changes in the poleward energy flux by the atmosphere and ocean as a possible cause for ice ages … At present the ocean carries an appreciable fraction of the transport, for example about three-eighths at 30°N. In the cold mode it is suggested that the ocean carries less, and the atmosphere more, than at present. The between the modes is seen as a natural imbalance in the atmosphere-ocean energy budget with a gradual warming of the ocean during an Ice Age eventually cluminating in its termination. At the present the imbalance is thought to correspond to a natural cooling of the ocean, which will lead to the next Ice Age.”
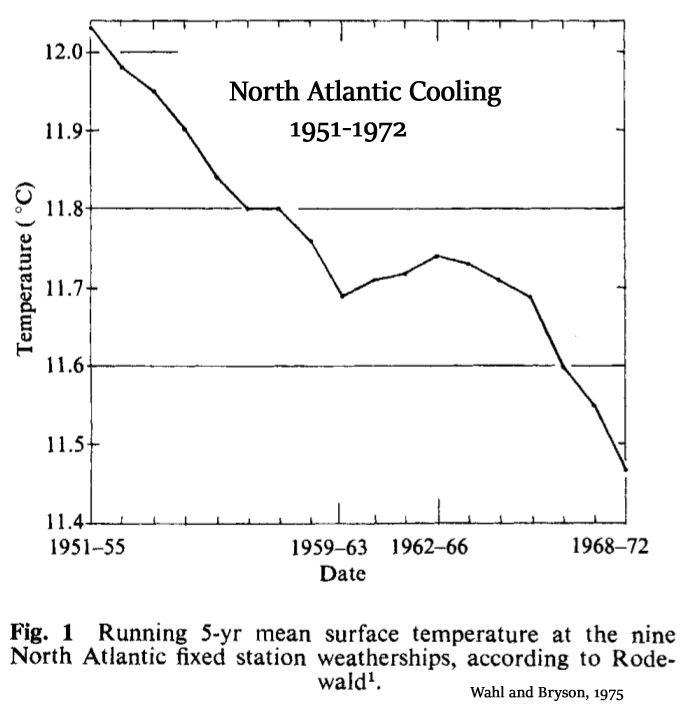
76. Wahl and Bryson, 1975 “Recent changes in Atlantic surface temperatures … a distinctive decrease of 0.56 °C from the 1951–55 period to the 1968–72 period“
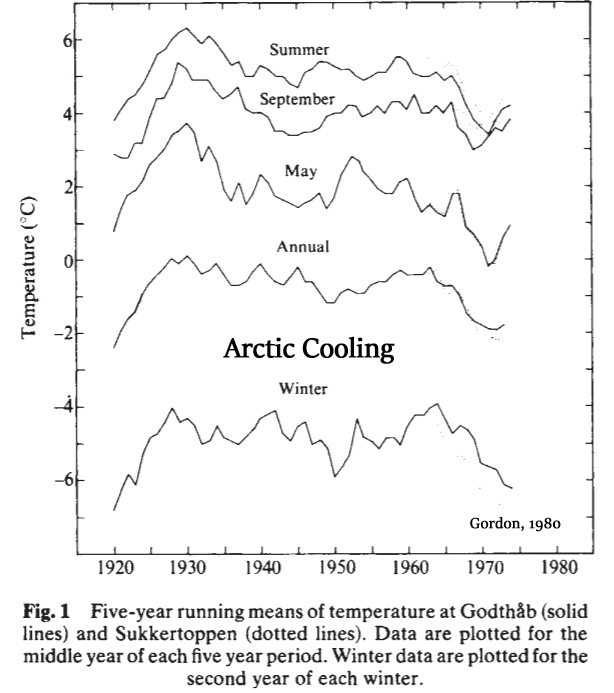
77. Gordon, 1980 “Recent climatic trends in the Arctic have been characterised by a general cooling between the mid-1950s and the late-1960s, followed by a return to warmer conditions in the early 1970s (refs 1,2). Throughout the Canadian Arctic Archipelago and at Thule in north-west Greenland a marked decrease in summer temperature occurred after 1963, and winter precipitation increased. These changes were accompanied by a lowering of the average July freezing level height by as much as 500 m, decreased glacier mass loss and increased glaciation. “
78. Williams, 1978 “It has been suggested that the Laurentide Ice Sheet originated with extensive perennial snow cover, and that the snow cover affected climate so as to aid ice-sheet development. In this study, a large increase in extent of October 1st snow cover in the Canadian Arctic from 1967–1970 to 1971–1975 is compared to changes in October means of other climate variables. Over the area of snow-cover expansion, mean surface air temperature decreased by up to 3°C, mean 500-mbar height was lowered by over 60 m, and precipitation was increased by up to a factor of two. These effects, if applied to the entire summer, together with the temperature change computed by Shaw and Donn for a Northern Hemisphere summer insolation minimum (the Milankovich effect), can account for glacierization of the Central Canadian Arctic.”
79. Barrett, 1971 “Changes in concentration of those atmospheric constituents which contribute to the planetary albedo can give rise to climatic alterations. … These computations show that substantial depletions of irradiance can result from moderate to heavy particulate loadings, and that an increase in man-made particulate emissions by a factor of 50 or more could give rise to a general cooling of serious magnitude.”
80. Mörner, 1972 “When Will the Present Interglacial End? … We are now living under interglacial climatic conditions, the Present Interglacial of Flandrian Interglacial Age. It will certainly be followed by the Future Ice Age. … Several articles in this volume provide material strongly in favor of Alternative II of Fig 1. This would mean we are now rapidly approaching a future situation equivalent to the “Pre-Brörup Stadial” characterized by continental glaciation over Fennoscandia and the Kolar Peninsula and tundra or park-tundra conditions in most of the rest of Europe (the”Pre-S. Pierre Stadial” of North America was similarly characterized by continental glaciation over northeastern North America and alpine glaciations in the mountain regions of the West Coast).”
81. Miles, 1978 “The cooling of the Northern Hemisphere since 1940 has been variously interpreted as the overture to the next Ice Age, the effect of industrial pollution in the atmosphere or of a decline in the solar output. Are we in a position to judge between these various interpretations and to make a prediction for the next few decades?”
82. Verma et al., 1984 “Dewey and Heim (1981) have studied variations in N.H. [Northern Hemisphere] seasonal snow cover based on satellite observations and have found that there was an overall increase in snow-cover area from 1966 to 1980. They also noted that there has been a trend toward earlier, more extensive snow cover in the fall and slower ablation in the spring. Thus, during the last 3 decades, larger winter cooling anomalies, supported by observations and model studies, have greatly influenced the climate pattern – made it cooler and unstable.”
83. Borisov, 1969 “Soviet climatologists are vitally concerned with the problem of ameliorating [warming up] the climate of Siberia and other northern lands as a means of developing these regions for an expanding population. P. M. Borisov, a candidate in geographic sciences, Moscow, examines one means of warming the climate by the transport of Atlantic Ocean water across the Arctic Basin. This could be done by pumping water out of the Arctic Ocean at the Bering Strait, thus accelerating the flow of warmer Atlantic water into the basin. Flow direction would be controlled by means of a dam across the Bering Strait. Borisov predicts dramatic improvement in Arctic climate would result.” [Climatologists were concerned/interested in warming the climate via geoengineering in 1969.]
84. Flecher, 1969 “Since the “little ice age” of 1650-1840, which climaxed the cooling trend from about 1300, a new warming trend predominated which seems to have reached a climax in this century, followed by cooling since about 1940, at first irregularly but more sharply since about 1960.”
85. Battan, 1970 “This article give a brief review of Soviet articles on weather modification published since about 1964. … Budyko (1964) examined various questions dealing with climate modification. He noted that the melting of the arctic ice would have important effects on climate and stated that there are a number of ways by which the arctic ice cap can be annihilated. … When this happens, it is claimed, winters will become less severe, the growing season will be lengthened, the probability of early autumn and late spring frosts will be decreased, the number of arid years will be decreased and the northern boundary of many types of vegetation will be shifted northward.” [Scientists proposing climate modifications (annihilating Arctic sea ice) to warm the planet.]
86. Hollin, 1969 “Wilson suggests that in the Pleistocene the surge coolings were sufficient to trigger the northern ice ages. If so, interglacial pollen profiles should show rapid but temporary marine transgressions beginning at the break of climate. Evidence suggesting such transgressions occurs in England and the United States, but is still insufficient to disprove explanations such as local downwarping. There is no evidence yet for surges in Wisconsin or Post-glacial time. There is some evidence that the Antarctic Ice Sheet is currently building up, but this could be a response to a Post-glacial accumulation increase rather than the prelude to a surge.”
87. Holdren and Ehrlich, 1971 Global Ecology: Readings toward a rational strategy for man [pgs. 76,77] … “It seems, however, that a competing effect has dominated the situation since 1940. This is the reduced transparency of the atmosphere to incoming light as a result of urban air pollution (smoke, aerosols), agricultural air pollution (dust), and volcanic ash. This screening phenomenon is said to be responsible for the present world cooling trend—a total of about .2°C in the world mean surface temperature over the past quarter century. This number seems small until it is realized that a decrease of only 4°C would probably be sufficient to start another ice age. The effects of a new ice age on agriculture and the supportability of large human populations scarcely need elaboration here. Even more dramatic results are possible, however; for instance, a sudden outward slumping in the Antarctic ice cap, induced by added weight, could generate a tidal wave of proportions unprecedented in recorded history.”
88. Kalnicky, 1974 “The mean temperature for the Northern Hemisphere had a warming trend from 1890 to 1950 and a cooling trend since 1950. The eastern and central United States had colder temperatures in 1961–1970 than in 1931–1960.”
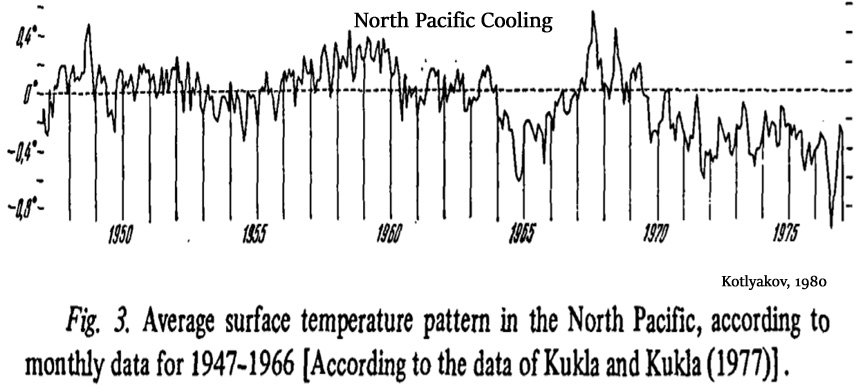
89. Kotlyakov, 1980 “His latest results (Kukla et al., 1977) indicate clearly a cooling of most of the Northern Hemisphere in the period from 1950 to 1975, reaching 0.1-0.2°C per decade (Fig. 3).”
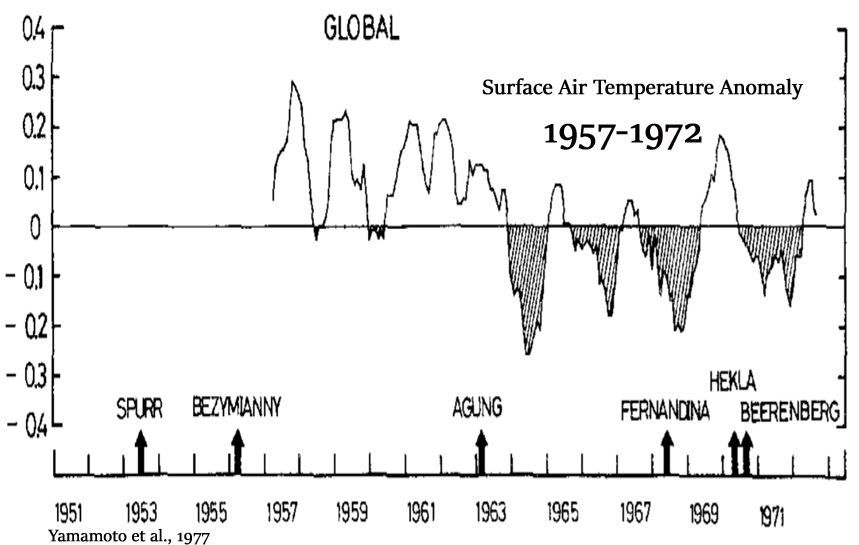
90. Yamamoto et al., 1977 “Fluctuations of the global climate have been one of the most interesting problems in meteorology. Recently the concern for this problem is increasing in relation to the possible climatic impact by man-made global air [aerosol] pollution. … By Willett’s method, Mitchell presented the trend of the global mean of the surface air temperature, which shows a warming from the decade of 1880 to that of 1940, and afterwards cooling.”
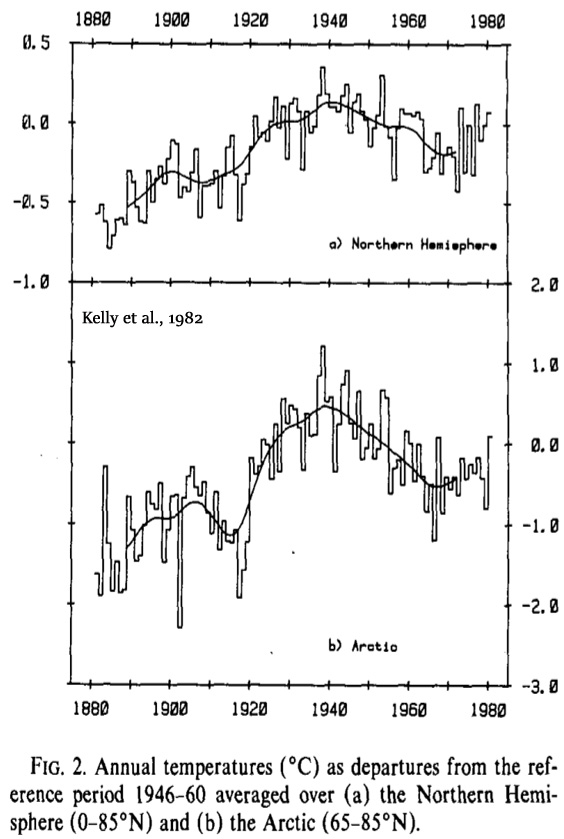
91. Kelly et al., 1982 “The 1880’s [in the Arctic] was the coolest decade during the study period, and was followed by a warming of 0.65°C to the 1900’s. Cooling then occurred; the average temperature during the 1910’s was ~0.45°C below the 1900’s. This cooling is less noticeable in the Northern Hemisphere average temperature d. Rapid warming affected the Arctic during the late 1910’s and 1920’s, with the average temperature peaking during the late 1930’s. A warming of ~1.60°C occurred between 1917 and 1921 [Arctic]. While the average temperature of the Arctic was at a maximum in the 1930’s, the average temperature of the Northern Hemisphere was greatest in the decade of the 1940’s. After the 1930’s, temperatures fell: a drop of 0.85°C occurred up to the 1960’s.”


Kenneth Richard, you are tireless. Please keep doing what you do – honesty will win.
As shown above when NASA proved to have NO skill in explaining the temperatures from the 1920s through to the 1970s they just erased the record to hide their embarrassment of a lack of expertize. Pathetic.
They still have zero skill in explaining the temperature records hence all the fluff and nonsense from them — hottest year ever and all the rest of their blather. Mere political puppets.
This compilation is excellent and complements the material presented many times by Tony Heller at Deplorable Climate, where his preferred methods are showing original measured temperatures in the US before adjustment, or Greenland and Antarctic icecap extents, or sea-ice extents, and comparing them to historical newspaper reports and articles. He shows that adjusted temperatures are at odds with historical reported facts.
The message is the same: the attempt in Scientific American to discredit global cooling from the 40’s to the 70’s is a complete revision of history, of grotesquely Orwellian proportions.
https://www.scientificamerican.com/article/how-the-global-cooling-story-came-to-be/
[…] Changing Scientific Consensus […]
So far as a U.S. federal agency is concerned, tampering with climate records is criminal. Here is the applicable section of the United States Code:
18 U.S. Code § 2071 – Concealment, removal, or mutilation generally
(a) Whoever willfully and unlawfully conceals, removes, mutilates, obliterates, or destroys, or attempts to do so, or, with intent to do so takes and carries away any record, proceeding, map, book, paper, document, or other thing, filed or deposited with any clerk or officer of any court of the United States, or in any public office, or with any judicial or public officer of the United States, shall be fined under this title or imprisoned not more than three years, or both.
(b) Whoever, having the custody of any such record, proceeding, map, book, document, paper, or other thing, willfully and unlawfully conceals, removes, mutilates, obliterates, falsifies, or destroys the same, shall be fined under this title or imprisoned not more than three years, or both; and shall forfeit his office and be disqualified from holding any office under the United States. As used in this subsection, the term “office” does not include the office held by any person as a retired officer of the Armed Forces of the United States.
The classic “it’s all fake and manipulated” claim again …
But thanks for showing us that “there is an ice age right around the corner” crowd was active in 70s too 🙂
Regarding changing consensus: I hope that is the norm. Or are we still living in a flat earthers world and don’t know how to put stuff into orbit and get a better picture of Earth’s atmosphere and inner workings?
Being stuck with old “knowledge” and denying that any knew discoveries might exist that contradict your way of thinking, is not very scientific …
Do you think that the 0.8 C of warming from 1880-1940 and the -0.5 C of cooling from 1940 to 1970 was fake? Or was that real? If real, why was the +0.8 C changed to +0.3 C, and why was the -0.5 C changed to -0.1 C — using the exact same raw data?
Considering that interglacials typically last about 10,000 years, and the one we’re in now is in year 11,700, do you think the National Academy of Sciences, NOAA, the U.S. government, and the “large majority” of scientists at the time were wrong to assume that the present interglacial was reaching its final stages? Do you think they were wrong to link global cooling to increased drought intensity, “violent” weather patterns, floods, crop failures, starvation?
Flohn, 1974
https://www2.meteo.uni-bonn.de/bibliothek/Flohn_Publikationen/K227-K255_1972-1977/K242a.pdf
“Since about 1945 [to 1974], global cooling, on a scale of -0.01°C/yr [-0.3°C total], has reversed the warming trend of the first decades of our century. … A large majority of the participants of the symposium concluded that the present warm epoch has reached its final phase […] – the natural end of this interglacial epoch is ‘undoubtedly near’.”
Who are these made-up people you are referring to who deny “knew discoveries” might exist? Do you ever stop concocting straw men?
As I’ve shown you numerous times, you are looking at the changes between specific dates. Overlaying the two curves the correct way shows what is really going on (the amount and the periods of adjustmenst). All keepers of adjusted temperature records have detailed FAQs about the adjustments and give perfectly good reasons for doing so, but you choose to ignore that and cry foul play instead. The only thing left to say to a behaviour like this is the default “stay in wonderland and continue talking about unicorn farts” reply.
Do you play the game of Roulette? Have you ever seen those players who note down past combinations and try to predict the future combinations from them without knowledge about the currect physical state the playing field? That’s almost the same as predicting an ice age from “they typically appear after 10000 years”.
They probably came to this conclusion because of incomplete information. We know a little bit more about our planet and its climate than 40 years ago, don’t you think?
That’s your field, Kenneth.
“new” … auto correct on the smartphone.
The current shape shows +0.3 C of NH warming between 1880 and 1940. As of 1981, the 1880-1940 warming was textually identified as +0.8 C. Where did that half a degree disappear to?
This appears to be as substantive as it gets. I am baffled that you continue to view referencing fantasy animal flatulence as persuasive.
So you think all these papers are “fake news”,Sebastian?
If so you are a bigger denier than I thought.
Or is someone paying you to be obtuse?
“Or is someone paying you to be obtuse?” – B&T to SebH
If anyone is paying him, they aren’t getting their money’s worth.
Like everything “green”….
🤢
I would say if they are paying him to be obtuse he is excellent value for money!
Why would I?
Do you financially benefit to be such a ****?
‘Being stuck with old “knowledge” and denying that any knew discoveries might exist that contradict your way of thinking, is not very scientific …
We say that every time you try to diss or demonize any research which proves your ‘consensus’ science wrong, sebbie-boi, and there is a growing mountain of it! Corals and mollusks NOT bothered by ‘acidification,’ hurricanes and tornados NOT increasing in frequency or severity, evidence that the Ozone hole has ALWAYS existed… the list is endless and YOU are stuck with ‘old knowledge.’
It’s also fascinating how you guys are able to turn that around and imagine others are behaving like you clearly do. The self projections are strong with you …
I notice you did not refute any of the claims I made… because you CAN’T.
Seb,
If that is all you have to offer then consensus ‘climate science™’ has NOTHING.
Nothing but empty failed predictions based on misinterpreted and mis-adjusted temperature records.
Nothing but emotional pleas to ‘save the world’ when the world does not need such saviors.
Nothing to offer but nature damaging ‘Green’ remedies from government subsidized crony capitalists.
Apparently it requires a time machine to show how just how wrong you are/were. I hope you are young enough to realize that without a time machine (in a few decades).
Seb —
Rubbish!
You have NOTHING!
“You just wait. Someday you’ll be sorry!” – paraphrasing SebH
I don’t think so.
https://junkscience.com/2017/11/joe-bast-scientific-critique-of-usgcrps-2017-climate-science-special-report/
+10! 🙂
Top of the page – Hansen . .
“… Northern latitudes warmed – 0.8°C between the 1880’s and 1940, then . . .”
Shouldn’t that be, “warmed +0.8 C between . . ?”
It should have been a ~ (meaning approximately). Changed. Thanks.
‘“there is an ice age right around the corner” crowd was active in 70s too’
The point is that in many cases it is the same crowd now saying the exact opposite, claiming infallibility and responding with fury when the contrary evidence that THEY originally produced is brought up!
Fortunately, the internet makes such historical revision much harder to get away with.
To live up to the ‘No Tricks’ tag, you should perhaps include this paper.
“RESULTS reported by Starr and Oort reflect changes which have occurred in the instruments, in the methods used at the observing stations to interpret radiosonde measurements, and from the setting up of new stations, rather than from real geophysical changes.”
https://www.nature.com/articles/249540a0
And the quote from NAS is a tad, um selective. Here’s the full para …
“There seems little doubt that the present period of unusual warmth will eventually give way to a time of colder climate, but there is no consensus with regard to either the magnitude or rapidity of the transition. The onset of this climatic decline could be several thousand years in the future, although there is a finite probability that a serious worldwide cooling could befall the earth within the next hundred years. … ”
Or does selective quotation not qualify as a ‘trick’ around here??
Actually, by claiming it is the “full” perspective from NAS, it would appear that your “selective quotation” of the NAS position in 1975 could be construed as somewhat tricky.
National Academy of Sciences, 1975:
Aside from local climatic effects, such as those due to urbanization, these studies have not yet established the existence of a large-scale anthropogenic climatic impact (Machata, 1973). Like their numerical simulation counterparts, such studies are made more difficult by the high levels of natural climatic variability and by the lack of adequate observational data.
[T]he mechanics of the climatic system is so complex, and our observations of its behavior so incomplete, that at present we do not know what causes any particular climatic change to occur.
What we cannot identify at the present time is how the complete climatic system operates, which are its most critical and sensitive parts, which processes are responsible for its changes, and what are the most likely future climates. In short, while we know something about climate itself, we know very little about climatic change.
From the analysis of the limited data available, we can identify a number of areas in which man’s actions may be capable of altering the course of climatic change. Chief among these is interference with the atmospheric heat balance by increasing the aerosol and particulate loading and increasing the C0 2 content of the atmosphere by industrial and commercial activity. While present evidence indicates that these are not now dominant factors, they may become so in the future.
A striking feature of the instrumental record is the behavior of temperature worldwide. As shown by Mitchell (1970), the average surface air temperature in the northern hemisphere increased from the 1880’s until about 1940 and has been decreasing thereafter. Starr and Oort (1973) have reported that, during the period 1958-1963, the hemisphere’s (mass-weighted) mean temperature decreased by about 0.6 °C. In that period the polar and subtropical arid regions experienced the greatest cooling. The cause of this variation is not known, although clearly this trend cannot continue indefinitely… The well-documented warming trend of global climate beginning in the 1880’s and continuing until the 1940’s is a continuation of the warming trend that terminated the Little Ice Age. Since the 1940’s, mean temperatures have declined and are now nearly halfway back to the 1880 levels.
One may still ask the question: When will the present interglacial end? Few paleoclimatologists would dispute that the prominent warm periods (or interglacials) that have followed each of the terminations of the major glaciations have had durations of 10,000 ±2000 years. In each case, a period of considerably colder climate has followed immediately after the interglacial interval. Since about 10,000 years has elapsed since the onset of the present period of prominent warmth, the question naturally arises as to whether we are indeed on the brink of a period of colder climate. Kukla and Matthews (1972) have already called attention to such a possibility. There seems little doubt that the present period of unusual warmth will eventually give way to a time of colder climate, but there is no consensus with regard to either the magnitude or rapidity of the transition. The onset of this climatic decline could be several thousand years in the future, although there is a finite probability that a serious worldwide cooling could befall the earth within the next hundred years.
The question remains unresolved. If the end of the interglacial is episodic in character, we are moving toward a rather sudden climatic change of unknown timing, although as each 100 years passes, we have perhaps a 5 percent greater chance of encountering its onset.
These NAS comments would not appear to support the position that climate science has been settled, that humans exert fundamental greenhouse control on ocean temperatures by burning more or less fossil fuels. In fact, NAS clearly stated that “What we cannot identify is…what are the most likely future climates” because “at present we do not know what causes any particular climatic change to occur.”
And in reference to your claims that this list involves “trickery”, the text for each citation was meant to be abbreviated. Including the entirety of this section of NAS’s climate change analysis would have made the article too long…and it is already far too long as it is. But thank you for allowing me to flesh out the greater context of the selected quotation from NAS. I’m not sure how this has helped you, though.
LOL I just love your use of the strategic elipsis. Here’s your take-away from Gibben 1975.
” … The observed cooling corresponds to a re-establishment of the ‘Little Ice Age’ which persisted for several hundred years up to the end of the nineteenth century”
And with the bit you excised
“But there is as yet no evidence that further cooling is likely in the immediate future”.
Which rather supports the Connolley et al position.
Were you aware of the rebuttal to Starr & Oort?
So we have a paper that says the observed 3-decades-long cooling represents the re-esablishment of the Little Ice Age, but evidence is lacking that the cooling is likely to persist in the “immediate future”. This, to you, indicates that Gibben (1975) endorses the position that humans exert fundamental greenhouse control of ocean temperatures by emitting more or less CO2? Is this endorsement implicit or explicit?
Apparently this “rebuttal” was viewed as inconsequential by the National Academy of Sciences. Their report was published in 1975, and instead of citing the 1974 paper, they cited the Starr and Oort (1973) paper that used 200,000 measurements to establish the NH cooled by -0.6 C during 1958-1963. Why do you think it is NAS decided to cite the older Starr and Oort paper rather than the newer “rebuttal” paper? Did they have an agenda?
And when you say image source: NASA, what does that mean? The image at the link looks nothing like your graph.
Hmmm, I see what you mean. But I’m sure he’ll sort it out. Until he does, here’s the motivation for how the graph in black got to be the one in red.
“This destruction of the data did not happen by accident. Climategate E-mails show that scientists removed the 1940’s warmth on purpose.
From: Tom Wigley
To: Phil Jones
Subject: 1940s
Date: Sun, 27 Sep 2009 23:25:38 -0600
Cc: Ben Santer
It would be good to remove at least part of the 1940s blip, but we are still left with “why the blip”.
di2.nu/foia/1254108338.txt”
So, the best you can do is criticize Kenneth for what looks like a citation error, when NASA scoundrels are committing deliberate fraud?!
Oops, here’s the link to my source on that.
https://realclimatescience.com/2016/12/how-to-create-global-warming-fraud-at-nasa/
It wasn’t a citation error. The shape of the 2017 red trend line for the NH used in this graph comes from NASA:
https://data.giss.nasa.gov/gistemp/graphs/graph_data/Hemispheric_Temperature_Change/graph.png
I thought that might be it, which is why I wrote “looks like.”
Thanks.
I had thought it would be rather obvious that the shape of the 2017 red trend line for the Northern Hemisphere emanates from this graph of the NH from NASA…
https://data.giss.nasa.gov/gistemp/graphs/graph_data/Hemispheric_Temperature_Change/graph.png
…which is found by clicking on the link for the word “NASA”.
The dotted black trend line came from NASA’s (Hansen et al.) 1981 trend line, which had been linked to above that.
The two graphs were combined to show the changes to the NH temperature trajectory that have been facilitated since 1981.
The two graphs were combined. Really?
In the ‘Hansen’ graph the temperatures drop from around 0.4C to approx -0.1C 1940-1970.
In your ‘combined’ version it’s magically morphed to from around 0.7C down to -0.1.
In this plot the drop is around 0.2 to -0.2C. Nothing much erased.
Image source: NASA. Heh.
Three subpanels were therefore formed, and a report was issued in February
1973 by the subpanel concerned with monthly to decadal time scales
(W. L. Gates, Chairman), which is the basis of the main body of the
present report
Do your homework.
[…] – Before 1960s-’70s Global Cooling Was Erased, It Caused Droughts, Crop Failures, Glacier Advance, I… […]
Hey to anyone who visits this. Please understand that all the info cited here is about 40 years old. When did most of you get your first cell phone? oh and the moon landing was 1969 and since we’ve put a record amount of satellites in space since, collected decades worth of evidence, and science progresses. You wouldn’t cite pre Galileo heliocentric model as a cover-up of flat earth, would you? Actually, I bet some of you would, and that’s pretty terrifying.
All I’m asking is use the resources you have to find credible evidence to support or hinder your ideas. In the absence of that, please understand you either spent your life uncovering the truths of our world or you didn’t and as such should probably leave it to experts. You wouldn’t take your car in and tell the veteran mechanic whats wrong would you, if that’s the case I hope you’d fix it at home. But hey you took it to them because this is what they do.
Lastly, don’t cherry pick data. That’s rule number 1 in science.
Rule #2 – don’t identify with your theories. If you identify with them, your unlikely to support new evidence that could contradict your theory.
That’s the point. At that time, scientists were warning the world about global cooling, as surface temperatures had been declining for decades.
What year should we begin to look at Arctic sea ice extent? Do you prefer a different year than 1979…or is choosing 1979 cherry-picking? How about we start from 3,000 years ago…
https://notrickszone.com/wp-content/uploads/2017/11/Arctic-Sea-Ice-Extent-North-of-Iceland-3000-Years-Moffa-S%C3%A1nchez-and-Hall-2017.jpg
Would that be cherry-picking?
According to the IPCC, humans began influencing the Earth’s energy budget with their CO2 emissions in the year 1750. Is it right or wrong for the IPCC to cherry-pick like that?