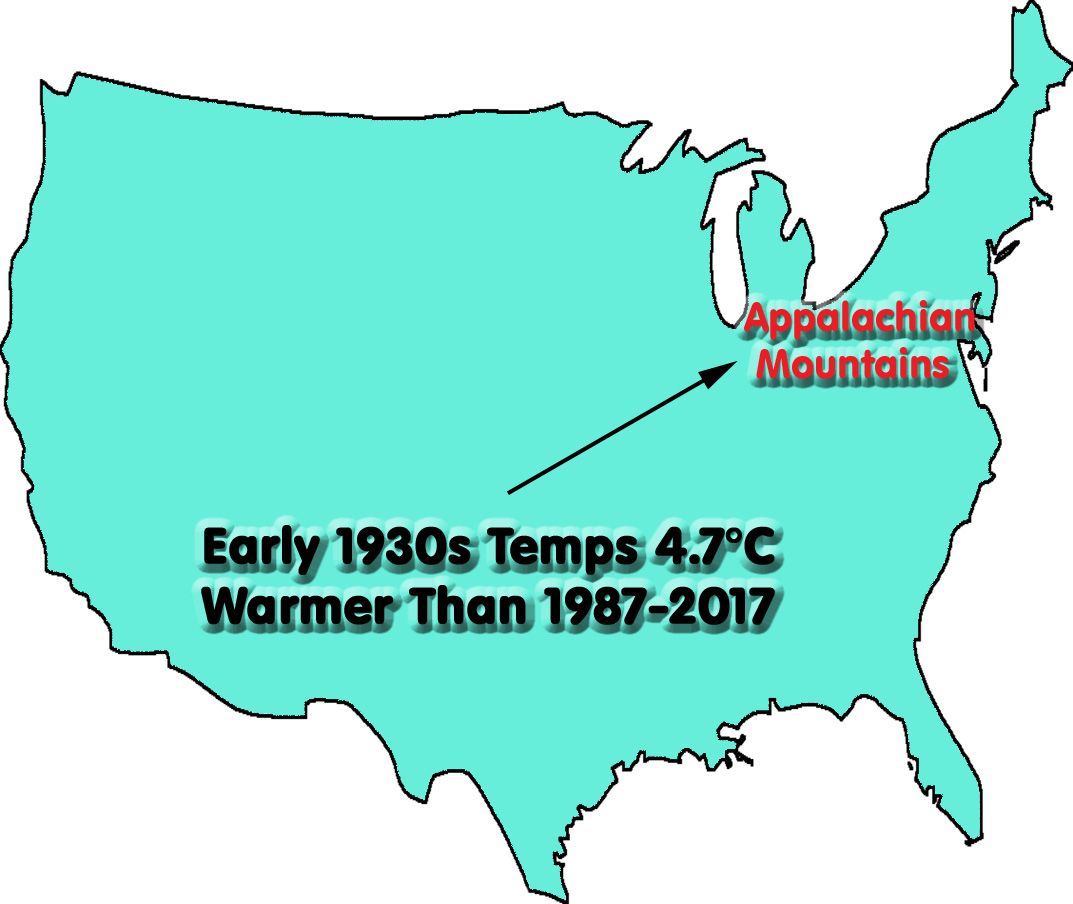
A new scientific study says surface temperatures in the Northeastern U.S. (Appalachian Mountains) have undergone a significant long-term cooling trend since the early 20th century, complicating the detection of a clear anthropogenic global warming (AGW) signal for the region.
According to Eck (2018), the two coldest Appalachian winters since 1910 were recorded in recent years (2009-’10 and 2010-’11), and 9 of the 10 warmest winters occurred prior to 1960.
In the early 1930s, Appalachian winters were 4.7°C warmer than they have been during the last 30 years (1987-2017).
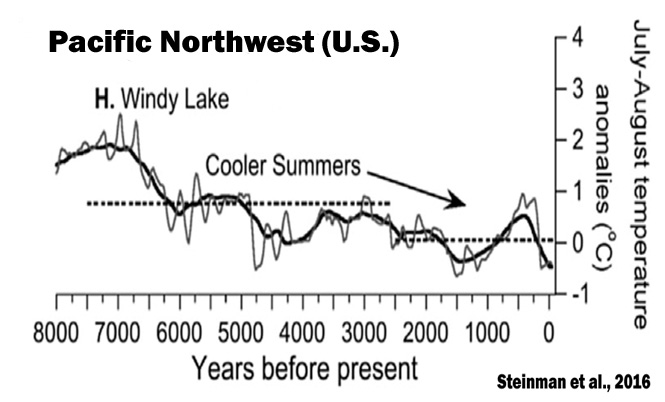
Several other recently-published papers also reveal a long-term cooling trend not only for the Northeastern U.S. (Eck, 2018), but the Southeastern U.S. (Rogers, 2013; Christy and McNider, 2016), the Central U.S. (Alter et al., 2017), and the Southwestern and Northwestern U.S. (Loisel et al., 2017; Steinman et al., 2016).
In other words, the regions in the continental United States that are less affected by urbanization biases and artificial instrumental heating may not be responding to “global” warming or to the rise in anthropogenic CO2 emissions as climate models have suggested.
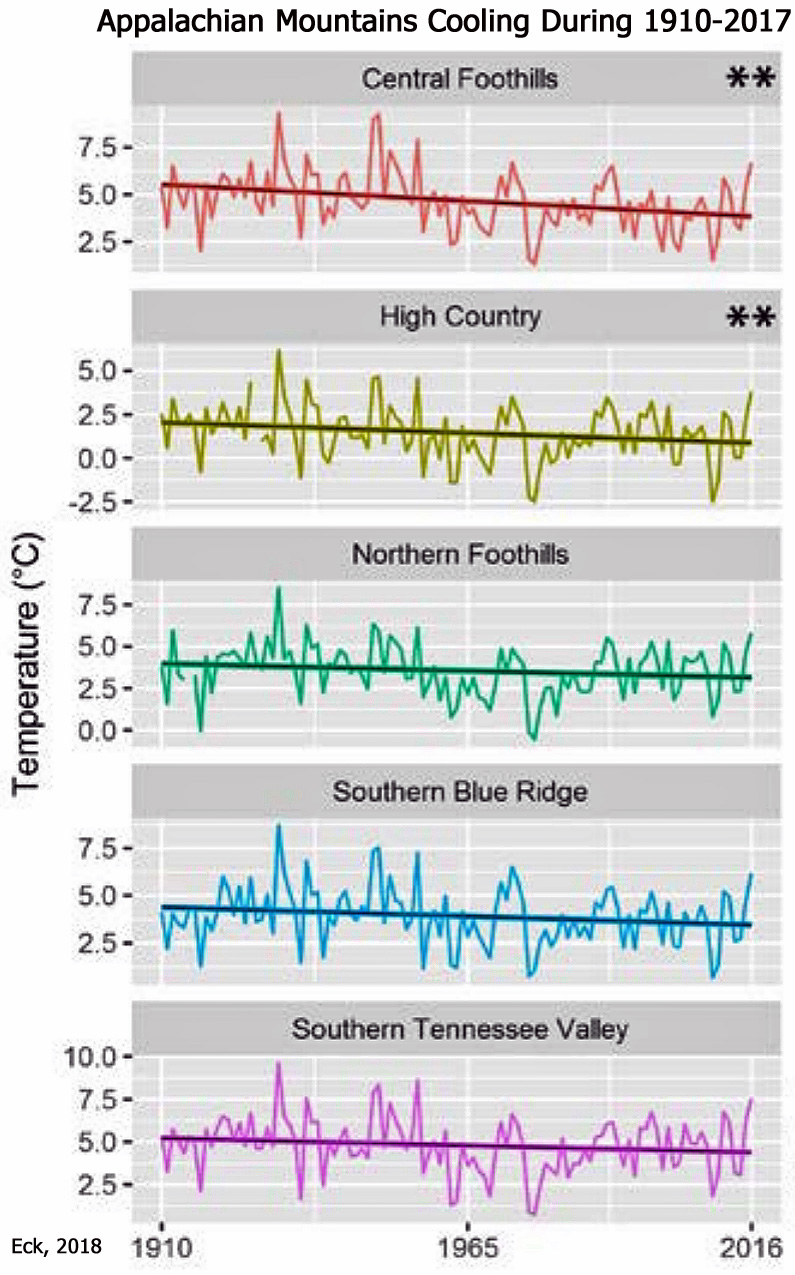
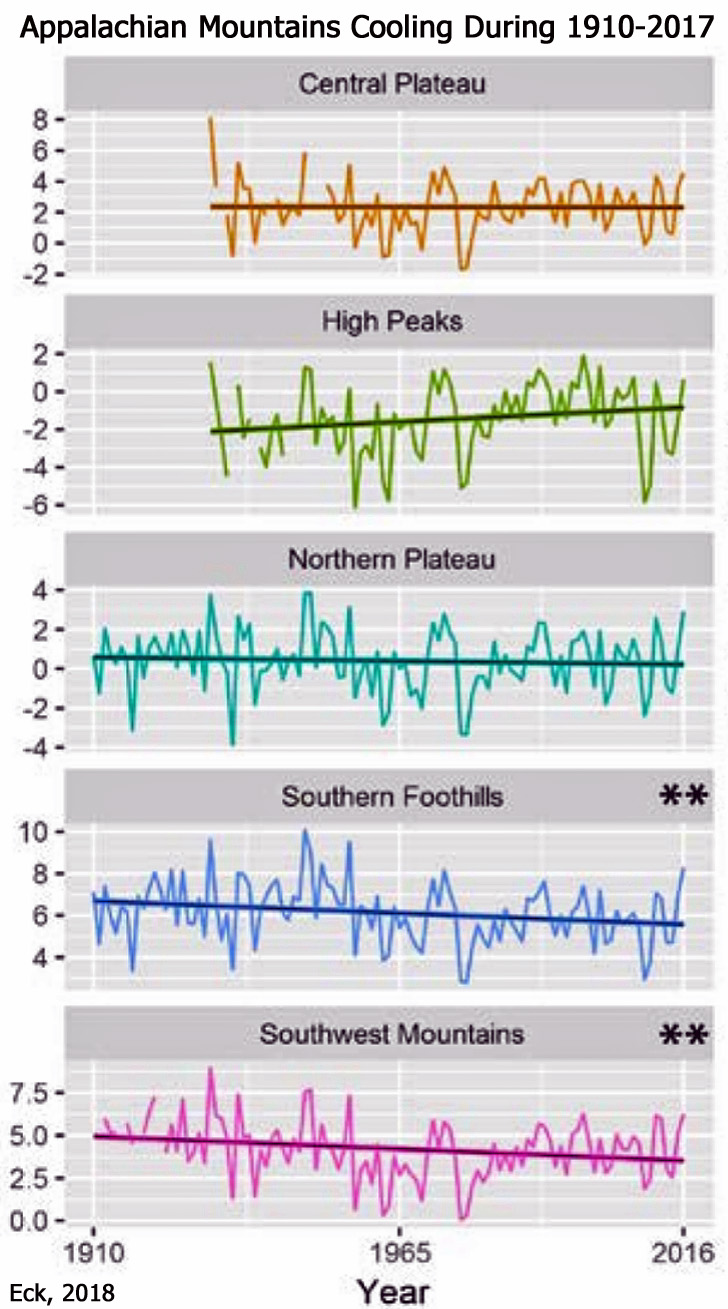
Eck, 2018
“[A] majority (12/14) of the regions within the SAM [Southern Appalachian Mountains] have experienced a long-term decline in mean winter temperatures since 1910. Even after removing the highly anomalous 2009-2010 winter season, which was more than two standard deviations away from the long-term mean, the cooling of mean winter temperatures is still evident.”
“Higher winter temperatures dominated the early 20th century in the SAM [Southern Appalachian Mountains] with nine of the ten warmest winter seasons on record in the region having occurred before 1960.”
“The 1931-1932 winter season, the warmest on record, averaged 8.0°C for DJF [December-February], nearly 4.7°C higher than the 1987-2017 normal mean winter temperature of 3.3°C.”
“Despite the 2016-2017 winter season finishing with the highest mean temperatures (5.7ºC) observed in the SAM [Southern Appalachian Mountains] since 1956-1957, there have been several years of anomalous negative temperature anomalies, with the 2009-2010 (0.3ºC) and 2010-2011 (1.2ºC) winter seasons finishing as two of the coldest on record for all regions.”

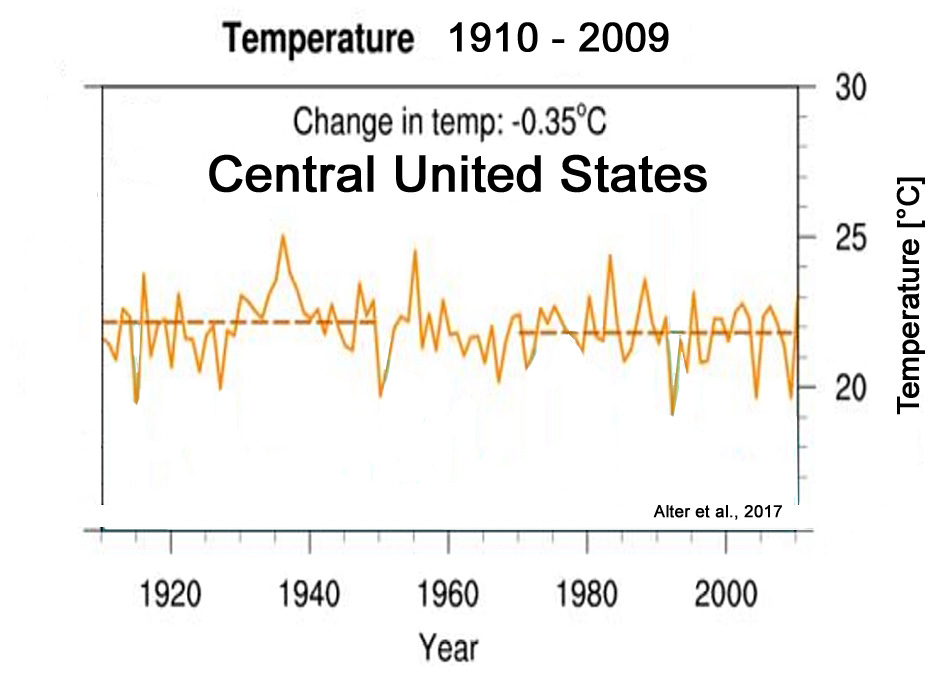
Central U.S. Cooling (-0.35°C) Since 1910
Alter et al., 2017
“In the central United States … observational data indicate that rainfall increased, surface air temperature decreased, and surface humidity increased during the summer over the course of the 20th century concurrently with increases in both agricultural production and global GHG emissions.”
“From 1910- 1949 (pre-agricultural development, pre-DEV) to 1970-2009 (full agricultural development, full-DEV), the central United States experienced large-scale increases in rainfall of up to 35% and decreases in surface air temperature of up to 1°C during the boreal summer months of July and August … which conflicts with expectations from climate change projections for the end of the 21st century (i.e., warming and decreasing rainfall) (Melillo et al., 2014).”
“Thus, it seems that GHG emissions do not contribute greatly to the regional changes in summer climate that have been observed in the central United States.”
Southeastern U.S. Cooling Since 1890s
Rogers, 2013
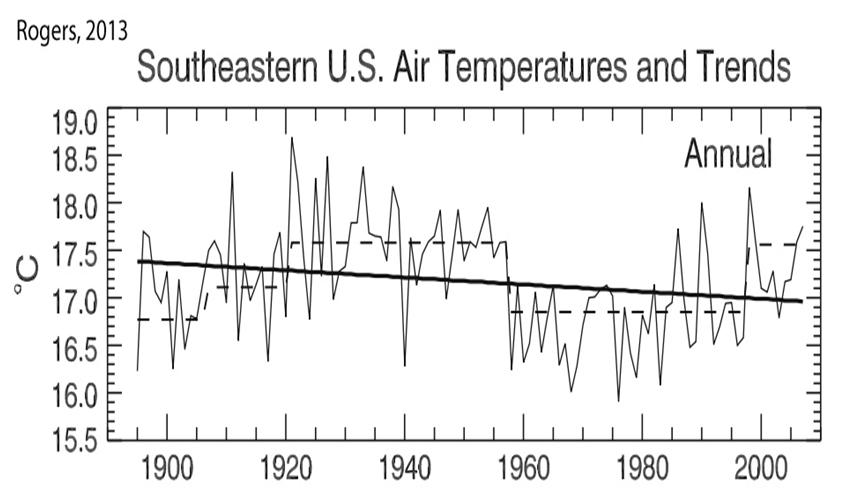
Christy and McNider, 2016

Long-Term Cooling Trend In The Western U.S.
Loisel et al., 2017
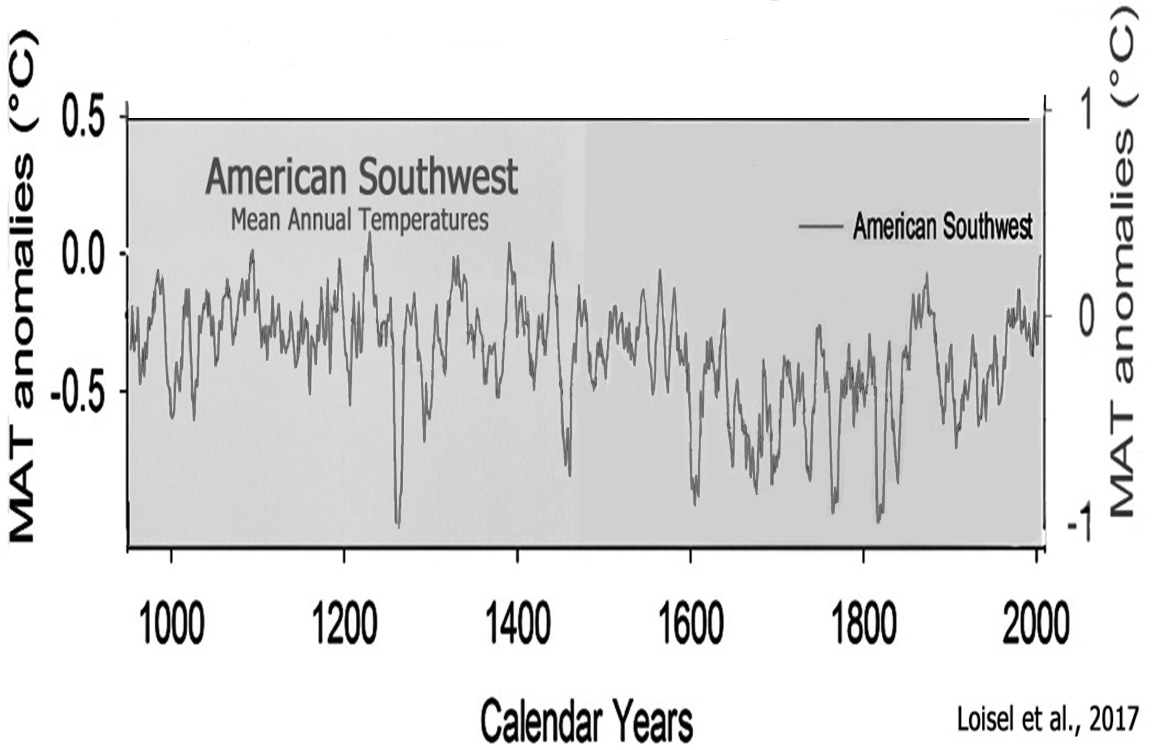
Steinman et al., 2016


Is this data before or after “adjustments” and “homogenisation”?
Either way it is yet another piece of evidence that CO2 works in mysterious ways.
Most likely not in the way our deluded friend, Seb@stian, thinks.
Obviously the warming from global warming isn’t the same everywhere and you can even get cooling in places. When only looking at surface temperatures that can also skew the image. The important variable is heat content. Is the global heat content increasing or falling? What do you think?
P.S.: I too want to know if this is from adjusted temperatures or if they used the raw data and did their own adjustments.
It’s odd to read that “global” warming leads to cooling in places. If it’s not global in scope because large regions of the Earth haven’t been warming (the North Atlantic, the Southern Ocean, the Canadian Arctic, the entire Antarctica continent, most of the continental U.S., Southern South America, Alaska, Greenland [no net warming since the 1930s], the Mediterranean region…), why in the world is it called global warming?
Considering that the early 20th century was (substantially) warmer than the post-1950s period in the Northeastern U.S., and that the Central U.S., Southeastern U.S., and Western U.S. have either been cooling or not warming, what was the causal mechanism for the early 20th century warming, when CO2 concentrations hovered around 300 ppm and anthropogenic emissions were flat and low (~1 GtC/year)? Why was glacier melt and sea level rise more substantial before the 1950s than after if the cause of the post-1950s glacier melt and sea level rise was anthropogenic CO2 emissions? What caused the the pre-1950s climate changes?
The globe warms = global warming. Is heat content increasing or not, Kenneth?
Does this graphic (surface temperature anomaly 2017) look to you like there has been widespread cooling?
https://neo.sci.gsfc.nasa.gov/servlet/RenderData?si=1743099&cs=rgb&format=JPEG&width=720&height=360
From:
https://neo.sci.gsfc.nasa.gov/view.php?datasetId=GISS_TA_Y&date=2017-12-01
I don’t know Kenneth, it doesn’t look anything like that (year 1935)
https://neo.sci.gsfc.nasa.gov/servlet/RenderData?si=1536629&cs=rgb&format=JPEG&width=720&height=360
I know the solution to this seemingly different perception of reality, the NASA data must be fake. Right? 😉
roflmao.
You know GISS et al are a manic load of fabricated BS, massive adjustments of past recorded temperatures to get rid of the 1940s peaks which were in reality, much the same as now. A total ANTI-SCIENCE deception, design for low-intelligence twerps.
It suits the rest of your posts. !!
Time to put up or shut up seb.
Produce empirical evidence of CO2 warming of our oceans and of our atmosphere.
Prove that the very slight , but highly beneficial warming since the cold period in the 1970’s has been anything but totally beneficial and is not a TOTALLY NATURAL response to the strong solar maxima of the latter half of last century.
Prove that the increase in atmospheric CO2 has been anything but a total benefit to the biosphere.
Or remain forever an EMPTY prattling brain-washed parrot.
But the globe is not warming. Some regions are warming. Some regions are cooling. Most of the Earth’s oceans below 2000 m depths have been cooling since the early 1990s, for example:
https://notrickszone.com/wp-content/uploads/2016/09/Holocene-Cooling-Pacific-Atlantic-Indian-Oceans-WunschHeimbach14-copy.jpg
Relative to what starting point? Since the Medieval Warm Period and Holocene Thermal Maximum, the Earth’s heat content has been decreasing. For many regions across the globe (North Atlantic, Southern Ocean, Eastern Pacific, Canada, U.S., Greenland, Antarctica, much of South America, Alaska….), temperatures were as warm or warmer in the 1930s and 1940s than in recent decades.
The same holds true for the Northern Hemisphere, where there has been no net warming since the 1940s:
https://notrickszone.com/wp-content/uploads/2017/06/Holocene-Cooling-Northern-Hemisphere-Schneider-2015-Wilson-2016-Long.jpg
–
https://notrickszone.com/wp-content/uploads/2017/04/Holocene-Cooling-Northern-Hemisphere-Stoffel-2015.jpg
–
https://notrickszone.com/wp-content/uploads/2017/08/Holocene-Cooling-Northern-Hemisphere-20th-Century-Christiansen-Ljungqvist-2012.jpg
–
Can you answer my question about the causal mechanism for the pre-1950s warming and higher rates of glacier retreat and sea level rise than in recent decades for many regions of the globe?
“Can you answer my question”
And the squirming and worming seb-evasions will continue.
One day we ought to make a full list of the questions he has been incapable of answering.
A weight tome, for sure.
Not sure even Kenneth is up to that task 😉
Start will his ABJECT INABILITY to present any empirical evidence of CO2 warming of oceans or atmosphere.
92% of the U.S. temperature stations have been removed from the temperature record since 1979, almost all from rural locations….
https://notrickszone.com/wp-content/uploads/2017/02/NOAA-Data-Manipulation-USA-Temperature-Station-Removal-Since-1979.jpg
Prior to their “conversion” it was acceptable to write about the problem of artificial warming due to urban bias…
Karl and Jones, 1989
http://journals.ametsoc.org/doi/pdf/10.1175/1520-0477(1989)070%3C0265%3AUBIAAS%3E2.0.CO%3B2
“Results indicate that in the United States the two global land-based temperature data sets have an urban bias between +0.1°C and +0.4°C over the twentieth century (1901-84). … At present, only rough estimates of the potential impacts of urbanization can be given. This includes an urban bias in the Hansen and Lebedeff (1987) [NASA] data over the United States between 0.3°C and 0.4°C over the 20th century, which is larger than the overall trend in the United States over this period. … To our knowledge, the United States is the only large area of the globe where the magnitude of this bias has been thoroughly studied.”
“The magnitude of this urban bias in two global, land-based data sets was found to be a substantial portion of the overall trend of global and regional temperatures.”
—
Kukla et al., 1986
http://journals.ametsoc.org/doi/pdf/10.1175/1520-0450(1986)025%3C1265%3AUW%3E2.0.CO%3B2
The average annual difference of the trends is about +0.11°C per decade [of non-climatic warming due to urban location]. … The average difference between trends [urban siting vs. rural] amounts to an annual warming rate of 0.34°C/decade. … The reason why the warming rate in subset D is considerably higher [may be] that the rate may have increased after the 1950s, commensurate with the large recent growth in and around airports. … Our results and those of others show that the urban growth inhomogeneity is serious and must be taken into account when assessing the reliability of temperature records.”
Of course it is. On average it is warming.
Oh boy … and relative to the formation of our Sun it decreased too. Take 1870 as starting point, paint a graph. Take 1960 as starting point. Take 2010 as starting point (some here are imagining the coming ice age, so heat content surely must be falling by now).
All three graphs do not end in the year 2017 and we discussed these graphs a lot in the past. Yet you continue to use them as if the would show that nothing happened in modern times 😉
Can you? Apparently, we are now back at the good old “if climate changed in the past when CO2 wasn’t increasing as much, how can CO2 be the cause of the modern climate change” argument. Do you really pretend that you can’t imagine how that might work? Do you really think that all temperature changes must be of natural origin because they were in the past?
Regarding your question, what if CO2 induced global warming started back then and the small “cooling” episode in between was caused by lots of aerosols from all those dirty industries emerging after the world wars were over? I hope that is not news to you …
Paper about increasing night temperatures and decreasing day temperatures as one would expect from a global dimming:
http://onlinelibrary.wiley.com/doi/10.1029/2006GL028031/full
Another paper about the effects aerosols have:
http://www.cgd.ucar.edu/ccr/publications/meehl_additivity.pdf
But the globe is not warming.
So that’s how we get “global” warming? By averaging all the cooling regions in with the warming regions and seeing what the sign is for the net difference? Is that how we characterize “global” in any other context?
Let’s say the polar region north of the Arctic circle 90°N has warmed by +0.9°C since 1979. Let’s say the polar region south of the Antarctic circle 90°S has cooled by -0.7°C since 1979. Would it be more semantically accurate to say that both the 90° polar regions have been warming since 1979 (because the N has warmed slightly more than the S has cooled), or that the northern polar region has warmed while the southern polar region has cooled? Assuming you’re reasonable enough to agree that the latter is semantically more accurate and less misleading, why do you nonetheless think it should be called global-scale warming when only parts of the globe have warmed and parts of the globe have cooled?
———————————-
Put another way, here is a graph of the Northern Hemisphere’s temperatures since 1990. Notice that about 2/3rds shows (strong) warming, and about 1/3 shows (mild) cooling: Kretschmer et al., 2017
And here is a graph of the Southern Hemisphere’s temperature, which shows about 4/5ths cooling, and 1/5th warming since 1979: Purich et al., 2018
Now, if we add up the averages for the entire globe using these two graphs (noting the different starting points) and we find that the net difference is +0.2°C since 1990, does this mean it’s fair to characterize these trends as representative of global-scale warming?
Relative to what starting point?
The following is just an abbreviated short list. There are hundreds more like these.
Since 1870s – no warming
Greenland – no warming
New Zealand – no warming
Antarctica – no warming
North Atlantic – no warming
Western Pacific – no warming
India/Western Himalaya – no warming
Pakistan – no warming
Turkey – no warming
Himalayas/Nepal – no warming
Siberia – no warming
Portugal – no warming
NE China – no warming
SW China – no warming
South China – no warming
West China – no warming
Southern South America – no warming
Canada (B.C.) – no warming
Canada Central – no warming
Since 1940s/50s – no warming
Northern Hemisphere – no warming
Arctic Region – no warming
Greenland – no warming
South Iceland – no warming
North Iceland – no warming
Alaska – no warming
New York – no warming
Rural U.S. – no warming
Northern Europe – no warming
Western Europe – no warming
Mediterranean Region – no warming
Finland and Sweden – no warming
East Antarctica – no warming
North Atlantic – no warming
Western North Atlantic – no warming
Brazil – no warming
SE Australia – no warming
Southern South America – no warming
Andes Mountains – no warming
Chile – no warming
Can you answer my question about the causal mechanism for the pre-1950s warming and higher rates of glacier retreat and sea level rise than in recent decades for many regions of the globe?
Yes, I can…and entirely without anthropogenic CO2 emissions. Now, instead of avoiding the question again, please explain the causal mechanism for this 1920s-1950s explosion in glacier retreat and sea level rise…and why it dramatically decelerated afterward.
https://notrickszone.com/wp-content/uploads/2016/10/Holocene-Cooling-Global-Glacier-Melt-Contribution-To-Sea-Level-Rise-copy.jpg
—
Global Ocean Heat Content Changes, 1900-2010
Then explain the causal mechanism for the dramatic rise (1.2 C) in near-surface (0-20 m) ocean heat (global) between 1900 and 1945 (Gourteski et al., 2012), and then explain what caused these heat values to only rise by another 0.3 C in the 65 years after 1945. Why was the heat increase so much more substantial before 1945 than after, SebastianH? If anthropogenic emissions are what drive changes in the Earth’s heat, why was there a dramatic deceleration immediately after anthropogenic CO2 emissions began rising?
Stop dodging questions like these and answer them.
“Take 1870 as starting point”
ROFLMAO… surely seb eats his feet again . !
So, take the end of the COLDEST PERIOD IN 10,000 years as the starting point.
Heck you would sure hope EVERYWHERE would get at least a bit warmer.
But as Kenneth shows… many places HAVEN’T.
We surely are very much just a TINY, but HIGHLY BENEFICIAL amount of “maybe” regional warming, above that COLDEST of periods in the Holocene.
And this is what all the carrying on about “the world is going to fry” and all that other alarmist NONSENSE, and the utter waste because of the ANTI-CO2 Agenda, is all about.
The AGW pseudo-science is a load of mindless fantasy and mind-numbed twaddle, which even the Grimm Bros would be embarrassed to have come up with.
I’m sure any rational, sane, human being who hasn’t been severely brain-hosed by the cAGW ranting and propaganda, would totally agree.
Yes.
Yes, global economy, global car sales, global whatever. And sometimes we even use words like “world”, to describe something that doesn’t include the entire world equally, but nevertheless concerns everyone/-thing.
Greenland: https://notrickszone.com/wp-content/uploads/2015/06/Greenland-Temperature.jpg
New Zealand:
https://www.niwa.co.nz/our-science/climate/information-and-resources/nz-temp-record/seven-station-series-temperature-data
Should I go on?
I did, but apparently you stopped reading. Another pattern of yours.
That’s the beginning of human influence. The “cooling” (less warming) afterwards is caused by global dimming, aerosols in the air. It started warming considerably again after countries passed clean air acts. We are still at a rather high level though, so more warming is to come if we manage to reduce our emissions.
Also anthropogenic emissions (not CO2). See links above in the part of the comment that you skipped.
Stop giving out homework assignments and skipping over important parts of comments.
So that’s how we get “global” warming?
So that we are clear on your perspective, then, when you see a graph of the Southern Hemisphere that looks like this…
Purich et al., 2018
…you think it’s accurate to say that the Southern Hemisphere has been warming since 1979…since the warming has been global?
please explain the causal mechanism for this 1920s-1950s explosion in glacier retreat and sea level rise
So, to be clear, humans caused the 1900-1945 dramatic heat increase with their CO2 emissions, the 1945-1975 cooling with their aerosol emissions (which overcame the forcing from CO2 emisssions), and the 1975-present warming with their CO2 emissions and aerosol-reduction policies. In other words, humans control the temperatures of the oceans and air and glacier melt and sea level rise via changes in their emissions rates. Did natural factors play a role in any of these trends? If so, what?
“Stop giving out homework assignments ”
Poor seb,
can’t do his homework.
Refuses to even try.
Can’t produce any empirical evidence to back up ANYTHING he fantasises.
Can’t even produce any empirical evidence that CO2 warms the oceans or the atmosphere.
Just EMPTY. !!
“That’s the beginning of human influence”
ABSOLUTE FANTASY RUBBISH from seb, as always..
.. there is ZERO PROOF that there is any human influence.
Zero proof that the SLIGHT but HIGHLY BENEFICIAL warming out of the COLDEST period in 10,000 years is anything but NATURAL.
You have NOTHING seb..
…just your normal ZERO PROOF yapping !!
Kenneth,
I feel the need to point out that the image you linked here is barely the Southern Hemisphere. As it goes to roughly latitude 50, the area in that circle is only 23.4% of the Southern Hemisphere. Again, simple math …
I’ll gladly repost the paper I linked to above:
http://www.cgd.ucar.edu/ccr/publications/meehl_additivity.pdf
Naturally that is probably fake science to you since it doesn’t agree with your perception.
And since AndyG55 brought it up again:
That is actually not true according to this paper:
https://www.nature.com/articles/nature25464 (Reconciling divergent trends and millennial variations in Holocene temperatures, Marsicek et al 2017)
It’s a large portion of the Southern Hemisphere. Does it show more of a cooling trend or a warming tend since 1979, SebastianH? Would you say that both the northern polar region and the southern polar region have been warming since 1979, or would you agree that it’s more accurate to say that the southern polar region has been cooling?
Less than half the ocean is contained in the 0-2000 m layer. The ocean heat content below 2000 meters has been cooling overall since 1992…
https://notrickszone.com/wp-content/uploads/2017/06/Holocene-Cooling-Pacific-Atlantic-Indian-Oceans-Wunsch-Heimbach-2014.jpg
Do you think we should just skip this portion of the Earth’s overall heat energy in our assessment of “global” warming? You do indeed exclude that after all. Why?
Well, we have many hundreds of papers that do not align with the perspective that today’s ocean heat content and surface temperatures (and glacier melt and sea level highstands and sea ice concentrations…) are unprecedented in the last 11,000+ years. In fact, we have a substantial amount of evidence that today’s climate indices are not even close to being outside the range of natural variability.
“according to this paper:”
Based on an assumption driven MODEL seb and one dubious set of data. You should be more sceptical or at least read what you link to before posting to avoid more embarrassment.
Real science principles are foreign you, aren’t they seb.
You basically have NO IDEA . !!
“Although our results depend on a single source of palaeoclimatic data (pollen) and a single climate-model simulation……”
Reminds me of the time when Michael Mann used two (?) trees from North America and extrapolated the temperatures for the entire Northern Hemisphere from them to concoct his infamous hockey stick.
I doubt that SebastianH would agree that a single source of paleoclimate data — tree rings — should be used to tabulate NH temperatures for the last few millennia. Especially when it shows the Earth cooled after the 1970s.
https://notrickszone.com/wp-content/uploads/2017/08/Holocene-Cooling-Northern-Hemisphere-Briffa-2002-Divergence.jpg
23.4% is not very large, it’s less than a quarter of the Southern Hemisphere.
I’d say the outer ring (from lat 50° to lat 60°) doesn’t show any trend, so we are left with 13.4% of the Southern Hemisphere that contains a big land mass and a rather big spot with a warming trend. Area-wise the cooling of the surface is a very small part, wouldn’t you agree?
I can’t believe that we are now debating about the meaning of the word global. It’s accurate to say that parts of the southern polar region have been cooling. However …
That image pretty clearly shows that the southern oceans are warming below 2000 m … so is the SH really cooling?
Here is a paper of a scientist who includes the “below 2000m heat content” (see figure 6):
http://advances.sciencemag.org/content/3/3/e1601545.full
Apparently, it increases too on a global scale. You see, not excluded at all. But you see, the main part of heat content increase happens in the upper layers.
Quantity over quality?
Whenever this topic is brought up by you, you post your “non-hockey-stick” graphs that conveniently don’t show the last few decades and once matched with the instrumental record clearly show how large the current increase is compared to past increases. We have no evidence for what you are claiming. That’s all just proxy data with large error factors and smoothed over time. As AndyG55 always points out regarding OHC measurements, how can we know past OHC with any accuracy when modern measurement methods with enough sensors only exist for a few decades back? Why would we trust those “guesses” more than the actual measurements?
Have you found out yet why tree ring proxies indicate a cooling? What is the cause for that divergence? Could it be global dimming? Less light reaching trees messes up the ring building process?
https://www.nature.com/articles/ncomms4836 (Arctic tree rings as recorders of variations in light availability – Stine 2013)
Or is it still your opinion that the temperature really decreases as the proxies say and the instrumental record is completely fake?
No, I do not think this graph only shows a small area of cooling. Cooling encompasses at least 80% of the area. It’s amazing how much your biases affect your “assessment”.
Antarctica hasn’t warmed in the last 100 years, nor in the last 38 years. West Antarctica has been cooling dramatically since 1999. What warming on what land mass are you even talking about?
According to the IPCC, modern warming is “globally synchronous”. Obviously, this is not accurate.
The North Atlantic has been cooling dramatically since 2005 (here, here, here, here).
The Pacific Ocean and Southern Ocean have been cooling since 1970 (here and here).
The Arctic has not been warming since 2005. The Indian Ocean hasn’t warmed since the 1980s.
Greenland was warmer during the 1870s-1940s period than the 1940s-2015 period.
Since 1940s/50s – no warming
Northern Hemisphere – no warming
Arctic Region – no warming
Greenland – no warming
South Iceland – no warming
North Iceland – no warming
Alaska – no warming
New York – no warming
Rural U.S. – no warming
Northern Europe – no warming
Western Europe – no warming
Mediterranean Region – no warming
Finland and Sweden – no warming
East Antarctica – no warming
North Atlantic – no warming
Western North Atlantic – no warming
Brazil – no warming
SE Australia – no warming
Southern South America – no warming
Andes Mountains – no warming
Chile – no warming
“Obviously the warming from global warming isn’t the same everywhere”
No, it certainly isn’t
The ONLY places that have experienced any REAL warming in the satellite era have been those directly affected by El Nino events and Ocean oscillation.
The main sources of so-called “global” warming have been :
a) tampering and manipulation of surface data
b) bad data quality, due to urban heat and airport placements
c) a mismatch between mercury thermometers and modern electronic systems of measurement.
The real fact about the VERY SLIGHT calculated “global average temperature” is that it is still lower than ity has been for MOST of the Holocene
Its only by comparing current temperatures to a period coming out of the COLDEST PERIOD in 10,000 years and having some manic ideology that says “warming is bad” that you can FABRICATE this AGW nonsense
As seb well knows, there is absolutely ZERO PROOF that real temperature changes have been ANYTHING BUT NATURAL
There is ZERO PROOF of any kind of human or CO2 influence on the very slight, but HIGHLY BENEFICIAL warming of our atmosphere or of our oceans.
The key in the chart from ‘Christy and McNider, 2016’ shows that they probably looked at the effect of adjustments.
My hypothesis – what we’re seeing here is the effect of the moonshine-still fires being snuffed out. (0:|
https://cdn.shopify.com/s/files/1/0796/8333/files/Tips_for_Safe_Distilling_-_Making_Moonshine_in_Kentucky_large.jpg?1034196306335152906
Seriously, though, it looks like there may be a ~60 year cycle visible in their data. Could it be an AM0/PDO effect?
http://appinsys.com/globalwarming/SixtyYearCycle.htm
Naaah, must be CO2. //SARC OFF//
“NASA data must be fake”.
NASA GISSTEMP data is. Along with James Hansen, the arch adjuster.
If someone tells me the temperature of something for which he has no data, and no way of acquiring any data, I’m going to assume he’s lying.
https://realclimatescience.com/2017/02/nasa-noaa-climate-data-is-fake-data/
That’s just one of many examples, as you know, B&t.
And then there’s the Congressional testimony…
https://science.house.gov/news/press-releases/former-noaa-scientist-confirms-colleagues-manipulated-climate-records
…another link on the 60 year cycles.
http://clivebest.com/blog/?p=2295
Starts with NCDC, then NOAA, then GISS.
Its a multi-stage “adjustment™” process.
Squashing that embarrassing 1940’s peak where-ever they can find it.
Making sure the temperature keeps climbing, by adjustment.
Reality doesn’t stand a chance.
The FARCE is strong with that crew.
4,500 temperature stations from rural/non-urban areas have been gratuitously removed since the 1970s so as to raise temperatures by attrition.
https://notrickszone.com/wp-content/uploads/2017/02/NOAA-Data-Manipulation-Station-Removal-Small.jpg
Surely must be fake then …
Good thing there is a FAQ for these kind of “arguments”:
https://www.skepticalscience.com/Dropped-stations-introduce-warming-bias-intermediate.htm
But I guess that’s fake too, right? The removed stations causing the warming trend to be smaller than if they were still included (if they’d still report temperatures that is).
roflmao.
Linking to the FARCE and MISINFORMATION that is SkS,
You really have hit the very bottom of the cesspool now, seb.
But you will still keep digging. !!
I thought you were pretending you were “sceptical”, seb
Yet you keep parroting the fallacies of SkS without a single thought that they are basically a low-level, anti-science propaganda misinformation site.
You aren’t even sceptical of CO2 warming of oceans or atmosphere, even though you are TOTALLY UNABLE to produce one single piece of measured scientific evidence.
Being sceptical means you need to dump your brain-hosed AGW meme, and actually start to think for yourself.
But your brain-hosed child-mind is locked onto the AGW pap religion, so its not going to happen, is it. !!
I posted this recently, and have yet to get an answer as to why I need these clowns from “skepticalscience” to tell me what a “denier” is.
http://www.populartechnology.net/2012/03/truth-about-skeptical-science.html
Climate “Science” on Trial; Temperature Records Don’t Support NASA GISS
One of the oddest aspects of climate “science” is that NASA, the organization that put a man on the moon, ignores its state of the art Satellite and balloon data, and instead relies upon archaic terrestrial ground measurements. Part of the NASA climate “science” community actually ignore the infinitely more accurate data from their satellites. The reason … Continue reading
https://co2islife.wordpress.com/2017/03/12/climate-science-on-trial-temperature-records-dont-support-nasa-giss/
Isolating the Contribution of CO2 on Atmospheric Temperature
In any serious scientific experiment, efforts are made to “control” for as many exogenous factors as possible. The whole purpose is to isolate the impact of the independent variable on the dependent variable. ΔWeightloss = ΔCaloric Intake + ΔExercise + error. To minimize the error of the model (maximize explanatory power), variables outside the model (exogenous factors), … Continue reading
https://co2islife.wordpress.com/2018/02/14/isolating-the-contribution-of-co2-on-atmospheric-co2/
Nice compilation.
While I was aware of the closing of the colder stations, I was unaware of their migration South. thx.
Giss and UAH are almost identical:
http://www.woodfortrees.org/plot/gistemp/mean:12/from:1979/plot/uah6/mean:12/offset:0.433
Westpoint is a 100 km north of the Central Park and much farther away from the ocean too. One should think that the climate is a bit different in both locations.
Be a little bit more skeptic about what your hero Dr. Soon is saying. It’s likely nonsense.
That’s not the model. It doesn’t work like that and trying to argue this way is a big straw man …
Instead read: http://www.cgd.ucar.edu/ccr/publications/meehl_additivity.pdf
“Giss and UAH are almost identical:”
More seb utter BS. !!
http://www.woodfortrees.org/plot/gistemp/from:2000/mean:60/offset:-.43/plot/uah6/from:2000/mean:60
Seb, the ZERO PROOF of CO2 warming AGW sympathiser
EMPTY.
Looks a lot like when you compare version 5.6 and 6.0 (the “special” version):
http://www.woodfortrees.org/plot/uah5/from:2000/mean:60/plot/uah6/from:2000/mean:60
Doesn’t it?
Let’s include RSS (version 3 still, I assume) in the mix:
http://www.woodfortrees.org/plot/uah5/from:2000/mean:60/plot/uah6/from:2000/mean:60/plot/rss/from:2000/mean:60/offset:-0.18
Seb still doesn’t comprehend the difference between “corrections” for known scientific reasons.. UAH v6
and “adjustments” from fabricated modelled agenda driven farce.
So sad, so seb. !!
RSS V3.3 also has the two NON-WARMING periods that you are RUNNING, SQUIRMING from producing using GISS.
https://s19.postimg.org/y6om3sbjn/RSS_Before_El_Nino.jpg
https://s19.postimg.org/im6e8dgxf/RSS_pre_2015.png
Now stop being a squirming little worm , seb, and produce those two period for GISS,
PROVE that GISS is nearly identical to UAH and RSS..
Or have the guts to ADMIT that you were either WRONG..
or you were INTENTIONALLY and DECEITFULLY LYING.
“Giss and UAH are almost identical:”
So seb, if GISS and UAH are almost identical,
…that means that GISS must have the same two NON-WARMING periods that UAH has, correct?
You know, those NON-WARMING periods between major El Nino events. 😉
NO WARMING from 1980 – 1997
https://s19.postimg.org/iwoqwlg1f/UAH_before_El_nino.png
NO WARMING from 2001 – 2015
https://s19.postimg.org/b9yx58cxf/UAH_after_El_nino.png
Please post matching periods from GISS showing similar NON-WARMING.
(or do your usual headless-chook style run-and-hide avoidance, accompanied by your usual mindless yapping.)
I have no words for this nonsense … should I provide you with a graph where I wildly draw in lines showing imagined things?
Or should we just look at the entire data and don’t pretend that El Ninos don’t stand apart, same as El Ninas don’t stand apart. Both are just moving around energy. They are not adding or subtracting anything to the heat content, except that a warmer surface during El Nino makes the Earth lose more energy to space … which is – surprise – a cooling effect you can see on OHC charts. El Ninos aren’t causing “step changes” in temperatures that stay higher long after the event.
Should be and don’t pretend that El Ninos
don’tstand apart, same as El Ninas don’t stand apart.Your MANIC EVASION , as predicted, is duly noted BY EVERYONE. 🙂
You are SO PREDICTABLE in producing NOTHING but mindless bluster.
Zero warming between El Ninos, seb
In both the scientifically corrected UAH6.0 and in the untampered RSSv3.3
Facts are an anathema to you, aren’t they little brain-hosed child-mind.
It DESTROYS the AGW farce., and you have ZERO COUNTER, as always.
Anyone who isn’t WILFULLY BLIND or TOTALLY BRAIN-HOSED can see the 1998 El Nino step and the 2015-2017 El Nino transient.
the two “events” that AGW sympathisers HAVE to rely upon to show warming in the satellite data.
They have to rely on them because…
There is no warming apart from those two major El Ninos
AndyG55. Knowing Seb, it will be the usual fact-free verbal diarrhoea and some wilful misdirection.
As predicted. 🙂
It’s all down to the newly discovered “Warming Hole” that makes things colder….
https://www.sciencedaily.com/releases/2018/02/180213183555.htm
“Overwhelming scientific evidence has demonstrated that our planet is getting warmer due to climate change, yet parts of the eastern US are actually getting cooler.
According to a new study, the location of this anomaly, known as the ‘US warming hole,’ is a moving target. During the winter and spring, the US warming hole sits over the Southeast, as the polar vortex allows arctic air to plunge into the region, resulting in persistently cooler temperatures.”
Whether it gets hotter or colder anywhere or everywhere and whether or not it is natural or man made, in the great scheme of things, it will not matter one iota.
Man adapts to the environment.
Correct. And considering global sea levels have risen just 3.1 inches in the last 56 years, Antarctica and Greenland ice melt only contributed 0.6 of an inch to sea levels since 1958, and that more land area is ABOVE sea level today than there was in the mid-1980s, the most significant threat from “global” warming – sea water engulfing our shorelines – is not the threat it’s been made out to be by the alarmists.
A warmer world is better for the biosphere. Crop production is better in a warm, CO2-enriched climate. A greener world is better than a browning world, and it’s much greener today than in the 1980s. Landfalling hurricanes are both less frequent and less intense than in the past. We have less extreme weather with warming than with cooling. There are fewer droughts today than there were during the Little Ice Age. We’ve only had one confirmed species extinction since 2000…a mollusc. (There were 800 recorded extinctions between 1500 and 2000…nearly all of them during the cold Little Ice Age.) In sum, a warming world is good. A cooling world is bad. Each article like this is a sad reminder that the climate’s “good ol’ days” are likely behind us.
[…] Eck, February 15, 2018 in K. Richard […]
[…] writer Kenneth Richard provided in a comment an abbreviated list of locations across the globe that have not seen any warming over the past 60 […]
[…] Read more at notrickszone.com […]
[…] writer Kenneth Richard provided in a comment an abbreviated list of locations across the globe that have not seen any warming over the past 60 […]