Awhile back I sent an e-mail to the Danish Meteorological Institute (DMI), who we all know provide us with the fascinating 80°+N Arctic temperature charts.
With the Arctic being a crucial indicator of global warming, so we are told, I thought surely they must also have a plot of the annual 80°+N mean temperatures. Astonishingly they wrote back and said they don’t – but sent me the data and said I was welcome to have a go at it.
Ed Caryl volunteered to crunch the numbers and to do a little extra digging on the side. Here’s what he came up with.
====================================================
+80°North
by Ed Caryl
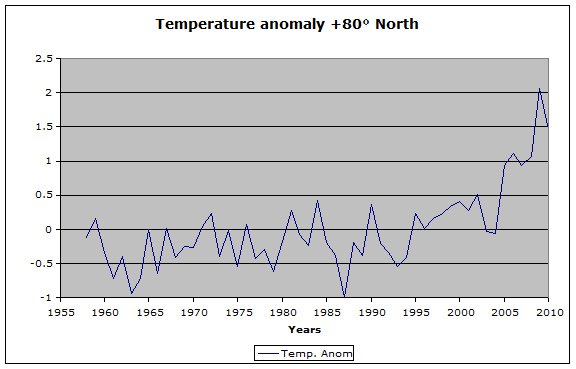
Since 1958 the Danish Meteorological Institute (DMI) has been reporting temperatures above 80° North, the North pole and environs, using a gridded model, but basing the data on all available temperature measurements in the area. Pierre obtained all the daily data since 1958 from DMI, and asked me to reduce it to an annual mean temperature plot. Figure 1 is the result.
Figure 1: The annual temperature anomaly for the Arctic above 80° north. From DMI data.
One observes that since 1958 the annual average mean temperature has varied across a range 1.5° C wide, until 2005, when it warmed by just over 2°C above the long term average. One then asks, why?

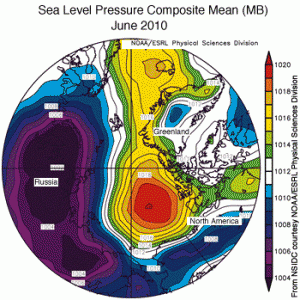
Figure 2, the Dipole Anomaly in June 2010. —Credit: National Snow and Ice Data Center courtesy NOAA/ESRL Physical Sciences Division
The first suspect named by the warmists is a phenomenon called the Arctic Dipole Anomaly. The dipole is high pressure over the Arctic regions on North America, the Beaufort Sea, and low pressure over the Asian Arctic, the Kara Sea. This causes winds from the south along the Siberian coast, pushing ice to the north, and north winds in the Fram Strait, pushing ice out of the Arctic and into North Atlantic. See Figure 2 for the conditions in June 2010. The reduced ice cover has resulted in higher annual temperatures. Many writers echo a claim that this pattern is new, and not seen prior to 1990, blaming it on “climate change”.
The Dipole Anomaly was only noticed this last decade, but I suspect that the phenomenon has been happening all along as a part of the regular AMO and NAO cycles, it is just that there was not sufficient instrumentation in the high arctic to bring it to notice, especially during previous warm periods in the 1920s and 30s. But there were measurements made at a few locations, and many ship logs, and written discussions of these earlier times. But those have been forgotten or ignored by present-day researchers. The failure to recognize and investigate the cyclic nature of nature, especially the interactions of cycles tens and hundreds of years long, has been the failure that has spawned the modern hysteria about “climate change.” (Please excuse the digression.)
The warmest year for most Arctic stations is 1938. Figure 3 is from A Light In Siberia, showing the average of isolated stations in the high Arctic rim, most of them on the coast of Siberia. These temperature records just catch the edge of the 1920 temperature rise.
Figure 3: The average temperature of 9 high Arctic weather stations.
Figure 3 also shows a rapid warming from 1935 to 1938, as well as the recent warming from 2004 to 2007, just like the DMI measurements. The same phenomenon is likely the cause of the temperature rises then and now. This reference was found here:
See: Overland, J.E. (2005) and Muyin Wang; ‘The third Arctic climate pattern: 1930s and early 2000s’, when saying: “The period from 1928–1935 also had a dipole structure in SLP, which contributed to the interdecadal arctic-wide warm temperature anomalies in the first half of the 20th century.”
So much for the Arctic Dipole being new.
“Meridional flows” from the north at Spitzbergen (Svalbard) are also mentioned in that reference. These are a result of an Arctic Dipole. They also write of an average annual increase of shipping access to the island from 94 days to 157 days over the period from 1918 to 1939. The year with the most southern sea ice was 1917, with no access to Spitsbergen’s coast. But there was a great warming in the interval from 1917 to 1922. The following was published in the journal Monthly Weather Review October 10, 1922 (emphasis added).
Dr. Hoel, who has just returned, reports the location of hitherto unknown coal deposits on the eastern shores of Advent Bay – deposits of vast extent and superior quality……The oceanographic observations have, however, been even more interesting. Ice conditions were exceptional. In fact, so little ice has never before been noted. The expedition all but established a record, sailing as far north as 81o29′ in ice-free water. This is the farthest north ever reached with modern oceanographic apparatus…..
“In connection with Dr. Hoel’s report, it is of interest to note the unusually warm summer in Arctic Norway and the observations of Capt. Martin Ingebrigtsen, who has sailed the eastern Arctic for 54 years past. He says that he first noted warmer conditions in 1918, that since that time it has steadily gotten warmer, and that to-day the Arctic of that region is not recognizable as the same region of 1868 to 1917.
“Many old landmarks are so changed as to be unrecognisable. Where formerly great masses of ice were found, there are now often moraines, accumulations of earth and stones. At many points where glaciers formerly extended far into the sea they have entirely disappeared.
“The change in temperature, says Captain Ingebrigtsen, has also brought about great change in the flora and fauna of the Arctic. This summer he sought for white fish in Spitsbergen waters. Formerly great shoals of them were found there. This year he saw none, although he visited all the old fishing grounds.
“There were few seal in Spitzbergen waters this year, the catch being far under the average. This, however, did not surprise the captain. He pointed out that formerly the waters about Spitzbergen held an even summer temperature of about 3o Celsius; this year recorded temperatures up to 15o, and last winter the ocean did not freeze over even on the north coast of Spitsbergen.”
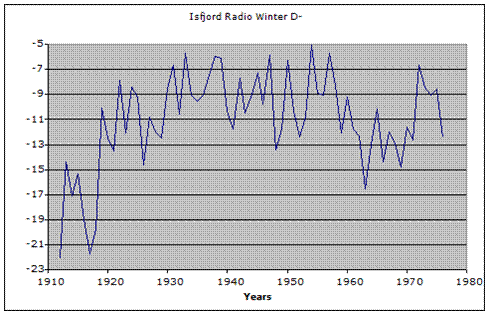
Here is a chart (Figure 4) of the winter warming at Spitsbergen. The chart begins at 1912, so the full extent of the warming is shown. There was over 10° C of warming in winter from the 1910’s to the 1930’s.
Figure 4: Winter temperature (December, January, and February) at Isfjord Radio weather station, Svalbard/Spitsbergen. Data from GISS.
Figure 5: +80° North Winter temperatures (in degrees Kelvin, as reported by DMI). This is also from DMI data. The bold line is the average of the monthly figures, and is charted in the December year. One more year is shown over Figure 1 because we have full data from last winter through February.
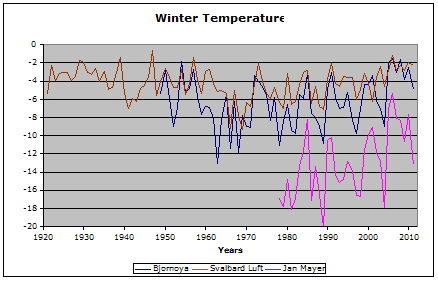
Any warming in the far north is mostly seen in the winter. Note that the winter warming in Figure 5 is more than twice the annual warming seen in Figure 1 in the same period. But also note that the current warming at +80° North is less than half the warming that was seen at Spitsbergen (Figure 4) in the early 1900’s. Figure 6 shows the modern warming at Jan Mayen, Svalbard airport and Bear Island. The modern and the 70’s warming is not nearly as dramatic as that in the early 20th Century, and that happened without the assistance of CO2.
Figure 6: Winter temperatures at Jan Mayen, Bjornoya (Bear Island) and Svalbard airport.
Figure 7. The winter AMO index, 1856 to the present. The bold trace is the average of the monthly data.
So what caused the warming, then and now? One answer, found here (Sergei Rodionov, Climate Logic), is that a shift to the east in the position of the Icelandic low, into Siberia, becoming the “Arctic dipole,” is responsible. This along with a high NAO index, a rising AMO, and ocean currents, makes the Barents Sea warmer than normal. Will this continue? S. Rodionov predicts that the warming will end in 2012, and a cooling trend will last until 2023. The short-term trend is already down. In Figure 5, the warmest winter was 2008. In Svalbard, Jan Mayen, and Bear Island, the downturn began earlier, in 2006. See Figure 6. I strongly recommend reading Rodionov’s article, which goes into great detail.
In the 1920’s the AMO was rising sharply, (see Figure 7) encouraging a dramatic temperature rise in the high Arctic, while currently the AMO is near or past it’s peak, stopping the temperature rise. The 1970’s cooling and warming tracked the AMO. This is all cycles. From the sun to the oceans, some cycles are long, like the Dansgaard/Oeschger
and Bond events, some are irregular like the ENSO cycles, some are tens of years long and regular, like the AMO cycle, some are short and regular like the sun. The sun also has
several long cycles. When these cycles get “in phase,” all encouraging heating or cooling at once, strange things can happen. (For more on Bond Events, google Bond Events Chiefio. He has some very interesting things to say.)
Ed Caryl


Excellent Ed!
Dr. Hoel:
“Ice conditions were exceptional. In fact, so little ice has never before been noted. The expedition all but established a record, sailing as far north as 81o29′ in ice-free water. This is the farthest north ever reached with modern oceanographic apparatus.”
LOL – you just can’t make this stuff up.
Extremely interesting, thanks Ed! Funny, these Danes – they have the best temperature record of the arctic but they don’t bother to graph it…
The coincidence of the arctic’s warming in the 1930ies with the warm CONUS temperatures of the time indicates to me that the warmth was more than regional back then, and that CO2 does practically nothing to global temperatures. Wonder when the last warmists will finally give up.
My car has winter tyres since yesterday. I’m expecting the first arctic blast end of Nov in Germany. That would be earlier than usual but the development of the Southern Ocean Index and the early snow in New England make me wary.
Stefan Rahmstorf goes on constructing examples that show that more extreme weather means global warming even though there is a zero trend over the last 15 years (which he kinda implicitly, sorta, admits).
http://www.realclimate.org/index.php/archives/2011/11/on-record-breaking-extremes/
His behaviour is very similar to the one discussed here
http://en.wikipedia.org/wiki/When_Prophecy_Fails
Interesting comparison with Festinger’s study, especially where we read about the events at 4.00 and 4.45 A.M., the rescue by automatic writing, comparable with the surprising discovery that AGW causes severe winters. Note that the AGW scientists moved from means into variances. Statistical tests of the latter require about ten times as much observations as the former. It may take hundreds of years for a decision that the climate became more extreme or not. Herewith it is guaranteed that the believers can maintain AGW till their last breath.
Very interesting, Ed. This piece deserves wide distribution.
You say that the AMO is near or past its warming peak, but the data shown in Judith Curry’s presentation in Boulder, Colorado in late August predicts the AMO to be in its warm phase for at least another decade (slides 8 and 11). Could you explain the difference?
http://www.esrl.noaa.gov/psd/events/2011/pdf/water-cycle-presentations/Curry_noaaWaterClimate.pdf
Judith’s slide 8 and my figure both show the AMO peak in 2006, declining since then. The AMO cycle is about 65 years long, and roughly sinesoidal. This shape predicts AMO to go cool between 2020 and 2025. But IMHO it is the slope of that index that is important, and it is declining. Another But, “Prediction is very difficult, especially if it’s about the future.” Niels Bohr.
ED
Good article. I looked at the climate trend in Canadian Arctic as well in my previous post on this web page here [https://notrickszone.com/2011/03/11/canadian-winters-not-getting-warmer-more-cold-all-around/. ]
If you look at the third last graph at the end of my article , you will note that the Canadian Arctic temperature departures started to rise more significantly in 2003, 2006,2007 and again 2010. It was the only region in Canada to show winter warming since 1998 other than the Atlantic Coast provinces .[ warm AMO still] All other Canadian region’s winter temperature departures have shown declines like in the United States
I have always felt that AMO has peaked but will not go negative or cool until about 2015. The heat content of the North Atlantic is dropping faster than that of other Oceans as Bob Tisdale’s graphs have shown.
I don’t much trust the northern Canadian surface stations. There is too much heating oil and snowmobile traffic. At 40 below, it doesn’t take much heat to throw off the measurements.
I should add that Ed is talking about +80N. Much of the data that I analyzed is further south but some area cross into +80N.The Canadian Arctic Fiords and Mountains are the areas that come close to the regions that Ed talks about. Here are the winter temperature departures [C] for this region by year starting in 1998 . Data is from Environment Canada records .
-0.7 [1998]
0.4 [1999]
-1.3 [2000]
0.5 [2001]
0.1 [2002
3 [2003]
1.9 [2004]
0.3 [2005]
1.6 [2006]
3 [2007]
-0.1 [2008]
1.5 [2009]
5.3 [2010]
5.3 [2011]
Durban is nearing, Mojib Latif crawls out of his institute and warns of a “super warm time” with temps of up to 50 deg C in Germany. Wants carbon “tax” on products from China (ahem, that would be an import tariff, not a tax.)
http://www.bild.de/news/inland/hitzewelle/hitze-rekorde-bis-50-grad-20843760.bild.html
Dirk, in the current political jargon it IS a tax since that the definition of ‘tax’ is when the state gets to rake in money – always a good thing, everybody is in favor of it (except liberals in the classic sense of that word, à la Hume, Smith or Bastiat, i.e. either misguided or evil – a telltale sign of such unhelpful people of the demand to lower taxes: nasty folks who WANT the poor to get poorer, let’s scare them off to America, where they can support the Tea Party…); if it’s levied on imports, that’s even better, since people who unjustly get rich by selling stuff to us get then deserved robbed too.
DirkH
It is easy for scientists now a day to get up prior to the climate conferences like the Durban meeting and make pure alarmist type of climate predictions 90 -100 year ahead and yet they and their fellow scientists have been unable to make credible forecats for the next season,next year or the next decade as we have already seen with the IPPC predictions . They will not be around to be held accountable for their forcast 100 years from now so any forecast is game for them in order to get some more free money from the governments.. I think mother nature has other plans which will unravel this winter and for decades to come . We will have ample opportunity to remind them of their recent unsupportable “chicken little/sky is falling” predictions as this decade evolves
What bothers me is
a) that I get to pay the wages of these pseudoscientists
b) that the lickspittles in the German media blindly repeat the pseudoscience drivel.
Don’t call them scientists. That gives science a bad name.